Amazon Web Services (AWS) Statistics: Market Share & Competition Report 2026
AWS grew 37% in Q2 2026. Its share is 28% of cloud spend, 37.7% of IaaS and 55.3% of hyperscaler traffic in Q3 2026, down from 60.8% a year earlier.
Published •Updated •Data through September 2026•52 min read

Amazon Web Services generated $42.23 billion in Q2 2026, up 37% year over year. That is its fastest growth since early 2022, and roughly three times the trough it hit in mid-2023. Yet AWS's market share reads 28%, 37.7%, 51.3% or 55.6% depending on which research firm you ask, because each one measures a different market.
Report scope: worldwide, 2013 to Q2 2026 for financials and Q3 2026 for traffic. Primary sources are Amazon, Gartner, Canalys, Flexera, Wikibon, Synergy Research Group, Microsoft, Alphabet, PwC, Check Point and ISACA, plus Cloudflare Radar and TechnologyChecker.io's own detection data. Methodology, limitations, four corrections to the source material plus one to our own, and the full source table are at the end.
Key findings, newest first: the Q3 2026 update (October 2026), then the original report
- Q3 2026 update: AWS received 55.32% of requests to the four hyperscaler origins in Q3 2026, down from 60.79% in Q3 2025, as Microsoft Azure rose to 16.79% (Cloudflare Radar; September provisional). AWS stayed fastest to first byte at 83.3 ms for the quarter.
- Q3 2026 update: TechnologyChecker detects AWS on 1,026,685 live business domains as of the September 2026 crawl, and its domains over-index most on Software Development, at 3.1 times the web average.
- AWS net sales reached $42.23 billion in Q2 2026, up 37% year over year excluding foreign-exchange effects, taking trailing-twelve-month revenue to $148.4 billion (Amazon).
- Growth has climbed for eight consecutive quarters from a trough near 13% in 2023, the strongest rate AWS has posted since Q1 2022.
- Full-year 2025 revenue was $128.73 billion, up 19.7%, and AWS added $21.17 billion in a single year, more than its entire 2017 revenue.
- AWS is 17.95% of Amazon's $717 billion in 2025 consolidated net sales. It is also roughly 57% of its operating income, at a 37.7% Q1 2026 margin (Amazon).
- Q1 2026 revenue was $37.59 billion, up 28%, then Q2 beat it at 37%. Amazon attributes the acceleration to AI inference, reporting more tokens through Bedrock in Q1 2026 than in all prior years combined.
- AWS's share depends entirely on the denominator: 28% of cloud infrastructure spend (Synergy, Q2 2026), 37.7% of public cloud IaaS (Gartner, 2024), 51.3% among the four hyperscalers only (Wikibon, 2024) and 55.55% of hyperscaler origin traffic (Cloudflare Radar, August 2026). All four are correct. ⚠️ The traffic figure is superseded by the Q3 2026 update: 55.32% for Q3 2026. Preserved as originally published.
- On Canalys's quarterly series AWS held between roughly 30% and 33% in every quarter from Q4 2017 to Q4 2024, while Azure rose from 13.7% to 20%. Azure's gains came from the long tail, not from AWS.
- Enterprise adoption is a dead heat: 79% of enterprises used AWS in 2025 against 77% for Azure, and Flexera's 2026 report puts AWS at 83% against Azure's 79% for active workloads. AWS's lead is depth: across all surveyed organisations, 53% run significant workloads on AWS against 46% for Azure and 19% for Google Cloud (Flexera).
- AWS converts enterprise contact into production workloads at 60%, against 50% for Azure and 26% for Google Cloud.
- In our own crawl we detect AWS on 936,363 domains (⚠️ August 2026; 1,026,685 as of the September 2026 crawl), but 80.4% of the firmographically resolved base has 50 or fewer employees. The public web sees a business almost inverse to the one the enterprise surveys describe (TechnologyChecker.io).
AWS at a glance
| Metric | Latest figure | Period | Source |
|---|---|---|---|
| Quarterly net sales | $42.23B | Q2 2026 | Amazon |
| Year-over-year growth | +37% (ex-FX) | Q2 2026 | Amazon |
| Trailing-twelve-month revenue | $148.4B | Q2 2026 | Amazon |
| Full-year revenue | $128.73B (+19.7%) | 2025 | Amazon |
| Operating margin | 37.7% | Q1 2026 | Amazon |
| Share of Amazon net sales | 17.95% | 2025 | Amazon |
| Cloud infrastructure share | 28% | Q2 2026 | Synergy Research Group |
| Public cloud IaaS share | 37.7% | 2024 | Gartner |
| Enterprise adoption | 79% | 2025 | Flexera |
| Running significant workloads | 53% | Winter 2024 | Flexera (all respondents) |
| Hyperscaler origin request share | 55.32% | Q3 2026 | Cloudflare Radar |
| Domains we detect AWS on | 1,026,685 | Sep 2026 | TechnologyChecker.io |

Updated October 1, 2026 with Q3 2026 traffic data from Cloudflare Radar (July to September 2026; September is provisional) and our September 2026 crawl. Financial figures still run to Q2 2026, the latest Amazon and Synergy have published. Earlier versions of this report are listed under "What changed in this report" near the end.
What's the market share of AWS?
AWS held 28% of global cloud infrastructure spending in Q2 2026, against 20% for Microsoft and 15% for Google, according to Synergy Research Group's 30 July release, the latest primary figure. On traffic, AWS received 55.32% of the requests Cloudflare sent to the four hyperscaler origins in Q3 2026, down from 60.79% a year earlier. Both are correct, because they measure different markets.
| Measure | Source | Period | AWS share |
|---|---|---|---|
| Cloud infrastructure spending, all providers | Synergy Research Group | Q2 2026 | 28% |
| Public cloud IaaS only | Gartner | 2024 | 37.7% |
| IaaS + PaaS, four hyperscalers only | Wikibon | 2024 | 51.3% |
| Requests to AWS, Azure, Google Cloud and Oracle origins | Cloudflare Radar | Q3 2026 | 55.32% |
Sources: Synergy Research Group (30 July 2026), Gartner and Wikibon via the sources listed in the methodology, Cloudflare Radar radar/origins/summary/origin?metric=requests, Q3 2026, pulled 2026-10-01.
The denominator section further down explains why the spread is this wide and which figure to quote for which question.
Q3 2026 analysis: AWS's share of cloud traffic kept falling
| Metric | Q3 2025 | Q2 2026 | Q3 2026 | YoY |
|---|---|---|---|---|
| AWS share of hyperscaler origin requests | 60.79% | 58.41% | 55.32% | −5.47 pt |
| Microsoft Azure share | 11.75% | 15.08% | 16.79% | +5.04 pt |
| Google Cloud share | 26.73% | 25.49% | 26.94% | +0.21 pt |
| AWS time to first byte | 98.8 ms | 89.9 ms | 83.3 ms | −15.4 ms |
| AWS TCP handshake | 51.5 ms | 53.7 ms | 59.5 ms | +8.0 ms |
| AWS connection failures ÷ requests | 0.62 | 0.65 | 1.05 | +0.43 |
| us-east-1 share of AWS requests | 39.51% | 43.60% | 44.15% | +4.64 pt |
Source: Cloudflare Radar, radar/origins/summary/origin (metrics requests, connection_failures, response_header_receive_duration, tcp_handshake_duration) and radar/origins/summary/region?origin=amazon&metric=requests, Q3 2025 / Q2 2026 / Q3 2026, pulled 2026-10-01. Shares are PERCENTAGE of requests; durations are RAW_VALUES medians in milliseconds.
The August version of this report called a 12-week slide "corroboration rather than proof". A full year of quarters now points the same way: AWS's share of hyperscaler origin requests is 5.47 points lower than in Q3 2025, and almost all of it went to Azure. That matches the direction of every spending series in this report, measured by a mechanism that has nothing to do with spending. I still would not call it a revenue share loss. Synergy had AWS flat at 28% across Q1 and Q2 2026, and requests are cheap while committed contracts are not.
Two quarter numbers went the other way. AWS stayed far the fastest to first byte, 44.0 ms ahead of the next provider, but its failure ratio rose to 1.05, so for the first time in these windows AWS failed in proportion to its traffic rather than below it. September alone was rougher: first byte slowed to 99.4 ms, its slowest month of 2026, and its failure ratio was 1.27. Our cloud provider traffic share report breaks the September move down week by week.
| Month (2026) | AWS | Microsoft Azure | Google Cloud | Oracle Cloud | AWS first byte |
|---|---|---|---|---|---|
| January | 60.17% | 13.56% | 25.51% | 0.76% | 69.1 ms |
| February | 59.67% | 14.06% | 25.50% | 0.77% | 77.4 ms |
| March | 59.43% | 14.12% | 25.66% | 0.79% | 91.9 ms |
| April | 58.41% | 14.66% | 26.02% | 0.91% | 86.9 ms |
| May | 58.50% | 15.36% | 25.05% | 1.08% | 89.1 ms |
| June | 58.26% | 15.25% | 25.43% | 1.07% | 93.3 ms |
| July | 56.38% | 15.81% | 26.77% | 1.04% | 76.1 ms |
| August | 55.35% | 17.05% | 26.66% | 0.95% | 74.6 ms |
| September (provisional) | 54.38% | 17.40% | 27.33% | 0.89% | 99.4 ms |
| January to September | −5.79 pt | +3.84 pt | +1.82 pt | +0.13 pt | +30.2 ms |
Source: Cloudflare Radar, radar/origins/summary/origin, metrics requests (share of requests to the four hyperscaler origins) and response_header_receive_duration, calendar months, pulled 2026-10-01.
Among those domains that match a company record, Software Development is 8.02% of AWS's base, 3.1 times its share of the web, followed by Technology, Information and Internet at 2.2 times and Financial Services at 2.0 times. Counts are not a like-for-like series over time: the set of domains we crawl turns over every month, with dead sites dropping out and newly discovered ones added, and our detection signals widen over time.
AWS growth has reaccelerated to a rate it last posted in 2022
The single most important number in this report is not revenue. It is the second derivative.
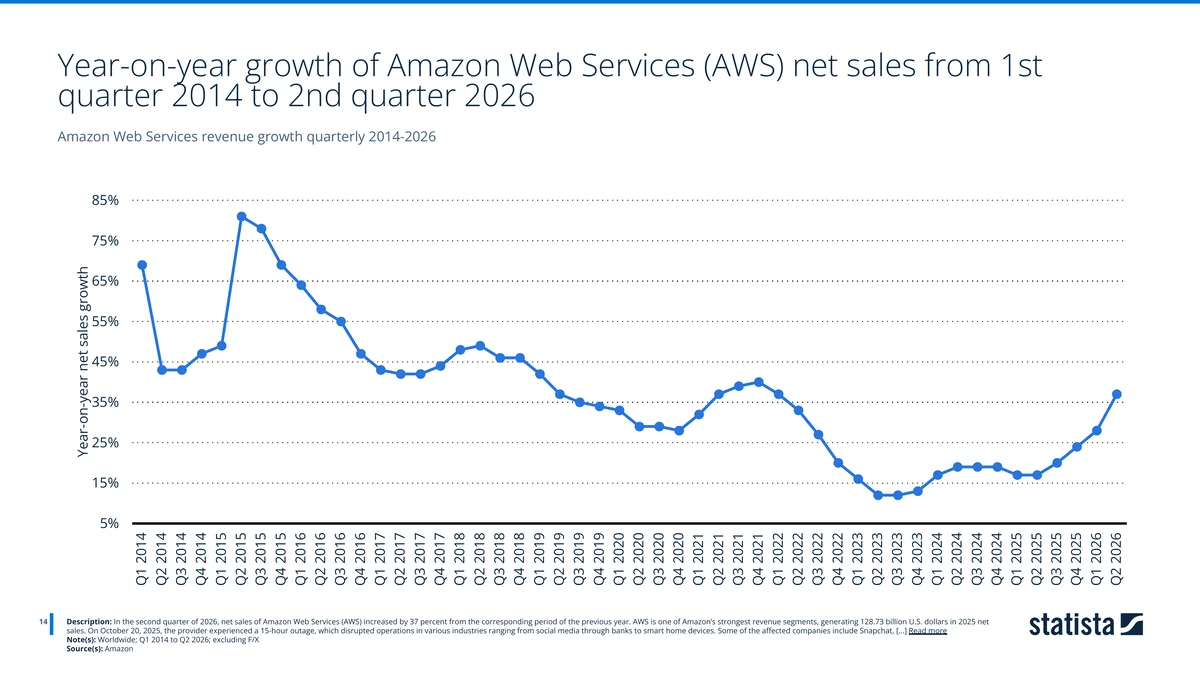
AWS's year-on-year growth rate spent a decade in structural decline. It peaked above 80% in 2015, drifted through the forties and thirties across 2016 to 2019, and settled near 30% before the pandemic. Then it fell off a cliff. Between Q1 2022 and Q2 2023 the rate collapsed from roughly 37% to about 13% as enterprises optimised committed spend, and it stayed near that floor for three quarters.
It has risen in every quarter since. By Q2 2026 AWS grew 37% year over year excluding foreign-exchange effects, a rate it had not reached since Q1 2022, achieved on a revenue base more than twice as large. Tripling a growth rate off a base that has doubled is unusual.

The two most recent quarters make the shape explicit. AWS reported $37.59 billion in Q1 2026, up 28% on Q1 2025's $29.3 billion (described at the time as its fastest growth in fifteen quarters), and then beat that again with 37% in Q2. The driver Amazon points to is AI inference: it reported that more tokens flowed through Amazon Bedrock in Q1 2026 than in all prior years combined. Synergy Research Group's John Dinsdale described AI demand as having "lit a fire under the cloud market" when the wider market grew 43% in Q2 2026, its fastest in eight years.
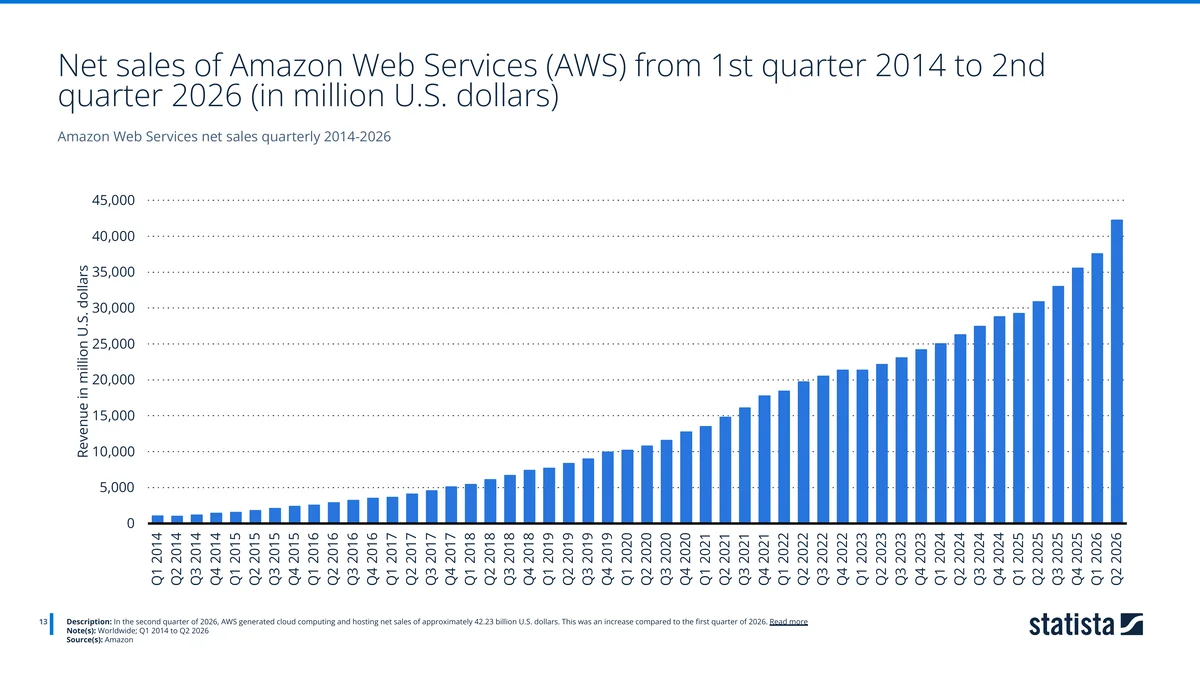
The absolute series shows why the percentage matters so much at this scale. AWS's trailing-twelve-month net sales reached $148.4 billion at Q2 2026. A single point of growth on that base is worth roughly $1.5 billion a year, which is more than Google Cloud's entire 2016 revenue.
The annual record
AWS Revenue 2013-2025: $3.1B to $128.7B, a 41x Increase
Amazon Web Services grew from $3.11 billion in annual revenue in 2013 to $128.73 billion in 2025, a 41.4x increase. Growth slowed sharply to 13.3% in 2023 before recovering to 18.5% in 2024 and 19.7% in 2025. The $21.17 billion AWS added in 2025 is the largest single-year increase in the segment's history.
Source: Amazon · 2013-2025
| Year | AWS annual net sales (USD billions) |
|---|---|
| 2013 | $3.11B |
| 2014 | $4.64B |
| 2015 | $7.88B |
| 2016 | $12.22B |
| 2017 | $17.46B |
| 2018 | $25.66B |
| 2019 | $35.03B |
| 2020 | $45.37B |
| 2021 | $62.2B |
| 2022 | $80.1B |
| 2023 | $90.76B |
| 2024 | $107.56B |
| 2025 | $128.73B |
- 41.4x revenue growth between 2013 and 2025
- AWS added $21.17 billion in 2025, its largest single-year increase ever
- 2023 was the only year absolute growth went backwards, adding $10.66B — less than 2020
- AWS is 17.95% of Amazon's $717 billion in 2025 consolidated net sales
| Year | AWS revenue | YoY growth | Added vs prior year |
|---|---|---|---|
| 2013 | $3.11B | — | — |
| 2014 | $4.64B | +49.4% | $1.54B |
| 2015 | $7.88B | +69.7% | $3.24B |
| 2016 | $12.22B | +55.1% | $4.34B |
| 2017 | $17.46B | +42.9% | $5.24B |
| 2018 | $25.66B | +46.9% | $8.20B |
| 2019 | $35.03B | +36.5% | $9.37B |
| 2020 | $45.37B | +29.5% | $10.34B |
| 2021 | $62.20B | +37.1% | $16.83B |
| 2022 | $80.10B | +28.8% | $17.89B |
| 2023 | $90.76B | +13.3% | $10.66B |
| 2024 | $107.56B | +18.5% | $16.80B |
| 2025 | $128.73B | +19.7% | $21.17B |
Source: Amazon. Worldwide, 2013–2025.
Read the right-hand column rather than the middle one. AWS's percentage growth in 2025 (19.7%) was barely half its 2018 rate (46.9%), but the dollars it added in 2025, $21.17 billion, exceeded its entire 2017 revenue of $17.46 billion and every year before it. The business grew 41.4× between 2013 and 2025.
The 2023 line is the one worth remembering. AWS added $10.66 billion that year, less than it added in 2020. That is the only year in the segment's history where absolute growth went backwards, and it is the anomaly the 2026 reacceleration is measured against.
AWS inside Amazon
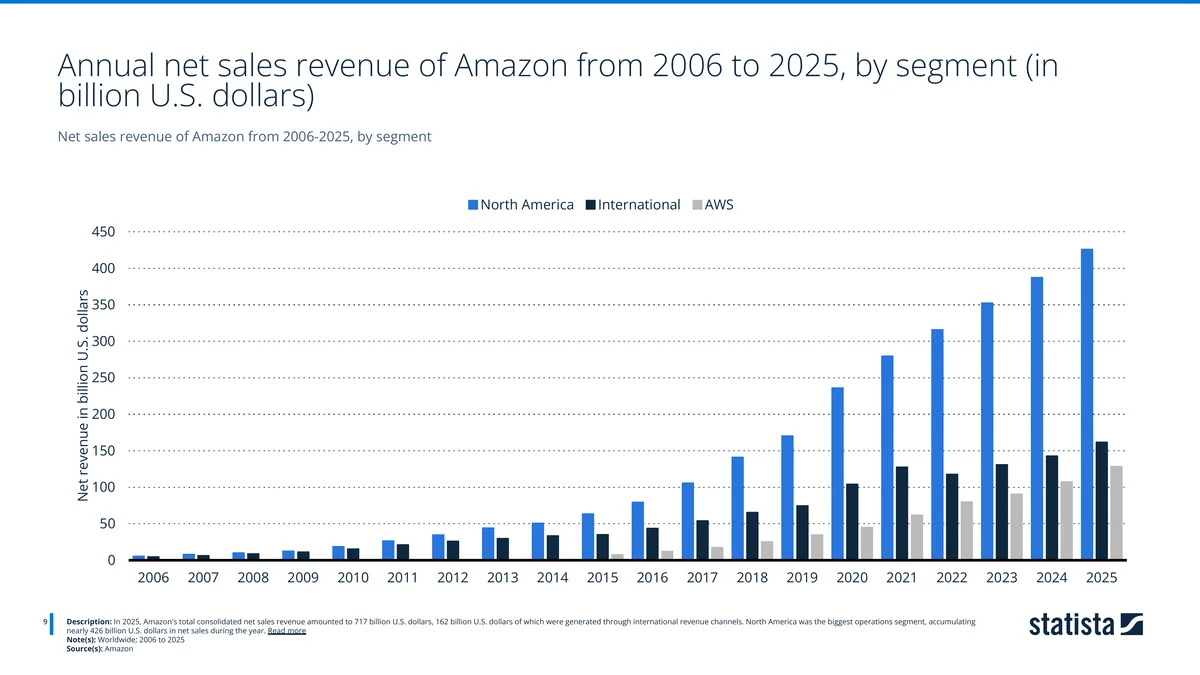
Amazon's total consolidated net sales reached $717 billion in 2025: roughly $426 billion from North America, $162 billion international, and $128.73 billion from AWS, or 17.95% of the company.
| Product group | 2015 | 2020 | 2025 |
|---|---|---|---|
| Online stores | $76.86B | $197.35B | $269.29B |
| Retail third-party seller services | $16.09B | $80.46B | $172.16B |
| AWS | $7.88B | $45.37B | $128.73B |
| Subscription services | $4.47B | $25.21B | $49.62B |
| Physical stores | — | $16.23B | $22.56B |
Source: Amazon. Worldwide, 2015–2025. Groups shown do not sum to total company revenue; advertising and other segments are excluded from this chart.
AWS is a fifth of the revenue and most of the profit
Revenue share understates what AWS is to Amazon. In Q1 2026 the segment reported $14.2 billion of operating income on $37.59 billion of revenue, a 37.7% operating margin, against low single digits in Amazon's retail businesses. Across full-year 2025, AWS reported $45.6 billion of operating income against Amazon's $80 billion, so the segment produced roughly 57% of the company's profit on 17.95% of its sales.
That ratio is the reason AWS's growth rate moves Amazon's share price more than its retail results do, and it is why the reacceleration above matters beyond the cloud market. These profitability figures come from Amazon's reported quarterly results rather than from the dossier behind this report, which carries no margin data.
AWS overtook subscription services in 2015 and third-party seller services has since pulled away from it, but the ordering is less interesting than the trajectory: AWS multiplied 16.3× across the decade while online stores multiplied 3.5×. Amazon reports AWS as an infrastructure segment only, which matters for the comparisons in the next section — Microsoft's commercial cloud and Alphabet's Google Cloud segment both bundle software subscriptions that AWS's number does not include.
What "AWS market share" actually means
Most AWS statistics articles go wrong right here, and the fix costs one clause.
Five credible research organisations measure AWS's position, and our own crawl adds a sixth. They publish numbers between 28% and 55.6% for essentially the same period. None of them is wrong. They are measuring different markets.
| Measure | Source | Period | AWS share | What is in the denominator |
|---|---|---|---|---|
| Cloud infrastructure services | Canalys | Q4 2024 | 33% | All providers, all cloud infrastructure spend |
| Cloud infrastructure services | Synergy Research Group | Q2 2026 | 28% | All providers, all cloud infrastructure spend |
| Public cloud IaaS | Gartner | 2024 | 37.7% | IaaS only — no PaaS, no SaaS |
| IaaS + PaaS hyperscalers | Wikibon | 2024 | 51.3% | AWS, Azure, GCP and Alibaba only |
| PaaS category, detected domains | TechnologyChecker.io | Aug 2026 | 39.98% | Domains where we detect each platform |
| Hyperscaler origin requests | Cloudflare Radar | Aug 2026 | 55.55% | Traffic to AWS, Azure, GCP and Oracle origins |
| Hyperscaler origin requests | Cloudflare Radar | Q3 2026 | 55.32% | Same denominator, full quarter (October 2026 update) |

The spread between the smallest and largest figure is 27.5 percentage points. Quoting any one of them without its denominator is how "AWS has half the cloud market" and "AWS has under a third of the cloud market" both circulate as facts in the same week.
AWS Market Share Is 28% or 55.6% Depending on the Denominator
Credible measurements of AWS's market share range from 28% to 55.55% for essentially the same period. None is wrong; each measures a different market. Synergy and Canalys measure all cloud infrastructure spend, Gartner measures public cloud IaaS only, Wikibon counts only the four hyperscalers, Cloudflare Radar measures origin traffic rather than spending, and TechnologyChecker.io measures detected domains in the PaaS category. Quoting any one figure without naming its denominator hides a definitional disagreement rather than resolving it.
Source: Synergy Research Group; Canalys; Gartner; Wikibon; Cloudflare Radar; TechnologyChecker.io · 2024-2026
| What the denominator counts | AWS market share (%) |
|---|---|
| All cloud infrastructure (Synergy, Q2 2026) | 28% |
| All cloud infrastructure (Canalys, Q4 2024) | 33% |
| Public cloud IaaS only (Gartner, 2024) | 37.7% |
| PaaS domains detected (TechnologyChecker.io, 2026) | 39.98% |
| Four hyperscalers only (Wikibon, 2024) | 51.3% |
| Hyperscaler origin traffic (Cloudflare Radar, 2026) | 55.55% |
- A 27.5 point spread for the same company in adjacent periods
- The direction disagrees too: flat on Canalys since 2017, down 14.1 points on Gartner
- The narrower the denominator, the larger AWS looks
- Traffic share (55.55%) runs well above spending share (28%)
⚠️ The traffic share in this takeaway is the August 2026 reading, preserved as originally published. Q3 2026 reads 55.32%.
The direction differs too, which matters more.
Canalys: seven years of remarkable flatness
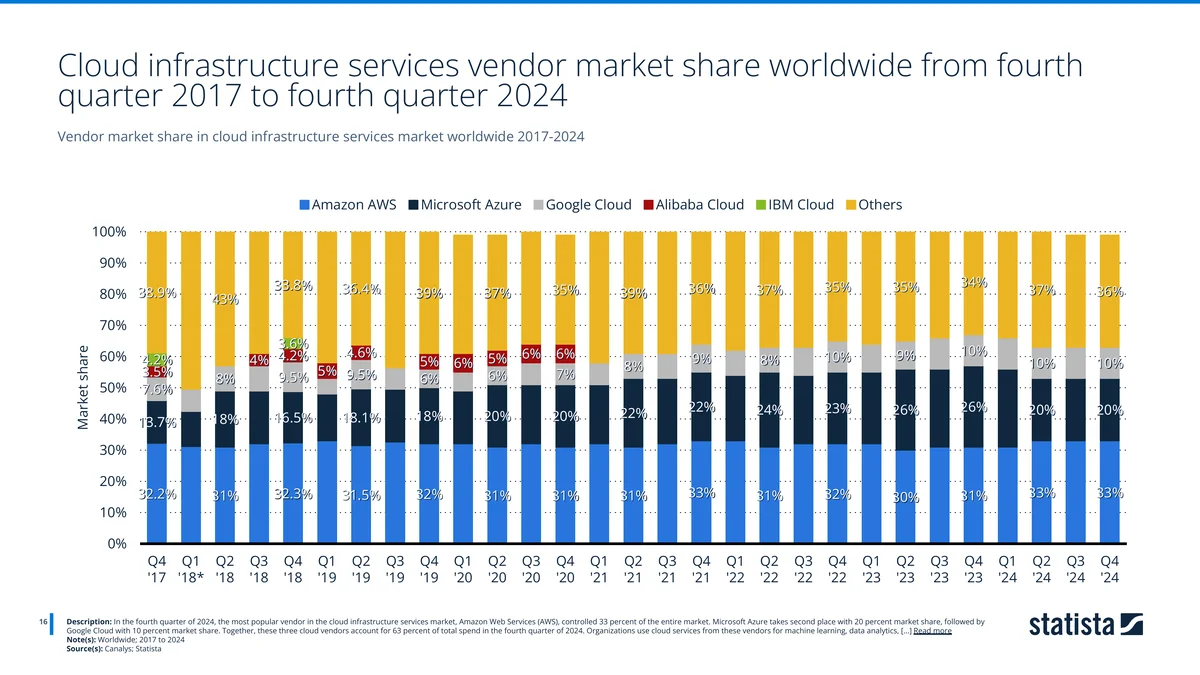
On the broadest measure, AWS has not lost share. In Q4 2017 it held 32.2%. In Q4 2024 it held 33%. Across the 29 quarters in between, the blue band never leaves a band of roughly 30% to 33%.
Over the same period Microsoft Azure rose from 13.7% to 20% and Google Cloud from 7.6% to 10%. If AWS held flat while both challengers gained more than 8 points between them, the share had to come from somewhere else: "all other providers" compressed from 38.9% to around 36%, and the smaller named vendors gave up the rest. In Q4 2024 the top three together took 63% of total spend.
Cloud Market Share Q2 2026: AWS 28%, Azure 20%, Google Cloud 15%
Enterprise spending on cloud infrastructure services reached $143.4 billion in Q2 2026, growing 43% year over year — the highest rate in eight years. Amazon Web Services held 28% of that spending, Microsoft Azure 20% and Google Cloud 15%, putting the big three at 63% of the total. Synergy attributes the acceleration to generative AI demand.
Source: Synergy Research Group · Q2 2026
| Cloud provider | Share of cloud infrastructure spending (%) |
|---|---|
| Amazon Web Services | 28% |
| Microsoft Azure | 20% |
| Google Cloud | 15% |
| All other providers | 37% |
- The big three hold 63% of cloud infrastructure spending
- Q2 2026 grew 43% year over year, the fastest in eight years
- All other providers still account for 37% of a $143.4 billion quarter
- AWS holds 28% of spending but 55.55% of hyperscaler origin traffic
Synergy Research Group, measuring the same market on its own methodology, put AWS at 28% in Q2 2026 inside a record $143.4 billion quarter that grew 43% year over year, its fastest rate in eight years. Microsoft Azure took 20% and Google Cloud 15%, putting the big three at 63% of all cloud infrastructure spend. Synergy's Q1 2026 release had the same three at 28%, 21% and 14% on $128.6 billion.
That is a genuine step down from the 33% Canalys measured for Q4 2024, but it is a different firm on a different basis, so it should be read as a separate observation rather than as the next point on the same line.
Gartner: AWS peaked in 2017
AWS IaaS Market Share Fell From 51.8% in 2017 to 37.7% in 2024
Amazon's share of the worldwide public cloud IaaS market peaked at 51.8% in 2017 and fell to 37.7% by 2024, a loss of 14.1 percentage points. Over the same period Microsoft rose from 13.3% to 23.9% and Google from 3.3% to 9.0%. The share did not move only between the top three: all other vendors collapsed from 48.4% in 2015 to 17.9% in 2024, so the market consolidated first and redistributed second.
Source: Gartner · 2015-2024
| Year | Amazon share of worldwide public cloud IaaS spending (%) |
|---|---|
| 2015 | 39.8% |
| 2016 | 44.2% |
| 2017 | 51.8% |
| 2018 | 47.8% |
| 2019 | 44.6% |
| 2020 | 40.8% |
| 2021 | 38.9% |
| 2022 | 40% |
| 2023 | 39% |
| 2024 | 37.7% |
- AWS peaked at 51.8% of IaaS in 2017, not in the 2020s
- 14.1 percentage points of share lost between 2017 and 2024
- All other vendors fell 48.4% to 17.9% — the market consolidated before it redistributed
- Microsoft gained 10.6 points and Google 5.7 over the same period
Narrow the denominator to infrastructure as a service alone and the picture reverses completely.
| Year | Amazon | Microsoft | All other vendors | |
|---|---|---|---|---|
| 2015 | 39.8% | 5.8% | — | 48.4% |
| 2016 | 44.2% | 7.1% | — | 39.6% |
| 2017 | 51.8% | 13.3% | 3.3% | 25.0% |
| 2018 | 47.8% | 15.5% | 4.0% | 23.2% |
| 2019 | 44.6% | 17.4% | 5.2% | 22.1% |
| 2020 | 40.8% | 19.7% | 6.1% | 19.8% |
| 2021 | 38.9% | 21.1% | 7.1% | 18.8% |
| 2022 | 40.0% | 21.5% | 7.5% | 18.9% |
| 2023 | 39.0% | 23.0% | 8.2% | 17.7% |
| 2024 | 37.7% | 23.9% | 9.0% | 17.9% |
Source: Gartner. Worldwide, 2015–2024.
Amazon's IaaS share peaked at 51.8% in 2017 and has shed 14.1 points since. Microsoft picked up 10.6 points and Google 5.7 over the same span. But look at the right-hand column before concluding that AWS simply lost to Azure: "all other vendors" collapsed from 48.4% to 17.9%. This market consolidated violently between 2015 and 2017, AWS captured most of that consolidation, and it has been giving a little of it back ever since. The top three grew from 68.4% of the market in 2017 to 70.6% in 2024 — barely moving — while trading share among themselves.
Wikibon: the hyperscaler-only view is the harshest
AWS Has Given Up 7 Points of Hyperscaler Share Since 2020
Measured across the four hyperscale vendors, AWS held 51.3 percent of combined IaaS and PaaS spending in 2024, down from 58.3 percent in 2020 and falling in every year of the period. Microsoft Azure absorbed 8.5 points of that shift, more than AWS actually lost, with the remainder coming out of Alibaba Cloud. Google Cloud Platform gained 2.5 points to reach 9.8 percent.
Source: Wikibon · 2020-2024
| Year | AWS share of hyperscaler IaaS + PaaS market (%) |
|---|---|
| 2020 | 58.3% |
| 2021 | 57.2% |
| 2022 | 55.8% |
| 2023 | 53.6% |
| 2024 | 51.3% |
- AWS fell from 58.3% to 51.3% of hyperscaler share between 2020 and 2024
- Azure gained 8.5 points over the same period — more than AWS lost
- AWS is on track to drop below half of hyperscaler spending
| Year | AWS | Azure | GCP | Alibaba |
|---|---|---|---|---|
| 2020 | 58.3% | 23.9% | 7.3% | 10.5% |
| 2021 | 57.2% | 25.0% | 8.1% | 9.7% |
| 2022 | 55.8% | 27.2% | 8.6% | 8.4% |
| 2023 | 53.6% | 29.9% | 9.1% | 7.3% |
| 2024 | 51.3% | 32.4% | 9.8% | 6.5% |
Source: Wikibon. Worldwide, 2020–2024. Denominator is the four named hyperscalers only.
Strip out every provider except the four hyperscalers and AWS still leads with a majority, but it is a shrinking one, falling 7.0 points in four years while Azure gained 8.5. Azure gained more than AWS lost, which means it also took share from Alibaba, whose position eroded from 10.5% to 6.5%. Google Cloud's 2.5-point gain is the smallest of the two Western challengers.
This is the measure on which the "Azure is catching AWS" narrative is most defensible, and it is also the measure with the most restrictive denominator. Extended at the 2020–2024 rate, the two would cross around 2032 — but four years of linear extrapolation across a market that just reaccelerated 43% is not a forecast, and should not be read as one.
What the traffic says: a sixth measurement, taken this week
⚠️ This section is the 30 August 2026 measurement, preserved as originally published. The Q3 2026 analysis near the top of the report supersedes its figures: AWS 55.32% of hyperscaler origin requests for the quarter, Azure 16.79%, Google Cloud 26.94%, Oracle 0.95%; AWS's failure ratio 1.05 rather than 0.87; us-east-1 44.15% of AWS requests.
Every figure above measures money or surveys buyers. Cloudflare Radar measures something none of them do: the requests actually arriving at each provider's origin servers, seen from one of the largest networks on the internet.
AWS Serves 55.6% of Hyperscaler Origin Traffic in August 2026
Measured at Cloudflare's edge, Amazon Web Services received 55.55% of all requests routed to the four hyperscaler origins between 2 and 30 August 2026, against 26.46% for Google Cloud, 17.05% for Microsoft Azure and 0.93% for Oracle Cloud. This is a traffic measurement rather than a spending one, and it uses the same four-vendor denominator as Wikibon's market-share series, which put AWS at 51.3% for 2024.
Source: Cloudflare Radar · August 2026
| Cloud provider | Share of hyperscaler origin requests (%) |
|---|---|
| Amazon Web Services | 55.55% |
| Google Cloud | 26.46% |
| Microsoft Azure | 17.05% |
| Oracle Cloud | 0.93% |
- AWS receives more origin traffic than the other three hyperscalers combined
- Google Cloud ranks second on traffic at 26.46%, well ahead of its 13% share of cloud spend
- Oracle Cloud is under 1% of observed origin requests
- Traffic share and revenue share rank the middle of the field differently
Between 2 and 30 August 2026, AWS received 55.55% of all requests Cloudflare's edge sent to the four hyperscaler origins, against 26.46% for Google Cloud, 17.05% for Microsoft Azure and 0.93% for Oracle Cloud. AWS takes more origin traffic than the other three combined.
This is the closest direct comparison in the report, because Radar and Wikibon use the same four-vendor denominator. Wikibon put AWS at 51.3% of hyperscaler spending in 2024; Radar puts it at 55.55% of hyperscaler origin traffic in August 2026. AWS serves proportionally more traffic than it captures revenue, which is what you would expect from a provider whose long tail is small sites with high request volume and low spend.
The same decline shows up in traffic
The 12 weeks to 24 August 2026 move in the same direction as every spending series in this report:
| Provider | Week of 1 Jun 2026 | Week of 24 Aug 2026 | Change |
|---|---|---|---|
| Amazon Web Services | 57.88% | 55.16% | −2.72pp |
| Microsoft Azure | 15.52% | 17.60% | +2.08pp |
| Google Cloud | 25.51% | 26.35% | +0.84pp |
| Oracle Cloud | 1.09% | 0.89% | −0.20pp |
Source: Cloudflare Radar, radar/origins/timeseries_groups/origin, weekly buckets, 1 June to 24 August 2026.
Twelve weeks is a short window and quarterly noise is real, so this is corroboration rather than proof. But it is the same shape Wikibon and Gartner report on spending, arrived at through a completely independent mechanism: AWS gives up two to three points, Azure takes most of them, Google Cloud takes a little.
Performance and reliability, measured at the edge
Radar also times its own connections to each provider. These are raw milliseconds, so magnitude is meaningful:
| Provider | TCP handshake | TLS handshake | Share of requests | Share of connection failures | Failures vs traffic |
|---|---|---|---|---|---|
| Google Cloud | 49.98 ms | 62.31 ms | 26.46% | 15.22% | 0.58 |
| Amazon Web Services | 59.09 ms | 84.86 ms | 55.55% | 48.12% | 0.87 |
| Microsoft Azure | 60.83 ms | 81.98 ms | 17.05% | 35.61% | 2.09 |
| Oracle Cloud | 79.22 ms | 96.92 ms | 0.93% | 1.05% | 1.13 |
Source: Cloudflare Radar, radar/origins/summary/origin, worldwide, 2 to 30 August 2026. The final column divides each provider's share of connection failures by its share of requests; 1.00 means failures exactly proportional to traffic.
The raw failure column is the one that gets misread. AWS accounts for 48.12% of the connection failures Cloudflare sees, which sounds damning until you notice it also accounts for 55.55% of the requests. Normalised against its own traffic, AWS fails less than its volume predicts (0.87), while Azure fails more than twice as often as its traffic would suggest (2.09). Google Cloud is the most reliable on this measure at 0.58, and it is also the fastest on both handshakes.
One region carries 43.7% of it
43.7% of AWS Origin Traffic Goes to One Region: us-east-1
Of all requests Cloudflare's network sent to AWS origins between 2 and 30 August 2026, 43.69% went to a single region, us-east-1 in Northern Virginia. The three largest US regions together take 67.4%. This is the concentration that turns an AWS regional incident into an internet-wide one.
Source: Cloudflare Radar · August 2026
| AWS region | Share of AWS origin requests (%) |
|---|---|
| us-east-1 (N. Virginia) | 43.69% |
| us-east-2 (Ohio) | 13% |
| us-west-2 (Oregon) | 10.76% |
| Other regions | 7.47% |
| eu-central-1 (Frankfurt) | 7.37% |
| eu-west-1 (Ireland) | 5.1% |
| Global / unattributed | 3.81% |
| ap-southeast-1 (Singapore) | 3.75% |
| ap-northeast-1 (Tokyo) | 3.13% |
| ap-south-1 (Mumbai) | 1.92% |
- us-east-1 alone carries 43.69% of AWS origin traffic
- The three largest US regions account for 67.4% between them
- No European region reaches 8%
- Cloudflare observes 43 AWS regions, against 78 for Microsoft Azure
Cloudflare observes AWS across 43 regions. It sends 43.69% of all AWS-bound origin requests to one of them: us-east-1 in Northern Virginia. Add us-east-2 and us-west-2 and the three largest US regions take 67.4% between them. No European region reaches 8%.
For context on the competitive picture, Cloudflare observes 78 Microsoft Azure regions against 43 for AWS — Azure has the wider geographic footprint and roughly a third of the traffic.
The competition
Microsoft Azure
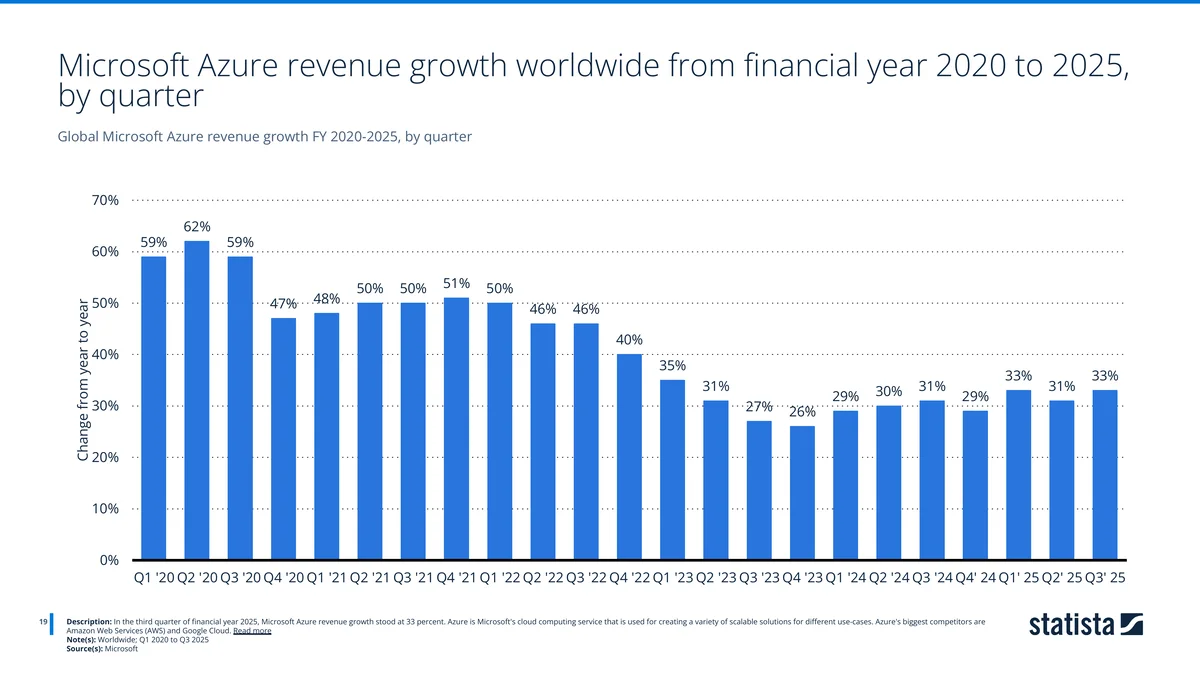
Azure's growth curve is the same shape as AWS's, one size larger and one step ahead. It peaked at 62% in financial year 2020, declined steadily through 2022 and 2023 to a low in the mid-twenties, and recovered to 33% by Q3 of financial year 2025.
Microsoft does not disclose Azure revenue in dollars, only its growth rate, which is why every AWS-versus-Azure revenue comparison you will see is an estimate. It also reports on a financial year offset from the calendar, so its quarters are not directly comparable to Amazon's. The honest comparison is that both platforms troughed in 2023 and both have been reaccelerating since, with AWS's most recent published rate (37% in calendar Q2 2026) above Azure's most recent published rate (33% in fiscal Q3 2025) on periods that do not line up.
Google Cloud
Google Cloud Revenue Reached $58.7 Billion in 2025
Google Cloud generated 58.7 billion U.S. dollars in 2025, up almost 36 percent on the previous year. The segment has grown more than fourteenfold since 2017, when it brought in just over 4 billion dollars, making it the fastest-compounding line item in Alphabet's reporting.
Source: Alphabet · 2017-2025
| Year | Revenue (million U.S. dollars) |
|---|---|
| 2017 | $4056 |
| 2018 | $5838 |
| 2019 | $8918 |
| 2020 | $13059 |
| 2021 | $19206 |
| 2022 | $26280 |
| 2023 | $33088 |
| 2024 | $43229 |
| 2025 | $58705 |
- Google Cloud revenue grew 35.8% in 2025, to $58.7 billion
- The segment is 14.5x larger than it was in 2017
- 2025 added $15.5 billion of new revenue — more than the segment's entire 2020 total
Google Cloud reached $58.71 billion in 2025, up 35.8% on 2024's $43.23 billion. That is a faster percentage rate than AWS managed in the same year (19.7%), and it has since accelerated much further: Google Cloud grew 82% in Q2 2026.
The absolute numbers are where the gap stays visible. AWS's 2025 revenue was 2.19× Google Cloud's, and AWS added $21.17 billion of new revenue that year against Google Cloud's $15.48 billion. Percentage growth from a smaller base narrows a gap slowly. Our companion Google Cloud statistics report covers that trajectory, its $514 billion backlog and its customer-concentration risk in detail.
Adoption is a dead heat. Commitment is not.
Revenue share says AWS leads Azure by a wide margin. Adoption surveys say something close to a tie. Both are true, and reconciling them is the most useful thing in this report.
One scope note matters before the numbers. Flexera's adoption series surveys enterprises with more than 1,000 employees. Its workload-depth series surveys 759 cloud decision makers across organisations of all sizes. They are different populations, so the two tables below are not two views of one group.
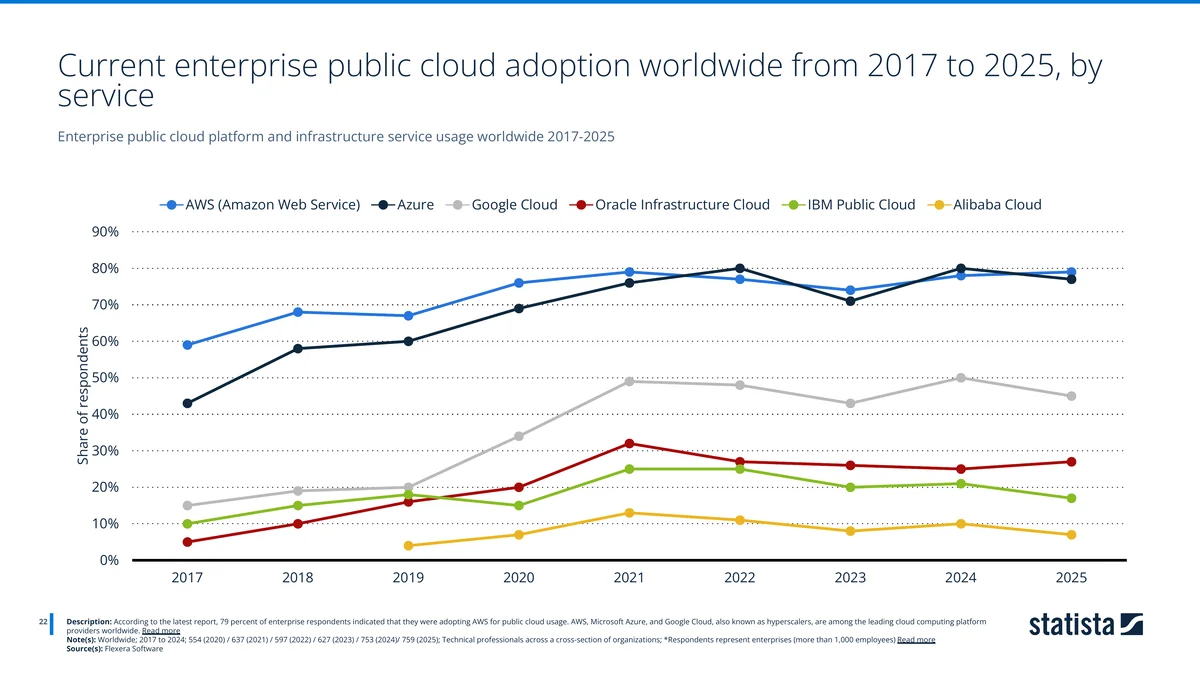
| Year | AWS | Azure | Google Cloud | Oracle | IBM | Alibaba |
|---|---|---|---|---|---|---|
| 2017 | 59% | 43% | 15% | 5% | 10% | — |
| 2019 | 67% | 60% | 20% | 16% | 20% | 4% |
| 2021 | 79% | 76% | 49% | 32% | 25% | 13% |
| 2022 | 77% | 80% | 48% | 26% | 25% | 11% |
| 2023 | 74% | 71% | 43% | 26% | 20% | 8% |
| 2024 | 78% | 80% | 50% | 25% | 21% | 10% |
| 2025 | 79% | 77% | 45% | 27% | 17% | 7% |
Source: Flexera. Worldwide, 2017–2025. Enterprises with more than 1,000 employees; 554–759 respondents depending on year.
Flexera has since published its 2026 State of the Cloud Report (March 2026, more than 750 cloud decision makers), which puts AWS at 83% and Azure at 79% for active enterprise workloads — the same ordering, both higher, on a slightly different cut than the series above.
Azure overtook AWS on adoption breadth in 2022 and matched it again in 2024. On this measure the two have been statistically indistinguishable for four years, and AWS's 2025 lead of two points is inside any reasonable margin for a 759-respondent survey. Both plateaued around 2021; neither has widened its reach since.
So AWS's revenue lead is not built on reaching more enterprises. It is built on what those enterprises do once they arrive.

Only 19% of Enterprises Run Significant Workloads on Google Cloud
AWS and Azure convert trial into commitment: 53 and 46 percent of cloud decision makers respectively run significant workloads on them. Google Cloud Platform reaches only 19 percent, despite being evaluated by a far larger share of the market — 27 percent run some workloads on GCP and another 20 percent are still experimenting, the highest experimentation rate of any major provider.
Source: Flexera · 2024
| Cloud provider | Share of respondents (%) |
|---|---|
| AWS | 53% |
| Microsoft Azure | 46% |
| Google Cloud Platform | 19% |
| Oracle Cloud | 9% |
| IBM Cloud | 6% |
| Alibaba Cloud | 4% |
- Only 19% of cloud decision makers run significant workloads on Google Cloud, vs 53% on AWS
- GCP has the highest experimentation rate of any provider at 20%
- 37% of GCP's usage base is still at trial or planning stage, against 11% for AWS
| Provider | Running significant workloads | Running some workloads | Experimenting | Plan to use | Any contact | Conversion |
|---|---|---|---|---|---|---|
| AWS | 53% | 26% | 6% | 4% | 89% | 60% |
| Azure | 46% | 31% | 11% | 4% | 92% | 50% |
| Google Cloud | 19% | 27% | 20% | 7% | 73% | 26% |
| Oracle Cloud Infrastructure | 9% | 18% | 16% | 9% | 52% | 17% |
| IBM Cloud | 6% | 11% | 14% | 10% | 41% | 15% |
| Alibaba Cloud | 4% | 9% | 8% | 3% | 24% | 17% |
Source: Flexera. Worldwide, winter 2024; 759 cloud decision makers. "Conversion" is significant workloads divided by any contact, calculated by TechnologyChecker.io.
More of the surveyed organisations touch Azure than touch AWS, 92% against 89%. But of everyone who touches AWS at all, 60% are running significant production workloads on it. For Azure that figure is 50%, and for Google Cloud 26%.
The mirror image is just as clear. Only 11% of AWS's base is pre-production (still planning or experimenting) against 16% for Azure and 37% for Google Cloud. AWS has the most committed installed base of any platform in the survey, and that is a much better explanation of a 33% revenue share against Azure's 20% than any adoption headline provides.
One caveat belongs on this table, and it is a serious one: Flexera's fieldwork ran in winter 2024. It has not been repeated since AWS's growth rate roughly tripled and Google Cloud's more than doubled. It is the most-quoted data in this report and also its oldest.
Private and hybrid cloud
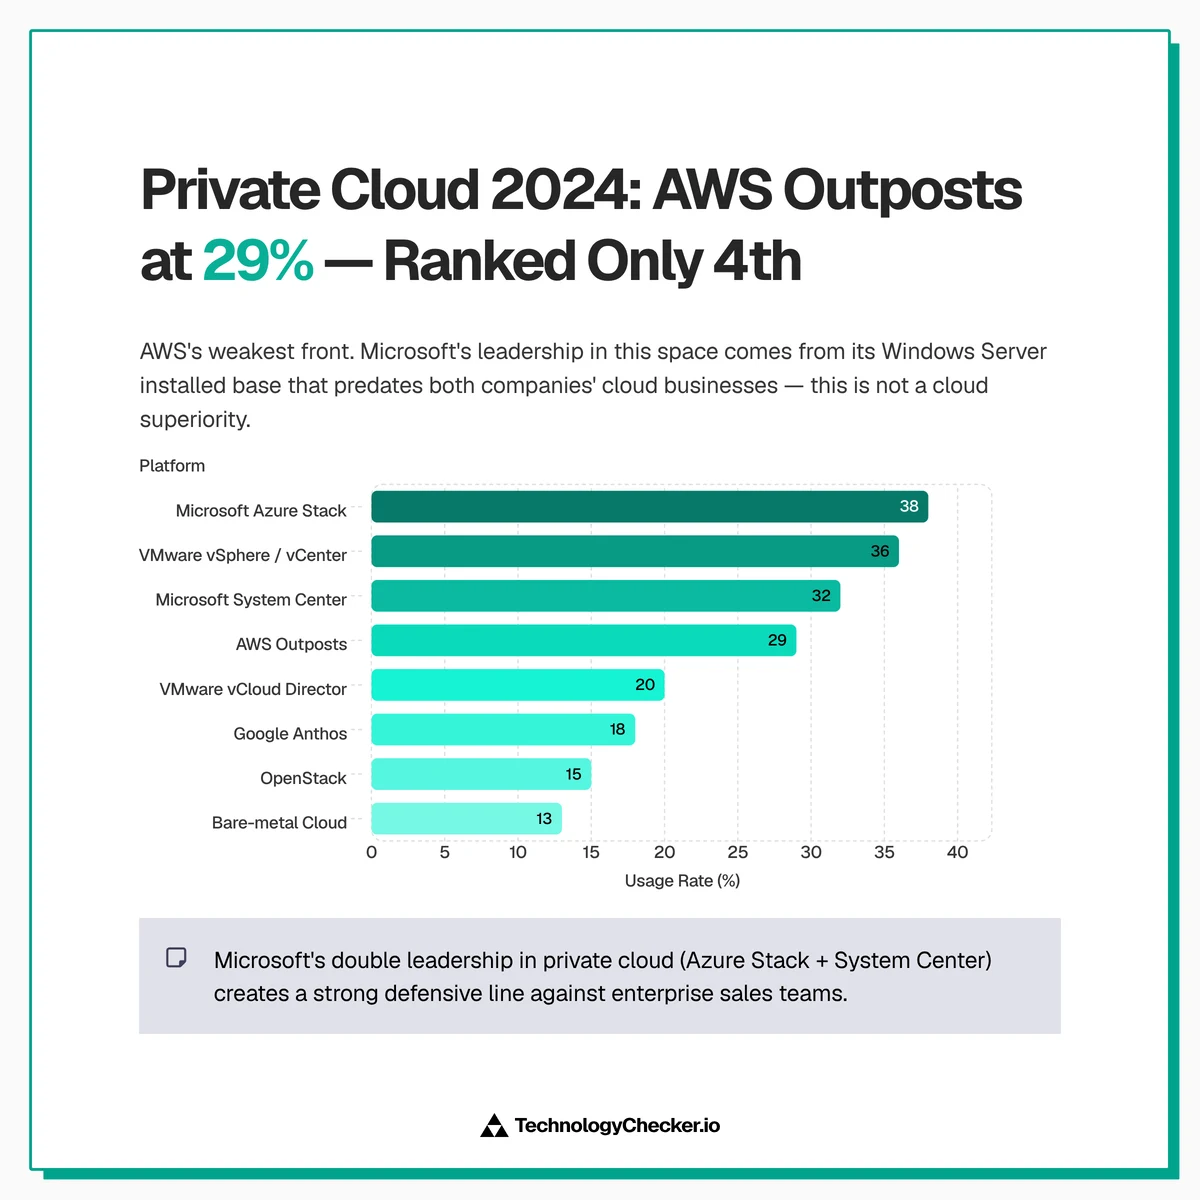
AWS's position weakens noticeably once workloads move on-premises. AWS Outposts is used by 29% of respondents, fourth behind Microsoft Azure Stack (38%), VMware vSphere/vCenter (36%) and Microsoft System Center (32%).
| Technology | Currently use | Experimenting | Plan to use |
|---|---|---|---|
| Microsoft Azure Stack | 38% | 20% | 8% |
| VMware vSphere/vCenter | 36% | 16% | 8% |
| Microsoft System Center | 32% | 15% | 12% |
| AWS Outposts | 29% | 19% | 8% |
| VMware vCloud Director | 20% | 20% | 8% |
| Google Anthos | 18% | 18% | 8% |
| OpenStack | 15% | 16% | 10% |
| Bare-metal cloud | 13% | 14% | 9% |
Source: Flexera. Worldwide, 2024; 753 respondents.
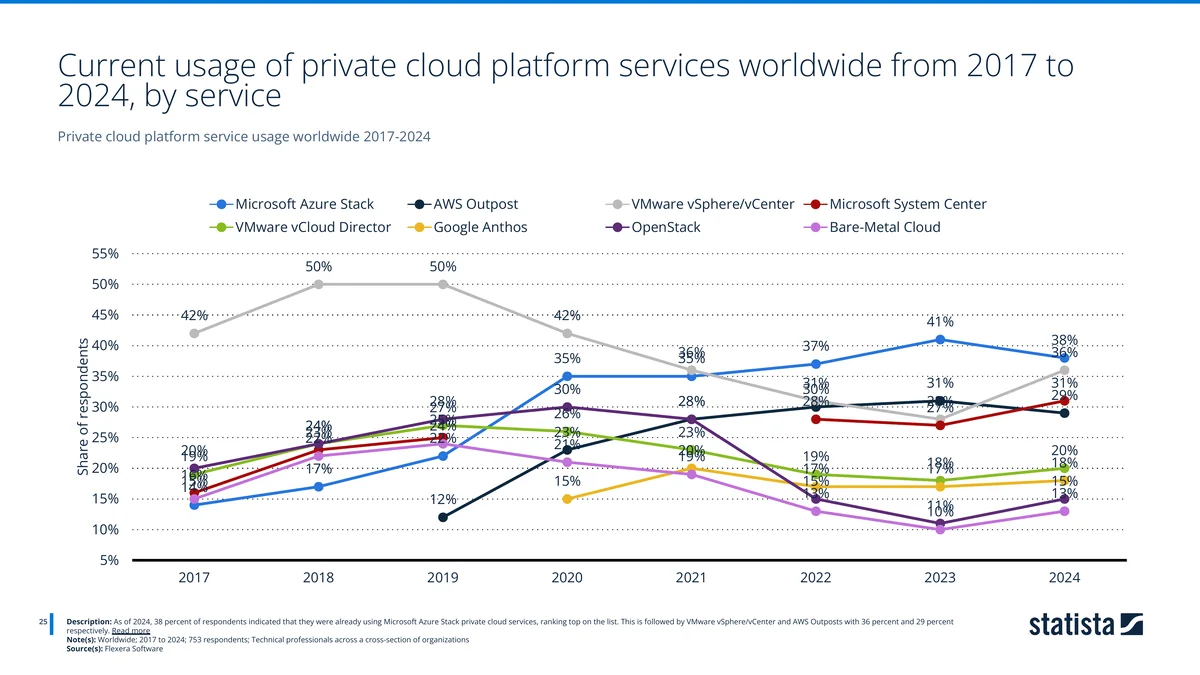
Microsoft's advantage here is not a cloud advantage. It is the installed base of Windows Server, System Center and Active Directory that predates both companies' cloud businesses. AWS entered hybrid infrastructure as a challenger and remains one. Outposts does lead on planned adoption alongside Google Anthos and VMware vCloud Director, so the gap is narrowing from the pipeline rather than from the installed base.
What our own detection data adds
Everything above measures spend or surveys enterprises. Our crawler measures something different and complementary: which platforms are actually serving public web domains.
As of our August 2026 crawl we detect AWS on 936,363 domains (⚠️ 1,026,685 as of the September 2026 crawl; the size, country and service tables below remain August 2026 data), making it the most-detected platform in the PaaS category at 39.98% share of detected domains. We identify it through Route 53 nameserver delegation, AWS response headers and amazonaws.com references. The AWS technology profile carries the full breakdown.
amazonaws.com references across our monthly crawl. Company size resolves for 446,064 of the 936,363 detected domains, and every percentage below uses that smaller base, not the full count.The public web sees a small-business platform
| Company size | Detected domains | Share of resolved base |
|---|---|---|
| 1–10 employees | 240,679 | 53.96% |
| 11–50 | 117,975 | 26.45% |
| 51–200 | 51,112 | 11.46% |
| 201–500 | 17,417 | 3.90% |
| 501–1,000 | 7,459 | 1.67% |
| 1,001–5,000 | 7,670 | 1.72% |
| 5,001–10,000 | 1,605 | 0.36% |
| 10,001+ | 2,147 | 0.48% |
Source: TechnologyChecker.io, August 2026. Percentages are of the 446,064 detected domains with a resolved company size, not of all 936,363.
Amazon Web Services Adoption by Company Size
80.4% of matched companies have fewer than 50 staff and only 2.56% employ more than 1,000. That skew is a property of the signal, not of AWS. A Route 53 hosted zone costs 50 cents a month, so any freelancer who registers a domain through AWS produces the same detection as a bank. Read the small end of this table as domain owners and the 8.14% above 200 staff as the part with a procurement process.
Source: technologychecker.io/technology/amazon-web-services-aws
| Label | Value |
|---|---|
| 1-10 | 53.96% |
| 11-50 | 26.45% |
| 51-200 | 11.46% |
| 201-500 | 3.9% |
| 501-1000 | 1.67% |
| 1001-5000 | 1.72% |
| 5001-10000 | 0.36% |
| 10001+ | 0.48% |
- 80.4% of matched companies have fewer than 50 staff
- Only 2.56% employ more than 1,000, because the cheapest AWS product is a DNS zone
- The 8.14% above 200 staff, about 36,298 companies, is the segment with a procurement process

80.4% of AWS domains where we can resolve company size belong to organisations with 50 or fewer employees. Only 2.56% have more than 1,000, which is the entire population Flexera surveys.
These two datasets do not contradict each other; they barely overlap. Flexera asks 759 large enterprises what they run and finds 79% adoption. We look at the public web and find a long tail of very small companies. AWS is the only platform in this report that is simultaneously the default for a two-person startup's marketing site and the majority infrastructure vendor for the Fortune 500. Most "AWS is an enterprise platform" and "AWS is where startups begin" arguments are each describing one of these populations and generalising to both.
Both camps have the data on their side. Neither has all of it.
Where those domains are
| Country | Detected AWS domains |
|---|---|
| United States | 187,397 |
| United Kingdom | 39,677 |
| Australia | 26,339 |
| India | 21,729 |
| Brazil | 20,283 |
| Canada | 18,148 |
| Germany | 13,449 |
| France | 8,634 |
| Spain | 7,986 |
| Japan | 7,835 |
| Netherlands | 7,352 |
| Italy | 6,427 |
Source: TechnologyChecker.io, August 2026. Counts, not shares. The geolocated subset is smaller than the full detected base and denominators differ between our size, country and industry breakdowns.
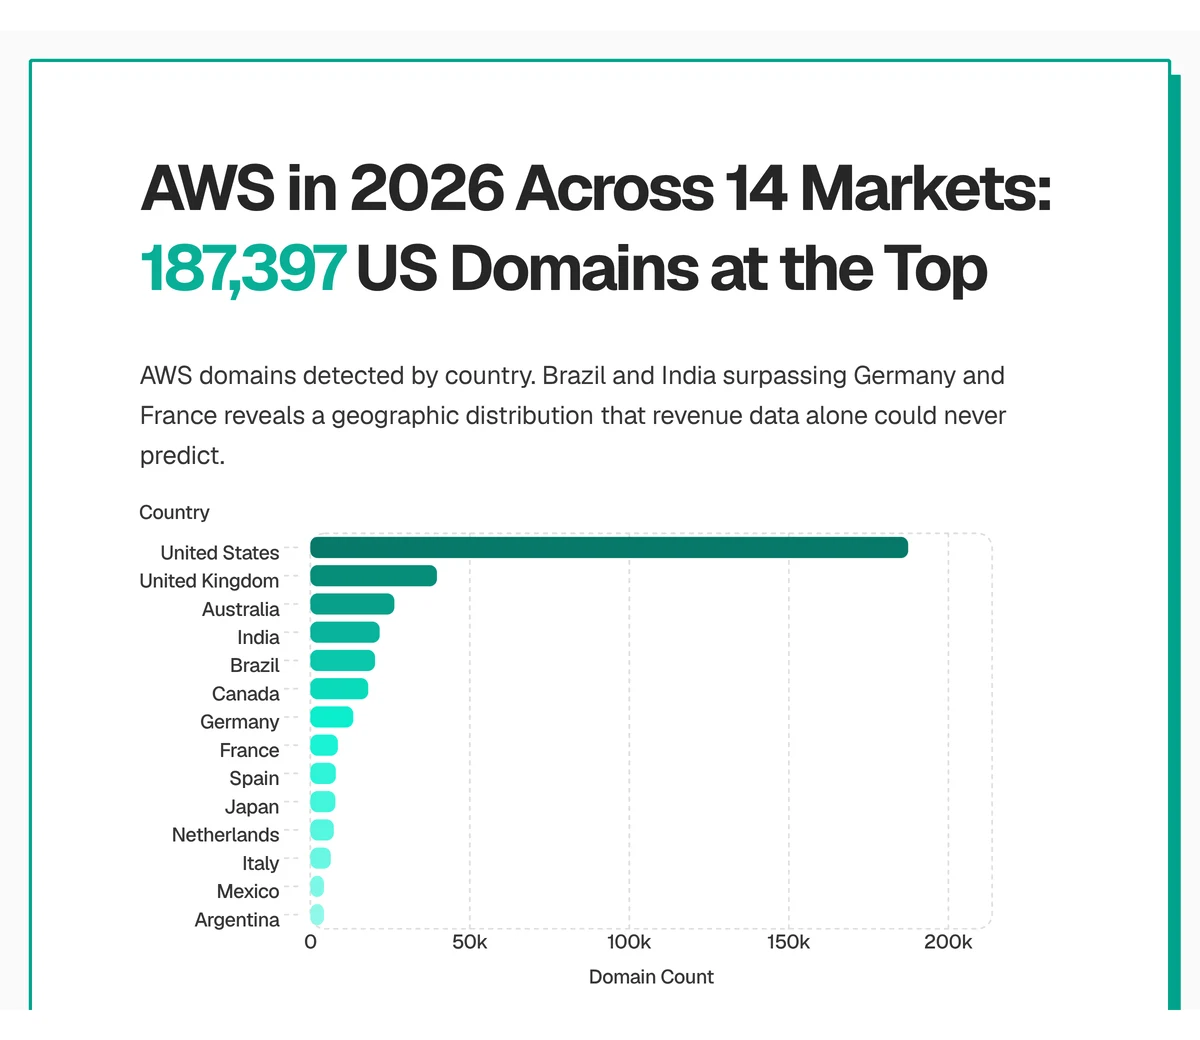
Brazil and India both place above Germany and France, which is not the ordering the revenue data would suggest and reflects AWS's strength with the small, web-first companies that dominate our detected base.
By industry, Software Development leads with 33,761 detected domains, followed by IT Services and IT Consulting (23,673), Retail (20,723), Technology and Internet (19,837), Real Estate (17,217) and Financial Services (15,601). In the September 2026 crawl Software Development reached 34,455 of 429,566 matched domains, 8.02% of the base and 3.1 times its share of the whole web, the clearest lean in AWS's footprint.
The AWS service footprint
Individual AWS services are detected across four separate product categories, several on more domains than entire competing platforms:
| AWS service | Domains detected | Category | Category position |
|---|---|---|---|
| Amazon S3 | 659,040 | Cloud IaaS | #1 at 86.13% |
| Amazon CloudFront | 397,677 | CDN | #9 at 2.04% |
| Amazon SES | 204,870 | #5 at 8.26% | |
| Amazon Pay | 44,471 | Payment processing | #11 at 0.80% |
Source: TechnologyChecker.io, August 2026. Each service is detected independently, so the counts overlap and must not be summed.
The spread matters more than any single row. S3 at 86.13% of its category is close to a monopoly on detectable object storage, while CloudFront sits ninth in a CDN market where Cloudflare's free tier dominates by domain count. AWS's dominance is not uniform across the stack. It is overwhelming at the storage layer and merely competitive at the edge.
For comparison, the platforms we detect most often alongside or instead of AWS in the PaaS category are Vercel (389,653 domains), WordPress.com (193,092), Microsoft Azure (175,651), Firebase (160,932) and Netlify (154,481).
A caveat that matters more than the numbers. We detect AWS on 5.3× as many domains as Azure and 9.1× as many as Google Cloud. That ratio is not a market share and should not be read as one. AWS is identified partly through Route 53 nameserver delegation, which is a DNS-level signal visible on any domain regardless of what it hosts; Azure and Google Cloud are identified through narrower application-layer signatures. A broader detection rule finds more domains. Separately, a web crawler cannot see the workloads that generate most cloud revenue: internal applications, data pipelines, batch compute and private VPCs have no public domain to detect. Our data describes the composition of each platform's public web footprint accurately. It does not size their businesses, and the revenue figures earlier in this report are the right tool for that.
The market AWS is growing into
Public Cloud Spending Is Forecast to Reach $723 Billion in 2025
Worldwide end-user spending on public cloud services is expected to reach 723.42 billion U.S. dollars in 2025, up from 595.65 billion in 2024. The market has grown fivefold since 2017 and covers business process, platform, infrastructure, software, management, security and advertising services delivered by public cloud providers.
Source: Gartner · 2017-2025
| Year | Market size (billion U.S. dollars) |
|---|---|
| 2017 | $145B |
| 2018 | $197B |
| 2019 | $243B |
| 2020 | $314B |
| 2021 | $412.63B |
| 2022 | $478.32B |
| 2023 | $561.1B |
| 2024 | $595.65B |
| 2025 | $723.42B |
- Public cloud spending is forecast at $723.42 billion for 2025
- The market has grown roughly 5x since 2017
- 2025's forecast increase of $127.8 billion is the largest single-year jump on record
Gartner puts worldwide public cloud end-user spending at $723.42 billion in 2025, up from $595.65 billion in 2024 and $145 billion in 2017, a five-fold increase across eight years. AWS's $128.73 billion is about 17.8% of that total, which is lower than every vendor-share figure quoted earlier because this denominator includes SaaS, business process and management services that AWS largely does not sell.
Cloud IaaS Growth Accelerates to 24.8% in 2025, Fastest Segment
Infrastructure as a service is forecast to grow 24.8% in 2025, against 21.5% for the public cloud market overall. It is the only segment accelerating in both 2024 and 2025, rising from 19.1% to 21.3% to 24.8%. Desktop as a service is the only segment decelerating, falling from 11.4% to 7.7%. IaaS is the segment AWS sells most of, which independently corroborates the reacceleration visible in Amazon's own quarterly filings.
Source: Gartner · 2023-2025
| Public cloud segment | Annual growth rate (%) |
|---|---|
| IaaS (system infrastructure) | 24.8% |
| PaaS (application infrastructure) | 21.6% |
| SaaS (application services) | 18.1% |
| DaaS (desktop as a service) | 7.7% |
| Total public cloud market | 21.5% |
- IaaS is forecast to grow 24.8% in 2025, above the 21.5% market rate
- IaaS is the only segment accelerating in both 2024 and 2025
- Desktop as a service decelerated from 11.4% to 7.7%
- SaaS growth has been flat at 18.1% for two straight years
| Segment | 2023 | 2024 | 2025 |
|---|---|---|---|
| Cloud application infrastructure services (PaaS) | 19.5% | 19.1% | 21.6% |
| Cloud application services (SaaS) | 19.2% | 18.1% | 18.1% |
| Cloud desktop as a service (DaaS) | 11.4% | 11.1% | 7.7% |
| Cloud system infrastructure services (IaaS) | 19.1% | 21.3% | 24.8% |
| Total market | 17.3% | 19.2% | 21.5% |
Source: Gartner and Statista. Worldwide, 2023–2025 (2025 forecast).
IaaS is the only segment accelerating in both years, and it is forecast to grow 24.8% in 2025 against 21.5% for the market overall. That is the segment AWS sells most of, and it is the clearest external corroboration of the reacceleration visible in AWS's own quarterly numbers.
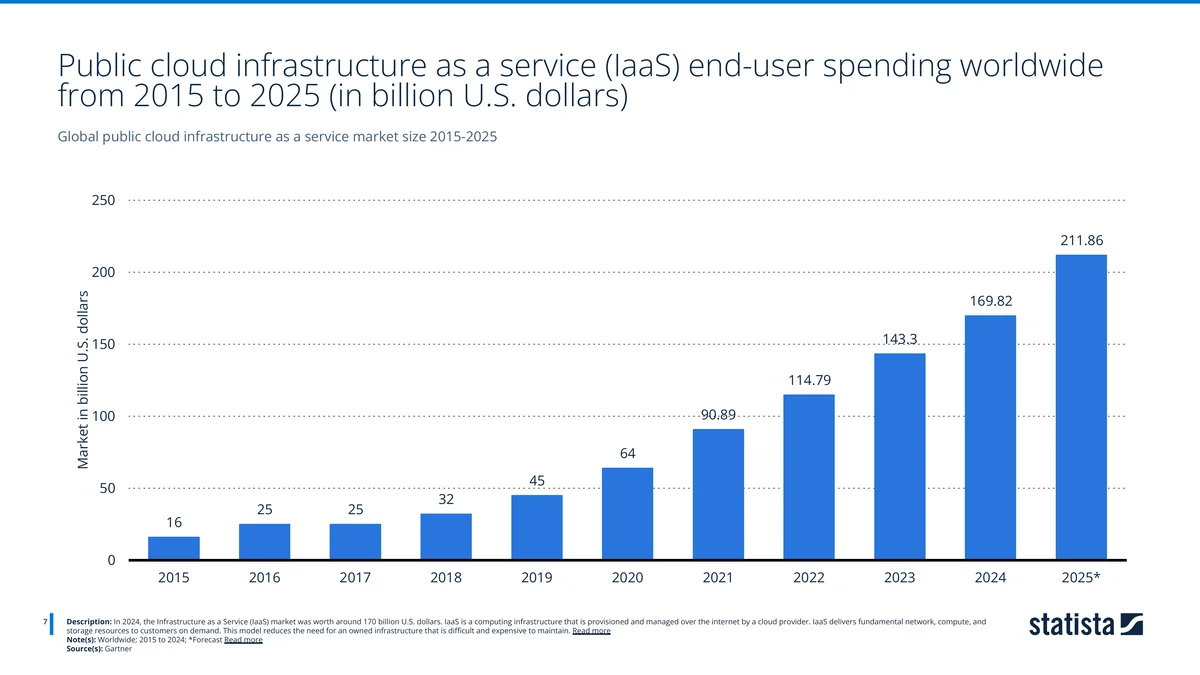
| Year | IaaS | PaaS | SaaS |
|---|---|---|---|
| 2015 | $16B | $4B | $31.4B |
| 2018 | $32B | $26B | $85.7B |
| 2021 | $90.89B | $89.9B | $146.33B |
| 2023 | $143.3B | $142.93B | $206B |
| 2024 | $169.82B | $171.57B | $250.8B |
| 2025* | $211.86B | $208.64B | $299.07B |
*Source: Gartner. Worldwide, 2015–2025. 2025 forecast.
PaaS Spending Grew 52x in a Decade to $209 Billion
Worldwide spending on platform as a service is forecast to reach 208.64 billion U.S. dollars in 2025, up from just 4 billion in 2015. PaaS is the fastest-growing of the three public cloud segments and has effectively caught infrastructure as a service, which is forecast at 211.86 billion for the same year.
Source: Gartner · 2015-2025
| Year | Spending (billion U.S. dollars) |
|---|---|
| 2015 | $4B |
| 2016 | $9B |
| 2017 | $12B |
| 2018 | $26B |
| 2019 | $38B |
| 2020 | $59B |
| 2021 | $89.9B |
| 2022 | $119.58B |
| 2023 | $142.93B |
| 2024 | $171.57B |
| 2025 | $208.64B |
- PaaS spending is forecast at $208.64 billion in 2025, up 52x from 2015
- PaaS is now effectively tied with IaaS, forecast at $211.86 billion
- The segment is forecast to grow 21.6% in 2025
IaaS and PaaS were four times apart in 2015 and are now effectively tied, with PaaS having overtaken IaaS in 2024 before falling marginally behind in the 2025 forecast. PaaS grew 52× across the decade against IaaS's 13×. For AWS this is the competitive pressure point: raw compute and storage is where its scale advantage is most durable, while the managed-service layer above it is where Azure and Google Cloud compete most directly and where the market has grown fastest.
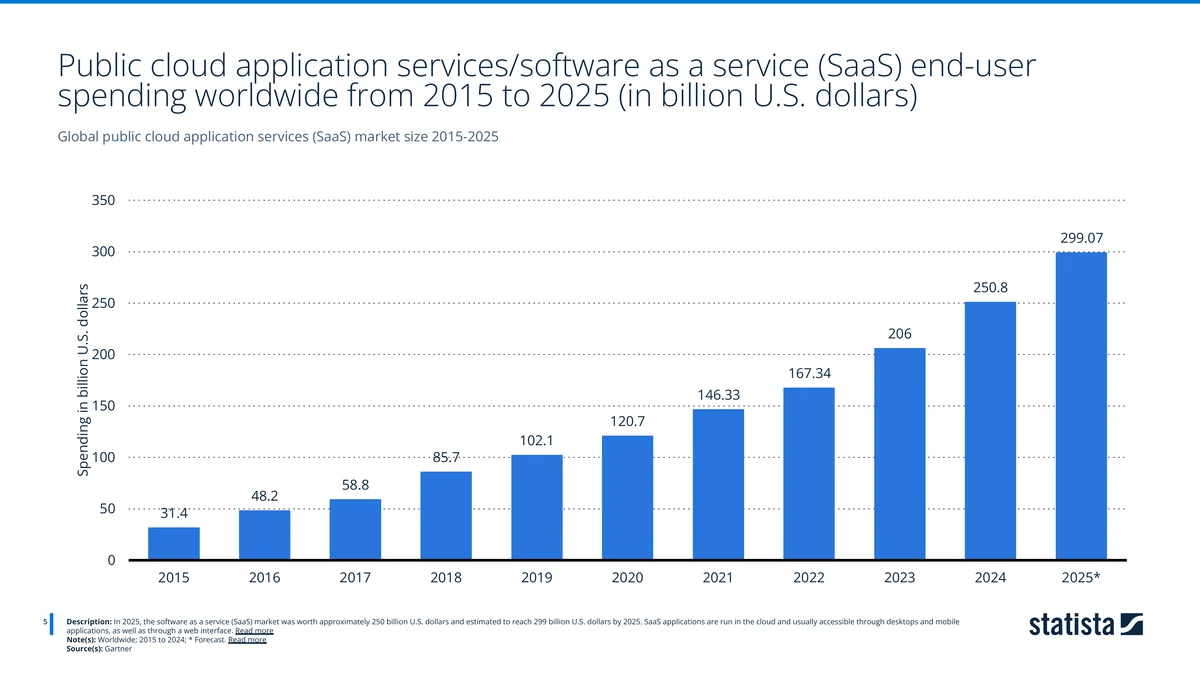
SaaS remains the largest single segment at a forecast $299.07 billion in 2025, and it is the one AWS participates in least directly, though a substantial share of those SaaS vendors run on AWS themselves, which is revenue AWS books as IaaS and PaaS.
The October 2025 outage
On 20 October 2025 AWS experienced a 15-hour outage that disrupted operations across social media, banking and smart home devices, with Snapchat among the affected services.

The event is worth recording in a statistics report for a reason the operational post-mortems mostly missed: it is the concentration risk implied by every share figure above, made concrete. When a single vendor holds 28% to 33% of global cloud infrastructure spend and its storage primitive is detected on 659,040 domains, a fifteen-hour degradation is not a vendor incident. It is an internet-wide one. Nothing in the subsequent revenue data suggests customers left. Growth accelerated in the two quarters that followed, which is itself the most telling statistic about switching costs at this layer.
The security context
Cloud security is where the dossier's final chapter sits, and it frames the environment AWS customers operate in rather than AWS itself.
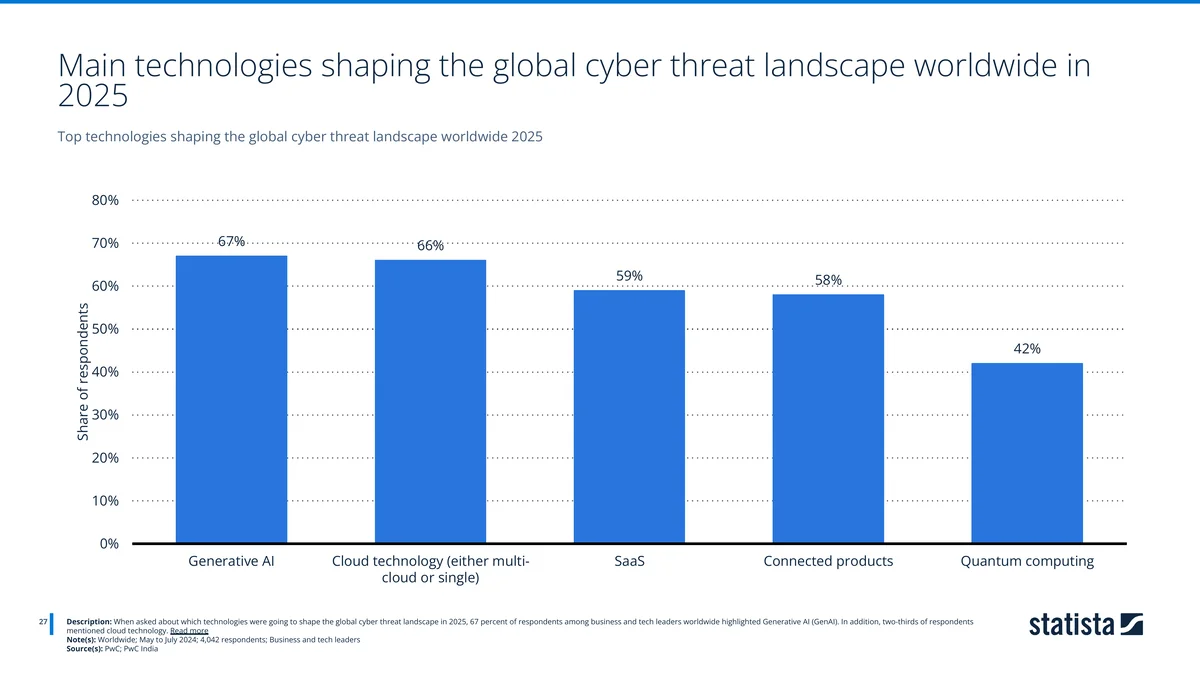
Asked which technologies would most shape global cyber threats in 2025, 67% of 4,042 business and technology leaders named generative AI and 66% named cloud technology, ahead of SaaS (59%), connected products (58%) and quantum computing (42%). The two technologies driving AWS's growth are the same two its customers rank as their largest emerging risks.
Cloud Security Priorities 2024: Threat Detection Leads at 47%
Among 813 cybersecurity professionals surveyed in April 2024, threat detection and response was the leading cloud security priority at 47%, followed by user education and awareness at 46% and end-to-end visibility and monitoring at 43%. Prevention ranked last at 21%, indicating that the profession has shifted toward detecting and containing incidents rather than expecting to stop them.
Source: Check Point Software Technologies; Cybersecurity Insiders · 2024
| Cloud security priority | Share of respondents (%) |
|---|---|
| Threat detection and response | 47% |
| User education and awareness | 46% |
| End-to-end visibility and monitoring | 43% |
| Cloud governance and risk management | 42% |
| Data security and privacy | 41% |
| Compliance and regulatory adherence | 37% |
| Identity and access management | 35% |
| Infrastructure and resource management | 33% |
| Application security | 32% |
| Cloud migration and integration | 31% |
| Security automation and orchestration | 29% |
| Disaster recovery and business continuity | 26% |
| Prevention | 21% |
- Threat detection and response leads at 47%, named by nearly half of respondents
- Prevention ranks last at 21% — the profession expects incidents rather than preventing them
- User education at 46% outranks every technical control on the list
- Identity and access management sits mid-table at 35%
Among 813 cybersecurity professionals surveyed in April 2024, the leading cloud security priorities were threat detection and response (47%), user education and awareness (46%), end-to-end visibility and monitoring (43%), cloud governance and risk management (42%) and data security and privacy (41%). Prevention ranked last at 21%. The profession has shifted decisively toward detecting and containing incidents rather than expecting to stop them.
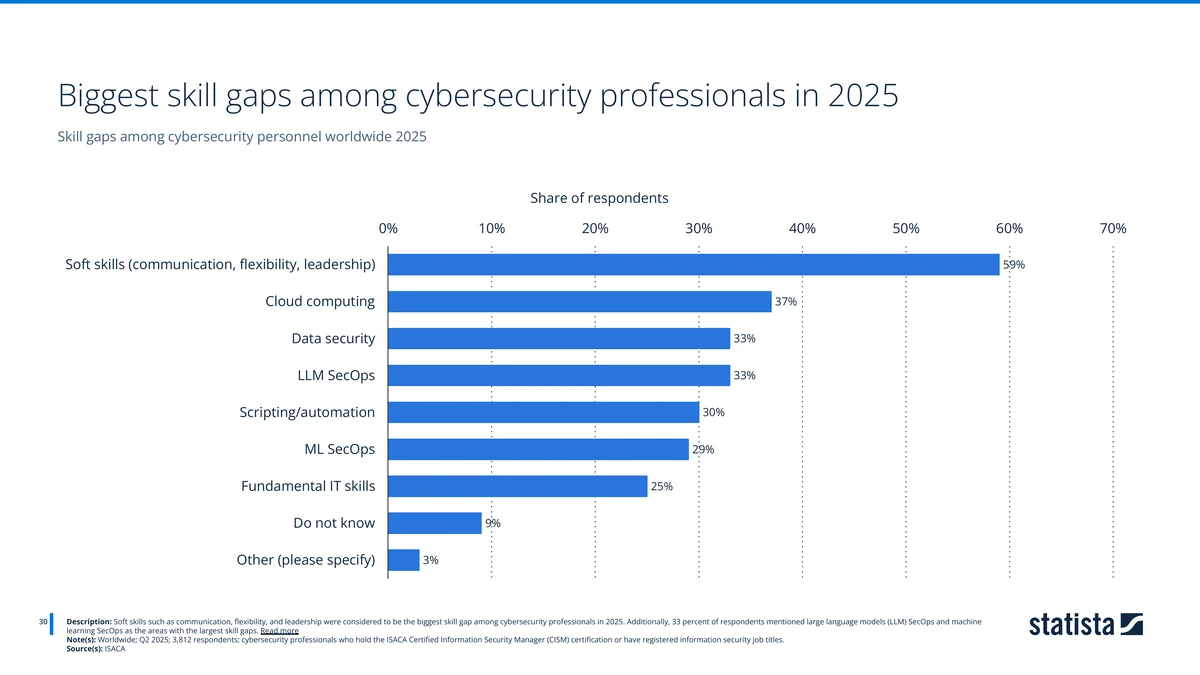
Cloud computing is the largest technical skill gap in the security profession at 37%, second only to soft skills (59%), ahead of data security and LLM SecOps (both 33%). Among 3,812 certified security professionals, the constraint on securing cloud infrastructure is people who understand it.
About the author
Emma Davies is a Data Analyst at TechnologyChecker with five years of experience turning technographic detection data into prospect intelligence. She holds a BSc in Data Science from Cardiff University, the Google Data Analytics Professional Certificate, and the Tableau Desktop Certified Associate qualification, and works daily on technology adoption patterns across millions of domains.
I want to be specific about the work behind this one, because a statistics roundup is easy to assemble and hard to trust.
I read all 33 pages of the source dossier rather than its summaries, and that is what produced the four corrections listed below. The most consequential is the workload-depth chart: its caption states that 26% of respondents run significant workloads on AWS, and the plotted bars clearly show 26% is some workloads while significant workloads is 53%. Reproducing the caption would have inverted the central finding of this report and understated AWS's commitment lead by 27 points.
The Q2 2026 growth rate took the most work to stand behind. I found 37% in the source and 19% in circulation, so I reconciled it three ways before publishing: 37% implies a Q2 2025 base of $30.82 billion, which is 0.96× the 2025 quarterly average and therefore plausible for a business growing through the year, where 19% implies $35.49 billion, or 1.10× the average, which would require the first half of 2025 to have outgrown the second. Subtracting the implied quarters from the reported $148.4 billion trailing-twelve-month figure gives a Q1 2026 of $37.57 billion and a Q1 growth rate of 28.2%, which matches the unlabelled 2026 points on the growth chart. Three independent checks, one answer. The 19% figure is AWS's mid-2025 rate, a year stale.
The conversion-rate column in the workload table is mine rather than a survey output: Flexera publishes workload depth per provider and never divides it, so I did.
The section drawn from our own detection data is the one I was most careful to constrain. We detect AWS on 5.3 times as many domains as Azure, and reporting that ratio as a market share would have been the easy and flattering choice. It would also have been wrong, because AWS is partly identified through DNS-level nameserver delegation while Azure is identified through narrower application-layer signatures. A broader rule finds more domains. I have published the composition of the detected base, which the data supports, and explicitly not its size, which it does not.
Methodology
Scope
Worldwide, covering 2013 to Q2 2026. The report combines three bodies of evidence: company financials as reported by Amazon, third-party market-sizing and survey data from named research firms, and TechnologyChecker.io's own technology detection data. Every figure carries the year or quarter it describes, because the series end at different dates. The financial data runs to Q2 2026 while the workload-depth survey stops in winter 2024.
Source table
| Source | What it provides | Period covered |
|---|---|---|
| Amazon | AWS segment revenue (annual, quarterly, TTM), growth rates, operating income and margin, Amazon segment and product-group breakdown | 2013 – Q2 2026 |
| Gartner | Public cloud market sizing, segment forecasts, worldwide IaaS vendor share | 2015 – 2025 |
| Flexera | Enterprise adoption (>1,000 employees), workload depth (759 cloud decision makers), private cloud usage; 2026 State of the Cloud added | 2017 – 2026 |
| Wikibon | Hyperscaler IaaS and PaaS market share | 2020 – 2024 |
| Canalys | Quarterly cloud infrastructure services vendor share | Q4 2017 – Q4 2024 |
| Synergy Research Group | Cloud infrastructure spend and vendor share | Q1 – Q2 2026 |
| Microsoft | Azure quarterly revenue growth | FY2020 – FY2025 |
| Alphabet; Google | Google Cloud segment revenue | 2017 – 2025 |
| PwC; PwC India | Technologies shaping the cyber threat environment (4,042 respondents) | 2025 |
| Check Point Software Technologies; Cybersecurity Insiders | Cloud security priorities (813 respondents) | 2024 |
| ISACA | Cybersecurity skill gaps (3,812 respondents) | Q2 2025 |
| Cloudflare Radar | Hyperscaler origin request share, regional split, handshake latency, connection failures (radar/origins/*) |
2–30 August 2026; January to September 2026 and Q3 2025 to Q3 2026 (October 2026 update) |
| TechnologyChecker.io | Detected AWS domains by company size, country, industry and service | August 2026; live count and industry over-index September 2026 |
Figures for 2013–2025 were compiled from a Statista company dossier assembled in August 2026 that aggregates the named research firms above; attribution throughout is to those primary sources rather than to the aggregator. The Q1 and Q2 2026 share figures were taken from Synergy Research Group's own quarterly publications (29 April and 30 July 2026), not from trade-press coverage of them.
How the charts were built
Charts in this report take one of two forms, and the split is a data-fidelity rule rather than a design choice.
Where the source labelled every data point, the series was rebuilt as an interactive chart from the printed values. Those are the twelve embedded charts above; each carries its own accessible data table and cites its primary source rather than the aggregator.
Where the source labelled only some points — the Canalys quarterly series, the AWS and Azure growth curves, the Amazon segment stack, the enterprise adoption lines, the published chart image is reproduced as-is and no intermediate value was read off the gridlines. Those series are described qualitatively, and only endpoints or values stated in the source's own caption are quoted as figures. Reading an unlabelled axis to three significant figures injects error that no reader can audit, so this report does not do it.
Transcription was cross-validated against independent series. AWS's annual revenue chart and the Amazon product-group table agree at $128.73 billion for 2025. Amazon's stated 2025 segment totals reconcile to the reported company total: $426B North America plus $162B international plus $128.73B AWS gives $716.73B against a reported $717B. The Q2 2026 growth rate was reconciled against the annual and trailing-twelve-month figures as described in the author's note above.
Limitations
- Flexera's adoption and workload-depth series survey different populations. Adoption covers enterprises above 1,000 employees; workload depth covers 759 cloud decision makers at organisations of all sizes. The two are reported separately here and should not be read as one group.
- The workload-depth survey predates the AI surge. Flexera's fieldwork ran in winter 2024. The commitment-gap finding is the most important in this report and is also its oldest data, unrepeated since AWS's growth rate roughly tripled.
- Market-share series disagree because they measure different universes. Gartner's IaaS-only share puts AWS at 37.7% for 2024; Wikibon's four-hyperscaler share puts it at 51.3%; Canalys's whole-infrastructure share puts it at 33% for Q4 2024 and Synergy's at 28% for Q2 2026. These are not contradictions and should not be plotted on one line.
- The Canalys and Synergy figures are different sources. AWS moving from 33% to 28% spans a methodology change as well as six quarters. It is not a clean like-for-like decline.
- The profitability figures are not from the dossier. AWS's Q1 2026 operating income, its 37.7% margin and its share of Amazon's operating income come from Amazon's reported quarterly results, corroborated across trade coverage. The dossier behind the rest of this report carries no margin data.
- Microsoft does not disclose Azure revenue in dollars, only growth percentages, and reports on a financial year offset from the calendar. Every AWS-versus-Azure revenue comparison in circulation is an estimate.
- Migration counts measure detection changes, not contract changes. A CDN placed in front of an AWS origin moves the signal a crawler sees while the origin stays put, which is why the Cloudflare corridor is reported as complement rather than churn.
- Segment definitions are not like-for-like. Amazon reports AWS as infrastructure only. Microsoft's commercial cloud includes Microsoft 365 and Alphabet's Google Cloud segment includes Google Workspace.
- Cloudflare Radar measures one network's view, not the internet's. The origin figures describe requests travelling from Cloudflare's edge to each provider. Traffic that never crosses Cloudflare is invisible to it, and a provider whose customers sit disproportionately behind Cloudflare will be over-represented. It is a large sample, not a census.
- Traffic share is not spend share, and the two rank the field differently. Google Cloud is 26.46% of hyperscaler origin traffic and 15% of cloud infrastructure spending. Requests are cheap; committed enterprise contracts are not.
- The 12-week traffic trend is corroboration, not proof. Three months is a short window, and Radar's own coverage shifts as customers move on and off the network.
- Our detection data measures composition, not size. Counts describe each platform's public web footprint. Because platforms are identified through different technical signatures, and because a crawler cannot see workloads without a public domain, absolute counts are not comparable between vendors and are not a proxy for revenue or market share.
- Detection denominators differ by breakdown. Company size resolves for 446,064 of 936,363 detected domains; the country and industry breakdowns resolve for different subsets again. Counts are published rather than shares wherever the denominator would mislead.
Corrections made to source material
Four errors in the source dossier were identified during this analysis and corrected rather than reproduced.
- Workload depth. The caption states that "around 26 percent of respondents reported running significant workloads on Amazon Web Services (AWS)." The plotted bars show 26% running some workloads and 53% running significant workloads. The chart values are used throughout.
- IaaS vendor share. The caption states that "Amazon generated around 37.7 billion U.S. dollars from the sale of infrastructure as a service (IaaS), giving it a market share of approximately 39 percent." 37.7 is Amazon's 2024 share in percent, not a dollar figure, and 39% is its 2023 share. This report uses 37.7% for 2024.
- SaaS market size. The caption states the market "was worth approximately 250 billion U.S. dollars and estimated to reach 299 billion U.S. dollars by 2025." The chart labels $250.8B against 2024 and $299.07B against 2025.
- Hyperscaler share period. The chart's final column and its own caption both give 2024, while its note reads "Worldwide; 2025; *Forecast." The 2020–2024 range shown on the chart is used.
Corrections made to our own material
Five errors in earlier versions of this report and its companion were found in review and corrected. They are listed because a statistics page that hides its own corrections is worth less than one that publishes them.
- Synergy market share was wrong, and the cause was the sourcing route. Earlier versions gave AWS 30%, Azure 25% and Google Cloud 13% for Q1 2026, citing Synergy Research Group but taking the numbers from trade-press coverage. Synergy's own releases give 28% / 21% / 14% for Q1 2026 ($128.6B, 29 April 2026) and 28% / 20% / 15% for Q2 2026 ($143.4B, 30 July 2026). The big three total was 68% and is 63%. All figures now come from Synergy's publications directly.
- An arithmetic comparison was simply wrong. The report said AWS's $21.17 billion of 2025 revenue growth "exceeded its entire 2018 revenue", while its own table gives 2018 as $25.66 billion. $21.17 billion exceeds 2017 ($17.46 billion), not 2018.
- Two Flexera populations were being blended. The adoption series (79% AWS, 77% Azure) surveys enterprises above 1,000 employees; the workload-depth series (53% / 46% / 19%) surveys 759 cloud decision makers across all organisation sizes. The depth figures were described as "enterprises" in several places and are now scoped correctly, with Flexera's 2026 report added alongside.
- Our Google Cloud statistics report previously gave AWS's Q2 2026 growth as "roughly 19%", which is AWS's mid-2025 rate. It has been corrected to 37% and reconciled as described above.
- One Synergy figure survived the first correction. The "What to watch" section still said "Synergy has it at 30%" after correction 1 replaced the trade-press figures everywhere else. It now reads 28%, matching Synergy's Q1 and Q2 2026 releases (corrected 1 October 2026).
What changed in this report
Q3 2026 traffic, a 2026 monthly table, and one leftover correction
Added a direct answer to "What's the market share of AWS?" and a Q3 2026 analysis from Cloudflare Radar: AWS received 55.32% of requests to the four hyperscaler origins in Q3 2026, down from 60.79% a year earlier, with Azure up to 16.79%. Added a January to September 2026 monthly table, a live request-share chart, the September 2026 crawl count (1,026,685 domains) and an industry over-index. Corrected a leftover "Synergy has it at 30%" to 28% (correction 5). The August traffic section is kept as published, with a note pointing to the new figures.
The previous Fresh Data note read, as published: "Traffic and origin figures were re-queried from Cloudflare Radar on 30 August 2026 and cover 2–30 August 2026. Financial data runs to Q2 2026; the Flexera workload survey is the oldest input at winter 2024, and is flagged wherever it is used."
Synergy figures re-sourced, three corrections applied
External review found three errors, all now fixed and documented under corrections. The substantive one: Synergy market-share figures were taken from trade press and did not match Synergy's own releases. Replaced with the primary publications — AWS 28%, Azure 20%, Google Cloud 15% for Q2 2026 on $143.4 billion. Also corrected an arithmetic comparison against 2018 revenue that should have referenced 2017, and separated two Flexera survey populations that were being described interchangeably. Added Flexera's 2026 report and Amazon's 2025 operating income in dollars.
Added a sixth denominator: traffic
Queried Cloudflare Radar for origin-request share and added it as a sixth measurement of AWS's position, at 55.55% of hyperscaler origin traffic for 2–30 August 2026. It uses the same four-vendor denominator as Wikibon's spending series, which makes it the closest like-for-like comparison in the report.
- Added the 12-week traffic trend, which shows AWS down 2.72pp while Azure gains 2.08pp — the same direction the spending series report, from an independent mechanism
- Added handshake latency and a failure-rate index normalised against each provider's traffic share
- Added the regional concentration figure: 43.69% of AWS origin traffic goes to us-east-1
Rebuilt twelve of the source charts as interactive charts, keeping the rest as published images where the source labelled only some data points. Added Q1 2026 revenue, the operating-income share, and three questions readers were asking that the first version did not answer.
Initial publication, covering 2013 to Q2 2026 with four corrections to the source material and one to our own Google Cloud report.
Frequently asked questions
What is AWS's market share in 2026?
There is no single answer, and the differences are definitional rather than disputes. AWS held 28% of global cloud infrastructure services spend in Q2 2026 according to Synergy Research Group, against Azure's 20% and Google Cloud's 15%. Canalys measured 33% for Q4 2024. On Gartner's narrower IaaS-only definition AWS held 37.7% in 2024. Counting only the four hyperscalers, Wikibon puts AWS at 51.3%. On traffic, AWS received 55.32% of requests to the four hyperscaler origins in Q3 2026, down from 60.79% a year earlier (Cloudflare Radar). Each figure is correct for the market it measures.
How much revenue does AWS make?
AWS generated $128.73 billion in 2025, up 19.7% on 2024's $107.56 billion. In Q2 2026 it reported $42.23 billion for the quarter and $148.4 billion on a trailing-twelve-month basis. AWS is 17.95% of Amazon's $717 billion in 2025 consolidated net sales.
Is AWS growth slowing down?
No — it reversed. AWS growth fell from about 37% in Q1 2022 to a trough near 13% in 2023, then rose in every quarter since, reaching 37% year over year in Q2 2026 excluding foreign-exchange effects. In absolute terms AWS added $21.17 billion of revenue in 2025, the largest single-year increase in its history.
Is Azure catching up to AWS?
On some measures. Wikibon's hyperscaler-only series shows AWS falling from 58.3% to 51.3% between 2020 and 2024 while Azure rose from 23.9% to 32.4%. Gartner shows AWS's IaaS share falling 14.1 points since 2017 while Microsoft's rose 10.6. But Canalys's broader series shows AWS holding roughly 30% to 33% across seven years, meaning Azure's gains came largely from the long tail of smaller providers rather than from AWS. Azure also reaches slightly more of Flexera's respondents (92% against 89%) while converting fewer of them to production workloads (50% against 60%).
Who is AWS's biggest competitor?
Microsoft Azure. Synergy Research Group put Microsoft at 20% of cloud infrastructure spending in Q2 2026 against AWS's 28%, and Azure is the provider taking AWS's share of hyperscaler traffic: its share of requests to hyperscaler origins rose from 11.75% in Q3 2025 to 16.79% in Q3 2026 while AWS's fell from 60.79% to 55.32% (Cloudflare Radar).
How many enterprises use AWS?
79% of enterprises with more than 1,000 employees reported adopting AWS in 2025, against 77% for Azure and 45% for Google Cloud (Flexera, 759 respondents). Adoption breadth for both AWS and Azure has been flat since around 2021; the meaningful difference between them is workload depth, not reach.
Why are people moving away from AWS?
Mostly they are not, and our own migration data shows why the question keeps getting asked. The largest apparent outflow from AWS is 26,591 domains to Cloudflare in 90 days. But Cloudflare is overwhelmingly a complement, not a replacement. Putting Cloudflare in front of an AWS origin changes the nameservers and response headers a crawler sees, so the origin stays on AWS while the detection moves. The same corridor runs 4,532 domains the other way.
The genuinely competitive corridor tells a different story: against Microsoft Azure, AWS lost 329 domains and gained 311 over the same window, a net difference of 18 domains, which is noise. Real substitution shows up mainly at the small-project end, where Vercel took a net 1,466 domains. Across our whole crawl, 40,188 domains that once returned AWS signatures no longer do.
Who uses AWS the most?
By detected domains, Software Development leads with 33,761, followed by IT Services and IT Consulting (23,673), Retail (20,723), Technology and Internet (19,837), Real Estate (17,217) and Financial Services (15,601). By country the United States dominates at 187,397 domains, ahead of the United Kingdom (39,677) and Australia (26,339). By company size the base is overwhelmingly small: 80.4% of resolved domains have 50 or fewer employees. Note that this measures public web presence rather than cloud spend, where the ordering would look very different. Relative to the whole web, the strongest lean in the September 2026 crawl is Software Development, at 3.1 times its average share.
What does AWS stand for?
AWS stands for Amazon Web Services, Amazon's cloud computing platform. It launched in 2006 and now spans 124 Availability Zones across 39 geographic regions. Amazon reports it as a separate business segment covering infrastructure services only: compute, storage, networking, databases and managed platform services — which is why its revenue is not directly comparable to Microsoft's commercial cloud or Alphabet's Google Cloud segment, both of which bundle software subscriptions.
How many websites use AWS?
TechnologyChecker detects AWS on 1,026,685 of the 29.9M live business domains we crawl, as of the September 2026 crawl, the most of any platform in the PaaS category. In August 2026 Amazon S3 was detected on 659,040 domains and Amazon CloudFront on 397,677. These counts measure public web presence, not cloud spend, and are not comparable to other vendors' counts because each platform is identified through different technical signatures.
What to watch
AWS's numbers describe a business that was widely written off as mature two years ago and is now growing faster than it has since 2022. Revenue is compounding at 37% on a $148.4 billion base, the segment added more absolute dollars in 2025 than in any prior year, IaaS is the fastest-accelerating segment of the cloud market, and AWS converts enterprise contact into production workloads at a rate no competitor approaches.
Against that, its share is drifting down on every narrow measure. Gartner has it 14.1 points below its 2017 peak. Wikibon has it losing 7 points in four years to an Azure gaining 8.5. Synergy has it at 28% where Canalys had 33%. And its adoption breadth has not widened since 2021. The last four years of revenue growth came from existing customers spending more, not from reaching new ones.
Both things are true because they measure different questions. The share series ask whether AWS is capturing a growing share of a growing market, and the answer is no. The revenue series ask whether AWS is growing, and the answer is emphatically yes. A vendor can lose share every year and still be the fastest-growing business in absolute terms when the market is expanding 21.5% annually.
The number that will settle it is the one nobody has re-measured: 53%. If the share of organisations running significant workloads on AWS holds while Azure's 46% and Google Cloud's 19% climb, the share erosion is real and structural, and the current growth is an AI cycle borrowed against it. If 53% holds or widens through the AI build-out, then AWS is doing what it has done since 2017: conceding percentage points at the edges of a market it still anchors, while the market grows fast enough that the points do not matter.
Flexera last asked in winter 2024. Watch for the next one.
Related research

Data Analyst
5+ years of experience
Emma is a Data Analyst at TechnologyChecker, where she analyses technology adoption data to build better prospect lists and uncover actionable patterns for sales teams.
- BSc Data Science, Cardiff University
- Google Data Analytics Professional Certificate
- Tableau Desktop Certified Associate
Never miss our research