Cloud Provider Traffic Share in 2026: AWS, Google Cloud, and Azure's Share of Internet Traffic (July 2026 Update)
How much internet traffic do AWS, Google Cloud, and Azure carry, and how fast are their networks? Cloudflare Radar NetFlows put the Big Three near 7.85% of global traffic. Refreshed for the Q2 2026 close with the first year-over-year layer on cloud connection quality and region concentration: AWS improved most (fastest path and first byte), Oracle's us-ashburn-1 crossed 50% of its traffic, and Azure's sovereignty regions in Brazil, Poland, and India finally activated.
Published •Updated •54 min read

AWS, Google Cloud, and Microsoft Azure collectively carry 7.85% of all global internet traffic as of May 2026 — about 1 in every 13 bytes — based on Cloudflare Radar NetFlows data. We first published this on the Q1 2026 baseline (7.57%) and have since pulled clean per-calendar-month data through May. The monthly view tells a sharper story than the quarterly one: Google Cloud, not Azure, was the real traffic-share gainer of 2026, climbing from 2.39% in January to a 2.95% peak in April before settling at 2.87% in May. Azure's headline Q1 number — a 58% year-over-year jump — is real, but it benchmarks against a weak year-ago base; within 2026, Azure actually dipped to 1.43% in March and has since recovered to 1.70%.
What the Q1 2026 Cloudflare Radar data shows (with the June 2026 month-by-month update layered on top):
- June 2026 update — A clean per-calendar-month pull (Jan–May) puts the Big Three at 7.85% of global traffic in May. Google Cloud was 2026's real share-gainer — 2.39% in January to a 2.95% peak in April, settling at 2.87% in May — not Azure, which dipped to 1.43% in March and recovered to 1.70%. AWS held flat near 3.3% all year. us-east-1 plateaued at 43.2% of AWS requests (above Q1's 41.5%, through the me-central-1 outage), and Azure's global-routing share fell to 46.4% as named regions — including a brand-new Brazil South — absorbed traffic. Full month-by-month breakdown below.
- AWS carries 3.40% of all global internet traffic (roughly 1 in 29 bytes) and still leads
- Azure jumped to 1.61%, up 58% year over year, pulled by AI infrastructure and Microsoft 365 migration
- Google is shuffling traffic between ASNs — its cloud-specific AS396982 grew 56.8% while the main network shrank
- Six cloud and cloud-adjacent networks (AWS, Google, Meta, Microsoft, Akamai, Hetzner) handle over 11% of all internet traffic combined
- North America cloud providers carry nearly 1 in 6 bytes. In Asia, they barely register against mobile operators
- Hetzner carries more European traffic than AWS — data sovereignty is doing the work
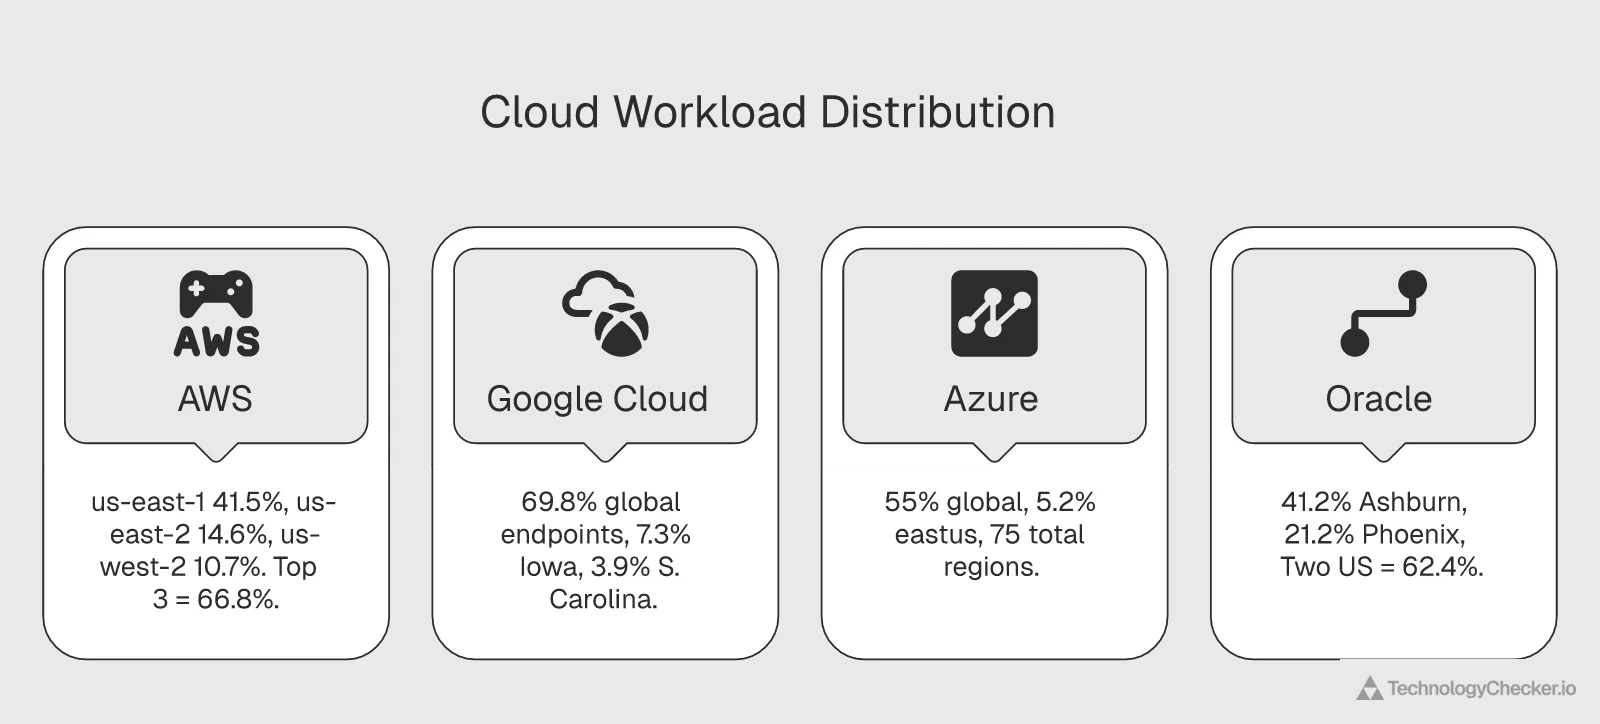
- A single AWS datacenter region (us-east-1) handles 41.5% of AWS requests globally
These numbers tell a different story than the revenue reports you've probably already seen. Synergy Research Group put the Big Three at 63% of enterprise cloud spending in Q3 2025, with AWS at 29%, Microsoft at 20%, and Google at 13%. Revenue and traffic measure two different things. Revenue is what companies pay. Traffic is what actually runs over the wire.
At TechnologyChecker we track technology adoption across 29.9 million active domains, so we spend a lot of time watching cloud infrastructure patterns shift quarter by quarter. The Cloudflare Radar data gives us something revenue reports can't: actual bandwidth consumption. We pulled the ASN-level data for every major cloud provider, broke it down by continent and region, and cross-checked it against Cloud Observatory request distribution.
Here's what traffic share tells us that dollar figures don't.
Updated July 2, 2026 for the Q2 close. This refresh does something the earlier updates couldn't, and it comes with an honest boundary. Cloudflare's Radar API cleanly exposes two of this post's datasets on historical windows: the cross-provider connection scorecard (how fast each cloud's origins respond) and the per-provider region distribution (where each cloud's requests actually land). Both now have a full year of comparison behind them, a clean Q2 2025 against Q2 2026. The one dataset the API does not expose as a re-pullable historical share is the NetFlows traffic-share spine, the "AWS carries 3.28% of global bytes" figure. Those numbers live in Cloudflare's aggregated Cloud Observatory view, not an endpoint I can query for a specific past quarter, so I'm not restating them for Q2; the clean per-month series through May below remains the freshest share read. What I can add, and what turns out to be the more interesting story this quarter, is the year-over-year picture of connection quality and region concentration.
Cloud Connection Quality and Region Concentration at the Q2 2026 Close, Year Over Year
The June update froze a single week of latency data (June 2–9). Pulling the full Q2 quarter and the same quarter a year earlier turns that snapshot into a trend, and the trend has a clear winner and a clear cautionary tale.
The connection scorecard, now with a year behind it
Here is the cross-provider scorecard over three windows, every figure a RAW_VALUES median in milliseconds measured from Cloudflare's edge to each provider's origins. Lower is faster.
| Metric | Provider | Q2 2025 | Q1 2026 | Q2 2026 | YoY |
|---|---|---|---|---|---|
| TCP handshake | 49.5 | 42.8 | 48.6 | −0.9 (leader) | |
| Amazon | 53.8 | 41.8 | 53.7 | −0.1 | |
| Microsoft | 52.8 | 57.4 | 63.6 | +10.7 | |
| Oracle | 83.1 | 79.8 | 77.2 | −5.9 | |
| TLS handshake | 64.1 | 54.3 | 74.9 | +10.8 | |
| Amazon | 73.6 | 64.4 | 86.6 | +12.9 | |
| Microsoft | 91.8 | 95.2 | 92.2 | +0.4 | |
| Oracle | 121.1 | 106.2 | 102.2 | −18.8 | |
| TCP RTT (path) | Amazon | 38.4 | 29.2 | 29.1 | −9.3 |
| 40.4 | 35.6 | 33.1 | −7.3 | ||
| Microsoft | 44.4 | 45.7 | 42.9 | −1.5 | |
| Oracle | 53.3 | 50.6 | 48.6 | −4.8 | |
| Response header (first byte) | Amazon | 116.9 | 84.9 | 89.9 | −27.0 |
| 130.9 | 134.0 | 122.3 | −8.6 | ||
| Microsoft | 161.1 | 123.9 | 130.3 | −30.7 | |
| Oracle | 130.4 | 166.1 | 183.5 | +53.1 |
Source: Cloudflare Radar — origins/summary/origin (Cloud Observatory), metric = tcp_handshake_duration / tls_handshake_duration / tcp_rtt / response_header_receive_duration, Q2 2025 / Q1 2026 / Q2 2026, pulled 2026-07-02.
AWS quietly won the year on the metrics that carry payloads
The clearest year-over-year story here is Amazon. On the two metrics that decide how fast real data moves once a connection exists, AWS improved more than anyone and now leads both. Its path latency (TCP RTT) dropped from 38.4 ms to 29.1 ms, and its time to first byte fell from 116.9 ms to 89.9 ms, a 27-millisecond improvement that puts it well clear of the field. A year ago AWS was middle-of-pack on both; now it's the fastest cloud to actually deliver a response. That reinforces the split I flagged in the June snapshot, where Google won the handshake and AWS won the payload. Over a full year the payload half of that split got more decisive: Google still sets up connections fastest (48.6 ms TCP handshake, essentially unchanged), but AWS moves the bytes fastest by a widening margin.
The handshake numbers are noisier and worth a caveat. Both Google and AWS show higher TLS-handshake times in Q2 2026 than in Q2 2025, and Q1 2026 reads unusually low across the board, so I'd treat the handshake column as bouncing inside a band rather than trending. The RTT and first-byte columns, which moved consistently in the same direction across all three windows, are the ones I'd act on. Those say AWS's network path got materially faster over the year.
Oracle narrowed the handshake gap and then blew out on first byte
Oracle is the cautionary tale, and it's a more interesting one than "Oracle is slow." A year ago Oracle's problem was setup: it was 30-plus milliseconds slower than everyone on the TLS handshake. Over the year it fixed a lot of that, cutting its TLS handshake from 121.1 ms to 102.2 ms and its TCP handshake from 83.1 ms to 77.2 ms. But its time to first byte went the other way, and hard, from 130.4 ms to 183.5 ms, a 53-millisecond regression that leaves it slowest by a wide margin. A year ago Oracle's first-byte time (130.4 ms) actually beat Azure's and roughly tied Google's; now it's nearly double AWS's. Oracle got faster to shake hands and slower to answer, and the region data explains why. Azure, meanwhile, is the one Big Three provider whose setup got clearly worse: its TCP handshake rose from 52.8 ms to 63.6 ms over the year, the largest handshake regression in the table.
Region concentration went the "wrong" way at both AWS and Oracle, and Azure's regions finally woke up
The connection story and the location story are the same story. Here's where each provider's requests actually landed, a year apart.
| Provider | Top region | Q2 2025 | Q2 2026 | YoY |
|---|---|---|---|---|
| Amazon | us-east-1 (N. Virginia) | 38.69% | 43.60% | +4.91 pt |
| Oracle | us-ashburn-1 | 33.46% | 50.42% | +16.96 pt |
| Microsoft | global routing | 52.94% | 47.15% | −5.79 pt |
| global routing | 69.63% | 67.77% | −1.86 pt |
Source: Cloudflare Radar — origins/summary/region (Cloud Observatory), metric = requests, per provider, Q2 2025 / Q2 2026, pulled 2026-07-02.
Two providers concentrated harder into a single US region over the year, which is the opposite of the multi-region resilience everyone says they practice. AWS's us-east-1 climbed from 38.7% to 43.6% of all AWS requests, deepening the Northern Virginia gravity well the post has tracked since it launched. Oracle went further and crossed a line: us-ashburn-1 jumped from 33.5% to 50.4%, so more than half of all Oracle Cloud requests now hit a single Virginia datacenter, and Ashburn plus Phoenix together handle 71.7% of OCI traffic (up from 57.2% a year ago). That is the mechanical reason Oracle's first-byte time blew out. When you funnel half your global traffic through one US-East region, every edge outside that corridor pays a distance tax on the response, and the year-over-year first-byte regression is that tax showing up in the numbers.
Azure is the counter-example, and it settles a question the earlier editions kept flagging. A year ago 52.9% of Azure requests disappeared into global anycast routing, and the post carried a caveat that Azure "has the most regions but most don't carry traffic." That caveat is now retired on year-over-year evidence: global routing fell to 47.2%, below half, and the traffic it shed went to named sovereignty regions that simply weren't carrying meaningful load a year ago. Brazil South (4.58%), Poland Central (3.50%), and Central India (3.40%) are all new to Azure's top tier since Q2 2025, when its leading regions were still all US and Western European. Azure's 75-region footprint stopped being a press-release number and became an operational one over the course of the year.
Everything below this point is the earlier record, preserved in full: the June 2026 refresh (the clean month-by-month NetFlows share series through May, which remains the freshest traffic-share read) directly following, then the Q1 2026 baseline, the regional maps, the workload-region deep dives, and the methodology. The traffic-share percentages there are the latest the Radar API exposes; this Q2 layer adds the connection-quality and region-concentration year-over-year picture on top of them.
How Did Cloud Provider Traffic Share Change Between Q1 2026 and May 2026?
According to Cloudflare Radar's Cloud Observatory and NetFlows, the Big Three carried 7.85% of all global internet traffic in May 2026 — essentially flat against April's 7.89% and up from the 7.57% Q1 baseline. Underneath that steady top line, the composition kept moving: AWS eased to 3.28%, Google Cloud cooled from its April peak to 2.87%, and Azure recovered to 1.70%. We re-pulled every metric on clean per-calendar-month windows for January through May to see which Q1-and-April trajectories held, which reversed, and which were artifacts of the measurement window. Updated June 1, 2026.
In April I called Google the breakout story and Azure a plateau. May forced me to revise both reads — and the correction is more interesting than either original call. Pulling the clean monthly series rather than quarterly snapshots showed that Google had been climbing steadily since January (2.39% → 2.60% → 2.66%), so April's jump to 2.95% was an acceleration of a trend already in motion, not a one-month spark; May's slip to 2.87% says that climb is consolidating, not compounding. Azure didn't "plateau" either — it dipped to 1.43% in March, which is what dragged the Q1 average down to 1.61%, then clawed back to 1.70% by May. The lesson this dataset keeps teaching: a single month, and especially a quarterly average, will hand you a tidy narrative that the next clean pull quietly dismantles. The honest version is messier than either the Q1 or the April story — and it's the one worth acting on.
How Did Global Cloud Traffic Share Shift From Q1 2026 Through May 2026?
| Provider | Q1 2026 | April 2026 | May 2026 | Direction (Q1→May) |
|---|---|---|---|---|
| Amazon (AWS, AS16509+AS14618) | 3.40% | 3.32% | 3.28% | Slow ease, still #1 |
| Google (AS15169+AS396982) | 2.55% | 2.95% | 2.87% | Net gain, off the April peak |
| Microsoft (Azure, AS8075) | 1.61% | 1.62% | 1.70% | Recovered from a March dip |
| Big Three Total | 7.57% | 7.89% | 7.85% | Up ~0.28 pt |
| Meta (AS32934) | 1.62% | 1.56% | 1.43% | Easing |
| Akamai (AS36183) | 1.12% | 1.03% | 1.04% | Eased, then flat |
| Hetzner (AS24940) | 1.07% | 1.06% | 1.00% | Easing |
| Extended Cloud Total | ~11.37% | ~11.54% | ~11.32% | Roughly flat |
Which Q1-and-April Narratives Did May Confirm, Reverse, or Revise?
1. Google was 2026's real share-gainer — and April was the peak, not the launch. In Q1 we read Google's flat aggregate as a migration finishing: traffic shifting from the legacy AS15169 to the cloud-dedicated AS396982. April made that look like a sudden surge, with AS396982 vaulting to 1.37% of global traffic in one month. The clean monthly series corrects both reads. Google's combined network climbed every month of Q1 (2.39% → 2.60% → 2.66%) before reaching its 2.95% April peak — a steady accumulation, not a spark. May settled at 2.87% (AS15169 1.54%, AS396982 1.33%), giving back a little off the peak but holding far above where the year started. Net: Google added more share across 2026 than either other hyperscaler, and it's still closing on AWS — just not at the single-month pace April implied.
2. Azure's "plateau" was actually a March dip followed by a recovery. April's reading (1.62%, flat against the Q1 1.61% average) looked like Azure had stalled. The monthly pull shows what really happened: Azure ran at 1.72%–1.73% in January and February, dropped to 1.43% in March, then recovered to 1.62% in April and 1.70% in May. The Q1 average of 1.61% was depressed by that single March pothole — not by a structural slowdown. So the AI-and-Microsoft-365 thesis didn't stall; one weak month did. By May, Azure is back within a rounding error of its winter peak, a more durable signal than either the Q1 average or the April "flat" read suggested.
3. AWS's us-east-1 concentration plateaued near its April high — it did not retreat. Q1 put us-east-1 at 41.5% of all AWS requests; April spiked it to 43.6%; May held at 43.25%, with the top three US regions steady at 67.6%. The Iranian-strike outage on AWS's me-central-1 region — which Cloudflare's Cloud Observatory annotates as running from late March all the way to May 1 — did not push customers toward geographic diversification. Two full months of documented operational stress, and Northern Virginia's share barely moved off its high. If multi-region disaster recovery were widely practiced in production, this is exactly the window in which it would show up in the data. It didn't.
Which Cloud Regional Patterns Held Through May?
Two regional stories sharpened in May. In Europe, Hetzner's lead is now narrowing — it eased for a third straight month (3.79% Q1 → 3.64% April → 3.35% May) while AWS held near 2.27%, cutting Hetzner's lead over AWS from 1.34 points in Q1 to 1.08 in May. The April-1 Hetzner price increase showed no exodus in month one; two months on, the slow bleed is visible, even as the hyperscalers' own dedicated cloud ASNs (Azure 0.91%, Google's AS396982 1.03%) keep gaining European ground. In Asia, the mobile-operator thesis only got stronger: Reliance Jio held at 6.83% of Asian traffic (up from 5.76% in Q1), now roughly 5x AWS's flat 1.36% Asian footprint.
How Did the Big Three's North American Share Move Through May 2026?
| Provider | NA Q1 2026 | NA April 2026 | NA May 2026 | Direction (Q1→May) |
|---|---|---|---|---|
| AWS (16509+14618) | 7.67% | 6.99% | 7.19% | Eased, partial rebound |
| Google (15169+396982) | 4.88% | 6.14% | 5.67% | Big net gain, off the April peak |
| Microsoft (8075) | 4.14% | 4.22% | 4.44% | Steady climb |
| Big Three NA Total | 16.69% | 17.36% | 17.30% | Up ~0.61 pt |
In Q1 we projected Azure could pass Google in North American traffic by year-end; April blew that call up when Google's AS396982 vaulted to 3.44% of NA bytes. May splits the difference. Google eased to 5.67% NA (AS396982 back to 3.16%) — so April was partly a spike — but Google still sits well above its Q1 4.88% and remains the clear #2. Meanwhile Azure climbed for a third straight month (4.14% → 4.22% → 4.44%), quietly narrowing the Google–Azure gap back to 1.23 points (it was 1.92 in April). So the original "Azure is closing on Google in NA" thesis is alive again — just slower than Q1 implied, and now from behind Google's higher floor.
How Does the May 2026 Update Affect the Q1 2026 Findings?
The Q1 sections below remain the right baseline for where the year began — but read them knowing three things the monthly data later revealed: Azure's Q1 average was dragged down by a one-month March dip, Google's "flat" aggregate masked a steady climb that peaked in April, and AWS's us-east-1 gravity only deepened. Where May moves the picture, we've layered an update note onto each Q1 table below. The methodology, scope, and reading frame haven't changed; only the latest clean month has been added.
Month-by-month: how cloud traffic share actually moved through May 2026
The quarterly snapshot and the single-month April update each told a clean story. Neither was quite right. Pulling Cloudflare Radar NetFlows on clean per-calendar-month windows for all of 2026 so far is the only way to see what actually happened — and it's where the real breakdown lives.
Google Cloud Was 2026's Real Traffic-Share Gainer, Not Azure
Cloudflare Radar NetFlows, pulled on clean per-calendar-month windows, tells a sharper story than the quarterly average. AWS is the flat behemoth — its share never left a 3.28%–3.65% band and stayed within a third of a point of 3.30% in four of five months. Google Cloud is the genuine climber, adding roughly half a point of global share from 2.39% in January to a 2.95% April peak before settling at 2.87% in May. Azure looks flat-to-up every month except a March dip to 1.43% — the single month that dragged the Q1 average down to 1.61% and made Azure's recovery to 1.70% in May read as a 58% year-over-year surge against a weak base.
Source: Cloudflare Radar NetFlows · January 2026 – May 2026
| Month (2026) | Share of global internet traffic (%) |
|---|---|
| Jan 2026 | 3.31% |
| Feb 2026 | 3.65% |
| Mar 2026 | 3.3% |
| Apr 2026 | 3.32% |
| May 2026 | 3.28% |
- AWS held its share within a 3.28%–3.65% band all year — stable, not flat-lining, and still #1 by a wide margin
- Google Cloud added ~0.5 pt from January to its 2.95% April peak, the largest accumulation of any hyperscaler
- Azure's March dip to 1.43% is what dragged the Q1 average to 1.61% — it recovered to 1.70% by May
- The quarterly average hid all three of these; only clean monthly windows surface them
| Month | AWS | Google Cloud | Azure | Big Three |
|---|---|---|---|---|
| January 2026 | 3.31% | 2.39% | 1.72% | 7.43% |
| February 2026 | 3.65% | 2.60% | 1.73% | 7.97% |
| March 2026 | 3.30% | 2.66% | 1.43% | 7.39% |
| April 2026 | 3.32% | 2.95% | 1.62% | 7.89% |
| May 2026 | 3.28% | 2.87% | 1.70% | 7.85% |
Three patterns jump out that no quarterly average would show you.
AWS is the flat behemoth. Across five months its share never left a 3.28%–3.65% band, and four of those five months sat within 0.04 points of 3.30%. (February's 3.65% bump is the one exception — a single heavy month, not a trend.) When a network this large holds its share to within a third of a point for half a year, "stable" isn't a hedge; it's the finding. AWS doesn't need to move the needle month to month to stay #1 by a comfortable margin.
Google Cloud is the genuine climber. From 2.39% in January to a 2.95% April peak, Google added roughly half a point of global traffic share in four months — the largest accumulation of any hyperscaler in the window. May's pullback to 2.87% is the tell: this was a real climb that has started to consolidate, not a runaway. The Q1-era framing that "Google is shrinking" was an artifact of the legacy-ASN migration; the monthly view shows the combined network was growing the whole time.
Azure's March pothole is the most instructive data point in the set. Strip out March and Azure looks flat-to-up all year (1.72 → 1.73 → … → 1.62 → 1.70). Include it, and the Q1 average drops to 1.61% — which is the number the original "+58% year over year" headline was computed against. Same network, same data, two different stories depending on whether you average across a dip or read the months individually. We've kept the +58% figure in the analysis below because it's accurate against the year-ago base, but the monthly series is its honest companion: Azure recovered, it didn't surge.
The same providers anchor our own detection graph. Across the 29.9 million active domains we crawl each month, an AWS, Google Cloud, or Azure fingerprint on the origin is one of the strongest predictors of the rest of a company's stack. Traffic share tells you how big each network is; our technology detection tells you who is actually on it — see companies using Google Cloud and businesses running Microsoft Azure.
The big three: global traffic share
Amazon, Google, and Microsoft pushed 7.57% of global internet traffic through their networks in Q1 2026. A year ago the number was 6.93%. That's a 9.2% relative jump in twelve months.
| Provider | ASN(s) | Q1 2026 Share | Q1 2025 Share | YoY Change |
|---|---|---|---|---|
| Amazon (AWS) | AS16509 + AS14618 | 3.40% | 3.31% | +3.0% |
| Google (GCP) | AS15169 + AS396982 | 2.55% | 2.61% | -2.2% |
| Microsoft (Azure) | AS8075 | 1.61% | 1.02% | +58.0% |
| Big Three Total | 7.57% | 6.93% | +9.2% |
Big Three Cloud Traffic Share Q1 2026: AWS 3.40%, Google 2.55%, Azure 1.61%
AWS, Google Cloud, and Microsoft Azure collectively carry 7.57% of all global internet traffic in Q1 2026. AWS leads at 3.40% (roughly 1 in 29 bytes), Google Cloud sits at 2.55%, and Azure at 1.61%. Azure posted a 58% year-over-year traffic gain, the largest single-year increase of any hyperscaler.
Source: Cloudflare Radar · Q1 2026
| Provider | Share of Global Internet Traffic (%) |
|---|---|
| AWS | 3.4% |
| Google Cloud | 2.55% |
| Microsoft Azure | 1.61% |
- Combined, the Big Three carry 7.57% of all internet traffic in Q1 2026, up from 6.93% a year earlier
- AWS traffic share is larger than Comcast (2.5%) or AT&T (1.7%) individually
- Azure's 58% year-over-year traffic jump outpaces its 40% revenue growth, signaling heavier AI and bandwidth workloads
May 2026 update — the April surge cooled; AWS still leads. May share: AWS 3.28%, Google 2.87% (off its 2.95% April peak), Azure 1.70% (recovered from a 1.43% March dip). Big Three total 7.85%, essentially flat against April. The clean monthly series settles the Q1-vs-April argument: Google was the year's real gainer (a steady Jan→Apr climb, not a one-month spark), Azure's "plateau" was a March pothole followed by a rebound, and AWS just sits at the top, barely moving.
AWS leads at 3.40%. Put another way: roughly 1 in 29 bytes flowing across the public internet touches an Amazon network. That's more than Comcast (2.5%) or AT&T (1.7%) carry individually. The Big Three combined beat any single ISP.
The headline number is Microsoft's 58% year-over-year surge. Nothing else in the Radar dataset has grown that fast at that size. Two forces are pushing it. Azure's AI infrastructure is eating bandwidth — GPU cluster traffic is heavy, and it doesn't look like slowing. The AI data center buildout behind that bandwidth is a $400B-plus market of its own. At the same time, the Microsoft 365 migration keeps pulling enterprise email, file sharing, and collaboration onto Azure's backbone. Microsoft's Q1 FY2026 earnings showed Azure and other cloud services revenue growing 40%, which is still slower than the 58% traffic gain — bandwidth is outrunning billing.
Google's aggregate dipped 2.2%. That top-line figure hides a structural shift we'll unpack in a moment.
Revenue data from Synergy Research and Canalys puts AWS at 29%, Azure at 20%, and Google at 13%. Traffic share flips the ratio. AWS still leads, but the gap between second and third looks very different depending on whether you measure dollars or bytes. If you care about actual workload volume rather than billing, traffic share is the cleaner signal.
Beyond the big three: the extended cloud ecosystem
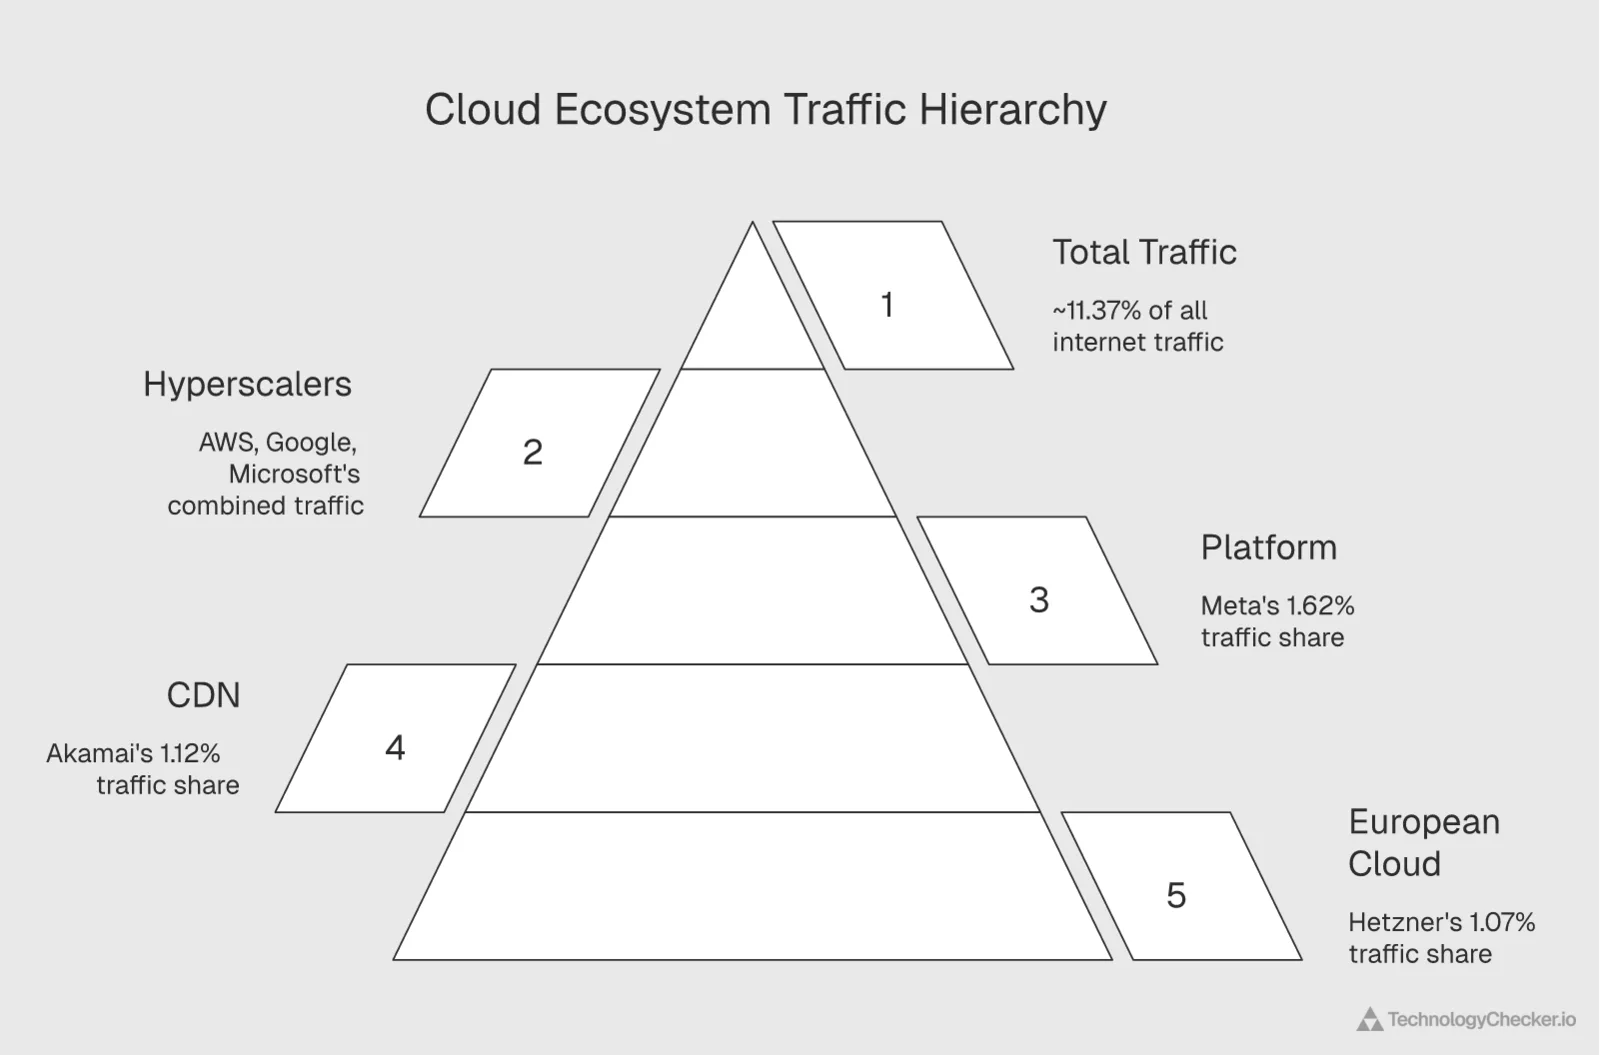
Cloud infrastructure doesn't stop at the hyperscalers. Pull Meta, Akamai, and Hetzner into the picture and six networks account for more than 11% of all global internet traffic.
| Provider | ASN | Q1 2026 Share | Category |
|---|---|---|---|
| Amazon (AWS) | 16509 + 14618 | 3.40% | Hyperscaler |
| Google (GCP) | 15169 + 396982 | 2.55% | Hyperscaler |
| Meta | 32934 | 1.62% | Platform Infrastructure |
| Microsoft (Azure) | 8075 | 1.61% | Hyperscaler |
| Akamai | 36183 | 1.12% | CDN / Cloud |
| Hetzner | 24940 | 1.07% | European Cloud / Hosting |
| Extended Cloud Total | ~11.37% |
Top 6 Cloud and Platform Networks by Global Traffic Share in Q1 2026
Six cloud and cloud-adjacent networks — AWS, Google, Meta, Microsoft, Akamai, and Hetzner — carry a combined 11.37% of all global internet traffic in Q1 2026. Meta at 1.62% essentially ties Azure. Hetzner at 1.07% handles more European traffic than AWS does.
Source: Cloudflare Radar · Q1 2026
| Provider | Share of Global Internet Traffic (%) |
|---|---|
| AWS | 3.4% |
| 2.55% | |
| Meta | 1.62% |
| Microsoft Azure | 1.61% |
| Akamai | 1.12% |
| Hetzner | 1.07% |
- Six networks carry more than 1 in 9 bytes on the public internet
- Meta (1.62%) essentially ties Microsoft Azure despite running only first-party workloads
- Hetzner punches far above its revenue weight — driven by European data sovereignty demand
May 2026 update: Extended cloud network share eased to ~11.32% in May, giving back April's small gain. Within it, Meta slipped further to 1.43%, Hetzner to 1.00%, while Akamai held at 1.04%. Azure (1.70%) now edges clear of Meta (1.43%) for the #4 cloud-adjacent ASN spot — a reversal of their April near-tie. Six networks still touch roughly 1 in 9 bytes of the public internet; the total is steady, but the mix keeps drifting away from the consumer-platform networks toward the hyperscalers.
Meta (AS32934) at 1.62% essentially ties Microsoft for fourth place globally. Its traffic isn't third-party cloud hosting, though. Meta's bytes serve Facebook, Instagram, and WhatsApp. Azure's bytes serve everyone else's applications. Same size network, totally different workload mix.
Akamai at 1.12% is the CDN layer between cloud origins and end users. Hetzner at 1.07% punches far above its revenue weight — it carries more traffic than dozens of cloud providers with bigger public profiles. We'll come back to why when we get to European traffic.
The remaining ~89% of traffic flows through traditional ISPs, telecom operators, enterprise networks, and smaller hosting providers. Cloud is growing fast. The internet is still mostly a telecom network.
These six networks touch roughly 1 in 9 bytes on the internet. If you sell infrastructure software or monitoring tools, that's the densest target market available. Check our profiles on companies that use Google Cloud and companies using Microsoft Azure to see who's running workloads here and what they buy alongside cloud.
The regional cloud map: where cloud dominance varies dramatically
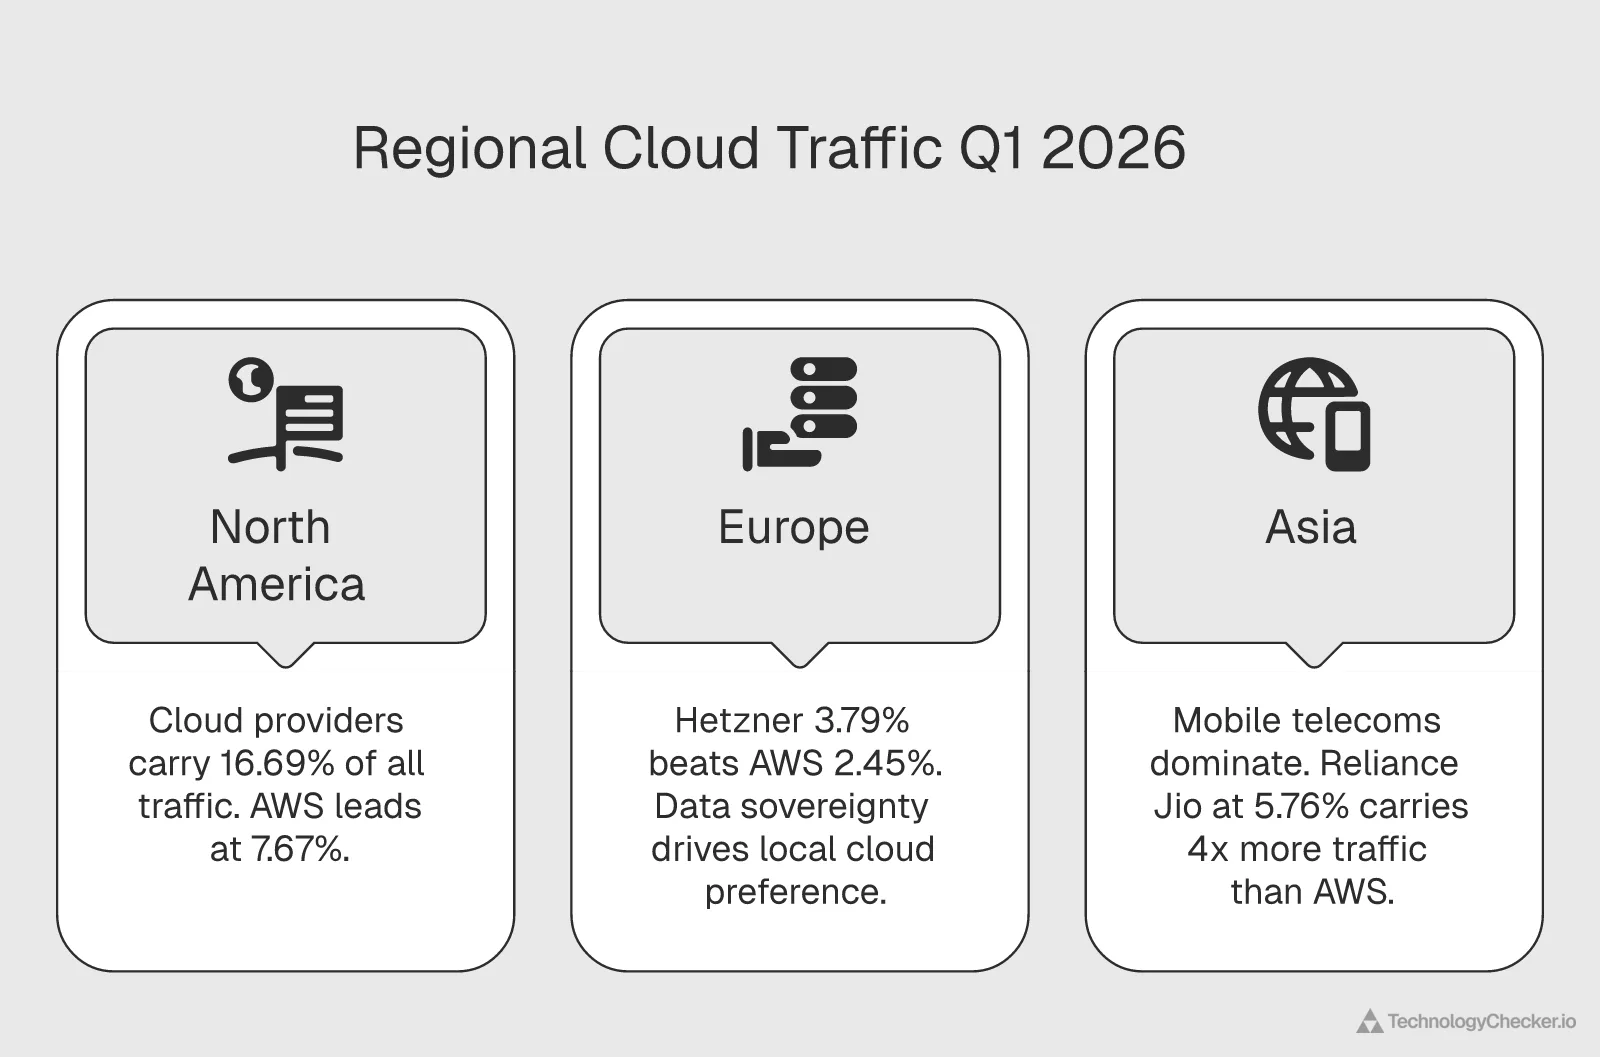
Global averages hide a lot. The hyperscalers don't carry 7.6% of traffic everywhere. In North America it's nearly 17%. In Asia they barely register against mobile telecoms. Where you measure matters as much as what you measure.
North America: cloud's stronghold

North America is where cloud providers have their deepest penetration into overall internet traffic.
| Provider | NA Q1 2026 | NA Q1 2025 | YoY |
|---|---|---|---|
| AWS (16509 + 14618) | 7.67% | 8.77% | -12.6% |
| Google (15169 + 396982) | 4.88% | 5.77% | -15.5% |
| Microsoft (8075) | 4.14% | 2.95% | +40.3% |
| Big Three Total | 16.69% | 17.49% | -4.6% |
Big Three Traffic Share in North America Q1 2026 vs Q1 2025
Nearly 1 in 6 bytes in North America flows through a hyperscaler. AWS leads at 7.67%, Google Cloud at 4.88%, and Microsoft Azure at 4.14%. Azure grew 40% year over year while AWS (-12.6%) and Google (-15.5%) lost relative share as consumer streaming and social traffic grew faster than enterprise cloud.
Source: Cloudflare Radar · Q1 2025 vs Q1 2026
| Provider | Share of North American Traffic (%) |
|---|---|
| AWS | 7.67% |
| Google Cloud | 4.88% |
| Microsoft Azure | 4.14% |
- Azure added 1.19 percentage points year over year — a 40% relative jump in North America alone
- AWS and Google Cloud both lost relative share not to each other, but to consumer streaming and social traffic
- Combined Big Three North American share: 16.69% in 2026, down slightly from 17.49% in 2025
May 2026 update — April was partly a spike. AWS recovered to 7.19%, Google eased to 5.67% (AS396982 back from 3.44% to 3.16% of NA bytes), Microsoft climbed again to 4.44%, Big Three NA total 17.30%. Google's April jump didn't fully hold — but it didn't reverse either: at 5.67% it sits well above its Q1 4.88% and stays the clear NA #2. The quieter story is Azure, up a third straight month and back to narrowing the Google gap to 1.23 points (from 1.92 in April). The "Azure could pass Google in NA" call is plausible again — just slower, and from behind Google's higher floor.
Nearly 1 in 6 bytes in North America flows through a hyperscaler. Comcast (8.9%) and AT&T (6.1%) still carry the most traffic individually, but the Big Three combined beat any single ISP.
The AWS (-12.6%) and Google (-15.5%) declines don't signal weakness. Both providers' absolute traffic almost certainly grew. What shrank is their share of total North American bytes, because consumer streaming, gaming, and social traffic grew faster. North America is already heavily cloudified, and the marginal growth is happening elsewhere. AWS and Google are shifting capacity toward Europe and Asia-Pacific accordingly.
Azure's 40.3% North American jump is the one to watch. At 4.14%, it's closing fast on Google's 4.88%. Hold that trajectory and Azure could pass Google in North American traffic share by year-end.
That tracks with what we see in our technology detection data. Microsoft's enterprise stack (Azure AD, Microsoft 365, Teams) creates a gravitational pull. Once a company commits to the Microsoft platform, the infrastructure follows.
Europe: where Hetzner beats AWS

European traffic patterns look nothing like North America. The biggest surprise: Hetzner, a German hosting company, carries more traffic in Europe than AWS.
| Provider | EU Q1 2026 | EU Q1 2025 | YoY |
|---|---|---|---|
| Hetzner (24940) | 3.79% | 3.06% | +23.8% |
| AWS (16509) | 2.45% | 1.64% | +49.9% |
| Google (15169) | 1.71% | 1.70% | +0.6% |
Europe's Top Cloud Networks Q1 2026: Hetzner Beats AWS by 1.3 Points
Hetzner (AS24940) carries 3.79% of European internet traffic, well ahead of AWS at 2.45% and Google Cloud at 1.71%. AWS posted the fastest growth of any hyperscaler in any region at +49.9% year over year, but the gap with Hetzner is not closing. Data sovereignty and bare-metal pricing keep European workloads on local providers.
Source: Cloudflare Radar · Q1 2026
| Provider | Share of European Traffic (%) |
|---|---|
| Hetzner | 3.79% |
| AWS | 2.45% |
| Google Cloud | 1.71% |
- Hetzner carries more European traffic than AWS, Google Cloud, or Microsoft Azure
- AWS grew 49.9% year over year in Europe — the fastest growth of any hyperscaler in any region
- Azure and Google Cloud's dedicated cloud ASNs didn't crack Europe's top 15 networks
May 2026 update — Hetzner's lead is narrowing now: Hetzner 3.35% (a third straight monthly decline), AWS 2.27%, Google AS15169 1.66% (a small rebound). Hetzner's lead over AWS shrank to 1.08 points — down from 1.34 in Q1 and 1.26 in April. The hyperscalers' dedicated cloud ASNs kept gaining European ground: Google's AS396982 rose to 1.03% (from 0.88% in April) and Azure's AS8075 to 0.91% (from 0.84%) — AS396982 now actually outranks Azure as a European traffic carrier. Two months after Hetzner's April-1 price increase, the slow erosion the April data didn't yet show is now visible. Sovereignty stickiness is still real, but it's no longer offsetting everything.
Hetzner at 3.79%. AWS at 2.45%. The gap isn't closing. Hetzner grew 23.8% year over year while AWS grew faster in percentage terms (+49.9%), but from a smaller base. Growth rate and absolute lead are two different contests, and Hetzner still wins the one that matters for headcount.
Why does Europe look this way? Mostly data sovereignty. German and Nordic companies want infrastructure providers governed by EU data protection law, not US-headquartered hyperscalers exposed to FISA Section 702 requests. Pricing helps too. Hetzner's dedicated servers cost a fraction of equivalent AWS EC2 instances, which pulls in bandwidth-heavy workloads: media streaming, game servers, file hosting. We track adoption patterns across companies using Hetzner and the profile skews heavily toward European startups and mid-market SaaS. Hetzner did raise prices in April 2026, which may shift some workloads to rivals like OVHcloud, but the sovereignty argument isn't going anywhere.
Neither Azure nor Google Cloud's dedicated ASN cracked Europe's top 15 networks. Their European traffic exists, but it's spread thin compared to local players.
AWS's 49.9% European growth rate is the fastest any hyperscaler has posted in any region. Europe is cloud's fastest-growing market right now, and AWS is expanding capacity aggressively in Frankfurt, Ireland, and Stockholm. If you're tracking cloud provider traffic share across regions, this is where the action is.
The European pattern also explains why OVH and Scaleway keep growing despite the hyperscaler onslaught. European enterprises want cloud on their own terms, with data residency guarantees US providers can't fully match, even with local regions.
Asia: the mobile operator continent

Asia's traffic picture is owned by mobile operators, not cloud providers.
| Provider | Asia Q1 2026 | Type |
|---|---|---|
| Reliance Jio (55836) | 5.76% | Mobile Operator |
| Viettel (7552) | 3.78% | Telecom |
| Bharti Airtel (45609) | 3.03% | Mobile Operator |
| VNPT (45899) | 2.58% | State Telecom |
| China Telecom (4134) | 2.52% | State Telecom |
| AWS (16509) | 1.33% | Hyperscaler |
Asia's Top Networks Q1 2026: Mobile Operators Dwarf AWS by 4.3x
Asian internet traffic is dominated by mobile operators, not cloud providers. Reliance Jio (AS55836) alone carries 5.76% of Asian traffic — 4.3 times more than AWS at 1.33%. Viettel, Bharti Airtel, VNPT, and China Telecom all outrank every hyperscaler. India's telecom regulator data shows Jio holds a 49.07% domestic market share with 519.64 million subscribers as of March 2026.
Source: Cloudflare Radar · Q1 2026
| Network | Share of Asian Traffic (%) |
|---|---|
| Reliance Jio | 5.76% |
| Viettel | 3.78% |
| Bharti Airtel | 3.03% |
| VNPT | 2.58% |
| China Telecom | 2.52% |
| AWS | 1.33% |
- Reliance Jio carries 4.3x more Asian traffic than AWS
- AWS is the only Big Three provider in Asia's top 15 networks — Google and Azure don't register
- Smartphone-first internet adoption keeps consumer traffic on telecom networks, not cloud
- Jio's domestic market share of 49.07% (519.64M subscribers) explains its regional bandwidth lead
May 2026 update — Jio held its lead, the telecom layer reshuffled again. Reliance Jio held at 6.83% of Asian traffic — essentially unchanged from April, still ~5x AWS's footprint. Bharti Airtel rebounded to 2.94% (from 2.35%), Viettel eased again to 2.57%, China Telecom held at 2.79%, and VNPT slipped to 2.31%. AWS ticked up a hair to 1.36% — the only Big Three network in Asia's top 15, and going nowhere fast. Two clean months now confirm it: Asia's bandwidth belongs to mobile operators, and no hyperscaler is close.
Reliance Jio alone carries 4.3 times more Asian traffic than AWS. The reason is simple: Asia's internet growth came through smartphones, not desktop broadband. Hundreds of millions of users in India, Vietnam, and Indonesia reach the internet primarily through mobile data, and that traffic stays on telecom networks. Jio's latest subscriber numbers show 519.64 million subscribers and a 49.07% domestic market share as of March 2026 — which explains the traffic lead pretty cleanly.
AWS is the only Big Three provider in Asia's top 15 networks. Google and Azure don't register at the continent level. Not because companies in Asia don't use cloud — they do — but because consumer mobile traffic swamps everything cloud-adjacent.
If you sell B2B in Asian markets, that changes the prospecting math. Your prospects' infrastructure decisions are shaped by local telecom partnerships, not just hyperscaler preference. An Indian SaaS might run on AWS Mumbai, but its users reach it over Jio and Airtel.
This picture will change, but not quickly. As enterprises in India, Vietnam, and Indonesia adopt cloud-native architectures, hyperscaler traffic will grow. Consumer mobile traffic will still dwarf it for years. The two Indonesian state telecoms alone (Telkom and Indosat) carry more traffic in Southeast Asia than all three hyperscalers combined.
Running marketing automation campaigns targeting APAC? Don't assume the infrastructure patterns you see in North America. APAC enterprises often run hybrid architectures where local hosting handles the consumer-facing layer and hyperscalers run backend workloads.
Inside the cloud: where are workloads actually running?
Cloudflare's Cloud Observatory tracks request patterns to specific cloud regions. One question, clean answer: where do workloads actually run? Turns out — more concentrated than you'd expect.
AWS: the us-east-1 empire

| Region | Share of AWS Requests |
|---|---|
| us-east-1 (N. Virginia) | 41.5% |
| us-east-2 (Ohio) | 14.6% |
| us-west-2 (Oregon) | 10.7% |
| eu-central-1 (Frankfurt) | 8.0% |
| eu-west-1 (Ireland) | 5.7% |
| global | 4.2% |
| ap-southeast-1 (Singapore) | 4.0% |
| ap-northeast-1 (Tokyo) | 3.6% |
| ap-south-1 (Mumbai) | 1.8% |
AWS Region Request Share Q1 2026: us-east-1 Handles 41.5% of Traffic
A single AWS region — us-east-1 in Northern Virginia — handles 41.5% of all AWS requests globally. The top three US regions (Virginia, Ohio, Oregon) account for 66.8%. Europe's Frankfurt and Ireland regions together contribute 13.7%, while Asia-Pacific hubs in Singapore, Tokyo, and Mumbai combine for 9.4%.
Source: Cloudflare Radar Cloud Observatory · 12 months ending March 30, 2026
| Region | Share of AWS Requests (%) |
|---|---|
| us-east-1 (Virginia) | 41.5% |
| us-east-2 (Ohio) | 14.6% |
| us-west-2 (Oregon) | 10.7% |
| eu-central-1 (Frankfurt) | 8% |
| eu-west-1 (Ireland) | 5.7% |
| global | 4.2% |
| ap-southeast-1 (Singapore) | 4% |
| ap-northeast-1 (Tokyo) | 3.6% |
| ap-south-1 (Mumbai) | 1.8% |
- us-east-1 alone handles more AWS traffic than the next three regions combined
- Two-thirds of AWS traffic (66.8%) concentrates in three US regions
- Frankfurt handles 40% more traffic than Ireland — a geographic shift driven by German enterprise adoption
- Mumbai at 1.8% is understated; most Indian AWS customers still route through Singapore
May 2026 update — concentration plateaued at its high, not retreated: us-east-1 held at 43.25% of all AWS requests (vs 43.62% in April, 41.5% in Q1), us-east-2 at 13.78%, us-west-2 at 10.59%. The top three US regions stayed at 67.6%. Cloudflare's Cloud Observatory annotates the Iranian-strike outage on me-central-1 as running all the way to May 1 — so this is the second straight month of documented operational stress, and Northern Virginia's share still sits within a third of a point of its April peak. If multi-region disaster recovery were widely practiced, this two-month window is where it would show. It doesn't. The us-east-1 gravity well is structural.
A single AWS region — us-east-1 in Northern Virginia — handles 41.5% of all AWS requests globally. The top three US regions (Virginia, Ohio, Oregon) account for 66.8%.
Why so concentrated? us-east-1 was AWS's first region. It still has the deepest service catalog, and many AWS services launched there first — some never left. Enterprise customers who started on AWS between 2010 and 2015 built everything in us-east-1, and migrating is expensive. For most workloads, the cost doesn't pencil out.
Frankfurt (8.0%) and Ireland (5.7%) together carry 13.7%, which makes Europe AWS's second-largest workload cluster. Singapore (4.0%) and Tokyo (3.6%) anchor Asia-Pacific.
One takeaway for infrastructure planners, which matches what we see in our technology tracking: if you're building a SaaS product that calls AWS APIs, assume us-east-1 as the most common origin when you set your latency baseline.
How does cloud-provider latency compare across AWS, Google Cloud, Azure, and Oracle?
The embed above tracks one metric — TCP handshake time — and it moves. So here is the snapshot it's drawn from, frozen for the record, and widened to four connection metrics instead of one. We pulled all of them from Cloudflare Radar's Cloud Observatory (origins/summary/origin, metric=tcp_handshake_duration | tls_handshake_duration | tcp_rtt | response_header_receive_duration) over a clean 7-day window, June 2–9, 2026. Every figure is a RAW_VALUES median in milliseconds, measured from Cloudflare's edge to each provider's origins — lower is faster.
| Provider | TCP handshake (ms) | TLS handshake (ms) | TCP RTT (ms) | Response header (ms) |
|---|---|---|---|---|
| Google Cloud | 47.9 | 60.3 | 33.1 | 102.3 |
| Microsoft Azure | 57.5 | 79.6 | 35.2 | 104.3 |
| Amazon (AWS) | 57.6 | 87.7 | 27.3 | 96.3 |
| Oracle Cloud | 74.1 | 100.0 | 46.8 | 190.1 |
Read it column by column and the live embed's headline holds up: Google Cloud establishes connections fastest, beating AWS and Azure on TCP handshake by a clean ~10 ms and stretching that lead to ~20–27 ms once TLS negotiation is layered on (60.3 ms vs 79.6 ms for Azure and 87.7 ms for AWS). That handshake edge is the same global-anycast backbone that shapes Google's request distribution two sections down — connections terminate at the nearest point of presence, so the round trip to "establish" is short by design.
The story flips on the raw network hop. On TCP RTT — the underlying path latency once a packet is in flight — AWS is quickest at 27.3 ms, ahead of Google's 33.1 ms and Azure's 35.2 ms, and AWS also wins the first-byte race (96.3 ms to receive a response header, narrowly under Google's 102.3 ms). So the two leaders split the contest cleanly: Google wins the setup (handshakes), AWS wins the path and the payload (RTT and response time). If your workload opens many short-lived connections, Google's handshake advantage compounds; if it holds long-lived connections and streams data, AWS's lower RTT and faster first byte matter more. That nuance is exactly what a single TCP-handshake number — including the one in the embed above — hides.
Oracle Cloud lags on every metric, and it isn't close. It's slowest to handshake (74.1 ms TCP, 100.0 ms TLS), slowest on the wire (46.8 ms RTT), and slowest to first byte by a wide margin (190.1 ms — nearly double AWS's 96.3 ms). That tracks with the two-datacenter concentration we documented above: with more than half of OCI traffic funneling through us-ashburn-1 and us-phoenix-1, edges far from the US East corridor pay a real distance tax on every connection. Oracle's network isn't small, but it is geographically narrow, and latency from Cloudflare's globally distributed edge is where that narrowness shows up most plainly.
Treat the table as the durable snapshot and the embed as the live companion: the numbers above are a fixed June 2–9 reading you can cite, while the widget tracks the TCP-handshake line as it drifts week to week. One caveat worth stating — Cloud Observatory does not expose a clean per-cloud-region latency grid that lines up across providers (each names its regions differently and Radar surfaces only a partial, provider-specific set), so this comparison is global-median by design rather than region-by-region.
Google Cloud: the global-first architecture

| Region | Share of GCP Requests |
|---|---|
| global | 69.8% |
| us-central1 (Iowa) | 7.3% |
| us-east1 (S. Carolina) | 3.9% |
| us-east4 (N. Virginia) | 3.2% |
| europe-west3 (Frankfurt) | 3.0% |
| europe-west1 (Belgium) | 2.4% |
| asia-southeast1 (Singapore) | 2.0% |
May 2026 update — global routing stabilized; us-east5 kept growing: global held at 66.86% (vs 66.11% April, 69.8% Q1), us-central1 7.36%, us-east5 4.61% (up from 3.74% in April — its second straight gain), us-east1 4.31%, us-east4 eased to 3.63%. The April pattern held: roughly a third of GCP requests now resolve to named regions rather than disappearing into anycast, and the fastest-growing of them — us-east5, a newer Ohio-area region — suggests Google is steadily moving specific workload classes off pure global load balancing, consistent with its North American share gains above.
Google Cloud's distribution looks nothing like AWS's. 69.8% of GCP requests route through "global" endpoints — meaning they hit Google's global load balancing, Cloud CDN, or anycast routing before reaching a specific region.
That's architectural, not accidental. Google built its cloud on the same global network backbone that runs Search, YouTube, and Gmail. Anycast routing sends requests to the nearest point of presence, then internal routing picks the optimal datacenter. Most GCP traffic never appears as region-specific in external telemetry as a result.
Only 30.2% of GCP requests resolve to a named region. Among those, Iowa (7.3%), South Carolina (3.9%), and Northern Virginia (3.2%) take the US. Frankfurt (3.0%) leads Europe.
Microsoft Azure: split between global and US East
| Region | Share of Azure Requests |
|---|---|
| global | 55.0% |
| eastus | 5.2% |
| westus3 | 3.8% |
| centralus | 3.5% |
| northeurope | 3.4% |
| eastus2 | 3.3% |
| southcentralus | 3.3% |
| westus | 2.8% |
| westeurope | 2.8% |
May 2026 update — the region activation accelerated; retire the "75 idle regions" caveat: Azure's global-routing share fell again to 46.41% (from 52.88% in April and 55.0% in Q1) — a near-9-point drop across the year, all of it landing in named regions. A brand-new top entrant appeared in May, brazilsouth at 4.70%, alongside continued growth in polandcentral (3.78%, up from 3.37%) and centralindia (3.22%). With global routing now under half of all Azure requests and sovereignty regions in Poland, India, and now Brazil carrying real traffic, the Q1 caveat — "Azure has the most regions but most don't carry traffic" — no longer holds. The 75-region footprint is now an operational fact, not a press-release one.
Azure sits between AWS and Google in distribution philosophy. 55% of traffic routes globally (Azure Front Door, CDN). The other 45% distributes across 75 named regions — the largest footprint of any cloud provider.
The region-level data shows a more even spread than AWS. No single Azure region exceeds 5.2% (eastus), versus AWS's 41.5% concentration in us-east-1. That reflects Azure's enterprise customer base, where compliance requirements force geographic distribution of data and compute whether you want it or not.
North Europe (3.4%) and West Europe (2.8%) together give Azure 6.2% European presence — more than any other hyperscaler's named European share.
Oracle Cloud: the two-datacenter reality
| Region | Share of OCI Requests |
|---|---|
| us-ashburn-1 | 41.2% |
| us-phoenix-1 | 21.2% |
| eu-frankfurt-1 | 11.2% |
| sa-saopaulo-1 | 5.0% |
| ap-tokyo-1 | 4.5% |
| me-jeddah-1 | 3.3% |
May 2026 update — Oracle concentrated even further: us-ashburn-1 climbed again to 51.86% — now over half of all OCI requests, up from 46.00% in April and 41.2% in Q1 — while us-phoenix-1 eased to 21.04%. The top two US regions together handle 72.9% of all OCI traffic, up from 62.4% in Q1: a near-10.5-point concentration swing in two months. eu-frankfurt-1 held at 8.25%, and ap-mumbai-1 (2.65%) edged into the top six. Oracle is the clearest counter-trend to multi-region best practice in the entire dataset — as AWS's us-east-1 plateaued, Oracle's us-ashburn-1 broke through 50%.
Oracle Cloud Infrastructure tells a concentrated story. Two US datacenters, Ashburn (41.2%) and Phoenix (21.2%), handle 62.4% of all OCI requests. That pattern reflects Oracle's customer base: large US-headquartered enterprises running Oracle databases and ERP systems. Oracle's Q3 FY2026 total cloud revenue hit $8.9 billion, up 44% year over year, so the network isn't small — it's just funneled through a narrow set of regions.
Frankfurt at 11.2% is Oracle's European hub. Sao Paulo (5.0%) and Tokyo (4.5%) cover the rest of the world. The Jeddah presence (3.3%) reflects Oracle's push into Middle Eastern sovereign cloud deals.
OCI's distribution is the most concentrated among major cloud providers. It works for the use case — enterprise database workloads don't need the same geographic spread as consumer web apps — but it also explains why OCI doesn't show up in regional traffic rankings outside North America.
One-line summary: AWS is concentrated but massive. Google routes globally by design. Azure distributes evenly across the most regions. Oracle serves a tight enterprise cluster from two US hubs. Each pattern reflects how that provider's customer base actually uses cloud infrastructure, not just where the provider built datacenters.
The geographic DNA of each cloud provider
Where traffic comes from tells you who the customers are. Each hyperscaler has a distinct geographic fingerprint, and they're more different than you'd guess.
| Country | AWS | Microsoft | |
|---|---|---|---|
| United States | 51.2% | 40.3% | 71.5% |
| Germany | 11.8% | 11.1% | — |
| Singapore | 7.9% | 12.0% | 2.5% |
| Ireland | 7.0% | — | 2.2% |
| Japan | 4.7% | 3.2% | 2.3% |
| Netherlands | — | — | 3.4% |
| United Kingdom | 3.3% | 3.1% | 2.3% |
| Hong Kong | 1.3% | 3.9% | — |
| Australia | 2.3% | 2.1% | 2.3% |
| Sweden | 1.2% | 3.7% | — |
Three profiles jump out:
Microsoft is US-centric. 71.5% of Azure's traffic originates from the United States. That reflects Microsoft's dominance in US enterprise IT: government contracts, Fortune 500 Microsoft 365 deployments, and a growing pile of Azure AI workloads. Microsoft has international presence (Netherlands 3.4%, Singapore 2.5%), but nothing close to the US base.
Google is the most globally distributed. Only 40.3% of GCP traffic comes from the US. Singapore (12.0%), Germany (11.1%), Hong Kong (3.9%), and Sweden (3.7%) all contribute meaningful share. Google's geography comes from its consumer services (YouTube, Gmail) that generate worldwide traffic, plus a cloud customer base built around globally distributed applications.
AWS splits the middle. 51.2% US, with strong secondary markets in Germany (11.8%), Singapore (7.9%), and Ireland (7.0%). That spread reflects AWS's position as the default choice for startups and mid-market companies in most regions. The Ireland concentration comes from eu-west-1 — the single region a lot of companies pick when they serve European customers without spending on multi-region deployment.
For prospecting: Azure prospects cluster in the US. Google Cloud prospects spread globally with strong Southeast Asian representation. AWS splits evenly across NA, Europe, and APAC. We see the same patterns in our data on companies using Microsoft Azure, companies using Google Cloud, and companies using DigitalOcean (which often shows up as a secondary provider alongside the Big Three). Adjust your technology detection filters to match.
The infrastructure arms race: region count
Cloud providers compete on geographic reach. More regions doesn't automatically mean more traffic.
| Provider | Available Regions | Key Expansion Areas |
|---|---|---|
| Microsoft Azure | 75 | Mexico, Indonesia, Malaysia, Taiwan, Austria, Belgium, Denmark |
| Oracle Cloud | 53 | Casablanca, Batam, Kuala Lumpur, Monterrey |
| Google Cloud | 48 | Berlin, Dammam, Dallas |
| Amazon Web Services | 42 | Mexico, Saudi Arabia, South America West |
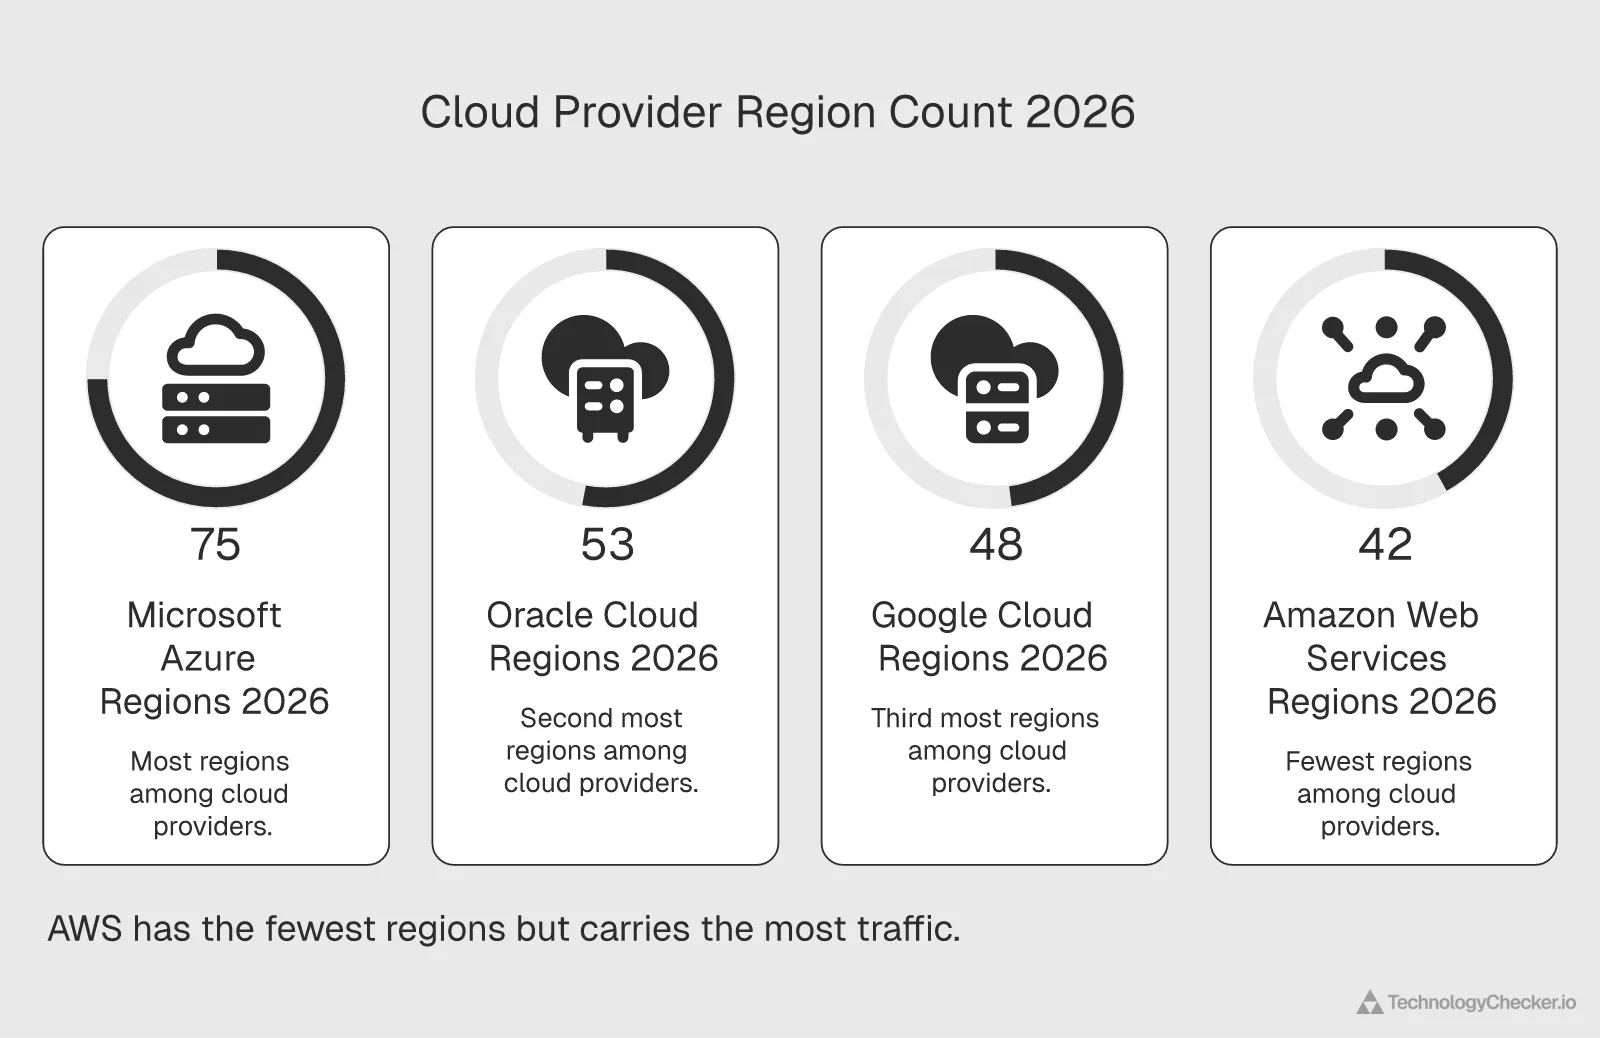
Cloud Region Count Comparison 2026: Azure 75, Oracle 53, GCP 48, AWS 42
Microsoft Azure leads all hyperscalers with 75 regions — nearly double AWS's 42. But region count is a compliance and latency bet, not a traffic indicator: AWS carries more than double Azure's global traffic despite running fewer regions. Oracle's 53 regions reflect its enterprise database customer base, each region opened where a large client requires data residency.
Source: Provider documentation and Cloudflare Radar · Q1 2026
| Provider | Number of Regions |
|---|---|
| Microsoft Azure | 75 |
| Oracle Cloud | 53 |
| Google Cloud | 48 |
| AWS | 42 |
- Azure has nearly 2x AWS's region count, but AWS carries 2.1x Azure's global traffic
- A new cloud region takes 2-3 years to carry real workload traffic after launch
- Oracle's 53 regions exceed Google Cloud's 48 — a direct reflection of enterprise database sales
Azure leads with 75 regions, nearly double AWS's 42. AWS carries more than double Azure's traffic. Region count is a compliance and latency bet, not a traffic indicator.
Azure's push into Mexico, Indonesia, Malaysia, Taiwan, Austria, Belgium, and Denmark targets data sovereignty rules. Governments and regulated industries need compute and storage within national borders. Microsoft's strategy is to have a region everywhere a government contract wants one.
Oracle's 53 regions (more than Google Cloud's 48) reflect its enterprise sales model. Oracle builds regions where its largest database customers need them. Casablanca for North African banks. Batam for the Indonesian government. Monterrey for Mexican manufacturing.
AWS's 42 regions look modest, but each AWS region is bigger than its competitors'. us-east-1 alone likely contains more servers than entire cloud providers. AWS is expanding into Mexico, Saudi Arabia, and South America West — high-growth markets, not checkbox coverage.
Google Cloud at 48 regions is adding Berlin, Dammam, and Dallas. Its expansion is slower and targeted at markets where Google sees specific demand from existing customers.
Here's what people get wrong about region count versus traffic share. When a provider announces a new region, it gets press. That region won't carry real traffic for two to three years. Customers have to retool deployment pipelines, update compliance docs, and renegotiate pricing. A region's traffic depends on its age and customer base, not the press release.
If you're evaluating multi-cloud strategies, region count tells you where you can deploy. Traffic share tells you where workloads actually run. When you're planning disaster recovery or a latency-sensitive architecture, the traffic data is the better source.
CRN's Q4 2025 cloud market analysis put worldwide cloud infrastructure revenue at $119 billion in Q4 2025. That spend doesn't distribute evenly across regions. Most of it lands in the same 5-10 regions that carry the bulk of traffic.
Year-over-year: the cloud is growing, but unevenly
The cloud's slice of global traffic is getting bigger. Not evenly, though. Some networks are surging. Others are flat. A few are shrinking — at least in relative terms.
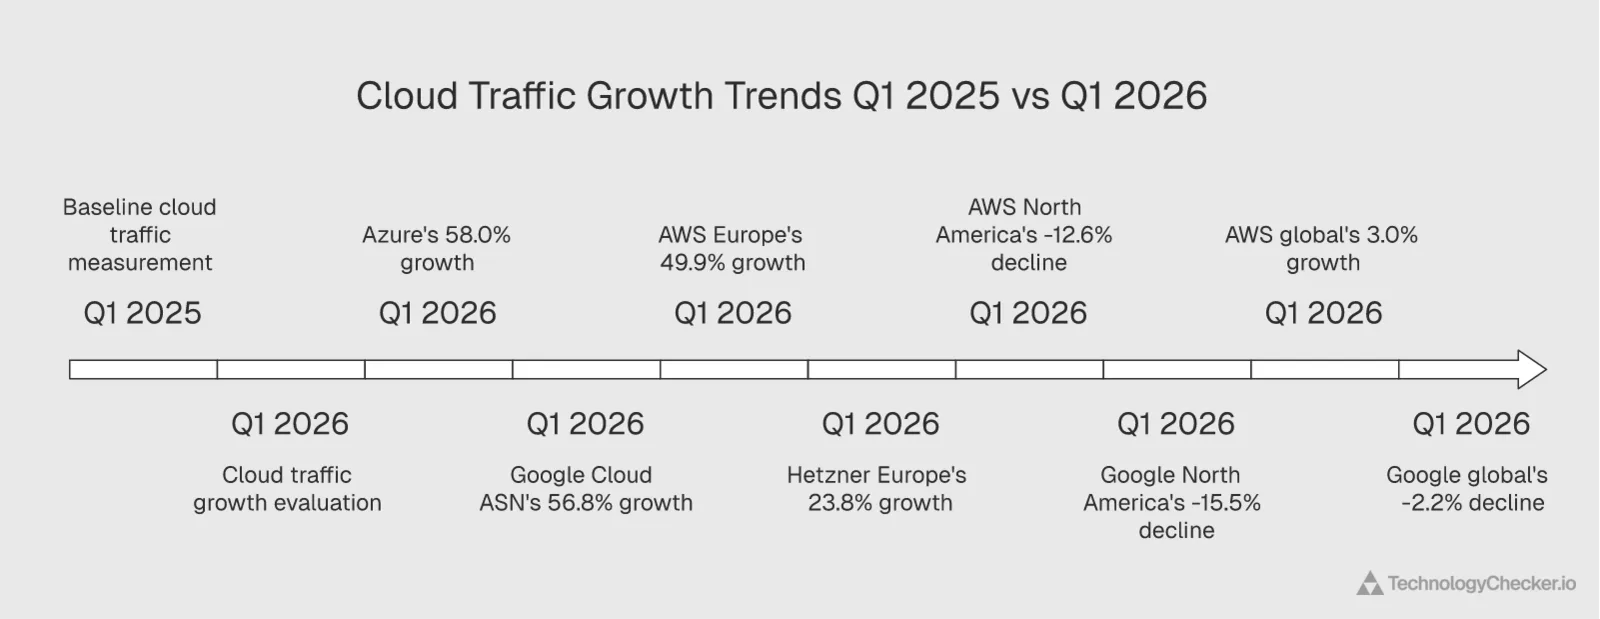
Cloud Network Traffic Growth Q1 2026 YoY: Azure +58%, Google Cloud ASN +56.8%
Microsoft Azure's global traffic jumped 58% year over year — the largest single-year gain of any major cloud network. Google's cloud-specific ASN (AS396982) grew 56.8% as workloads migrate off the legacy multi-purpose AS15169. AWS's European traffic grew 49.9%. Meanwhile, AWS (-12.6%) and Google (-15.5%) in North America lost relative share to faster-growing consumer traffic, not to each other.
Source: Cloudflare Radar · Q1 2025 vs Q1 2026
| Network / Region | YoY Traffic Share Change (%) |
|---|---|
| Azure (global) | 58% |
| Google Cloud ASN (global) | 56.8% |
| AWS (Europe) | 49.9% |
| Hetzner (Europe) | 23.8% |
| AWS (global) | 3% |
| Google (global aggregate) | -2.2% |
| AWS (North America) | -12.6% |
| Google (North America) | -15.5% |
- Azure's 58% traffic growth outpaces its 40% revenue growth — AI and bandwidth-heavy workloads explain the gap
- Google is quietly shuffling traffic from its legacy network to a dedicated cloud ASN, showing up as a flat aggregate
- North American declines for AWS and Google reflect market saturation, not competitive loss
Winners
Microsoft Azure (+58.0% globally). The headline number of this whole analysis. Two forces hit at once. AI infrastructure — training and inference workloads eat bandwidth, full stop. And Microsoft 365 migration pulls enterprise email, files, and collaboration onto Azure's backbone. We've seen the same pattern in Salesforce vs. Microsoft dynamics: when enterprises commit to a platform, the infrastructure follows. Microsoft's Q1 FY2026 earnings posted 40% Azure revenue growth — so traffic is actually outrunning billing, which fits the AI-workload thesis.
May 2026 outcome — confirmed, with a sharper story. Azure recovered to 1.70% in May after the 1.43% March dip that had depressed the Q1 average. The clean monthly view shows the +58% YoY surge wasn't a straight line — it was a winter peak (1.72–1.73%), a March pothole, and a recovery. The AI/M365 thesis holds; Azure just doesn't grow in a straight line month to month.
Google Cloud ASN AS396982 (+56.8%). Google's cloud-specific network went from 0.66% to 1.03% of global traffic. The main Google network (AS15169) dropped from 1.95% to 1.52% over the same window. That isn't decline. It's a migration. Google is shuffling cloud workloads off its legacy multi-purpose network onto dedicated infrastructure. The aggregate looks flat; the cloud business underneath is growing fast.
May 2026 outcome — confirmed, then consolidated. AS396982 eased to 1.33% in May (from 1.37% in April) and AS15169 to 1.54%, pulling the combined network to 2.87% — off April's 2.95% peak but still the year's largest net gainer. The migration thesis holds and the business grew; May shows the April acceleration settling into a higher plateau rather than compounding.
AWS in Europe (+49.9%). AWS's European traffic jumped from 1.64% to 2.45% of continental traffic. Europe is the fastest-growing cloud market right now. Holori's cloud market analysis put global cloud IaaS spending at $90.9 billion in Q1 2025, a 21% increase. Europe is absorbing more than its share of that growth as EU enterprises accelerate digital transformation.
May 2026 outcome — the pause continued, with a twist. AWS European share eased again to 2.27%, and Hetzner gave back more (3.35%). But the dedicated cloud ASNs kept climbing: Google's AS396982 to 1.03% and Azure's AS8075 to 0.91%. Europe's cloud growth has rotated — away from Hetzner's bare-metal lead and AWS's headline region, toward the hyperscalers' purpose-built cloud networks finally registering as European carriers.
Hetzner in Europe (+23.8%). Cloud growth doesn't all flow to the Big Three. Hetzner went from 3.06% to 3.79% of European traffic. Data sovereignty, price sensitivity, and bare-metal performance — real drivers, not marketing talking points. European companies keep choosing Hetzner over the hyperscalers, and the traffic data says it's working.
May 2026 outcome — lead held but narrowing. Hetzner eased a third straight month to 3.35%, trimming its lead over AWS to 1.08 points (from 1.34 in Q1). Two months after the April-1 price increase, the slow erosion the first month didn't show is now visible. Sovereignty stickiness is still doing real work — Hetzner remains #1 in Europe — but the price move is no longer cost-free in share terms.
Losers
AWS in North America (-12.6%). AWS's North American share fell from 8.77% to 7.67%. Not a competitive loss to Azure or Google. Saturation. North American cloud adoption is mature, and AWS's absolute traffic almost certainly grew. What shrank is AWS's share — consumer streaming, gaming, and social media traffic grew faster.
May 2026 outcome — partial rebound. AWS NA share recovered to 7.19% in May as Google gave back part of its April spike. The saturation framing still fits the multi-month trend, but May shows AWS isn't in freefall in North America — it's oscillating within a band while consumer traffic grows around it.
Google in North America (-15.5%). Same story. Google's North American cloud traffic dropped from 5.77% to 4.88%. The decline is partly the ASN migration effect — traffic shifting from AS15169 to AS396982 doesn't fully show up in regional breakdowns — and partly the same saturation dynamic as AWS.
May 2026 outcome — reversal held, peak didn't. Google NA share eased to 5.67% in May (AS396982 back to 3.16% from April's 3.44%). The Q1 "Google is a NA loser" call is still wrong — Google sits far above its 4.88% Q1 level — but April's 6.14% was a peak, not a new baseline. The durable read: Google reset to a higher NA floor around 5.7%, roughly a point above where it started the year.
Steady
Google globally (-2.2% aggregate). Combine both Google ASNs and the net change is a small decline. That masks the structural shift from legacy to cloud-dedicated infrastructure. Google's cloud business is growing — revenue up from 11% to 13% market share over two years per Synergy Research. Network reorganization, not business contraction.
May 2026 outcome — net gainer, not breakout. Google's combined ASN traffic settled at 2.87% globally in May, off the 2.95% April peak but well above the Q1 2.55%. The honest framing isn't "steady" (Q1) or "breakout" (April) — it's "year's largest net gainer": a steady Jan→Apr climb that has begun to consolidate.
AWS globally (+3.0%). Steady growth at the world's largest cloud network is still a lot of bytes. At 3.40% of all internet traffic, a 3% increase represents an enormous absolute volume. AWS isn't accelerating; it isn't losing ground either. Spacelift's cloud computing statistics still put AWS at roughly 32% of the market by revenue.
May 2026 outcome — confirmed again. AWS held at 3.28% globally in May. Five clean months now put it in a 3.28%–3.65% band, four of them within a third of a point of 3.30%. "Steady" is the whole story for AWS — and at this scale, steady is an enormous, growing absolute volume.
What these numbers mean
Five things jumped out.
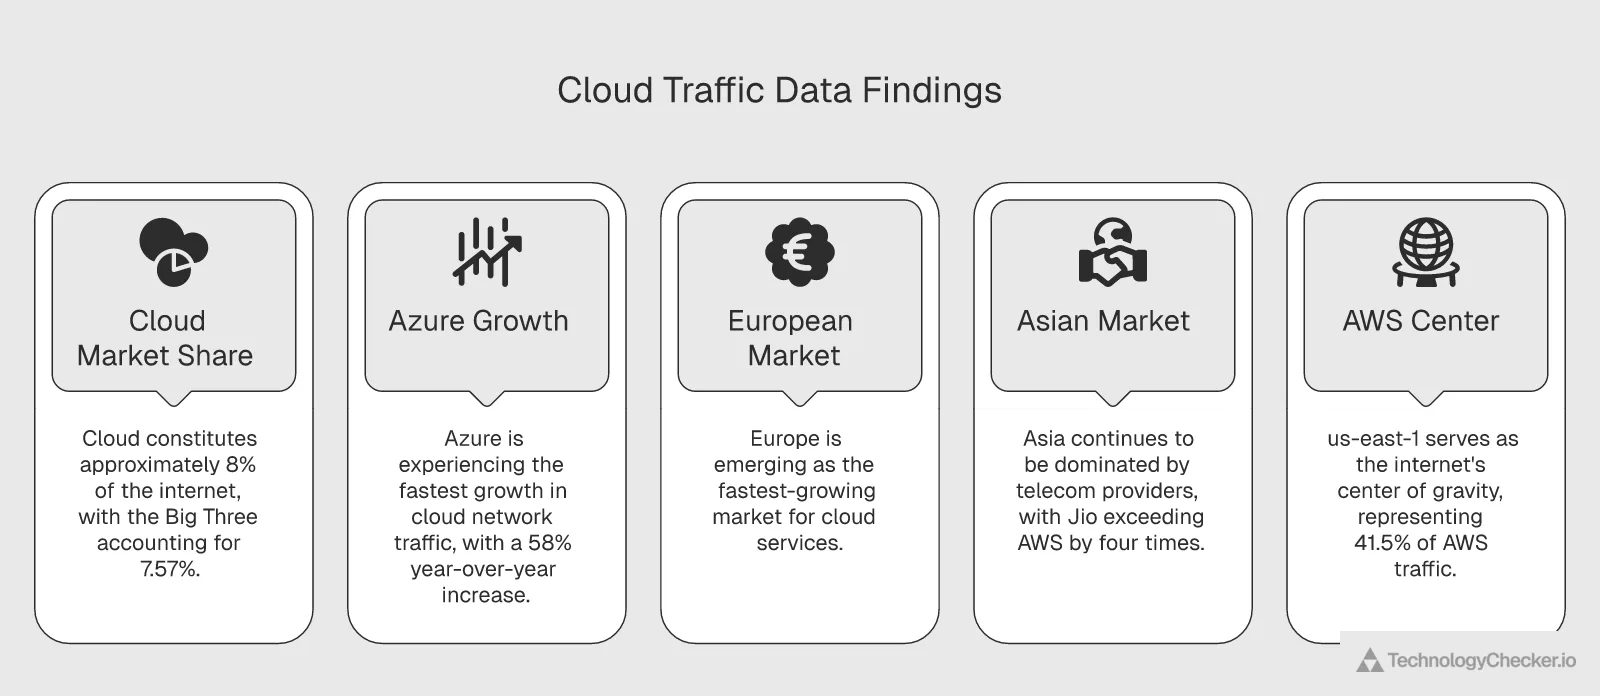
1. Cloud is about 8% of the internet and growing. The Big Three carried 7.57% of global traffic in Q1 and 7.85% in May 2026. Add Meta, Akamai, and Hetzner and cloud-adjacent infrastructure handles roughly 11.3%. That share is rising on the order of 9% year over year. At that rate, cloud providers will carry over 10% of global traffic by 2028.
2. Azure posted the biggest year-over-year traffic jump. A 58% rise in a year is extraordinary for a network already carrying 1.61% of global traffic, and Azure's growth is structural — AI workloads, enterprise platform consolidation — not cyclical. Holori puts the global cloud market at roughly $943 billion in 2025, on track to pass $1 trillion in early 2026, and Azure is capturing a growing slice of it. (June 2026 note: that 58% is measured against a weak year-ago base. On a clean within-2026 monthly basis, Google Cloud added more share than Azure — see the month-by-month breakdown above. Azure's growth is real and structural; it just wasn't 2026's single fastest-mover.)
3. Europe is cloud's fastest-growing market. AWS +49.9%, Hetzner +23.8%, and a strong baseline from local providers — all point to Europe as the next battleground for cloud market share. Data sovereignty regulations (GDPR, the Data Act, the AI Act) are driving both cloud adoption and provider selection.
4. Asia is still telecom-dominated. Cloud providers need local partnerships and edge infrastructure to grow meaningfully in Asia. The mobile-first topology means cloud traffic stays a small fraction of total bandwidth. Reliance Jio alone exceeds the Big Three combined in Asian traffic.
5. us-east-1 is the center of the internet's gravity. 41.5% of AWS requests, 5.2% of Azure requests (eastus), and significant Google Cloud presence all concentrate in Northern Virginia. The Ashburn-area datacenter corridor handles more internet traffic than most countries.
What does this mean for prospecting? At TechnologyChecker we track which technologies companies actually use across 29.9 million active domains. Traffic share data tells you where to look. Selling to AWS-heavy verticals? Focus on North America and Europe. Targeting Azure shops? The US is your primary market. Prospecting in Asia? Look for signals beyond hyperscaler adoption — the cloud footprint is still developing.
Revenue market share reports from Synergy Research and Canalys are still valuable for understanding spending patterns. They don't tell you what's running where. A company spending $10 million a year on AWS might generate less traffic than a startup spending $50,000 on a bandwidth-heavy workload. Traffic share captures the physical internet, not the invoices.
Combining traffic data with technology detection ssl certificate signals paints a much sharper picture of what a company actually runs. Revenue market share tells you "AWS is big." Traffic share tells you "AWS carries 1 in 29 bytes, concentrated in us-east-1, with its fastest growth in Europe." One is a headline. The other is something you can act on.
What May resolved — and what we're watching for June 2026
In the April update we left three questions open for May. The clean May data answered all three. We're keeping the answers here, graded honestly, because a prediction is only worth making if you come back and score it.
Did Google's North American surge hold? — Mostly, but the peak was the peak. We predicted either "another sharp gain or a new floor near 6%" or "an anomalous one-month spike." The answer landed between them: Google's NA share eased from 6.14% to 5.67% (AS396982 from 3.44% to 3.16%) — so April was partly a spike, but Google settled on a new, higher floor close to the ~6% we flagged, roughly a point above its Q1 level. Call it mostly durable. The "new floor near 6%" guess was the closer of the two.
Did Azure's regional footprint keep activating? — Yes, decisively. We said that if May added "two or three new regions crossing into traffic-bearing status," the "75 idle regions" caveat should be retired. May did better than that: global routing fell another 6.5 points to 46.4% (now under half of all Azure requests), a brand-new Brazil South region entered the top tier at 4.70%, and Poland Central and Central India both kept growing. Caveat retired — Azure's region count is now an operational fact.
Did AWS us-east-1 concentration finally retreat? — No. We flagged that another upward tick despite the outage backdrop would mean multi-region DR is failing in production at measurable scale. May held us-east-1 at 43.25% — a hair below April's 43.62% but still far above Q1's 41.5%, through a me-central-1 outage Cloudflare annotates as running into May 1. Concentration didn't retreat; it cemented at its high. The resilience-auditing implication stands.
Three new questions for June:
Will Google consolidate above its new floor or drift back toward Q1? May's 2.87% global / 5.67% NA reads like a higher plateau, but one month of easing isn't a trend. If June holds near these levels, Google's 2026 gain is locked in; if it keeps sliding toward 2.55% / 4.88%, April was more spike than shift.
Does Azure's global-routing share keep falling below 46%? The slide from 55% to 46.4% in five months is the clearest "regions are activating" signal in the dataset. If June pushes it under 45% with more new named regions, Azure's distribution philosophy has structurally changed — worth re-modeling latency assumptions for anyone building on it.
Does Hetzner's European decline accelerate or stabilize? Three straight monthly drops (3.79 → 3.64 → 3.35) two months after a price increase is now a trend, not noise. June tells us whether sovereignty stickiness holds the floor around 3.3% or whether the price move has started a genuine migration to OVHcloud and Scaleway.
Methodology
Data source: Cloudflare Radar NetFlows (summary/as, summary/location) and Cloud Observatory (summary/REGION) endpoints.
Timeframe: Q1 2026 (January 1 through March 31, 2026) baseline with Q1 2025 year-over-year comparisons, refreshed with clean per-calendar-month data through May 31, 2026.
Method: Cloud provider traffic calculated by summing autonomous system numbers (ASNs) per provider. AWS = AS16509 + AS14618. Google = AS15169 + AS396982. Microsoft = AS8075. Regional percentages represent each ASN's share within that continent, not globally. Cloud Observatory data covers 12 months ending March 30, 2026.
June 2026 refresh. For this update we re-pulled NetFlows on clean per-calendar-month windows for January through May 2026 — each a single calendar month, not a rolling 28-day window — and re-pulled Cloud Observatory region distributions (origins/summary/region, metric requests, PERCENTAGE-normalized) for May. The monthly series is what surfaced Azure's March dip and Google's steady climb, patterns the Q1 quarterly average and the single April snapshot both hid. Where the May reading differs from the published Q1 or April figures, both are shown so the trajectory stays visible. The cross-provider latency scorecard (TCP handshake, TLS handshake, TCP RTT, response-header time) was pulled separately from Cloud Observatory's origins/summary/origin endpoint — metric=tcp_handshake_duration | tls_handshake_duration | tcp_rtt | response_header_receive_duration, all RAW_VALUES in milliseconds — over a clean 7-day window, June 2–9, 2026. Cloudflare's Cloud Observatory flagged an outage annotation on AWS me-central-1 (Iranian strikes) spanning late March to May 1, 2026, which overlaps the AWS region-distribution window — noted because it is the clearest natural stress test of multi-region failover in the dataset.
July 2026 refresh (Q2 close plus year-over-year). This update pulled the two Cloud Observatory datasets the Radar API exposes on arbitrary historical windows, each for three windows (Q2 2025, Q1 2026, and the full Q2 2026 quarter): the cross-provider connection scorecard (origins/summary/origin, four RAW_VALUES metrics in milliseconds) and the per-provider region distribution (origins/summary/region?origin={amazon, oracle, microsoft, google}, metric=requests, PERCENTAGE-normalized). The Q2-over-Q2 comparison is the first clean like-for-like year-over-year in this post. A deliberate boundary: the NetFlows traffic-share figures (the "AWS carries 3.28% of global traffic" numbers) are not re-pullable as a historical per-ASN share through the Radar REST API. netflows/summary returns a protocol-category split (HTTP versus other), and netflows/timeseries returns a min-max-normalized relative index, not a percentage of global bytes for a given past quarter. Those share percentages come from Cloudflare's aggregated Cloud Observatory surface, so this refresh does not restate them for Q2; the June refresh's clean per-calendar-month series through May 2026 remains the freshest traffic-share reading, and the Q2 year-over-year layer is built only on the connection-quality and region-distribution datasets the API does expose. The original Q1 baseline, the regional NetFlows tables, and the June month-by-month series are all retained unchanged; the Q2 close is layered on top.
Limitations: Cloudflare Radar data reflects traffic visible to Cloudflare's network, which handles a substantial portion of global internet traffic but not all of it. Traffic routed through private peering, IXPs, or networks that don't interact with Cloudflare is underrepresented. ASN-level data may not capture traffic from subsidiary or acquired networks not yet migrated to the parent ASN. The "global" category in Cloud Observatory data reflects anycast and CDN-routed requests, not a specific region.
Supplementary revenue data sourced from Synergy Research Group, CRN, Holori, and Spacelift. Revenue figures reflect enterprise cloud infrastructure spending and may not correlate directly with traffic volume because pricing varies by service type, region, and negotiated discounts.
We plan to update this analysis quarterly as new Cloudflare Radar data becomes available.
Frequently asked questions
What are the top 3 cloud providers by market share?
The top three are Amazon Web Services (AWS), Microsoft Azure, and Google Cloud. By revenue, Q3 2025 shares were roughly 29%, 20%, and 13% per Synergy Research Group. By traffic in May 2026, AWS carries 3.28% of global internet bandwidth, Google Cloud 2.87%, and Azure 1.70% (the Q1 2026 baseline was 3.40% / 2.55% / 1.61%). Revenue rankings and traffic rankings agree on the top three but disagree on how big the gaps are.
Who are the Big 3 hyperscalers?
AWS, Microsoft Azure, and Google Cloud Platform. "Hyperscaler" means the ability to scale computing resources dynamically across massive, globally distributed infrastructure. Combined, they carry 7.85% of all global internet traffic as of May 2026 (7.57% in Q1) and account for roughly 63% of enterprise cloud spending across 165+ datacenter regions worldwide.
What 3 cloud computing providers hold the majority of the market share?
AWS, Microsoft Azure, and Google Cloud hold roughly 63% of the cloud infrastructure services market by revenue (Q3 2025). By traffic, they carry 7.85% of the entire internet's bandwidth as of May 2026 (7.57% in Q1). Revenue reflects enterprise spending. Traffic reflects actual workload volume. A company spending heavily on premium cloud services can inflate revenue share without producing much traffic.
How much internet traffic do major cloud providers handle in 2026?
As of May 2026, the Big Three carry 7.85% of all global internet traffic (up from 7.57% in Q1). AWS leads at 3.28%, Google Cloud at 2.87%, Microsoft Azure at 1.70%. Add Meta (1.43%), Akamai (1.04%), and Hetzner (1.00%) and the extended cloud ecosystem clears 11% of global traffic. North America alone: 17.30%, nearly 1 in 6 bytes.
What is the difference between cloud revenue share and traffic share?
Revenue share measures how much companies spend. Traffic share measures how many bytes each provider's network actually carries. Revenue favors providers with expensive premium services (AWS leads at 29%). Traffic favors providers with bandwidth-heavy workloads. Meta carries about 1.43% of global traffic (May 2026) from Facebook, Instagram, and WhatsApp but doesn't sell cloud services, so it has 0% cloud revenue share. Revenue data comes from financial reports and analyst firms like Synergy Research. Traffic data comes from network telemetry like Cloudflare Radar.
Which cloud provider has the fastest connection in 2026?
It depends on which part of the connection you measure. Measured from Cloudflare's edge over the Q2 2026 quarter, Google Cloud sets up connections fastest (48.6 ms TCP handshake), but AWS moves data fastest once connected: it has the lowest path latency (29.1 ms TCP RTT) and the fastest time to first byte (89.9 ms). Azure sits in the middle and Oracle Cloud is slowest on every metric except the handshakes. Year over year, AWS improved most on the path and first-byte metrics. (Source: Cloudflare Radar — origins/summary/origin, Q2 2025 / Q2 2026, pulled 2026-07-02.)
Is Oracle Cloud slower than AWS, Azure, and Google?
On most metrics, yes, but the reason shifted over the past year. Oracle actually narrowed its handshake gap between Q2 2025 and Q2 2026 (TLS handshake 121 ms to 102 ms), but its time to first byte got worse, from 130 ms to 184 ms, leaving it slowest by a wide margin. The cause is geographic concentration: more than half of all Oracle Cloud requests (50.4%) now route through a single Virginia region, us-ashburn-1, so edges far from the US East corridor pay a distance tax on every response. (Source: Cloudflare Radar — origins/summary/origin and origins/summary/region, Q2 2025 / Q2 2026, pulled 2026-07-02.)
How concentrated is AWS traffic in us-east-1?
Highly, and it deepened over the past year. In Q2 2026, 43.6% of all AWS requests hit a single region, us-east-1 in Northern Virginia, up from 38.7% a year earlier. The top three US regions (us-east-1, us-east-2, us-west-2) together carry 67.6%. That concentration held its high through a documented me-central-1 outage, which is a sign that multi-region disaster recovery is less widely practiced in production than infrastructure guidance assumes. (Source: Cloudflare Radar — origins/summary/region, Q2 2025 / Q2 2026, pulled 2026-07-02.)
Emma Davies
Data Analyst

