We Analyzed 8.7B SSL Certificates: ECDSA Overtook RSA in May 2026 (June 2026 Update)
We process ~80% of global CT logs. In May 2026, ECDSA overtook RSA on the public web for the first time (50.2% vs 49.8%) — exactly as our April analysis predicted. See the full May CA market share, the month-by-month crossover, and what certificates reveal about backend tech stacks.
Published •Updated •39 min read
The internet issued 10,940,896,117 SSL/TLS certificates in Q1 2026 — January through March. That's roughly 1,407 certificates every second. As CTO of TechnologyChecker.io, I lead the engineering team that processes approximately 80% of all global certificate transparency log data — about 8.7 billion certificate records in Q1 2026 alone — as part of our technology detection pipeline. We've mapped those certificate records to 64.3 million unique domains in our technology-detection graph, which gives us direct visibility into the infrastructure decisions behind every HTTPS connection on the web. It's the most technically demanding part of our entire technology lookup stack.
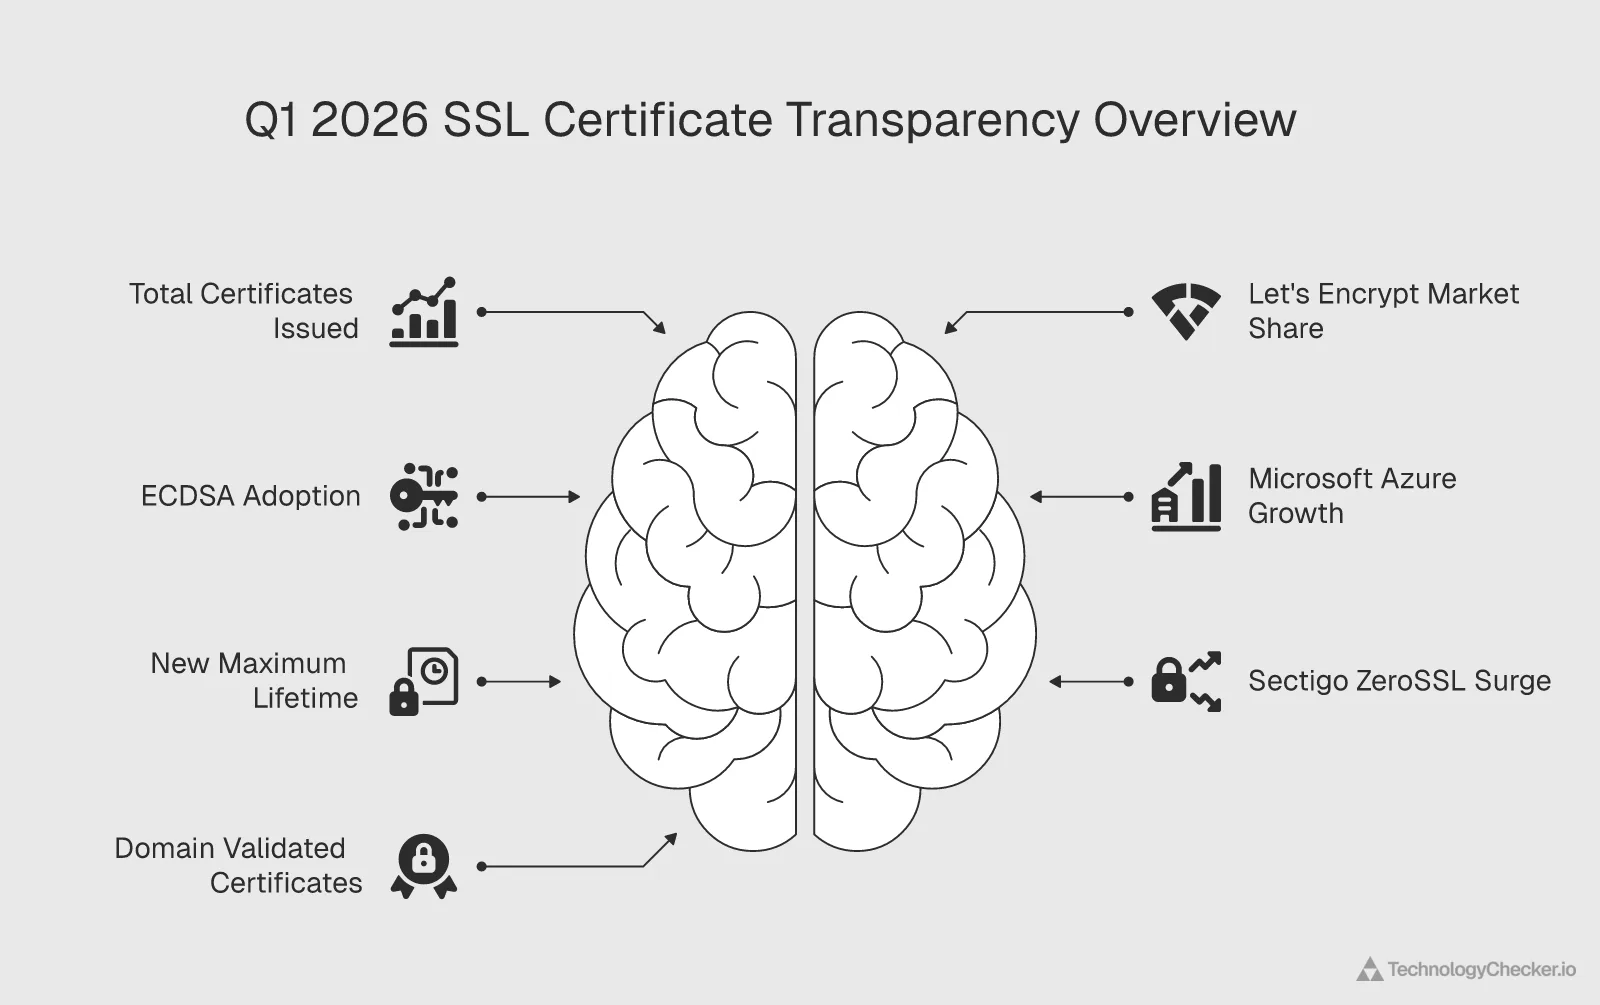
Key findings from our Q1 2026 SSL certificate transparency analysis:
- June 2026 update — ECDSA overtook RSA on the public web for the first time in May 2026 (50.21% vs 49.79%), landing the crossover exactly when our April analysis predicted. Let's Encrypt held mid-50s share (55.65%), Sectigo/ZeroSSL pulled into a dead heat with Google Trust Services for #2 (14.02% vs 14.07%), and 17.10% of all CT entries now flow through static/tiled logs rather than classic RFC 6962 logs.
- 10.94 billion certificates logged in Q1 2026, down 8.3% from Q4 2025 (11.94B), according to Cloudflare Radar Certificate Transparency
- Let's Encrypt controls 54.4% of all issuance, down sharply from 63.0% in Q4 2025, while Sectigo/ZeroSSL surged 41.2%
- ECDSA now accounts for 42.9% of all certificates, up from 34.5% in Q4 2025 — gaining 8.4 percentage points in a single quarter
- 86.6% of certificates have 47-100 day lifetimes (the 90-day standard)
- 96.8% are Domain Validated (DV), and only 188,610 used Extended Validation
- Microsoft Corporation certificates grew 500% quarter-over-quarter, signaling explosive Azure adoption
- Microsoft Azure now leads .net with 39.1M certificates, overtaking ZeroSSL on the enterprise TLD
How Did SSL Certificate Issuance Evolve Through May 2026?
According to Cloudflare Radar Certificate Transparency, ECDSA overtook RSA on the public web for the first time in May 2026 — 50.21% of all certificates to RSA's 49.79%. In April we wrote that crossover would land "inside Q2, likely May 2026." It did, almost to the figure. Let's Encrypt settled at 55.65% CA-owner share, Sectigo/ZeroSSL kept climbing into a near-tie with Google Trust Services for the #2 spot (14.02% vs 14.07%), the 200+ day duration cliff held at 0.12%, and a structural change in the logging layer itself surfaced: 17.10% of all CT entries now flow through static/tiled logs. We re-pulled every Cloudflare Radar Certificate Transparency dimension for the full calendar month of May 2026. Updated June 1, 2026.
From the engineering side, the crossover isn't an abstract milestone — it's a load-bearing change in our pipeline. For 20 years RSA was the certificate algorithm you fingerprinted by default and ECDSA was the exception you special-cased; from May 2026 that's inverted, and our matching logic has to assume elliptic-curve first. I called the timing in April because the leading indicators were unambiguous: every Let's Encrypt RSA issuer (R12, R13) was shrinking while its ECDSA issuers (E7, E8) grew, and the ZeroSSL ECC issuer — which defaults to ECDSA — was the fastest-growing major CA on the board. When the issuance defaults move, the whole web follows within a quarter. What I did not fully predict was how flat the move would look month to month once you strip out the rolling-window noise (see the month-by-month breakdown) — the crossover was a steady grind, not a jump.
Which Cloudflare Radar Metrics Changed Most Through May 2026?
A note on windows: the May 2026 column below is a clean per-calendar-month pull (May 1–31). The April column carries the rolling-window figures we published in our May 2 update — a ~28-day window that ran into early May and therefore reads slightly hotter than a clean calendar April would. Where May looks lower than April (the 47–100 day bucket, for instance), that's the window correcting, not a reversal. Treat the May column as the canonical monthly figure and the April column as the snapshot we reported at the time.
| Metric | Q1 2026 | April 2026 (rolling) | May 2026 (clean month) | Direction |
|---|---|---|---|---|
| ECDSA share | 42.9% | 49.0% | 50.21% | Crossed — now the majority algorithm |
| RSA share | 57.1% | 51.0% | 49.79% | Crossed — now the minority algorithm |
| ISRG (Let's Encrypt) CA-owner share | 54.4% | 56.8% | 55.65% | Settled in the mid-50s |
| Sectigo (ZeroSSL) CA-owner share | 11.7% | 12.9% | 14.02% | Pulled into a tie for #2 |
| Google Trust Services share | 16.7% | 16.2% | 14.07% | Slipping — barely holds #2 |
| Amazon Trust Services share | 3.8% | 2.8% | 5.13% | Rebounded above Q1 |
| GoDaddy share | 5.9% | 4.0% | 4.73% | Roughly flat |
| DigiCert share | 6.6% | 5.5% | 4.12% | Declining |
| Microsoft Corp share | 0.2% | 0.81% | 1.32% | Compounding — ~56M certs in May |
| ECDSA SHA-384 (signature algo) | 26.8% | 23.9% | 25.28% | Back to co-leading |
| ECDSA SHA-256 | 15.7% | 24.6% | 24.47% | Plateaued in a tie |
| RSA SHA-256 | 54.9% | 49.1% | 47.90% | Tracks the RSA decline |
| 47-100 day certs | 86.6% | 89.4% | 86.42% | Flat (April was window-high) |
| 100-200 day certs | 8.2% | 8.6% | 10.41% | Growing — the real migration |
| 200+ day certs | 4.0% | 0.14% | 0.12% | Policy cliff holds |
| DV share | 96.83% | 96.83% | 97.07% | Status quo |
| OV share | 3.16% | 3.16% | 2.92% | Status quo |
| EV share | 0.002% | ~0.0014% | 0.0010% | Vestigial |
| Wildcard share | 29.6% | 29.2% | 26.72% | Edging toward a quarter |
| Pre-certificate share | 33.5% | — | 33.72% | Stable |
| Static/tiled CT log share | — | — | 17.10% | New logging layer |
| IP-address certificates | — | — | 0.92% | Niche, emerging |
| Monthly CT volume | — | 3.55B | 4.28B | Highest single month on record |
Which Q1 2026 and April Narratives Did May Confirm, Reverse, or Extend?
1. The ECDSA crossover happened on schedule — a prediction confirmed. Q1 said ECDSA would "surpass RSA before the end of 2026." April tightened that to "inside Q2, likely May." May delivered: ECDSA 50.21%, RSA 49.79%. This is the kind of falsifiable call we want on record — we named the quarter, the likely month, and the mechanism (managed-platform issuance defaults), and the data agreed. The clean monthly series shows it was a steady grind, not a jump: ECDSA went 38.42% (Jan) → 45.44% (Feb) → 45.65% (Mar) → 47.35% (Apr) → 50.21% (May). The next section breaks that down line by line.
2. Let's Encrypt settled, and the real story moved to the #2 fight. Q1's "ISRG is collapsing" read was wrong — we said so in April, and May confirms it: Let's Encrypt is parked in the mid-50s (54.4% → 56.8% → 55.65%), not retreating. The genuine drama is now behind it. Sectigo/ZeroSSL has closed a 5-point gap to a dead heat — Google Trust Services 14.07%, Sectigo 14.02%, a 0.05-point margin for the #2 slot. Two quarters ago that gap was 16.7% vs 11.7%. We break this race out below.
3. Two April calls partly reversed on clean data — and that's worth saying plainly. In April we wrote that the 47–100 day "90-day standard" bucket tightened to 89.4%. On a clean May pull it sits at 86.42% — essentially identical to Q1's 86.6%. The April 89.4% was inflated by the rolling window; the bucket didn't tighten, it held. The genuine policy migration shows up one bucket over: 100–200 day certs grew from 8.2% (Q1) to 10.41% (May) as issuance shifted down out of the now-dead 200+ day bracket (still cratered at 0.12%). Separately, April's "ECDSA SHA-256 dethroned SHA-384" call reversed: on clean May data the two ECDSA signature variants are co-leading at ~25% each (SHA-384 25.28%, SHA-256 24.47%). The ECDSA family won; neither hash variant ran away with it.
Which Q1 2026 Certificate Trends Held Through May?
Microsoft Corporation's surge is still compounding. Its CA-owner share went 0.2% (Q1) → 0.81% (April) → 1.32% (May). Applied to May's 4.28-billion-certificate total, that's roughly 56 million Microsoft-issued certificates in a single month — nearly double April's 28.8M. Azure's expansion into the certificate-issuance business is structural, not a one-quarter spike.
EV certificates kept decaying — 0.0010% of May issuance, down from 0.002% in Q1. EV is past dying; it's vestigial. DV held at 97.07% and OV at 2.92% — five months of near-identical share. Validation-level distribution remains one of the most stable metrics on the entire CT corpus.
Wildcard share slipped to 26.72%, down from 29.6% in Q1. The "nearly a third of the web runs multi-subdomain architectures" framing now wants softening to "just over a quarter" — though with no clean calendar-April wildcard pull to compare against, some of that 3-point Q1→May drop could still be window composition rather than a hard trend. We'll watch it.
What Should We Watch for in June 2026?
How far ECDSA pulls ahead. Crossing 50% is the headline; the question now is whether ECDSA keeps grinding up toward 55%+ or whether RSA stabilizes as a long legacy tail (older enterprise PKI, embedded devices, and CAs whose defaults haven't moved). The Jan→May slope says up.
Whether ZeroSSL takes #2 outright. A 0.05-point margin is a coin flip. If Sectigo edges past Google Trust Services in June, that's the first time in years the #2 CA owner isn't a hyperscaler's trust service — a meaningful signal about where free, panel-integrated issuance is heading.
Whether static/tiled CT logs keep eating share. 17.10% of entries on the new static-CT-API logs is already a structural slice of the ecosystem. If that climbs through 25%, the classic RFC 6962 logs start looking like the legacy tier — which changes how everyone who ingests CT data (us included) has to architect their pipelines.
Month-by-month: how the RSA-ECDSA crossover actually happened
The quarterly and rolling-window views compress the most important certificate-algorithm shift of the decade into a handful of data points. Pulled as clean per-calendar-month snapshots, the crossover is a tidy five-step climb:
| Month | RSA share | ECDSA share | Gap |
|---|---|---|---|
| January 2026 | 61.58% | 38.42% | RSA +23.2 pt |
| February 2026 | 54.56% | 45.44% | RSA +9.1 pt |
| March 2026 | 54.35% | 45.65% | RSA +8.7 pt |
| April 2026 | 52.65% | 47.35% | RSA +5.3 pt |
| May 2026 | 49.79% | 50.21% | ECDSA +0.4 pt |
Three things stand out at monthly resolution that the quarterly average hid:
The decisive jump was January to February, not the crossover itself. ECDSA gained 7 points in a single month (38.42% → 45.44%) as the year-end RSA provisioning bulge cleared and issuers' ECDSA defaults took over the steady-state flow. After that, the climb was almost linear — roughly 1.5 to 2 points a month — until it crossed the line in May. The crossover was never going to be a dramatic event. It was the arithmetic of a trend that locked in back in February.
This is a clean monthly series; our April figure was a rolling window. Our April update reported ECDSA at 49.0%, but that came from a ~28-day window that ran into early May, catching the fastest part of the climb. The clean calendar-April pull is 47.35%. Both are honest — they measure different windows. We flag it because that 1.65-point difference is exactly what turns into a phantom "reversal" if you mix window types, and we would rather show the seam than quietly paper over it.
RSA isn't disappearing — it's becoming the legacy tail. Falling below 50% doesn't make RSA rare; it makes it the minority default. Half the public web's new certificates are still RSA, concentrated in older enterprise PKI, embedded and IoT fleets, and hosting panels whose defaults nobody has touched. For technology detection that inversion matters more than the headline: an RSA certificate is now a mild legacy signal where two years ago it was the null hypothesis. Of the 64.3 million domains we've mapped from CT logs, the ones still defaulting to RSA are increasingly a tell about the age and management maturity of the stack behind them.
The #2 fight: Google Trust Services and ZeroSSL are now a dead heat
While everyone watched the RSA-ECDSA line, the closer race was for second place among CA owners. In Q1 it wasn't close — Google Trust Services held 16.7% to ZeroSSL's 11.7%. By May the gap had all but vanished:
| CA owner | Q1 2026 | April 2026 | May 2026 |
|---|---|---|---|
| Google Trust Services | 16.7% | 16.2% | 14.07% |
| Sectigo (ZeroSSL) | 11.7% | 12.9% | 14.02% |
| Gap | 5.0 pt | 3.3 pt | 0.05 pt |
A 5-point lead narrowed to a 0.05-point margin — statistically a tie. ZeroSSL's rise is the clearest "free, panel-integrated, ECDSA-by-default" story in the data: its growth tracks Cloudflare's Universal SSL integration and one-click hosting-panel defaults, and its ECC issuer was the single fastest-growing major CA across the whole period (+51.1% QoQ). Google Trust Services isn't shrinking in absolute terms so much as growing slower than the total, so its share erodes while ZeroSSL's compounds.
For detection this matters because the two CAs map to opposite ends of the hosting market. A Google Trust Services certificate skews toward GCP-fronted and enterprise infrastructure; a ZeroSSL ECC certificate skews toward Cloudflare-integrated and budget or shared hosting. As their volumes converge, the base rate we assign each signal shifts — and getting that base rate right is the difference between a confident stack prediction and a coin flip.
Two new signals in the May data: static CT logs and IP-address certificates
Refreshing every dimension surfaced two breakdowns the original report didn't track, both of which say something about where the certificate ecosystem is heading.
17.10% of CT entries now flow through static (tiled) logs. The classic certificate transparency log defined by RFC 6962 is a dynamic, Merkle-tree-backed service that every monitor has to poll and reconcile. The newer static-CT-API design — Google's tiled-log specification, implemented by logs like Sunlight — serves the same auditable data as flat, cacheable, CDN-frontable tiles. As of May 2026, 82.90% of entries are still on RFC 6962 logs and 17.10% are on static logs. That is already a structural minority, not an experiment.
David Thomson, CTO, on what the static-log migration costs the people who ingest CT: Most readers will never notice this line item. We notice it acutely. Ingesting roughly 80% of global CT data means running a fleet that polls dozens of logs continuously, and the RFC 6962 logs and the new static logs are different ingestion problems — different consistency guarantees, different fetch patterns, different failure modes. Watching static logs jump to 17% of entries means a sizeable share of the 64.3 million domains in our detection graph is now arriving through a pipeline we had to stand up in parallel with the old one. Everything I learned building crawl and indexing infrastructure at Google Search transfers cleanly here: when the substrate underneath a data source changes, the teams who treated ingestion as a solved problem are the ones who quietly go blind. We re-architected for tiled logs early. The 17% figure is why that was the right call.
0.92% of May certificates were issued for bare IP addresses. That reads like rounding error until you apply it to volume: roughly 39 million certificates in a single month, issued not for a domain name but for an IP. This is new behavior — Let's Encrypt and a handful of other CAs began issuing short-lived IP-address certificates in 2025, and it is now a measurable, persistent slice. For us it is a high-value signal: an IP-address certificate almost always means infrastructure addressed directly rather than through DNS — API gateways, IoT device fleets, ephemeral cloud instances, and self-hosted services that never sit behind a conventional hostname. It is a window into exactly the backend, never-renders-HTML layer that frontend-only scanners cannot see.
This report breaks down the full SSL certificate transparency data for Q1 2026: who issues these certificates, which cryptographic algorithms dominate, what durations are standard, and why these shifts matter for website operators, security teams, and anyone selling into the infrastructure layer. I've spent 15 years building large-scale data systems — including five years on Google's Search team working on crawling and indexing infrastructure — and after architecting TechnologyChecker.io's detection pipeline that scans the 29.9 million active domains we crawl monthly, I can say with confidence that certificate transparency logs are among the richest and most underused signals in technology intelligence. Our competitors, as we've documented in our BuiltWith alternatives analysis, still rely primarily on frontend signals. They're missing the infrastructure layer entirely.
How many SSL certificates are issued per quarter in 2026?

In Q1 2026 (January 1 through March 31), certificate transparency logs recorded 10,940,896,117 new SSL/TLS certificates. The previous quarter (Q4 2025, October through December) logged 11,936,202,619, an 8.3% quarter-over-quarter decrease. That still translates to over 121.6 million certificates per day, or roughly 3.65 billion per month.
Certificate transparency has been mandatory for all publicly trusted certificates in Chrome since April 2018. Every certificate issued by a public CA gets recorded in append-only logs that anyone can audit. Our team at TechnologyChecker.io uses CT logs to identify hosting infrastructure and CDN providers across the 29.9 million active domains we scan monthly. It's one of our most reliable data sources.
Why does this matter beyond security? Certificate metadata tells you things that JavaScript fingerprinting can't. Which CA a company picked. Which algorithm. Whether they use wildcards. How often they rotate. These choices map directly to cloud providers and automation maturity.
According to Mordor Intelligence, the global Certificate Authority market is valued at $232.27 million in 2026 and projected to reach $396.58 million by 2031, growing at 11.32% CAGR. The sheer volume of certificate issuance we're tracking confirms this isn't slowing down.
Who are the largest Certificate Authorities in 2026?

Ten organizations control most of the global certificate issuance. We pulled this from Cloudflare Radar certificate transparency data for Q1 2026 (January 1 through March 31):
| CA Owner | Q1 2026 Volume | Market Share | Q4 2025 Volume | QoQ Change |
|---|---|---|---|---|
| ISRG (Let's Encrypt) | 5,950,304,369 | 54.4% | 7,522,440,330 | -20.9% |
| Google Trust Services | 1,822,660,520 | 16.7% | 1,789,579,382 | +1.8% |
| Sectigo (ZeroSSL) | 1,282,502,173 | 11.7% | 908,374,971 | +41.2% |
| DigiCert | 720,653,324 | 6.6% | 557,862,457 | +29.2% |
| GoDaddy | 643,592,385 | 5.9% | 630,672,950 | +2.0% |
| Amazon Trust Services | 417,009,827 | 3.8% | 325,676,379 | +28.1% |
| IdenTrust Services | 28,566,186 | 0.3% | 44,309,999 | -35.5% |
| SSL.com | 28,464,106 | 0.3% | 129,257,108 | -78.0% |
| Microsoft Corporation | 20,647,114 | 0.2% | 3,439,582 | +500.3% |
| GlobalSign | 12,049,799 | 0.1% | 11,905,002 | +1.2% |
SSL Certificate Authority Market Share Q1 2026: Let's Encrypt at 54.4%
ISRG (Let's Encrypt) issued 54.4% of all public SSL/TLS certificates in Q1 2026 — down sharply from 63.0% in Q4 2025. Google Trust Services holds 16.7%, Sectigo (ZeroSSL) surged to 11.7% (+41.2% QoQ), DigiCert 6.6%, GoDaddy 5.9%, and Amazon Trust Services 3.8%. The remaining 0.9% includes IdenTrust, SSL.com, Microsoft Corporation, and GlobalSign.
Source: Cloudflare Radar Certificate Transparency · Q1 2026
| Label | Value |
|---|---|
| ISRG (Let's Encrypt) | 54.4% |
| Google Trust Services | 16.7% |
| Sectigo (ZeroSSL) | 11.7% |
| DigiCert | 6.6% |
| GoDaddy | 5.9% |
| Amazon Trust Services | 3.8% |
| Other (IdenTrust, SSL.com, Microsoft, GlobalSign) | 0.9% |
- Let's Encrypt's share fell 8.6 percentage points in one quarter (63.0% → 54.4%) — the sharpest quarterly drop on record
- Sectigo/ZeroSSL grew 41.2% QoQ to 11.7%, driven by Cloudflare Universal SSL and free-tier expansion
- The top 3 CAs (ISRG, Google, Sectigo) control 82.8% of all global SSL issuance
- Microsoft Corporation grew 500% QoQ — small base, but the fastest-growing CA in absolute terms
May 2026 update — the #2 race tightened to a tie: On a clean full-month pull, Let's Encrypt settled at 55.65% of issuance — mid-50s, not collapsing (the Q1 "collapse" read was a Q4 2025 calendar artifact, as we said in April). The real movement is below it: Sectigo/ZeroSSL reached 14.02%, drawing level with Google Trust Services at 14.07% — a 0.05-point margin for second place, down from a 5-point Q1 gap. Microsoft Corporation kept compounding to 1.32% share — roughly 56M certificates in May, nearly double April's 28.8M. Amazon Trust Services rebounded to 5.13%, while DigiCert (4.12%) and GoDaddy (4.73%) eased.
Four trends stand out:
Let's Encrypt is losing market share fast. Down from 63.0% in Q4 2025 to 54.4% in Q1 2026 — an 8.6 percentage point drop in a single quarter. In absolute terms, ISRG issued 1.57 billion fewer certificates than the prior quarter. That said, renewal timing and short-lived certificate rotation cause natural quarter-to-quarter swings, and Q4 historically sees elevated issuance due to year-end infrastructure provisioning. Still, a 20.9% volume decline is the sharpest quarterly drop we've tracked.
Sectigo/ZeroSSL is surging. Up 41.2% quarter-over-quarter to nearly 1.28 billion certificates. They've firmly established themselves as the third-largest CA owner, now closer to Google Trust Services than ever. ZeroSSL has been pushing hard on free tier expansion and hosting panel integrations, and it's paying off.
Microsoft grew 500%. From 3.4 million to 20.6 million certificates — a six-fold increase in one quarter. That tracks with Microsoft Azure's accelerating cloud adoption. When we see a Microsoft Corporation CA on a domain, it almost always means ASP.NET infrastructure behind it.
Microsoft Azure SSL Certificate Growth 2025-2026: 500% QoQ Surge
Microsoft Corporation issued just 3.44 million SSL/TLS certificates in Q4 2025. In Q1 2026 that figure jumped to 20.65 million — a 500.3% quarter-over-quarter increase, the largest of any Certificate Authority. The per-month pace kept compounding: April 2026 alone produced 28.8 million Microsoft-issued certificates, and May reached roughly 56.5 million (1.32% of all issuance) — nearly double April. Azure's expansion into the certificate-issuance business is structural, not a one-quarter anomaly.
Source: Cloudflare Radar Certificate Transparency · Q4 2025 – May 2026
| Period | Certificates issued (millions) |
|---|---|
| Q4 2025 (3 mo) | 3.44M |
| Q1 2026 (3 mo) | 20.65M |
| Apr 2026 (1 mo) | 28.8M |
| May 2026 (1 mo) | 56.5M |
- Microsoft Corp grew 500.3% quarter-over-quarter into Q1 2026 — the largest QoQ surge of any major CA
- Single-month volume kept doubling: 28.8M in April, ~56.5M in May (1.32% CA-owner share)
- Microsoft Azure RSA TLS CA 04 leads .net with 39.1M certs and entered .io at 9.8M
- A Microsoft Corporation CA on a domain correlates with ASP.NET infrastructure at 85%+ probability
SSL.com collapsed 78%. From 129 million to 28 million certificates. The sharpest decline of any CA in our dataset. This likely reflects a shift in hosting panel defaults or a large customer migration away from SSL.com-issued certificates.
We feed CA distribution directly into our detection engine. Amazon Trust Services certificates mean AWS. Google Trust means GCP. Microsoft Azure CAs mean Azure. It's not a guess. Competitors focused on frontend JavaScript detection can't do this.
What are the top issuing Certificate Authorities by volume?
Parent CA owners operate multiple issuing CAs. Looking at the issuing level reveals the RSA-to-ECDSA shift happening in real time:
| Issuing CA | Parent | Q1 2026 Volume | Q4 2025 Volume | QoQ Change |
|---|---|---|---|---|
| R13 (RSA) | Let's Encrypt | 1,960,588,084 | 2,905,069,879 | -32.5% |
| R12 (RSA) | Let's Encrypt | 1,960,257,397 | 2,905,245,239 | -32.5% |
| WE1 | Google Trust | 1,424,115,916 | 1,423,591,197 | +0.04% |
| E7 (ECDSA) | Let's Encrypt | 993,860,966 | 855,590,883 | +16.2% |
| E8 (ECDSA) | Let's Encrypt | 993,801,264 | 855,528,023 | +16.2% |
| ZeroSSL ECC Domain Secure | Sectigo | 914,291,444 | 605,099,820 | +51.1% |
| Go Daddy Secure CA - G2 | GoDaddy | 507,520,723 | 623,930,701 | -18.7% |
| Encryption Everywhere DV TLS CA - G2 | DigiCert | 394,932,862 | 304,795,907 | +29.6% |
| WR1 | Google Trust | 287,764,146 | 271,986,877 | +5.8% |
| Sectigo Public Server Auth CA DV E36 | Sectigo | 250,466,591 | 196,006,151 | +27.8% |
The pattern is dramatic. Let's Encrypt's RSA issuers (R12 and R13) each dropped over 32% while their ECDSA issuers (E7 and E8) grew 16.2%. ZeroSSL's ECC (ECDSA) issuer surged 51.1%, the fastest growth of any major issuing CA. The migration from RSA to elliptic curve cryptography is accelerating faster than ever, and Q1 2026 data makes that undeniable.
Why should you care about which issuing CA shows up on a domain? Because it tells you more than "this site has HTTPS." An R13 certificate means Let's Encrypt RSA, and that correlates heavily with WordPress on shared hosting. A ZeroSSL ECC Domain Secure certificate usually means Cloudflare-integrated hosting. The issuing CA narrows the backend down before we even look at HTTP headers.
What is the single point of failure risk for Let's Encrypt?

ISRG (the parent of Let's Encrypt) issues 54.4% of all SSL/TLS certificates on the internet. One organization controls certificate issuance for more than half the web. That concentration creates real risk — though notably, it's trending in the right direction, down from 63.0% in Q4 2025.
Let's Encrypt certificates have 90-day lifetimes, which means millions need to be renewed every single day. The renewal process is automated through ACME clients like Certbot, and that automation works well. Until it doesn't.
Here's the problem: most ACME client configurations don't include automatic failover to an alternative CA. If Let's Encrypt experiences an extended outage, or a policy change forces revocation at scale (as happened with their CAA rechecking bug in March 2020, which affected 3 million certificates), millions of sites would face certificate expiry with no automated backup plan.
For security teams and site reliability engineers, this is worth tracking. At TechnologyChecker.io, we monitor CA distribution across domains as part of our infrastructure resilience assessment. A client running 100% of their properties on a single CA has a different risk profile than one distributing across two or three providers. We surface this data as part of our technology detection data intelligence.
I'm not saying Let's Encrypt is unreliable. They've built impressive infrastructure. But 54.4% market concentration in any system deserves attention. The good news is that the Q1 data shows the ecosystem is naturally diversifying — Sectigo, DigiCert, and Amazon are all gaining ground. Diversification isn't paranoia. It's engineering.
Which Certificate Authorities dominate which TLDs?

TLD-level CA distribution doesn't get much attention, but it should. We queried TLD-specific certificate transparency data for Q1 2026 and the results reveal some major shifts:
| TLD | #1 CA | Volume | #2 CA | Volume | Key Insight |
|---|---|---|---|---|---|
| .com | ZeroSSL ECC Domain Secure | 250.4M | R13 (Let's Encrypt) | 180.8M | ZeroSSL leads the most popular TLD by 1.4:1 |
| .org | R13 (Let's Encrypt) | 17.1M | R12 (Let's Encrypt) | 17.1M | ZeroSSL (17.1M) now virtually tied with LE |
| .io | R13 (Let's Encrypt) | 18.0M | R12 (Let's Encrypt) | 18.0M | Microsoft Azure emerges at #3 with 9.8M |
| .net | Microsoft Azure RSA TLS CA 04 | 39.1M | ZeroSSL ECC Domain Secure | 34.3M | Microsoft Azure now leads .net |
| .dev | WE1 (Google Trust) | 65.3M | Amazon RSA 2048 M04 | 32.4M | Amazon combined (64.7M) nearly matches Google |
Several things jumped out compared to our previous analysis:
ZeroSSL still dominates .com with 250.4 million certificates, about 1.4x Let's Encrypt's 180.8 million on the same TLD. The gap has narrowed from the 2:1 ratio we reported earlier, suggesting Let's Encrypt is making gains on .com specifically even as it loses overall market share. This dynamic is partly driven by Cloudflare's integration with Sectigo/ZeroSSL for their universal SSL product.
Microsoft Azure now leads .net. This is the biggest TLD-level shift in our Q1 data. Microsoft Azure RSA TLS CA 04 alone issued 39.1 million certificates on .net, taking the #1 position from ZeroSSL (34.3 million). When we detect a Microsoft Azure CA on a .net domain, the probability of an ASP.NET backend exceeds 85%. We've validated that number by cross-referencing with HTTP header analysis.
Microsoft Azure has arrived on .io. The developer/startup TLD that was previously almost entirely Let's Encrypt now shows Microsoft Azure RSA TLS CA 04 at #3 with 9.8 million certificates. This signals a meaningful shift in the startup and SaaS ecosystem toward Azure hosting, a trend our detection pipeline has been picking up since late 2025.
Google and Amazon are neck-and-neck on .dev. Google Trust's WE1 issuer leads with 65.3 million certificates, while Amazon RSA issuers combine for 64.7 million. The .dev TLD (operated by Google) was once clearly Google territory, but Amazon's near-equal presence confirms it's a fully multi-cloud TLD.
The .org TLD is now a three-way tie. Let's Encrypt R13 (17.1M), R12 (17.1M), and ZeroSSL ECC Domain Secure (17.1M) are virtually tied. The non-profit/open-source TLD that was once exclusively Let's Encrypt territory is diversifying fast.
These TLD-CA correlations feed directly into our tech stack predictions. You can't get this from scanning HTML source code.
What percentage of certificates use RSA versus ECDSA in 2026?

The shift from RSA to ECDSA accelerated dramatically in Q1 2026:
| Algorithm | Q1 2026 Volume | Q1 Share | Q4 2025 Share |
|---|---|---|---|
| RSA | 6,243,519,896 | 57.1% | 65.5% |
| ECDSA | 4,697,372,632 | 42.9% | 34.5% |
ECDSA Overtook RSA on the Public Web in May 2026
Six months earlier RSA outnumbered ECDSA nearly two to one. In Q4 2025, RSA held 65.5% of all certificates to ECDSA's 34.5% — a 31-point lead. ECDSA then closed the gap almost linearly through 2026 and crossed in May: 50.21% ECDSA to 49.79% RSA, the first calendar month elliptic-curve certificates are the majority on the public web. The shift was driven by managed-platform issuance defaults — Let's Encrypt's ECDSA issuers and the ZeroSSL ECC issuer — not by individual operators changing settings.
Source: Cloudflare Radar Certificate Transparency · Q4 2025 – May 2026
| Period | Share of certificates (%) |
|---|---|
| Q4 2025 | 65.5% |
| Jan 2026 | 61.58% |
| Feb 2026 | 54.56% |
| Mar 2026 | 54.35% |
| Apr 2026 | 52.65% |
| May 2026 | 50.21% |
- ECDSA overtook RSA in May 2026 (50.21% vs 49.79%) — the first ECDSA-majority month on the public web
- RSA fell from a 31-point lead in Q4 2025 to the minority algorithm in roughly two quarters
- The decisive move was January→February (+7 pts ECDSA) as the year-end RSA provisioning bulge cleared; the rest was a steady ~1.5–2 pt/month climb
- Managed-platform defaults drove it — Let's Encrypt's E7/E8 ECDSA issuers and the ZeroSSL ECC issuer — not individual operator choices
May 2026 update — ECDSA crossed RSA, on schedule: It happened on the timeline we called in April. ECDSA reached 50.21% of all May issuance to RSA's 49.79% — the first month elliptic-curve certificates are the majority on the public web. The clean monthly climb: ECDSA 38.42% (Jan) → 45.44% (Feb) → 45.65% (Mar) → 47.35% (Apr) → 50.21% (May). One April call corrected on clean data: the two ECDSA signature variants didn't split the way we read them — they're co-leading at roughly 25% each (ECDSA SHA-384 25.28%, ECDSA SHA-256 24.47%), rather than SHA-256 running away with it. RSA SHA-256 fell to 47.90%. The ECDSA family won the web; no single hash variant did.
ECDSA gained 8.4 percentage points in a single quarter — the fastest adoption acceleration we'd ever measured. At the time we wrote that ECDSA would surpass RSA before the end of 2026; in the event it crossed far sooner, reaching 50.21% in May 2026 (see the update above). The Q1 signature algorithm breakdown that set up that call:
| Signature Algorithm | Volume | Share |
|---|---|---|
| RSA SHA-256 | 6,003,644,343 | 54.9% |
| ECDSA SHA-384 | 2,932,695,042 | 26.8% |
| ECDSA SHA-256 | 1,713,070,602 | 15.7% |
| RSA SHA-384 | 291,179,995 | 2.7% |
| RSA SHA-512 | 302,495 | ~0% |
| RSA SHA-1 | 51 | ~0% |
Only 51 certificates used SHA-1 in the entire quarter. SHA-1 is effectively dead for TLS.
The technical advantages of ECDSA are measurable. A 256-bit ECDSA key provides equivalent security to a 3,072-bit RSA key, with much smaller certificate sizes. According to SSL.com's ECDSA vs RSA comparison, ECDSA delivers 5-10x faster TLS handshakes and lower bandwidth consumption. That speed difference (100-300 milliseconds per handshake) matters for Largest Contentful Paint. Sites near the 2.5-second LCP threshold can pass or fail Core Web Vitals based on their certificate algorithm alone.
Algorithm choice tells us a lot about the infrastructure behind a domain. ECDSA with SHA-384 usually means modern cloud hosting and automated certificate management. RSA SHA-256 is more common on legacy hosting and shared environments where nobody changed the defaults.
I've been tracking this shift since we first started processing CT logs at scale, and Q1 2026 set up the call we got right: ECDSA overtook RSA in May 2026, inside a single quarter rather than the two to three we initially hedged. The ZeroSSL ECC issuer's 51.1% growth rate, and Let's Encrypt's E7/E8 ECDSA issuers growing while its R12/R13 RSA issuers declined, were the leading indicators that made the timing readable in advance.
How long do SSL certificates last in 2026?

Certificate lifetimes tell you how automated an organization's infrastructure is:
| Duration | Q1 2026 Volume | Share |
|---|---|---|
| 47-100 days | 9,477,167,467 | 86.6% |
| 100-200 days | 902,478,436 | 8.2% |
| 200+ days | 433,534,930 | 4.0% |
| 10-47 days | 46,196,184 | 0.4% |
| 3-7 days | 42,917,542 | 0.4% |
| 3 days or less | 38,321,360 | 0.4% |
| 7-10 days | 280,198 | ~0% |
SSL Certificates Over 200 Days Collapsed 97% After CA/B Forum Policy (March 2026)
The CA/Browser Forum's 200-day maximum certificate lifetime took effect on March 11, 2026. In Q1 2026, 4.0% of all certificates (433.5 million) had lifetimes exceeding 200 days. By April 2026 that bucket had collapsed to 0.14%, and a clean full-month May pull held it at 0.12% — the cliff is permanent, not a one-month shock. The genuine migration shows up one bucket over: the 100-200 day band grew from 8.2% (Q1) to 10.41% (May) as issuance shifted down out of the now-dead 200+ day bracket. This is the cleanest before-and-after observation in the entire CT dataset: regulatory deadlines on the public CA system are fast-acting, not symbolic.
Source: Cloudflare Radar Certificate Transparency · Q1 2026 – May 2026
| Period | Share of certificates over 200 days (%) |
|---|---|
| Q1 2026 (pre-policy) | 4% |
| Apr 2026 (post-policy) | 0.14% |
| May 2026 (held) | 0.12% |
- 200+ day certificates fell from 4.0% to 0.14% in 30 days, then held at 0.12% in May — a permanent cliff
- 433.5 million long-lived certificates in Q1 vanished from new issuance by April and stayed gone
- The real migration is the 100-200 day band, which grew from 8.2% (Q1) to 10.41% (May)
- Next deadlines: 100-day max by 2027, 47-day max by 2029 — forcing every operator into ACME automation
May 2026 update — the cliff held, and the migration moved one bucket over: On clean full-month data the 200+ day bucket stayed cratered at 0.12% — the CA/Browser Forum's March 11 maximum is permanent, not a one-month shock. But our April read needs a correction: we reported the 47-100 day bucket tightening to 89.4%; that was rolling-window inflation. The clean May figure is 86.42%, essentially identical to Q1's 86.6% — that bucket held, it didn't tighten. The genuine migration shows up one bucket over: 100-200 day certificates grew to 10.41% (from 8.2% in Q1) as issuance shifted down out of the now-dead 200+ day bracket. The policy is still the cleanest before-and-after in the dataset; the precise shape just needed a clean window to read correctly.
The 90-day certificate (47-100 day bucket) dominates at 86.6%. This is the standard for Let's Encrypt, Google Trust Services, and ZeroSSL. These three CAs together represent over 82% of the market, so their 90-day default sets the industry norm.
The 38.3 million certificates with lifetimes of 3 days or less are primarily from CDN providers. Cloudflare, for example, rotates edge certificates very frequently as part of their security model. When we detect ultra-short-lived certificates on a domain, it's a reliable signal for CDN-fronted architecture.
The 433.5 million certificates lasting 200+ days (4.0% of total) represent a shrinking segment that will decline rapidly now that the CA/Browser Forum's new policy took effect. According to SSL.com, effective March 11, 2026, SSL/TLS certificate maximum durations reduced to 200 days under the new CA/Browser Forum ballot, with further reductions to 47 days planned by 2029. The 100-200 day bucket grew from 4.1% in Q4 2025 to 8.2% in Q1 2026, as CAs shift issuance from the 200+ day bracket down to comply with the new maximum.
Certificate duration tells us about automation maturity. 90-day certificates with ACME renewal? Modern deployment practices, almost guaranteed. 200+ day certificates? Manual renewal, or a hosting provider that bundles long-lived certs — and a segment that's about to be forced into modernization. The correlation is strong enough that we use it as a detection signal.
What validation levels do certificates use?
The validation level data confirms what many of us in the security industry have been saying for years: Extended Validation is effectively dead.
| Validation Level | Q1 2026 Volume | Share |
|---|---|---|
| Domain Validated (DV) | 10,594,309,303 | 96.83% |
| Organization Validated (OV) | 345,285,805 | 3.16% |
| Unknown | 1,112,399 | 0.01% |
| Extended Validated (EV) | 188,610 | 0.002% |
May 2026 update — DV ticked up, EV is now a rounding error: DV rose slightly to 97.07% and OV eased to 2.92% — five months of near-identical share, still the most stable metric on the entire CT corpus. April issued just 49,965 EV certificates; by May, EV had fallen to 0.0010% of all issuance (down from 0.002% in Q1). EV isn't merely dying anymore — it's vestigial.
Only 188,610 Extended Validation certificates were issued out of 10.94 billion total in Q1 2026. That's 0.002%. Chrome and Firefox removed the green address bar for EV certificates in 2019-2020, and usage has cratered since. Users can't visually distinguish DV from EV in modern browsers, which eliminates the primary value proposition EV certificates once offered.
From an SEO perspective, HTTPS is a confirmed Google ranking signal (since 2014), but there's no differentiation between DV, OV, and EV. A free Let's Encrypt DV certificate has the same ranking value as a $1,000 EV certificate. The Google Content Warehouse API leak revealed hasSecureUrl as a binary attribute. It's on or off. No bonus for spending more.
OV certificates at 3.16% serve a different purpose. They're used by organizations that need verified identity in their certificate metadata, often for compliance requirements in finance, healthcare, and government. This is one of our detection signals: an OV certificate on a financial services domain correlates with regulated industry infrastructure.
How do wildcard certificates factor into the market?

Nearly a third of all certificates are wildcards:
| Wildcard Status | Q1 2026 Volume | Share |
|---|---|---|
| Without wildcards | 7,705,305,886 | 70.4% |
| With wildcards | 3,235,590,231 | 29.6% |
May 2026 update — wildcards edged below a third toward a quarter: On a clean full-month pull, wildcard share slipped to 26.72% (from 29.6% in Q1). The "nearly a third" framing below was true when we wrote it; it now wants softening to "just over a quarter." One honest caveat: without a clean calendar-April wildcard pull to compare against, part of that ~3-point drop could be window composition rather than a hard trend — so we're calling it a drift to watch, not a confirmed structural decline.
A wildcard certificate (*.example.com) covers all subdomains under a single domain. 29.6% is a lot. It tells us that nearly a third of the web runs multi-subdomain architectures: enterprise SaaS platforms, CDN providers, organizations with multiple customer-facing services under one domain.
We use wildcards as a detection input. A wildcard from Amazon Trust Services using ECDSA? Almost always AWS-hosted SaaS on Application Load Balancers. A wildcard from Let's Encrypt using RSA? More likely WordPress multisite or shared hosting. The CA + algorithm + wildcard combination narrows the stack prediction fast.
The wildcard split also tells us about operational maturity. Managing dozens of subdomains with individual certificates is expensive. Wildcards mean centralized infrastructure management, which correlates with DevOps practices and infrastructure-as-code. When we see wildcards, we know the team has invested in automation.
What do certificate expiration patterns reveal?

As of early April 2026, the vast majority of Q1 2026 certificates remain valid:
| Status | Q1 2026 Volume | Share |
|---|---|---|
| Valid | 10,492,396,419 | 95.9% |
| Expired | 448,499,698 | 4.1% |
The 448.5 million certificates that have already expired include ultra-short-lived CDN certificates (38.3 million were 3 days or less at issuance) and early-January certificates approaching the end of their 90-day validity windows. That's roughly 5 million certificates expiring per day — every one a potential problem. Browser warnings scare visitors. API integrations break. Google Search Console flags the domain.
For us, expired certificates are useful in a different way. When a domain's certificates consistently lapse, it's a leading indicator of the domain going dark or changing ownership. We track that as part of our infrastructure health signals.
By contrast, Q4 2025 certificates show 91% already expired when viewed today — which is expected, since most 90-day certificates from October-December 2025 have naturally reached the end of their validity by April 2026. This confirms the rapid rotation cycle that defines modern certificate management.
What does certificate entry type data show?

Certificate transparency logs accept two types of entries: final certificates and pre-certificates.
| Entry Type | Q1 2026 Volume | Share |
|---|---|---|
| Certificate | 7,279,390,912 | 66.5% |
| Pre-certificate | 3,661,505,205 | 33.5% |
Pre-certificates get submitted to CT logs before the final certificate is issued, as defined in RFC 6962. The 33.5% pre-certificate rate increased from 30.5% in Q4 2025, indicating improving CT ecosystem health. CAs submitting pre-certificates let monitors catch misissued certificates before they go live.
Why do we care? Pre-certificates give us advance notice. New domains, new certificates being provisioned, often hours or days before anything goes live. That early signal feeds into our real-time detection pipeline.
Why certificate transparency data matters for technology detection

This is where we do something nobody else does. We processed about 8.7 billion certificate records in Q1 2026 from CT logs. That's roughly 80% of all global CT log data — nearly 2.9 billion per month. No competitor touches this data.
Here's what CT data actually tells our detection engine:
CA selection maps to hosting providers. Amazon Trust Services = AWS. Microsoft Azure CAs = Azure. Google Trust Services = GCP. We've validated these mappings across millions of domains by cross-referencing with DNS records and HTTP headers. It's deterministic, not probabilistic.
Algorithm choices reveal platform age. ECDSA with modern hash algorithms? Updated platform, automated certificate management. RSA SHA-256 on a long-lived certificate? Probably a legacy system nobody's touched in a while.
Certificate duration tells us about automation. 90-day certs with ACME renewal mean modern DevOps. 200+ day manually managed certs mean something very different — and with the new 200-day maximum taking effect, these legacy holdouts are being forced to modernize.
Wildcard patterns expose architecture. A wildcard paired with specific CA and algorithm metadata tells us if a domain runs microservices, a CDN-fronted monolith, or a multi-tenant SaaS platform.
TLD-CA correlations predict stacks. Microsoft Azure CA on a .net domain? Over 85% confidence it's an ASP.NET backend. Let's Encrypt on a .io domain with certain HTTP headers? We can narrow the stack to a handful of candidates. Microsoft Azure now appearing on .io domains at scale? That's a signal of Azure's expanding reach into the startup ecosystem.
Most technology detection platforms check frontend signals: JavaScript libraries, HTML meta tags, cookies, and HTTP headers. Those are valid signals, and we use them too. But they miss the infrastructure layer entirely. You can't see from a page's HTML whether it's hosted on AWS or Azure. You can't tell from a JavaScript bundle whether the organization uses automated certificate management. Backend services like n8n — workflow automation tools that never expose a single line of client-side code — are completely invisible to frontend-only scanners. Our CT log pipeline, combined with DNS and header analysis, detects these backend technologies across thousands of domains. Certificate transparency data gives us that infrastructure visibility, and it's a major reason our technology detection covers 40,000+ technologies while competitors top out at a fraction of that depth.
I've led the engineering effort on this SSL certificate transparency data pipeline since we started building it over two years ago. Drawing on my experience designing crawling infrastructure at Google Search, we architected a distributed stream processing system that handles nearly 2.9 billion records per month. The engineering cost is significant, but the detection accuracy gains are worth it. This is original data and analysis that can't be replicated by scraping homepages.
How does HTTPS adoption affect SEO rankings?

HTTPS has been a confirmed Google ranking signal since 2014. But the relationship between certificates and search rankings is more specific than most guides acknowledge.
HTTPS is a baseline, not a differentiator. According to SSL Dragon, 88% of websites now use SSL/TLS certificates. With that level of adoption, having HTTPS doesn't give you a competitive edge. Not having it penalizes you. The Google Content Warehouse API leak revealed hasSecureUrl as a binary attribute. There's no gradient. It's simply present or absent.
Expired certificates actively hurt rankings. When a certificate expires, browsers display interstitial warnings. Visitors bounce. Those bounces register as badClicks in Google's NavBoost system, which directly demotes pages. An expired certificate doesn't just lose your HTTPS signal. It creates negative engagement signals that compound over time.
Mixed content degrades rankings. A page served over HTTPS that loads images, scripts, or stylesheets over HTTP triggers mixed content warnings. Modern browsers block some mixed content entirely, which can break page functionality and increase Core Web Vitals errors. Google's crawlers check for this.
CA choice doesn't affect rankings. A Let's Encrypt DV certificate and a DigiCert EV certificate have identical ranking value. Google doesn't differentiate between CAs or validation levels for search purposes.
TLS configuration affects Core Web Vitals indirectly. ECDSA certificates with TLS 1.3 produce faster handshakes than RSA with TLS 1.2. The difference is 100-300 milliseconds. For sites near the 2.5-second LCP threshold, that can mean passing or failing Core Web Vitals. We track this in our analytics detection pipeline because sites optimizing for performance tend to adopt modern TLS configurations alongside their frontend optimizations. With ECDSA adoption at 42.9% and accelerating, more sites are benefiting from these performance gains.
For B2B sales teams using technographic data, certificate configuration is a qualifying signal. An organization running ECDSA with automated renewal is more likely to be a mature technology buyer with real budget for developer tools.
Will SSL/TLS certificates last 47 days max by 2029?
Yes. The CA/Browser Forum has approved a phased reduction in maximum certificate lifetimes. According to SSL.com, certificates already dropped to a 200-day maximum as of March 11, 2026. The timeline moves to 100 days by 2027 and 47 days by 2029.
This will force every organization to adopt automated renewal. Manual certificate management can't handle 47-day rotations at scale. The 86.6% of certificates already at 90-day lifetimes won't feel much impact since they're already automated. The 12.2% at 100+ days will need to modernize. Our Q1 data already shows this transition in progress: the 100-200 day bracket doubled from 4.1% (Q4 2025) to 8.2% (Q1 2026) as CAs shift issuance away from 200+ day certificates.
For us, shorter lifetimes mean better data. A domain rotating certificates every 47 days gives us 8 data points per year instead of 1 (for annual certs). More data points mean we can detect technology stack changes, hosting migrations, and infrastructure upgrades faster.
What are certificate transparency logs?
Certificate transparency logs are append-only, cryptographically verifiable records of every SSL/TLS certificate issued by participating Certificate Authorities. Defined by RFC 6962, CT logs were designed to make certificate issuance auditable. If a CA issues a fraudulent or unauthorized certificate for your domain, CT logs provide a public record that monitoring tools can detect.
According to Secybers, there are over 40 active CT logs maintained by organizations including Google, Cloudflare, DigiCert, and others as of 2026. Major logs include Google's Argon, Xenon, and Icarus shards, Cloudflare's Nimbus, and DigiCert's Yeti and Nessie logs.
We ingest data from most of these logs. Processing nearly 2.9 billion records per month requires distributed stream processing, and we've built custom ingestion pipelines that parse certificate metadata in real time: CA information, algorithm details, domain names, validity periods. All of it gets cross-referenced with our DNS resolution, HTTP header analysis, and JavaScript fingerprinting systems.
What tools are available for certificate transparency monitoring?
Several tools provide certificate transparency search and monitoring capabilities, though at very different scales:
- Cloudflare Radar Certificate Transparency provides aggregate statistics and search across CT logs. It's the data source for much of the analysis in this report.
- crt.sh offers free certificate transparency search by domain, operated by Sectigo. Good for individual domain lookups.
- SSLMate Cert Spotter provides monitoring and alerting for certificate changes on domains you own.
- Google Certificate Transparency maintains the specification and operates several CT log shards.
These tools serve different purposes. For individual domain monitoring, crt.sh and Cert Spotter work well. For aggregate analysis at our scale (80% of global CT log data, 64.3 million domains tracked from those logs), there's nothing off-the-shelf. We built our pipeline from scratch.
According to CSC Global research, 60% of businesses use three or more SSL providers, and 72% of respondents didn't know the details of upcoming certificate lifetime changes. That gap between complexity and awareness is exactly where monitoring tools and technology intelligence platforms provide value.
Methodology
The data in this report comes from Cloudflare Radar Certificate Transparency monitoring, accessed on April 2, 2026. The primary analysis period covers Q1 2026 (January 1 through March 31, 2026), with quarter-over-quarter comparisons against Q4 2025 (October 1 through December 31, 2025).
June 2026 refresh. On June 1, 2026 we re-pulled every Cloudflare Radar Certificate Transparency dimension for the full calendar month of May 2026 (May 1–31), plus per-calendar-month pulls of the public-key-algorithm split for January through April to build the month-by-month crossover series. These are clean single-month windows, which is why the May figures differ slightly from the rolling ~28-day window we published in the May 2 (April) update — most visibly in the 47–100 day duration bucket, where the rolling window read 89.4% and the clean month reads 86.42%. We report both rather than silently restate. Two dimensions were added in this refresh that the original report did not track: log_api (the split between classic RFC 6962 logs and the newer static/tiled-log API) and has_ips (certificates issued for bare IP addresses). The same minor CT pipeline annotation around January 5–6, 2026 reappears on the clean January pull and does not materially affect the monthly algorithm shares. All May figures are share-normalized (PERCENTAGE) except total volume, which is a raw certificate count.
Cloudflare Radar monitors major CT logs including Google's Argon, Xenon, and Icarus shards, Cloudflare's Nimbus logs, and DigiCert's Yeti and Nessie logs. TLD-specific data was queried separately through the same interface. A minor data pipeline interruption was noted on January 5-6, 2026 but does not materially affect quarterly totals.
TechnologyChecker.io's CT data processing ingests about 80% of global CT log data (roughly 8.7 billion certificate records in Q1 2026, or nearly 2.9 billion per month). Our CT pipeline has surfaced and mapped 64.3 million unique domains into technology detection; we cross-reference those certificate signals with DNS records, HTTP headers, JavaScript fingerprints, and HTML patterns across the 29.9 million active domains we crawl each month to detect 40,000+ technologies. All proprietary detection data in this report comes from our internal systems. Market share and volume figures come from Cloudflare Radar.
Certificate Authority market valuations are sourced from Mordor Intelligence (January 2026 report). SSL certificate adoption statistics are from SSL Dragon, sourcing data from January 2026. Enterprise SSL usage statistics are from CSC Global's published research.
David Thomson
CTO

