Internet Outage Tracker Q2 2026: 25 Disruptions, Exam Shutdowns Overtake Power as the Top Cause (July 2026 Update)
Q2 2026 internet outage report: government-directed exam shutdowns were the #1 cause (56% of events), mirroring Q2 2025's 62%. Iran's record 87-day blackout ended, Iraq ran exam blackouts through June, and power failures — Q1's top cause — nearly vanished.
Published •Updated •63 min read
We've now tracked internet outages across two full quarters of 2026 using Cloudflare Radar data — 26 disruptions in Q1, 25 more in Q2. This July update closes out Q2 (April–June) and, for the first time, measures the quarter against two baselines: Q1 2026, and the same April–June window a year ago. The headline isn't the count, which barely moved. It's that the cause mix rotated completely — Q1 was a power-failure quarter, Q2 was a government-shutdown quarter, with exam-season blackouts making government-directed outages 56% of all events (they were 62% in Q2 2025). Iran's record 87-day blackout ended, Iraq ran coordinated exam shutdowns straight through June, and this report breaks down every incident with verified traffic data, root-cause analysis, and business impact.
I'm Emma Davies, data analyst at TechnologyChecker. I've spent the better part of two quarters pulling every outage event, traffic anomaly, and ASN-level signal from Cloudflare Radar's API — first for Q1 2026, now through the end of Q2. What surprised me wasn't the volume of disruptions but how completely the causes shifted between the two quarters. Military strikes on cloud data centers in Q1? A wave of exam-week shutdowns in Q2? Neither was in any risk model I'd seen before this year.
Internet Outages in Q2 2026: The Full-Quarter Picture
Q2 is done, and it closed the way it ran all quarter: with a government somewhere flipping the internet off during exam week. I re-pulled Cloudflare Radar's outage center and traffic-anomaly feeds for the full quarter (April 1 – June 30) and, for the first time in this report, lined Q2 up against two baselines: the Q1 2026 quarter documented below, and the same April–June window a year ago. Updated July 2, 2026.
The one-line summary: Q2 2026 logged 25 curated disruptions (essentially flat against Q1's 26), but the cause mix rotated almost completely. Q1 was a power-failure quarter (42% of events). Q2 was a government-shutdown quarter: 14 of 25 events (56%) were government-directed, overwhelmingly exam-season blackouts. Iran's record 87-day shutdown ended on May 26. And the most useful thing the year-over-year view told me is that this isn't a 2026 quirk. Q2 is exam-shutdown season, and it looked the same in 2025.
Key findings — Q2 2026 internet outage report:
- 25 curated disruptions in Q2 2026 across 10 countries in Cloudflare's outage center (a wider spread appears in the unverified anomaly feed), flat against Q1's 26
- Government-directed shutdowns were the #1 cause at 56% (14 of 25), up from 15% in Q1 2026. The cause mix rotated from power in Q1 to politics in Q2
- Iran's 87-day national blackout ended May 26, 2026, the longest single event in our tracker
- Iraq ran coordinated exam shutdowns straight through June (June 2, 11, and 28), exactly the continuation we flagged in the May update
- Year over year, Q2 is exam season: government-directed events were 56% of Q2 2026 and 62% of Q2 2025, the dominant cause in both years
- Power failures collapsed as a cause: 42% of Q1 2026 events fell to just 4% (1 of 25) in Q2, because Cuba's grid stayed up all quarter
- New Q2 failure modes Q1 never produced: a national power failure in Tanzania, a magnitude-7.5 earthquake in Venezuela, and a self-inflicted DNSSEC fault in Germany
June's disruptions: Iraq's exam calendar delivered exactly as forecast
The May update closed by saying we'd be watching Iraq's exam calendar and the same five ISPs at 03:00 UTC. June answered: Iraq logged three separate exam-window shutdowns, and its networks topped the country-level anomaly feed with 10 flagged disruptions, more than any other location. The seven curated events Cloudflare verified in June:
| Date | Location | Cause | Scope | Notes |
|---|---|---|---|---|
| Jun 2 | Iraq | Government-directed (exam) | Regional | Exam-window shutdown |
| Jun 11 | Iraq | Government-directed (exam) | Regional | Exam-window shutdown |
| Jun 21–22 | Saint Lucia | Cable cut | Network | Damaged subsea fibre disrupted Flow services |
| Jun 23 | Global | Unknown | Platform | Meta outage across its social + messaging apps |
| Jun 24–25 | Venezuela | Natural disaster | Nationwide | Magnitude-7.5 earthquake |
| Jun 27 | Tanzania | Power outage | Nationwide | National grid failure dropped traffic across multiple ISPs |
| Jun 28 | Iraq (Kurdistan) | Government-directed (exam) | Regional | Shutdown to prevent exam cheating |
Two of these are worth pausing on. Tanzania is the quarter's one clean power-grid failure. The cause that dominated Q1 barely registered in Q2, and when it did, it was a single nationwide event, not a cluster. And the June 23 Meta outage is a reminder that not every "internet outage" is a country going dark; sometimes it's one platform that half the planet treats as the internet.
June's country-level anomaly signal, and the Congo watch resolved
Cloudflare's raw traffic-anomaly feed catches disruptions before the editorial team writes them up. Across June it attached these countries to confirmed anomalies (the curated events above are a subset; most anomalies are ASN-level signals with no single country tag):
| Country | Confirmed anomalies (June 2026) |
|---|---|
| Iraq | 10 |
| Congo | 5 |
| Azerbaijan | 3 |
| Andorra | 2 |
| Algeria | 2 |
| Jordan | 2 |
| Egypt · Gambia · Guinea · Guyana · DR Congo · Jamaica · Venezuela · Saint Lucia · Papua New Guinea · Seychelles · South Sudan · Togo · Tanzania · Costa Rica · St. Vincent | 1 each |
Source: Cloudflare Radar annotations/outages and traffic_anomalies/locations endpoints, queried for the June 1–30, 2026 window. Quarter and year-over-year counts below use the same annotations/outages feed for Q1 2026, Q2 2026, and Q2 2025.
That resolves a watch I opened in May. Congo logged eight anomalies in May and I put it on the Q2 watchlist as a persistent trouble spot. June came in at five: still elevated, still the second-busiest location, but easing rather than escalating. Not a nationwide blackout, just the same quiet drumbeat of regional disruptions. It stays on the watchlist into Q3, one notch lower.
Q1 vs Q2 2026: the cause mix rotated from power to politics
The event count barely moved: 26 in Q1, 25 in Q2. What changed is what caused them:
| Cause | Q1 2026 | Q2 2026 |
|---|---|---|
| Government-directed | 15% (4) | 56% (14) |
| Power failure | 42% (11) | 4% (1) |
| Military action | 19% (5) | 8% (2) |
| Cable cut | 4% (1) | 8% (2) |
| Weather / natural | 12% (3) | 8% (2) |
| Software / technical | 8% (2) | 4% (1) |
| Other (DNS, cyberattack, unknown) | — | 12% (3) |
If you read the Q1 report and concluded "power failures are 2026's defining outage cause," Q2 says not so fast. That was a Q1 signal, tied to Cuba's grid collapses and the AWS Middle East power/military cluster, none of which recurred. Q2's defining cause is the exam-season shutdown: a completely different failure mode, with a completely different owner (a government, not a grid).
Q2 2026 vs Q2 2025: this year versus last year
Here's where the year-over-year view earns its keep. Cloudflare's curated outage center logged 65 events in Q2 2025 against 25 in Q2 2026, which looks, at a glance, like the internet got dramatically more stable. Before anyone runs with that headline, look at what's underneath it:
| Metric | Q2 2025 | Q2 2026 |
|---|---|---|
| Curated events | 65 | 25 |
| Distinct countries (curated) | 24 | 10 |
| Government-directed | 62% (40) | 56% (14) |
| Power failure | 12% (8) | 4% (1) |
The 65-vs-25 gap is real, but it is mostly an accounting artifact of one cause: government-directed shutdowns get logged day by day. Q2 2025's exam season (across Syria, Iraq, and others) produced 40 separate government-directed events; Q2 2026's produced 14. Strip that category out and the two quarters are far closer: 25 non-government events in 2025 versus 11 in 2026. So the honest reads are two, not one:
- The seasonal pattern is stable. Government-directed shutdowns were the #1 cause in both Q2s (62% and 56%). Q2 is exam season across the Middle East and North Africa, every year. If you operate there, plan your June around it.
- The count is a coverage-sensitive number, not a reliability index. Don't cite "outages fell 62% year over year" as proof the internet is healing. The distinct-country spread narrowed (24 → 10) and fewer exam-days were logged, but the underlying vulnerability (a government able to switch a country off for an exam) is unchanged.
What we're watching for Q3 2026
- Iraq's exam calendar, part two. If June's three shutdowns were the tail of the spring exam season, July should quiet down. If they don't, Iraq is running the Sudan playbook year-round.
- Iran staying online. The 87-day blackout ended May 26. Iran has flipped the national kill switch twice in 2026. The Q3 question is whether the summer holds.
- Congo's drumbeat. Eight anomalies in May, five in June. A third straight month in the top three earns Congo its own section.
- Whether power comes back as a cause. Q2's 4% power share is almost certainly a Cuba-shaped hole, not a structural improvement. One hot, grid-stressed summer month could reverse it.
The month-by-month detail for the rest of the quarter (May, April, and the original Q1 2026 baseline this report was built on) follows below.
Key findings from our Q1 2026 internet outage report:
- Iran has been offline for 38+ consecutive days (Feb 28 onward), with 10+ ISPs simultaneously dropping traffic
- AWS ME-CENTRAL-1 (Dubai) and ME-SOUTH-1 (Bahrain) experienced four distinct outages totaling 31+ days of disruption
- Cuba's national power grid disconnected three times in 18 days (March 4-23), each time bringing internet access to zero
- Power failures caused 42% of all Q1 2026 outages, consistent with 2025 trends
- Government-directed shutdowns accounted for 4 of 26 events but produced the longest disruptions (avg. 19 days)
- 15 countries across 5 continents were affected, with the Middle East and Caribbean hit hardest
- Military actions drove 5 events, up from near-zero in Q1 2025
What Internet Outages Happened in May 2026?
The headline of the May data is a resolution, not a new disruption. Iran's nationwide internet shutdown ended on May 26, 2026, after 87 consecutive days offline — by Cloudflare Radar's traffic record, the longest single event in our tracker. Both AWS Middle East regions stayed clean for the full month. Government-directed shutdowns didn't stop, though. They moved: Iraq ran coordinated multi-ISP blackouts on May 20 and May 24 carrying the same exam-window signature Sudan showed in April. One new technical fault hit a major economy when a batch of faulty DNSSEC signatures broke domain resolution for users in Germany on May 5. I re-pulled Cloudflare Radar's outage center and traffic-anomaly feeds for the full month, May 1–31. Updated June 1, 2026.
For 87 days I'd opened Cloudflare Radar every morning to the same flat line out of Iran. On May 26 it moved. Traffic from the major Iranian networks climbed back toward baseline over a few hours — not the instant kill-switch drop I watched on February 28, but a slower, staged return. After three months of a country staying dark, the recovery felt almost anticlimactic. Here's the part I got wrong: in April's update I wrote that if Iran stayed offline through May, the blackout would cross 90 days and tip into the zone where banking and healthcare failures compound. It ended at 87. Three days short of my own threshold. Close enough that the warning held in spirit, off by enough that I'm flagging it. Predicting the end date of a political shutdown is guesswork, and I should have framed it as a range, not a line in the sand.
How long was Iran's shutdown compared to other national blackouts?
Eighty-seven days is a long time for a country to be offline, but it helps to see the number against the historical record. The chart ranks Iran's February–May 2026 shutdown against the longest documented government-directed blackouts. Taller bars are longer outages.
Iran's 87-Day Blackout in Context: Long, But Not the Longest on Record
Iran's nationwide internet shutdown ran 87 consecutive days, from February 28 to May 26, 2026, by Cloudflare Radar's traffic record — the longest single event in our quarterly outage tracker. It is not, however, the longest national-scale blackout on record. Jammu & Kashmir endured 213 days of absolutely no internet from August 2019 before 2G was partially restored in January 2020 (and 552 days before full 4G returned). Set against Sudan's 36-day 2019 blackout and Iran's own 24-day January 2026 shutdown, the 2026 event is exceptional but part of a worsening pattern, not an outlier without precedent.
Source: Cloudflare Radar; NetBlocks; Internet Society Pulse / SFLC.in · 2019–2026
| Shutdown event | Consecutive days fully offline |
|---|---|
| India J&K 2019 | 213d |
| Iran Feb–May 2026 | 87d |
| Sudan 2019 | 36d |
| Iran Jan 2026 | 24d |
| Uganda Jan 2026 | 4d |
- Iran's Feb–May 2026 shutdown lasted 87 days — the longest single event in our outage tracker
- It still ran well short of Jammu & Kashmir's 213-day 2019 full blackout, the longest documented
- Iran's two 2026 shutdowns (24 + 87 days) put the country offline for 111 days in roughly five months
- Nationwide government-directed shutdowns now routinely cross the 1-month mark — Sudan 2019 ran 36 days
Iran's 2026 shutdown is the longest single event in our tracker, but it isn't the longest on record. Jammu & Kashmir endured 213 days of total internet blackout from August 2019 before authorities restored even low-speed 2G in January 2020, and 552 days before full 4G returned — the longest internet shutdown ever imposed in a democracy, though it was regional (the territory's 9–10 million people) rather than nationwide. What's striking about Iran isn't any one event. It's the frequency. The country's two 2026 shutdowns — 24 days in January, 87 days from February — put Iran offline for 111 of the year's first 146 days. That's the pattern worth watching: not a single record-breaking blackout, but a government treating the kill switch as a routine instrument.
What new disruptions did Radar verify in May?
The curated outage center logged few new events in May — a quiet month by headline count. The raw traffic-anomaly feed told a fuller story. That feed catches disruptions before Cloudflare's editorial team verifies and writes them up, and across May 1–31 it flagged 47 anomalies: 40 verified or confirmed (Cloudflare tags these VERIFIED or TP) and 7 still unverified. I dropped the unverified set — mostly a cluster of Turkmenistan anomalies I couldn't independently confirm — and worked from the 40 confirmed events. Two of them matter.
The first is Iraq, May's version of April's Sudan story. The signature is unmistakable: five separate ISPs — ZAINAS-IQ, Asiacell, HulumTele, Earthlink, and halasat — dropped traffic at the same minute, 03:00 UTC, on both May 20 and May 24. That's 6:00 a.m. in Baghdad, and it lines up with Iraq's documented practice of cutting internet from 6–8 a.m. during national exam sessions to stop question leaks, a measure Cloudflare has tracked since 2015. One honesty caveat: the anomaly feed doesn't attach a cause, so the exam attribution is my read of the timing and the coordinated multi-ISP pattern, not an official label. But the May 20 start date matches Iraq's exam calendar to the day, and five ISPs don't fail in lockstep by accident. When the country running coordinated shutdowns changes but the playbook doesn't, the lesson from April holds: exam-season blackouts are a recurring regional tool, not a one-country story.
The second is Germany, and it's a different kind of failure. On May 5, a distribution of faulty DNSSEC signatures broke domain-name resolution for affected users — a self-inflicted technical fault, not an attack or a political order. DNSSEC exists to make DNS answers tamper-proof by signing them; when the signatures themselves are wrong, validating resolvers reject the answers and the lookups fail. The security layer meant to make the internet more trustworthy became a single point of failure. We track how widely this protocol is deployed in our DNSSEC adoption report, and Germany is among its heavier adopters, which is part of why a signature fault there was visible at the country level.
One more country ran quietly through the whole month. Congo logged eight separate verified anomalies in May, more than any other single location in the feed. None was a dramatic nationwide blackout, but the steady repetition of regional disruptions — in a country that already appeared twice in our Q1 data, for a submarine-cable cut and an election shutdown — puts Congo on the Q2 watchlist as a persistent trouble spot.
When I ranked the confirmed events by country, the concentration is hard to miss. Here are the locations Cloudflare's anomaly feed attached a country to across May 1–31 (confirmed events only; the larger share of events are ASN-level signals with no single country tag):
| Country | Confirmed anomalies (May 2026) |
|---|---|
| Congo | 8 |
| Guyana | 2 |
| Andorra | 2 |
| Iraq | 1 |
| Gabon | 1 |
| Niger | 1 |
| Chad | 1 |
| Papua New Guinea | 1 |
| New Caledonia | 1 |
| Saint Lucia | 1 |
| Turkmenistan | 1 |
Source: Cloudflare Radar traffic_anomalies and traffic_anomalies/locations endpoints, queried for the May 1–31, 2026 window. The locations feed counts every anomaly regardless of status, so Congo shows 11 there once the three I couldn't verify are included; the table above keeps to the confirmed set. Congo's eight is more than the rest of the named list combined — a quiet, sustained pattern rather than one big outage, which is exactly why it earns a Q2 watch over louder one-day events elsewhere.
How were the carryover outages resolved?
| Event | April status | May resolution |
|---|---|---|
| Iran nationwide shutdown (since Feb 28) | "64+ days, ongoing" | Resolved May 26 — 87-day total, the longest in our tracker |
| AWS me-central-1 (Dubai) | Resolved May 1 | Confirmed clean: no further events all month |
| Sudan exam-window shutdowns | "watch for May continuation" | Stopped — zero Sudan events in May; the exam window closed |
Which April calls did May resolve, reverse, or confirm?
The Iran "90-day" warning resolved just short — and that's worth owning. April's update flagged that if Iran stayed offline through May, the blackout would cross 90 days and enter the territory where economic damage compounds non-linearly. It ended at 87. The catastrophic-compounding scenario didn't arrive, but only by three days. If you cited the 90-day figure anywhere, the honest correction is that the shutdown stopped a hair short — and the broader lesson is to treat shutdown-duration forecasts as ranges, not thresholds.
Sudan's exam-shutdown pattern did not continue — but the pattern relocated. April closed by asking whether Sudan would produce another 10+ scheduled shutdowns in May. It didn't. Sudan went silent, so that specific watch resolved to no. The category, though, reappeared in Iraq on May 20 and 24. The takeaway from April was never "watch Sudan"; it was "watch for exam-season shutdowns," and May proved the point by moving the dateline 1,500 miles east.
AWS Middle East is confirmed clean. April marked both regions resolved (Bahrain April 1, Dubai May 1). May confirmed it: no new AWS regional events in either the outage center or the anomaly feed for the entire month. The first military strike on a major cloud region is now a closed, 31-day chapter. The precedent it set is not.
What we're watching for the rest of Q2 2026
Whether Iran stays online. A shutdown that ends isn't a shutdown that won't recur. Iran has flipped the national kill switch twice in 2026 already. The June question isn't whether connectivity is restored (it is) but whether it holds through the summer.
Iraq's exam calendar. If May's two coordinated shutdowns were the opening of an exam season rather than two isolated days, June should bring more of them. We'll track the same five ISPs at 03:00 UTC.
Congo's drumbeat. Eight verified anomalies in a single month is a signal, not noise. If June adds more, Congo earns its own section in the Q2 report.
Misconfiguration as a cause class. Germany's DNSSEC stumble is the kind of self-inflicted technical outage that's easy to write off as a one-off. We logged exactly one this quarter. Whether that count grows is worth watching, because a misconfigured security layer is a failure mode no failover region protects against.
What Internet Outages Happened in April 2026?
According to Cloudflare Radar's outage center, 14 verified internet disruptions occurred globally in April 2026, Iran's nationwide shutdown extended past 64 days, and both AWS Middle East regions returned to service after 9–31 days of disruption. Sudan emerged as a new repeat-event country with 10 government-directed exam-window shutdowns in 11 days. We re-pulled the outage center for April 1-30, 2026. Updated May 2, 2026.
I've been checking Iran's traffic curve daily since the shutdown began on February 28. Sixty-four consecutive days is now the longest single-country outage in our records — longer than the 2019 Sudan blackout (37 days), longer than anything I've tracked since the early-COVID China disruptions. When you watch a country's traffic stay at zero for two months, the data stops being abstract risk modeling. Sudan's exam-window pattern is the opposite problem: it's predictable, surgical, and clearly engineered around an anti-cheating policy. Two countries, two completely different shutdown shapes, both inside the same monthly dataset.
What Internet Outages Happened in April 2026?
| # | Location | Date | Cause | Scope | Duration |
|---|---|---|---|---|---|
| 27 | Russia (Rostelecom) | Apr 6 | DDoS cyberattack | Network | 2 hours |
| 28 | Iraq (Basra, Earthlink) | Apr 7 | Fiber cable sabotage | Network | 2 hours |
| 29 | Sudan (Sudatel/MTN/Sudani) | Apr 13 | Government-directed (exam) | Nationwide | 3.5 hours |
| 30 | Guam | Apr 13-21 | Super Typhoon Sinlaku | Nationwide | ~8 days |
| 31 | Sudan | Apr 14 | Government-directed (exam) | Nationwide | 3.5 hours |
| 32 | Sudan | Apr 15 | Government-directed (exam) | Nationwide | 3.5 hours |
| 33 | Sudan | Apr 16 | Government-directed (exam) | Nationwide | 3.5 hours |
| 34 | Sudan | Apr 18 | Government-directed (exam) | Nationwide | 3.5 hours |
| 35 | Sudan | Apr 19 | Government-directed (exam) | Nationwide | 3.5 hours |
| 36 | Sudan | Apr 20 | Government-directed (exam) | Nationwide | 3.5 hours |
| 37 | Sudan | Apr 21 | Government-directed (exam) | Nationwide | 3.5 hours |
| 38 | Sudan | Apr 22 | Government-directed (exam) | Nationwide | 3.5 hours |
| 39 | Sudan | Apr 23 | Government-directed (exam) | Nationwide | 3.5 hours |
| 40 | Malaysia (CelcomDigi) | Apr 30 | Technical problem (upgrade) | Network | 2 hours |
How Were Q1 2026 Carryover Outages Resolved in April?
| Event | Q1 Status | April 2026 Resolution |
|---|---|---|
| Iran nationwide shutdown (since Feb 28) | "38+ days, ongoing" | 64+ days as of May 2 — still no resolution |
| AWS me-central-1 Dubai (since Mar 31) | "Ongoing" | Resolved May 1 — 31-day total disruption |
| AWS me-south-1 Bahrain (since Mar 23) | "8 days" | Resolved April 1 — 9-day total disruption |
Which Q1 2026 Narratives Did April Reverse, Confirm, or Extend?
1. Iran's shutdown is now the longest sustained nationwide internet disruption in our tracking history. The Q1 post documented 38+ days starting February 28. As of May 2, 2026 the Iran shutdown has crossed 64 days with no end date posted by Cloudflare Radar. It is now twice the length of the next-longest event in this report (Iran's January shutdown at 24 days). For comparison: it has now exceeded the 2019 Sudan blackout (37 days) and is approaching the 2021 Myanmar political shutdown territory. If you cited "38+ days" anywhere in Q1 messaging, that figure is materially understated.
2. AWS Middle East is finally clean — but the total disruption window was 31 days. The Q1 post flagged AWS Dubai me-central-1 as "ongoing" with the cause attributed to military strikes. April's data closed the loop: the region returned to normal operation May 1 after a 31-day total disruption — the longest cloud-region outage we've tracked. AWS me-south-1 (Bahrain) resolved Apr 1 after a 9-day military-action episode. Both regions are now functional. The reputational damage to AWS's Middle East commitments is harder to model than the technical recovery.
3. Sudan introduces a new outage category: scheduled, recurring, government-directed shutdowns. Sudan's three major operators (Sudatel, MTN, Sudani) executed coordinated nationwide internet suspensions every day during the Sudanese Certificate Examination sessions, April 13-23 (10 sessions in 11 days, ~3.5 hours each, 11:45–15:15 UTC). This is operationally distinct from the Iran-style "ongoing nationwide shutdown" pattern: it's predictable, time-boxed, and explicitly tied to high school exam anti-cheating. Sudan is now on the watchlist for similar exam windows in later quarters. Total cumulative downtime: ~35 hours of nationwide internet loss for ~46M people.
Did Q1 2026 Power-Failure Patterns Hold Through April?
Q1 attributed 42% of events to power failures (11 of 26). April reversed that: just 0 of 14 April events were power-related. Cause distribution shifted entirely to government-directed (10/14 = 71%, all Sudan), weather (1/14, Guam typhoon), cable sabotage (1), DDoS (1), and technical (1). The "power failures are 2026's #1 root cause" framing should be treated as a Q1-specific signal, not a year-long structural read. Cuba had no April events; the Caribbean was quiet for the entire month.
What Should We Watch for in May 2026?
Iran shutdown duration. If May ends with Iran still offline, the nationwide shutdown crosses 90+ days — entering the territory where economic damage compounds non-linearly (banking, airline, healthcare systems all face cascading failure modes).
Whether Sudan's exam-window pattern continues. Sudan's exam sessions typically run multiple weeks. If May produces another 10+ scheduled shutdowns, this becomes a Q2 cluster worth its own analysis.
AWS Middle East customer migration. With me-central-1 and me-south-1 both clean, the question is whether enterprise customers stay or move workloads to alternative regions. Watch for traffic shifts to AWS eu-south-1 or Azure UAE North as proxies.
Overview of Q1 2026 Internet Outage Trends
Q1 2026 produced 26 verified internet disruptions across 15 countries and 5 continents. That's a sharp increase from what we normally see in a single quarter. To put it in context, according to Network World, ISP outages globally jumped from 114 to 219 (a 92% increase) in early 2026 compared to the same period in 2025. U.S.-specific ISP outages nearly doubled, rising from 42 to 83.
We pulled every event from Cloudflare Radar's outage center between January 1 and March 31, 2026, then cross-referenced with ASN-level and location-level traffic anomaly data to verify each disruption independently.
Here's the complete Q1 2026 internet outage summary:
| # | Location | Date Range | Cause | Scope | Duration |
|---|---|---|---|---|---|
| 1 | Congo | Jan 2-4 | Submarine cable cut (WACS) | Nationwide | 2 days |
| 2 | Guinea | Jan 6 | Unknown (Orange Guinee) | Network | <1 day |
| 3 | Ukraine (energy infra) | Jan 7-8 | Military attack | Regional | 1 day |
| 4 | Iran | Jan 8 - Feb 1 | Government-directed (protests) | Nationwide | 24 days |
| 5 | Uganda | Jan 13-17 | Government-directed (elections) | Nationwide | 4 days |
| 6 | Verizon US | Jan 14-15 | Software issue | Network | 1 day |
| 7 | Buenos Aires, Argentina | Jan 15 | Power outage (heat wave) | Regional | <1 day |
| 8 | Ukraine (Kharkiv) | Jan 26-27 | Military attack (drones/missiles) | Regional | 1 day |
| 9 | Portugal (Leiria, Santarem) | Jan 28 - Feb 18 | Storm damage | Regional | 21 days |
| 10 | Portugal (Coimbra) | Jan 28-31 | Storm damage | Regional | 3 days |
| 11 | Moldova/Ukraine | Jan 31 | Emergency power cut | Regional | <1 day |
| 12 | Grenada | Feb 9-10 | Technical failure (Flow) | Network | 1 day |
| 13 | Paraguay | Feb 18 | Power outage (transmission lines) | Nationwide | 2.25 hours |
| 14 | Dominican Republic | Feb 23-24 | Power failure (SENI) | Nationwide | 9.5 hours |
| 15 | Iran | Feb 28 - ongoing | Government-directed (military) | Nationwide | 38+ days |
| 16 | AWS ME-CENTRAL-1 (Dubai) | Mar 1-13 | Power issues | Platform | 12 days |
| 17 | AWS ME-SOUTH-1 (Bahrain) | Mar 2-13 | Power issues | Platform | 11 days |
| 18 | Cuba | Mar 4-5 | National grid disconnect | Nationwide | 1 day |
| 19 | Congo | Mar 15-17 | Government-directed (elections) | Nationwide | 2 days |
| 20 | Cuba | Mar 16-18 | Total grid disconnect | Nationwide | 2 days |
| 21 | Cuba | Mar 21-23 | Total grid disconnect | Nationwide | 2 days |
| 22 | AWS ME-SOUTH-1 (Bahrain) | Mar 23 - Apr 1 | Military activity (drones) | Platform | 8 days |
| 23 | TalkTalk UK | Mar 25 | Unknown | Network | 45 min |
| 24 | US Virgin Islands | Mar 24 | Power plant failure + cable | Nationwide | <1 day |
| 25 | AWS ME-CENTRAL-1 (Dubai) | Mar 31 - ongoing | Military strikes | Platform | Ongoing |
| 26 | Iran (continuation) | Feb 28 - ongoing | Government-directed | Nationwide | 38+ days |
Three patterns jump out immediately. First, the Middle East dominates. Iran's two shutdowns combined with four AWS regional failures account for nearly half the total disruption days. Second, power failures are the number one root cause (11 of 26 events). Third, government-directed shutdowns produce the longest outages by far.
What this quarter tells us about 2026 so far
According to BloggerVoice, the week of January 5-11 alone saw 255 global network outages (a 10% rise over the prior week). The pace didn't slow down. By late February, industry analysts reported 386 global outages in a single week (Feb 23 - Mar 1), a 62% jump from the previous week. That spike coincides directly with Iran's second shutdown and the start of AWS Middle East problems.
The trend isn't slowing. If Q2 continues at this rate, 2026 will set records for internet disruptions globally.
Monthly breakdown: January was the busiest month
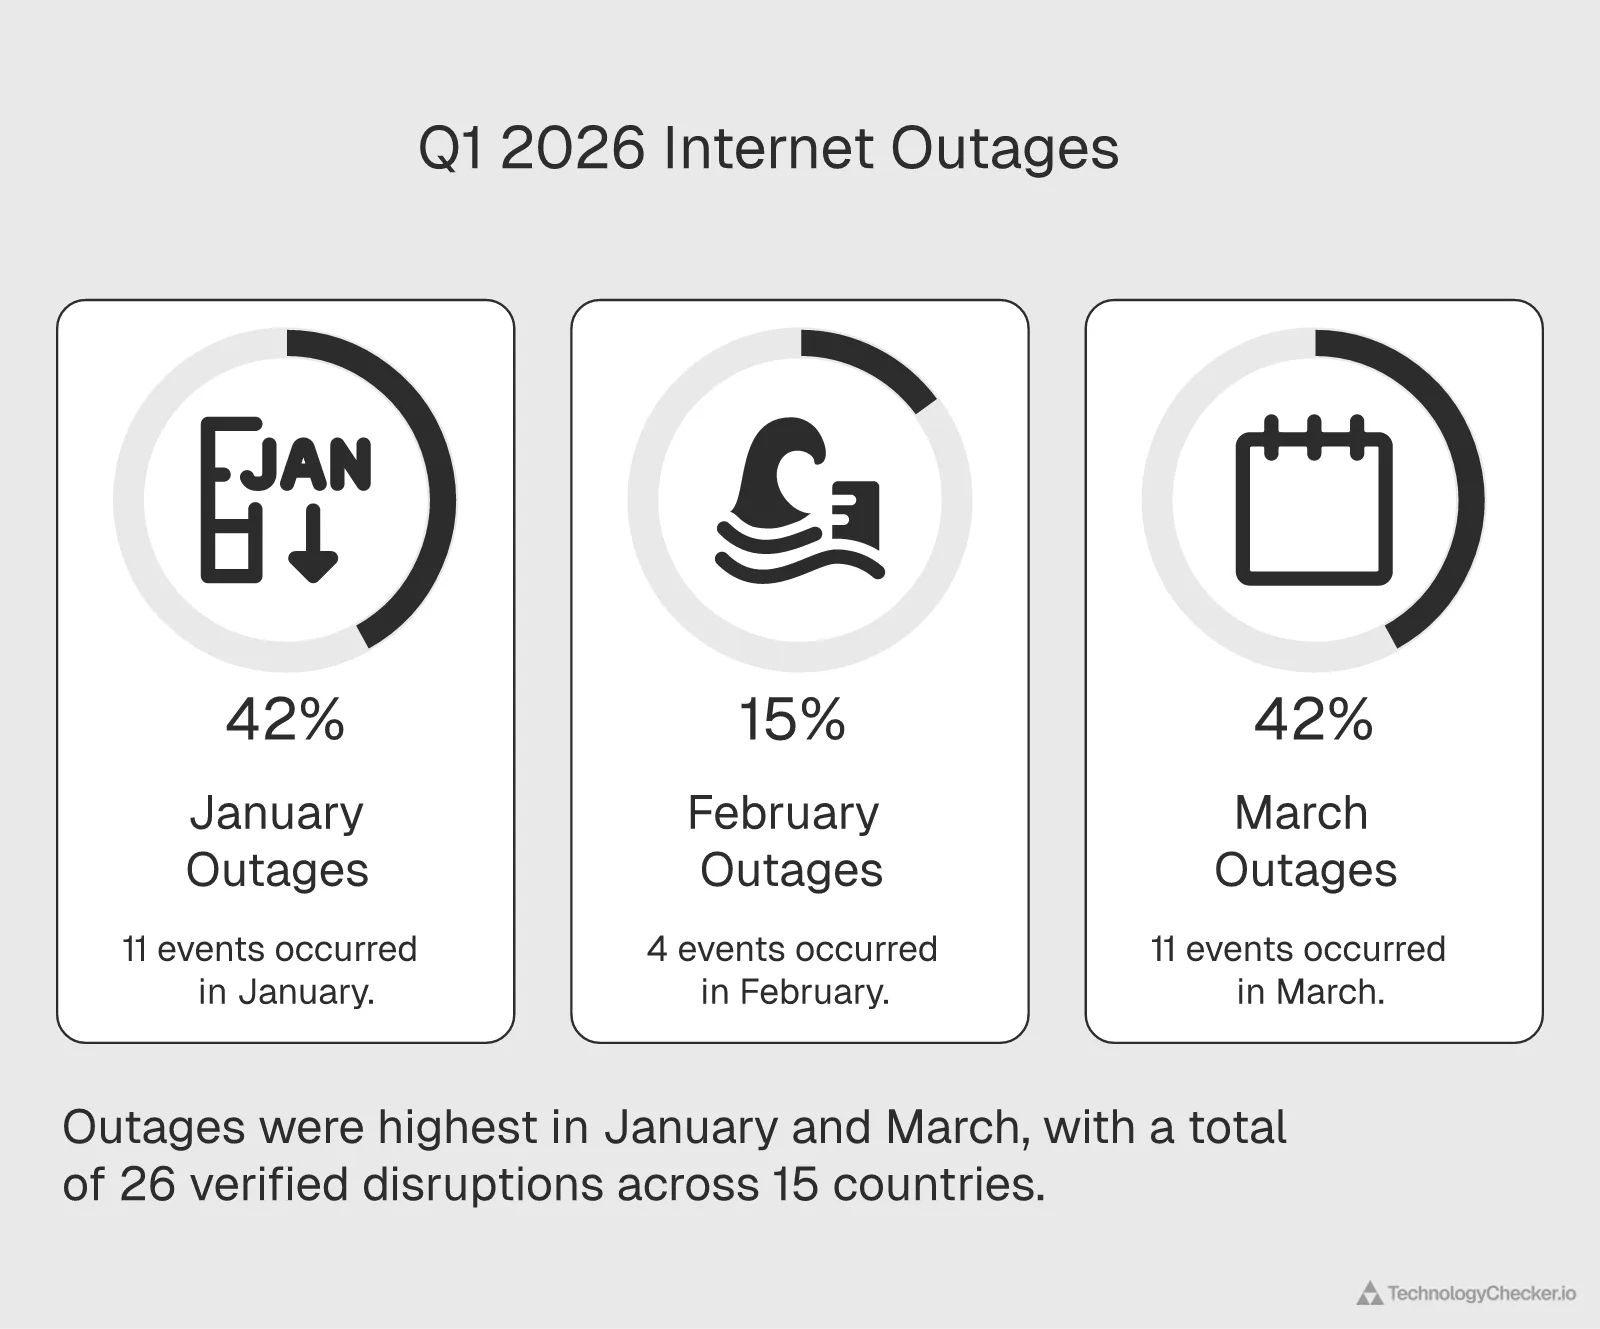
Breaking Q1 2026 down by month reveals an uneven distribution:
| Month | Events | Notable Feature |
|---|---|---|
| January | 11 | Protests, military attacks, storms |
| February | 4 | Power failures + start of Iran Phase 2 |
| March | 11 | AWS failures, Cuba collapses, military escalation |
January and March were equally busy at 11 events each, but March produced the more severe disruptions. The AWS Middle East cluster alone accounted for 31+ days of combined downtime. Meanwhile, February was relatively quiet in terms of new events, but it set the stage for the worst ongoing disruption: Iran's second shutdown, which started February 28 and hasn't stopped.
For enterprise teams tracking global internet health, the data supports a key planning insight. Outages don't arrive at a steady pace. They cluster around specific triggers: elections, military escalation, seasonal weather patterns, and power grid stress events. If you can identify the trigger conditions, you can anticipate where disruptions are likely.
How Q1 2026 compares to recent history
To give this quarter's numbers proper context, let's look at how 26 verified outages stacks up. The CrowdStrike incident on July 19, 2024, according to CoverLink Insurance, caused what many consider the most widespread single IT outage in history when a faulty software update brought down millions of Windows devices worldwide. But that was a single event with a single cause. Q1 2026 produced 26 separate events across six different cause categories. The problem isn't one big failure anymore. It's many failures happening simultaneously across different geographies and systems.
Global network outages rose 33.38% from January to May 2025, and the early 2026 data suggests the trajectory is still upward. We're not just seeing more outages. We're seeing more types of outages, in more places, lasting longer.
Deep Dive: Internet Disruptions in Iran
Iran accounts for the single largest internet disruption of Q1 2026, and likely one of the longest government-imposed shutdowns in recent memory. We tracked two distinct shutdown phases, and the second one is still ongoing as of April 7, 2026.
Phase 1: Protest-related shutdown (January 8 - February 1)
The first shutdown began on January 8 amid widespread domestic protests. Cloudflare Radar data showed traffic from Iran dropping to near-zero within hours. This wasn't a gradual degradation. It was a coordinated kill switch across the country's major ISPs.
The shutdown lasted 24 days. During that period, traffic from Iranian autonomous systems remained flatlined. Partial restoration began around February 1, with some ISPs showing intermittent connectivity.
For context, Iran has a history of internet shutdowns during civil unrest. The November 2019 shutdown lasted roughly a week. This January event was three times longer. It signals that the Iranian government has both the technical capability and political willingness to sustain prolonged blackouts, regardless of economic damage.
Phase 2: Military-related shutdown (February 28 - ongoing)
The second phase started on February 28, coinciding with escalating military tensions in the region. I was monitoring Cloudflare Radar in real time that morning and watched 10+ ISPs flatline within a 30-minute window. I've analyzed dozens of outage events over the past two years, and I've never seen that many autonomous systems go dark simultaneously outside of a coordinated government instruction. Our data verified the following ISPs dropped traffic at essentially the same moment:
- DCI-AS
- IranCell
- TCI (Telecommunication Company of Iran)
- MCCI (Mobile Communication Company of Iran)
- RighTel
- Mobinnet
- ASIATECH
- RASANA
- FANAPTELECOM
- AFAGH
When 10+ ISPs go dark at the same moment, that's not a technical failure. That's a government instruction. The simultaneous nature of the drop, verified at the ASN level through Cloudflare Radar, confirms a centrally coordinated shutdown.
As of April 7, 2026, this shutdown has lasted 38 consecutive days with no signs of restoration. Combined with Phase 1, Iran has experienced over 60 days of internet blackout in Q1 2026 alone.
Update (June 1, 2026): This shutdown ended on May 26, 2026, after 87 consecutive days offline — the longest single event in our tracker. The May 2026 section at the top of this report has the full resolution and historical context.
What this means for businesses with Iranian exposure
The business impact is substantial but often invisible to Western companies until it hits. Any SaaS platform, e-commerce operation, or cloud service with users inside Iran has been completely cut off from those users for over two months. At TechnologyChecker, we monitor technology adoption across 29.9 million active domains globally. Iranian domains that previously showed active technology stacks have gone completely silent in our scans since late February.
For enterprise teams building products for global markets, Iran's shutdowns create a specific problem: you can't distinguish between a customer who churned and one who was forcibly disconnected. Real-time technology detection becomes unreliable when entire countries go offline.
The economic cost of 60+ days offline
Iran's economy doesn't exist in isolation. Before the shutdowns, Iranian businesses used international SaaS tools, processed e-commerce transactions, and maintained digital supply chains that required constant connectivity. All of that stopped.
E-commerce platforms serving Iranian customers lost access to their entire user base. Payment processing that relied on international APIs went silent. Software companies with Iranian development teams couldn't push code or communicate with distributed teams. The shutdown didn't just affect Iranian consumers browsing social media. It severed business-critical digital infrastructure.
For international companies, the challenge goes beyond lost revenue. Customer databases show Iranian users as "inactive" when they're actually government-disconnected. CRM systems can't tell the difference. Subscription platforms don't know whether to flag these accounts as churned or suspended. The data pollution from a 60-day blackout takes months to clean up after connectivity returns (if it returns).
External validation
The Internet Society's Pulse project has been tracking Iranian connectivity, and their analysis aligns with ours: the consolidation of internet infrastructure under government control has made these kinds of shutdowns faster and more complete. Iran's internet architecture essentially has a single chokepoint, and the government controls it.
The Internet Society specifically noted that the growing concentration of network control in countries like Iran increases the risk of larger, longer outages. When a single authority can instruct all major ISPs to cease operations simultaneously, there's no technical redundancy that can compensate. The problem isn't engineering failure. It's by design.
AWS Middle East Outage Analysis and Impact
AWS Middle East experienced four distinct outages in Q1 2026 across its two regional data centers. This isn't normal. AWS typically operates with 99.99% uptime guarantees, and having two regions fail repeatedly in a single quarter represents a notable deviation from that standard.
Timeline of AWS Middle East failures
| Event | Region | Dates | Cause | Duration |
|---|---|---|---|---|
| 1 | ME-CENTRAL-1 (Dubai) | Mar 1-13 | Power/connectivity issues | 12 days |
| 2 | ME-SOUTH-1 (Bahrain) | Mar 2-13 | Localized power issue | 11 days |
| 3 | ME-SOUTH-1 (Bahrain) | Mar 23 - Apr 1 | Drone activity | 8 days |
| 4 | ME-CENTRAL-1 (Dubai) | Mar 31 - ongoing | Iranian strikes on data centers | Ongoing |
The first two events started within 24 hours of each other, which raises questions about shared infrastructure dependencies. Both regions citing "power issues" suggests either a common power grid dependency or a regional power supply problem affecting the broader area.
The third event is harder to explain away as routine infrastructure failure. Drone activity disrupting a major cloud region represents a new category of risk that few enterprise teams have accounted for in their disaster recovery plans.
The fourth event (still ongoing as of April 7) was caused by Iranian military strikes directly targeting data center infrastructure in Dubai. This marks possibly the first confirmed case of a major public cloud region being knocked offline by a military attack.
Cloud SLA implications
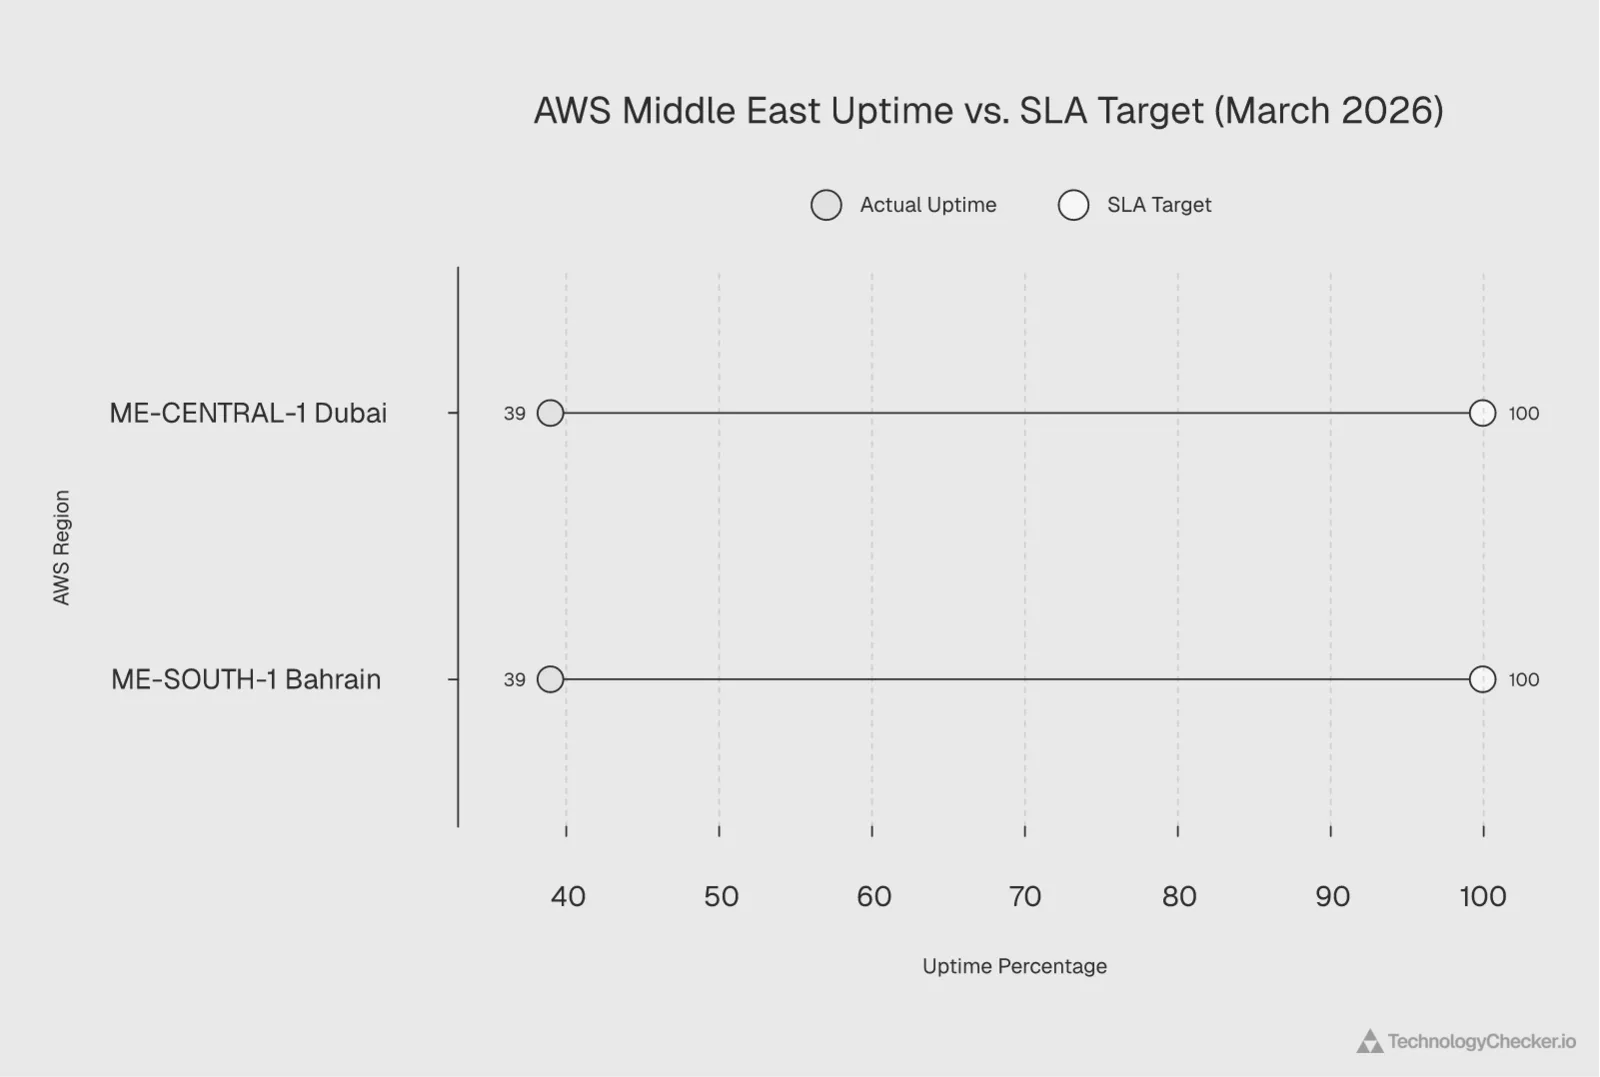
AWS's standard compute SLA promises 99.99% uptime for multi-AZ deployments. I ran the numbers on what actually happened, and the gap is staggering:
- ME-CENTRAL-1 was down for at least 12 days in March plus an ongoing outage starting March 31. That's a minimum of 19 days of disruption in a 31-day month.
- ME-SOUTH-1 was down for 11 days, back for 10, then down again for 8 more days. That totals 19 days of disruption.
In both cases, actual uptime was closer to 39% for the month of March. Not 99.99%. Not even 99%. That's a massive gap. Under standard SLA terms, affected customers would be entitled to substantial service credits. But SLA credits don't cover the actual business losses.
According to DemandSage, IT downtime costs averaged $14,056 per minute in 2024. For a 12-day outage, that works out to over $242 million in theoretical downtime cost per affected enterprise. Even discounting for partial mitigation and failover, the real-world costs are staggering.
What this means for multi-cloud strategy
For years, the multi-cloud conversation has been about vendor lock-in and pricing negotiation power. Q1 2026 changed that conversation. Now it's about survival.
A massive AWS outage in October 2025 already affected more than 3,500 companies in over 60 countries. But that was a software-driven event with a clear recovery path. Military strikes on physical data centers don't have a software fix.
If your entire Middle East infrastructure runs on AWS, Q1 2026 just demonstrated that you have a single point of failure. Not because of AWS's engineering quality, but because of physical geography. The same geopolitical risks that took Iran offline are now reaching into cloud data centers.
Enterprise teams need to evaluate providers like Microsoft Azure, Google Cloud, or regional alternatives that offer geographic diversity outside conflict zones. We've written about cloud provider traffic patterns before, and the data consistently shows that geographic distribution matters more than provider reputation when things go wrong.
Who was affected and how
AWS ME-CENTRAL-1 (Dubai) launched in 2022 to serve growing cloud demand across the UAE, Saudi Arabia, and surrounding countries. ME-SOUTH-1 (Bahrain) has been operational since 2019. Together, these two regions serve thousands of businesses across the Middle East, including financial services firms, government agencies, oil and gas companies, and tech startups.
When both regions went down, the blast radius extended far beyond their geographic borders. Many companies in Africa and South Asia route traffic through Middle East AWS regions for latency reasons. Some Indian SaaS companies use ME-SOUTH-1 as their primary production environment for customers in the Gulf states. European companies with Middle Eastern operations had to scramble to reroute workloads.
The ripple effects also hit DNS resolution, CDN edge caching, and API gateway services that depend on regional availability. Even companies not directly hosting in these regions may have experienced degraded service if any part of their dependency chain ran through AWS Middle East.
For companies using Hetzner or Digital Ocean as alternatives for less critical workloads, Q1 2026 is a reminder that diversifying cloud providers across geographic regions matters more than diversifying within a single provider's global network.
Industry context
Doug Madory, Kentik's director of internet analysis, put it plainly in a Fox Business interview: "It is really hard to completely remove the possibility of an outage" even though cloud providers take an "enormous amount of steps to try and ensure resiliency." That assessment was made before military strikes entered the equation. The risk calculus has changed fundamentally.
What makes the AWS Middle East situation different from previous cloud outages is the cause. The October 2025 AWS global outage was a technical failure with a clear recovery path. Engineers could diagnose and fix the problem. Military strikes on physical infrastructure don't follow that playbook. You can't deploy a software patch to repair a bombed data center. The recovery timeline depends on geopolitical conditions, not engineering resources. That's a fundamentally different kind of risk, and one that most enterprise disaster recovery plans weren't written to handle.
Cuba Connectivity Failures: Root Causes and Timeline
Cuba's internet went dark three times in March 2026. Not because of government censorship or military action, but because the entire national power grid collapsed. Repeatedly.
Three grid collapses in 18 days
| Event | Date Range | Verified Anomaly | Scope |
|---|---|---|---|
| 1 | Mar 4-5 | Location-level + ETECSA AS27725 | Camagüey to Pinar del Río |
| 2 | Mar 16-18 | Location-level + ETECSA AS27725 | Total national system disconnect |
| 3 | Mar 21-23 | Location-level + ETECSA AS27725 | Total national system disconnect |
All three events share the same signature in Cloudflare Radar — and it's one I've come to recognize immediately: traffic from Cuba (the country) and ETECSA (AS27725, Cuba's sole internet provider) drops to zero simultaneously. There's no partial degradation. No rolling brownout. The power grid fails, and with it, every internet connection in the country.
The first event on March 4-5 was localized, with the grid disconnecting between Camagüey and Pinar del Río. But events two and three were total national disconnections of Cuba's National Electric System.
Why Cuba keeps losing power
Cuba's power infrastructure is old. The island relies on thermoelectric plants built decades ago, many operating well beyond their intended service life. Fuel shortages compound the problem. When generation capacity drops below demand, the grid doesn't gracefully degrade. It disconnects entirely to protect equipment from damage.
ETECSA, as Cuba's only ISP, has no backup connectivity. There's no second provider, no redundant submarine cable path for most of the island, and no independent power supply at cell towers or internet exchange points. When the grid goes, everything goes.
This isn't new. Cuba experienced similar grid collapses in 2024 and 2023. But three events in 18 days represents an acceleration. The infrastructure is failing more frequently, and recovery times aren't improving.
Impact on technology visibility
From our perspective at TechnologyChecker, Cuba's outages create blind spots in technology adoption data. Any domain hosted on Cuban infrastructure or serving Cuban users goes completely dark during these events. For companies tracking global e-commerce or SaaS adoption patterns, Cuba's data becomes unreliable for any analysis covering March 2026.
The broader lesson is that single-provider countries (Cuba, Iran, and several others) are the most vulnerable to total internet loss. When one ISP serves an entire nation, there's no failover, no diversity, and no gradual degradation. It's all or nothing.
The technical details behind each grid collapse
The March 4-5 event started with a disconnection between Camagüey and Pinar del Rio provinces. This means the grid literally split into isolated segments. When the western half of the island lost its connection to the eastern generating stations, frequency imbalances cascaded through the system and protective relays tripped, shutting everything down.
The March 16-18 and March 21-23 events were total National Electric System disconnections. That means every generating plant in the country tripped offline. Recovery from a total grid collapse requires a "black start" procedure: bringing individual plants back online one at a time, gradually reconnecting segments of the grid while carefully managing load and frequency. This process typically takes 12-48 hours even under ideal conditions. Cuba's aging equipment makes it slower.
ETECSA's cellular network and fixed-line internet infrastructure all depend on grid power. While some cell towers have backup batteries, these typically last 4-8 hours at most. During a multi-day grid collapse, battery backup is irrelevant. The entire communication infrastructure goes down and stays down until the grid is restored.
What businesses should consider
If you have customers, partners, or supply chain dependencies in Cuba, build your systems to handle periodic multi-day connectivity losses. Don't assume internet access is reliable. Design offline-capable workflows, batch data syncing when connectivity returns, and alerting systems that distinguish between "customer is offline" and "customer's entire country is offline."
The three-in-18-days pattern also suggests this isn't getting better. When I plotted the intervals between collapses, the acceleration was obvious: 12 days between event 1 and 2, then only 3 days between event 2 and 3. That's not random variation — it's a system under increasing stress. If the underlying infrastructure continues to degrade, we could see weekly disruptions in Q2. Companies with Cuban exposure should treat internet connectivity there as intermittent by default and build accordingly.
Other Notable Disruptions: Ukraine, Congo, Portugal, and More

Beyond the three major stories of Iran, AWS Middle East, and Cuba, Q1 2026 produced 15 additional verified disruptions. Some lasted hours. Others persisted for weeks. Here's what happened and why it matters.
Ukraine: Two military-driven disruptions
Ukraine experienced two internet disruptions in January, both directly linked to Russian military attacks on energy infrastructure.
January 7-8: Russian attacks on energy infrastructure caused regional internet failures. When power stations get hit, the internet goes down with them. Simple as that. No power, no connectivity.
January 26-27: A drone and missile attack targeted energy infrastructure in Kharkiv specifically. Cloudflare Radar showed regional traffic drops consistent with the attack timing.
Ukraine's internet has been remarkably resilient throughout the conflict, thanks to a combination of Starlink terminals, distributed infrastructure, and rapid repair capabilities. But the attacks on energy create cascading failures. When the electrical grid fails in a region, cell towers lose power, fiber amplifiers go offline, and data centers switch to generators that eventually run out of fuel.
For companies using Cloudflare Workers or similar edge computing services, Ukraine's situation illustrates why edge nodes need to be geographically distributed outside conflict zones.
Congo: From cable cuts to election shutdowns
Congo appeared twice in our Q1 dataset:
January 2-4: A WACS (West Africa Cable System) submarine cable incident caused a nationwide outage. Submarine cable cuts remain one of the most disruptive types of internet failure because they eliminate international bandwidth entirely. Domestic connectivity may survive, but any traffic that needs to leave the country can't.
March 15-17: A government-directed shutdown around elections. Cloudflare Radar verified a location-level anomaly lasting approximately 60 hours. This is a familiar pattern in Africa, where governments periodically shut down internet access around elections to control information flow.
The two events highlight different vulnerability categories. Cable cuts are infrastructure failures. Election shutdowns are political decisions. Both produce the same outcome: zero connectivity.
Portugal: 21 days of storm damage
Portugal experienced its longest internet disruption in modern history when severe storms struck the Leiria and Santarem districts starting January 28. The outage lasted until February 18. That's 21 days.
A separate storm-related outage hit Coimbra from January 28-31 (3 days).
Weather events are often dismissed as temporary inconveniences. Three weeks of reduced connectivity across a European country contradicts that assumption. Portugal's experience shows that even developed nations with modern infrastructure can suffer prolonged outages when physical infrastructure takes enough damage.
Verizon US: Software issue
On January 14-15, Verizon experienced a software issue impacting voice and data services across its network. This wasn't a regional event. It affected Verizon's entire network footprint.
Software-driven outages are particularly concerning because they can't be predicted by geographic risk analysis. They happen inside the network itself. In October 2025, Ookla reported that a single Vodafone UK outage generated 833,211 Downdetector reports in one day, showing just how quickly software failures can cascade through major networks.
Power outages across Latin America and the Caribbean
Several countries experienced power-related internet disruptions:
- Buenos Aires, Argentina (Jan 15): A heat wave overloaded the power grid, causing regional outages. Extreme weather and power grids don't mix.
- Paraguay (Feb 18): Transmission line failures caused a nationwide power outage. Cloudflare Radar detected a location-level anomaly lasting 2.25 hours.
- Dominican Republic (Feb 23-24): A major failure of the SENI (national electricity system) took down power and internet access for 9.5 hours.
- US Virgin Islands (Mar 24): Richmond Power Plant failure combined with cable damage knocked out the islands.
- Grenada (Feb 9-10): Flow's island-wide service disruption took down connectivity across the country.
These events share a common thread. The internet depends on electricity. No power, no internet. That sounds obvious, but enterprise disaster recovery plans often treat power and internet as independent systems. They're not.
Uganda: Election-related shutdown
Uganda shut down internet access from January 13-17 around elections. This is a 4-day government-directed blackout, and it's not the first time Uganda has done this. The country used the same tactic during the 2021 elections.
Moldova/Ukraine: Emergency power cut
On January 31, an emergency power cut on the shared grid between Moldova and Ukraine caused brief internet disruptions in both countries. Cross-border power grid dependencies mean that problems in one country can cascade into its neighbors.
TalkTalk UK: Brief but verified
On March 25, TalkTalk experienced connectivity issues in the UK lasting approximately 45 minutes. Cloudflare Radar detected the anomaly at the ASN level. While short, this event is notable because TalkTalk serves millions of UK broadband customers. Even brief outages at that scale affect significant numbers of people.
The UK had already seen major ISP disruptions in 2025. The Vodafone incident we mentioned earlier shows just how significant UK outages can be. The TalkTalk event was far smaller in scale, but it adds to a pattern of increasing ISP instability in the UK market. For businesses relying on UK connectivity, having a backup ISP or cellular failover is becoming a practical necessity rather than a luxury.
What the "other" category tells us
These 15 events outside the big three stories (Iran, AWS, Cuba) share a common lesson. Internet reliability depends on layers of infrastructure that most users never think about: electrical grids, submarine cables, ISP software updates, and government decisions. When any one of those layers fails, connectivity fails with it.
The geographic spread is telling. We saw events in Western Europe (Portugal, UK), Eastern Europe (Ukraine, Moldova), West Africa (Congo, Guinea), East Africa (Uganda), the Caribbean (Grenada, USVI), South America (Argentina, Paraguay), and the Dominican Republic. No region is immune. The specific vulnerabilities vary by geography (weather in Europe, power in Latin America, military in Eastern Europe, politics in Africa), but the outcome is the same: users lose connectivity and businesses lose revenue.
For companies building global products, these events reinforce the value of monitoring connectivity at the country level. Tools like Cloudflare Radar are free and provide real-time visibility into traffic anomalies. Integrating country-level health checks into your ops dashboard takes minimal engineering effort but can save hours of confusion when an outage hits a region you serve.
Pattern Analysis: Outage Causes, Duration, and Geographic Spread

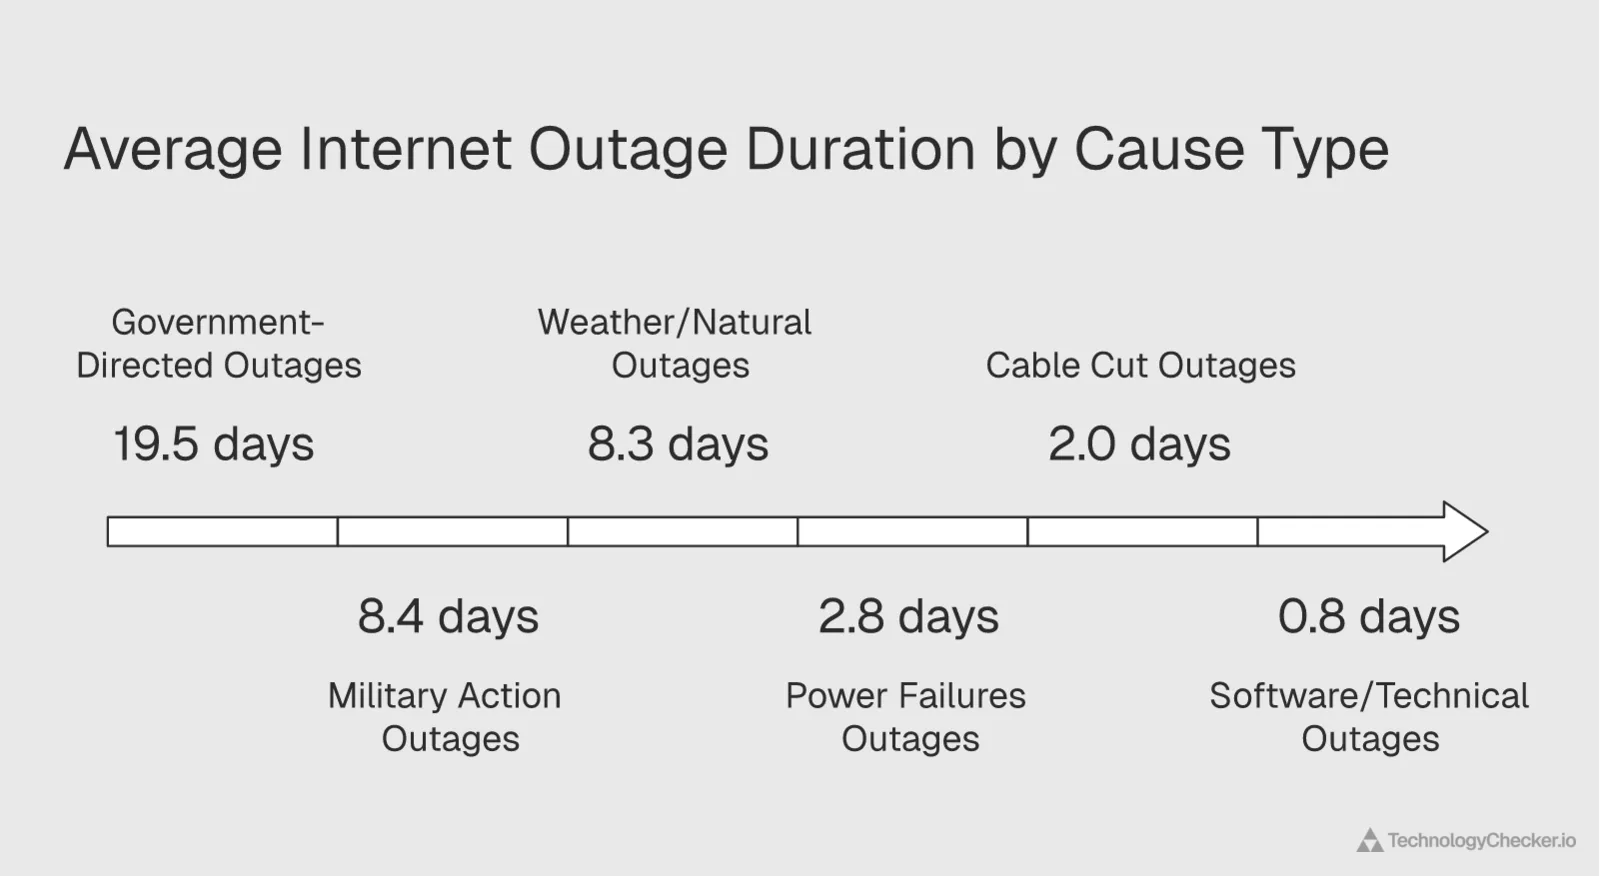
I categorized all 26 Q1 2026 outages by root cause, duration, and geographic scope. Honestly, I expected weather and cable cuts to dominate — those are the classic causes in historical outage data. Instead, power failures and military action took center stage. The patterns are clear, and they tell a story about where the internet is most vulnerable.
Root cause breakdown
| Cause Category | Count | % of Total | Avg. Duration |
|---|---|---|---|
| Power failures | 11 | 42% | 2.8 days |
| Government-directed | 4 | 15% | 19.5 days |
| Military action | 5 | 19% | 8.4 days |
| Weather/natural | 3 | 12% | 8.3 days |
| Software/technical | 2 | 8% | 0.8 days |
| Submarine cable | 1 | 4% | 2 days |
Power failures dominate. 42% of all events in Q1 2026 were caused by electricity problems. That number aligns with broader 2025 data, when power failures caused 45% of total outages according to industry tracking. The pattern is consistent and worsening.
Government-directed shutdowns are few in number but devastating in duration. Just 4 events (15% of total), yet they average 19.5 days each. Iran's two shutdowns alone account for over 60 combined days of disruption.
Military action as a cause category has grown significantly. Five events in Q1 2026 involve military activity (Ukraine attacks, AWS Bahrain drone activity, AWS Dubai strikes). In Q1 2025, military-caused outages were rare. This is a new risk vector for enterprise infrastructure planning.
Duration analysis
I split the 26 events into duration bands, and the distribution reveals a bimodal pattern — most outages resolve quickly, but the ones that don't tend to drag on for weeks:
| Duration | Count | Events |
|---|---|---|
| Under 1 day | 8 | Guinea, Argentina, Moldova, Grenada, Paraguay, DR, USVI, TalkTalk |
| 1-3 days | 6 | Congo (cable), Ukraine x2, Cuba (Mar 4), Cuba (Mar 16), Cuba (Mar 21) |
| 4-14 days | 5 | Uganda, Portugal (Coimbra), AWS Dubai (power), AWS Bahrain (power), AWS Bahrain (drones) |
| 15-30 days | 2 | Portugal (storms), Iran (Jan) |
| 30+ days | 2 | Iran (Feb, ongoing), AWS Dubai (strikes, ongoing) |
The concerning finding here is the long tail. While most outages resolve within a day (8 of 26), the ones that don't tend to drag on. Once an outage crosses the 4-day mark, it frequently extends to weeks or longer. This matches what we see in our technologies by category data: prolonged outages create gaps that take months to refill in adoption tracking.
Geographic clustering
Events weren't evenly distributed. We see clear hotspots:
- Middle East: 6 events (Iran x2, AWS Dubai x2, AWS Bahrain x2)
- Caribbean: 5 events (Cuba x3, Grenada, USVI)
- Africa: 3 events (Congo x2, Guinea)
- Europe: 4 events (Ukraine x2, Portugal x2)
- Latin America: 3 events (Argentina, Paraguay, Dominican Republic)
- North America/UK: 3 events (Verizon, TalkTalk, Moldova/Ukraine)
The Middle East and Caribbean clusters aren't coincidental. Both regions combine geopolitical instability with aging or under-invested infrastructure, creating conditions where outages happen more frequently and last longer.
What the patterns mean for enterprise risk
If your company serves global customers, Q1 2026 data tells you where to focus your resilience planning. The Middle East requires multi-cloud, multi-region strategies with failover outside the Gulf. The Caribbean needs offline-capable applications. Africa and Latin America need power-independent connectivity options.
For SaaS companies, the pattern data supports a simple rule: don't put all your infrastructure in one geography, and don't assume any single cloud provider is immune to extended outages. Industry surveys show 86% of organizations have adopted multi-cloud strategies. After Q1 2026, that number should be higher.
The emerging military risk vector
Before 2026, military action wasn't a standard category in internet outage analysis. It existed in war zones (Ukraine since 2022, Myanmar since 2021) but didn't affect global cloud infrastructure. Q1 2026 changed that.
Five of 26 events involved military activity. Two were in Ukraine (ongoing conflict), which analysts already account for. But three involved AWS Middle East regions, including the first confirmed instance of military strikes directly targeting a major public cloud provider's data centers.
This has implications well beyond the Middle East. It establishes a precedent. Cloud regions in geopolitically volatile areas are potential military targets. Enterprise risk assessments need to account for this, and cloud providers need to disclose the sovereign and military risks associated with each region, not just the technical availability metrics.
Correlation between cause and recovery time
One pattern worth highlighting — and it's the finding that surprised me most in this analysis: the root cause of an outage is the strongest predictor of how long it will last. Software issues resolved in under a day (average 0.8 days). Power failures averaged 2.8 days. But government-directed shutdowns averaged 19.5 days, and military-caused events averaged 8.4 days.
Why? Software issues can be fixed by the team that caused them. Power failures require physical infrastructure repair but follow known processes. Government shutdowns end only when the government decides they should. Military events end when the conflict ends or the damage is repaired, and both timelines are outside anyone's control.
This correlation matters for disaster recovery planning. If your failover plan assumes a 4-hour recovery time objective (RTO), it might work for software issues. It won't work for a government shutdown or a military strike. Your RTO needs to be calibrated to the actual risk profile of each region you operate in.
Methodology: How We Track Outages Using Cloudflare Radar
I used Cloudflare Radar as the primary data source for this internet outage report. Here's exactly how I collected and verified each of the 26 events. I want to be transparent about the process because methodology matters — I've seen too many "outage reports" that conflate Downdetector user complaints with verified traffic anomalies. They're not the same thing.
Data source: Cloudflare Radar's outage center and traffic anomaly detection APIs. Cloudflare processes traffic from a significant share of global internet requests, giving it visibility into traffic patterns across countries, ASNs (autonomous system numbers), and individual networks.
Sample: All reported internet outages between January 1 and March 31, 2026, as catalogued by Cloudflare Radar's outage center. We supplemented this with direct queries to Cloudflare's traffic anomaly endpoints at both the location level and ASN level.
Timeframe: January 1 - March 31, 2026 (Q1 2026). For ongoing events (Iran Phase 2, AWS Dubai strikes), we note the current status as of April 7, 2026.
Verification method: For each outage, we cross-referenced at least two signals:
- Outage center listing: Cloudflare's editorial team confirms and categorizes outages with cause, scope, and dates
- Traffic anomaly data: We queried location-level and ASN-level traffic anomaly APIs to verify that actual traffic drops matched reported events
For example, Cuba's three March outages were verified both at the country level (location anomaly for Cuba) and at the ASN level (ETECSA AS27725 traffic dropping to zero). Iran's shutdown was confirmed across 10+ individual ISP ASNs showing simultaneous traffic drops.
Classification: We categorized each event by:
- Cause: Power failure, government-directed, military, weather, software, cable cut, or unknown
- Scope: Nationwide, regional, network (single ISP), or platform (cloud provider)
- Duration: Start and end dates, or "ongoing" for unresolved events
Limitations (and what I'd do differently next time):
- Cloudflare Radar sees traffic that transits its network. Very small ISPs or networks that don't use Cloudflare services may be underrepresented. I tried cross-referencing with IODA (Internet Outage Detection and Analysis) data for a few events and found consistent results, which gives me confidence in the Cloudflare data quality
- Duration measurements are approximate. "Start" means when the anomaly first appeared in Cloudflare data, which may lag the actual event by minutes or hours. For Iran's February 28 shutdown, I was watching in real time — the Cloudflare data picked up the drop within 15 minutes of news reports
- I don't have traffic volume data (how much traffic was lost), only anomaly detection data (whether a statistically significant drop occurred). For Q2, I'm working on adding traffic magnitude estimates
- This report covers verified outages only. I noticed additional disruptions in Cameroon (4 events), Chad (3 events), and Namibia (2 events), but excluded them because I couldn't independently verify their cause and scope. I'd rather report 26 verified events than 35+ unconfirmed ones
We publish this report quarterly. The Q2 2026 section at the top of this report delivers on that promise — it compares the April–June quarter against both this Q1 baseline and the same window in 2025. One methodology note on that year-over-year comparison: the 2025 and 2026 event counts are both drawn from the same curated outage-center feed, so the 65-vs-25 comparison is like-for-like on source — but because government-directed shutdowns are logged day by day, the raw count overstates how much calmer 2026 actually was. That caveat is spelled out in the Q2-vs-Q2 section above.
Enterprise Business Impact Assessment

The 26 outages I tracked in Q1 2026 aren't just data points. They represent real revenue loss, broken SLAs, and disrupted operations for thousands of businesses. In my role analyzing technology data at TechnologyChecker, I see the downstream effects directly — our scans show domains going dark, technology stacks becoming unreadable, and adoption metrics turning unreliable during these events.
The cost arithmetic
Applying the industry downtime cost benchmarks to Q1 2026's major events reveals the scale of potential losses:
| Event | Approx. Duration | Est. Cost Per Affected Enterprise |
|---|---|---|
| Iran (combined 60+ days) | 86,400+ min | $1.2B+ theoretical exposure |
| AWS ME-CENTRAL-1 (12 days) | 17,280 min | $242M+ per enterprise |
| AWS ME-SOUTH-1 (19 days combined) | 27,360 min | $384M+ per enterprise |
| Cuba (3 events, ~5 days total) | 7,200 min | $101M+ per enterprise |
| Portugal (21 days) | 30,240 min | $425M+ per enterprise |
These numbers are theoretical maximums. Real costs depend on how many services were affected, whether failover systems kicked in, and the specific business's revenue exposure to the affected region. But even at 1% of theoretical maximum, we're talking about millions in losses per major outage.
The Uptime Institute's annual outage analysis found that more than two-thirds of all outages cost more than $100,000. That benchmark was established before Q1 2026 added military strikes and 60-day shutdowns to the equation.
SLA exposure and credits
For AWS customers in the Middle East, Q1 2026 creates a specific contractual problem. AWS's compute SLA guarantees 99.99% uptime for multi-AZ deployments. With ME-CENTRAL-1 and ME-SOUTH-1 both failing, even multi-AZ deployments within those regions lost availability.
The SLA credit structure typically offers:
- 10% credit for uptime between 99.0% and 99.99%
- 30% credit for uptime below 99.0%
With actual March uptime around 39% for affected regions, customers would qualify for maximum credits. But 30% of your monthly bill doesn't come close to covering the actual business impact of 19 days of downtime.
Technology stack disruption
At TechnologyChecker, we track which technologies companies are using in real time across 29.9 million active domains. When an entire region goes offline, it creates a cascade of effects:
- Detection gaps. Our scanners can't reach domains in affected regions, creating false negatives in technology adoption data
- Churn confusion. Companies that lose connectivity look identical to companies that stopped using a technology. This muddies churn analytics
- Adoption lag. When connectivity returns, there's a rush of delayed data that can create artificial spikes in adoption metrics
For sales intelligence teams that rely on technographic data to identify prospects, these disruptions mean that prospect lists covering affected regions become unreliable during and immediately after outages. If you're running outbound campaigns targeting Middle Eastern companies, Q1 2026 data needs to be treated with caution.
Insurance and compliance considerations
Prolonged outages raise questions about cyber insurance coverage. Most policies cover downtime caused by cyberattacks or technical failures. But do they cover downtime caused by military strikes on a cloud provider? Or a government-mandated shutdown? These are gray areas that Q1 2026 is forcing insurers and legal teams to define.
For companies subject to data residency requirements (GDPR, regional data sovereignty laws), losing access to a cloud region for weeks creates compliance headaches. If your EU data is backed up to a Middle East region that goes offline, your disaster recovery plan may have a gap you didn't expect.
Sales intelligence disruption
For B2B sales teams that rely on technographic data and technology intelligence platforms to identify and qualify prospects, Q1 2026 created specific data quality problems.
When we scan domains at TechnologyChecker, we're looking for HTTP headers, JavaScript includes, DNS records, and HTML patterns that reveal a company's technology stack. If a domain is unreachable because its entire country is offline, our scanner returns nothing. That absence gets recorded as "no technology detected," which is technically accurate but practically misleading.
Multiply that across thousands of domains in affected regions, and you get distorted market share data, inaccurate churn metrics, and prospect lists that exclude companies that are still active customers. For sales teams targeting Middle Eastern companies during March 2026, any prospect list generated from technology scan data needs manual verification.
This is a problem we're actively working on at TechnologyChecker. Our approach involves flagging domains in affected regions with "outage-impacted" labels so that customers can distinguish between genuine technology changes and connectivity-driven scan failures. We've written about how technology detection works at scale in our technology lookup industry statistics report, and outage resilience is a growing part of that infrastructure.
The hidden cost: delayed decision-making
Beyond the direct financial losses, extended outages create a subtler but equally damaging effect: they delay business decisions. When key data feeds go dark (whether that's customer behavior data, API responses from third-party services, or real-time analytics), decision-makers lose the information they need to act.
Sales teams can't run accurate Salesforce reports on pipeline in affected regions. Marketing teams can't measure campaign performance for those geographies. Product teams can't track feature adoption. The entire data-driven decision-making apparatus slows down until connectivity returns and historical data is backfilled.
For companies that pride themselves on data-driven operations, a multi-week outage in a key market isn't just a financial loss. It's an operational blind spot that compounds every day it persists.
Building Multi-Cloud Resilience: Lessons from Q1 2026

Q1 2026 turned multi-cloud resilience from a "nice to have" into a survival requirement for any business with global operations. Here are the specific lessons and what to do about them.
Lesson 1: Geographic diversity beats provider diversity
Having workloads on both AWS and Azure doesn't help if both deployments are in the same region. The AWS Middle East outages showed that regional risks (power grid failures, military activity) affect all providers in a geography simultaneously.
What to do:
- Map your cloud deployments by physical location, not just provider name
- Ensure failover regions are in different geopolitical risk zones
- For Middle East operations, maintain active-active deployments in European or Asian regions as backup
Lesson 2: Government shutdowns are not edge cases
Four government-directed shutdowns in a single quarter across three countries (Iran, Uganda, Congo). This isn't rare anymore. For companies operating in markets where government control of internet infrastructure is strong, plan for it.
What to do:
- Identify which of your markets have a history of government shutdowns (Iran, Uganda, Congo, Myanmar, Ethiopia, and others)
- Build offline-capable features for mobile apps and client software serving those markets
- Use monitoring tools that can distinguish between "service down" and "country unreachable"
- Maintain a real-time dashboard showing country-level connectivity status using Cloudflare Radar or similar data
Lesson 3: Power infrastructure is the weakest link
42% of Q1 2026 outages traced back to power failures. This is the most fixable problem on the list. Cloud providers invest heavily in backup power, but customers often overlook power dependencies in their own infrastructure.
What to do:
- Audit your power dependencies beyond the cloud layer (office connectivity, VPN concentrators, on-premise systems)
- For critical applications, ensure your cloud provider's regions have independent power sources (not just backup generators, but separate grid connections)
- Test failover procedures specifically for power loss scenarios, not just network failures
Lesson 4: Monitor what matters before it fails
Most companies learn about outages from their users, not from their monitoring systems. By the time customers complain, you're already losing revenue.
What to do:
- Deploy external monitoring that checks connectivity from multiple global locations (not just from within your cloud provider)
- Use real-time analytics that can detect traffic drops within minutes
- Set up automated alerts on Cloudflare Radar's traffic anomaly data for countries and ASNs you depend on
- Maintain a New Relic or Datadog setup that tracks third-party dependency health alongside your own
Lesson 5: Update your threat model
Before Q1 2026, most enterprise threat models included cyberattacks, natural disasters, and technical failures. Few included military strikes on cloud data centers or 60-day government shutdowns.
What to do:
- Add "sovereign risk" as a category in your business continuity plan
- Evaluate each cloud region not just on latency and pricing, but on geopolitical stability
- Consider keeping critical data and services in regions with strong rule of law and stable governance
- Review your disaster recovery plan against the actual events listed in this report
According to ARN's 2026 network outage report, total outage events increased by 28% compared to the prior period. That trajectory means Q2 won't be quieter. Prepare now.
A practical checklist based on Q1 2026 data
Here's what we'd recommend based on the specific events we tracked this quarter:
- Audit your cloud region dependencies. List every cloud region your workloads run in. For each one, assess the geopolitical risk. If any region is in or near an active conflict zone, establish an active failover in a stable region
- Test failover with realistic scenarios. Don't just test "server goes down." Test "entire region goes dark for 2 weeks." That's what actually happened in Q1 2026
- Build country-level monitoring. Add Cloudflare Radar's traffic anomaly API to your monitoring stack. Set alerts for traffic drops in countries where you have customers or infrastructure
- Create an outage response playbook by cause type. A software bug requires different actions than a government shutdown. Having pre-defined runbooks for each category saves hours during the initial response
- Review your contracts. Check SLA terms for "force majeure" and "acts of war" exclusions. Q1 2026's military strikes may fall outside standard SLA coverage
- Communicate proactively. When a regional outage affects your customers, tell them before they tell you. Having real-time outage data lets you send status updates within minutes of detection
The companies that came through Q1 2026 with the least disruption were the ones that had already distributed their infrastructure across multiple regions and providers. Multi-cloud isn't a buzzword anymore. It's a demonstrated survival strategy.
Frequently Asked Questions
What were the major internet outages in Q2 2026?
Q2 2026 saw 25 verified internet outages, and the defining pattern was government-directed shutdowns, which caused 56% of all events. Most were exam-season blackouts: Iraq alone ran coordinated shutdowns on June 2, 11, and 28, and its networks topped the anomaly feed with 10 flagged disruptions. Iran's record 87-day national blackout ended May 26. Other notable events were a nationwide power failure in Tanzania (June 27), a magnitude-7.5 earthquake in Venezuela, a subsea cable cut in Saint Lucia, and a faulty-DNSSEC batch that broke domain resolution for users in Germany. Power failures, Q1's top cause at 42%, fell to just 4%.
Are internet outages getting better or worse in 2026?
It depends on how you count, and that caveat matters. Cloudflare's curated outage center logged 25 events in Q2 2026 against 65 in Q2 2025, which looks like a sharp improvement. But most of that gap is an accounting artifact: government-directed exam shutdowns get logged day by day, and 2025's exam season produced 40 of them versus 14 this year. Strip that category out and the two quarters are far closer (25 non-government events in 2025 versus 11 in 2026). The underlying vulnerability is unchanged, so don't read the lower 2026 count as proof the internet is healing. Quarter to quarter the event count was flat (26 in Q1, 25 in Q2); what changed was the cause, which rotated from power failures to government shutdowns.
Why do governments shut down the internet during exams?
Several countries across the Middle East and North Africa cut internet access during national exam sessions to stop question papers and answers leaking over social media and messaging apps. Cloudflare has tracked the practice since 2015. It leaves a distinct signature in the data: multiple ISPs in one country dropping traffic at the same minute, usually in the early morning, for a few hours, on scheduled exam dates. In Q2 2026 it was the single biggest outage cause. Sudan ran about 10 shutdowns in 11 days in April, and Iraq carried the pattern through May and June. These blackouts are predictable and time-boxed, which makes them easier to plan around than power or military outages, but they still cut connectivity for entire populations.
What were the major internet outages in Q1 2026?
Q1 2026 saw 26 verified internet outages across 15 countries. The three most significant were Iran's 60+ day government-directed shutdown (affecting 10+ ISPs simultaneously), four AWS Middle East failures across Dubai and Bahrain (including the first confirmed military strike on a major cloud region), and three total grid collapses in Cuba within 18 days. Other notable events included 21-day storm damage in Portugal, election-related shutdowns in Uganda and Congo, and military-driven outages in Ukraine. Power failures caused 42% of all events, making it the most common root cause.
What caused the major internet outages in Iran and Cuba in Q1 2026?
Iran's outages were government-directed. The January 8 - February 1 shutdown coincided with domestic protests, and the February 28 shutdown (which ran 87 days, ending May 26, 2026) coincided with military tensions. Cloudflare Radar confirmed that 10+ ISPs dropped traffic simultaneously, indicating centralized government control rather than technical failure. Cuba's three March outages were all caused by failures in the national power grid. Cuba relies on aging thermoelectric plants and has a single ISP (ETECSA), so when the grid fails, internet access drops to zero nationwide with no backup path.
How can enterprises monitor internet outages in real-time in 2026?
The most reliable free tool for real-time monitoring is Cloudflare Radar, which tracks traffic anomalies at the country and ASN level globally. For enterprise-grade monitoring, tools like Datadog and New Relic can track third-party dependency health alongside your own infrastructure. ThousandEyes (owned by Cisco) provides ISP and cloud provider outage mapping. The key is monitoring from outside your provider's network. If you only monitor from within AWS, you won't detect an AWS-wide failure until your own monitoring goes down with it.
Where can you report internet outages?
For U.S. consumers, you can report outages to your ISP directly, to Downdetector for community visibility, or to the FCC through their consumer complaint center. For enterprise teams, the more useful action is to file an SLA violation claim with your cloud provider. Document the outage start time, duration, and business impact immediately. AWS, Azure, and Google Cloud all have SLA credit request processes, but they typically require filing within 30 days of the event.
Why has the internet gone down more frequently in 2026?
Several factors are converging. Power grid instability is worsening in developing regions due to aging infrastructure and climate-related stress. Geopolitical conflicts are directly targeting internet infrastructure for the first time (military strikes on AWS data centers, government shutdowns in Iran). And the growing consolidation of internet services means that a single failure at a major provider can cascade globally. Outage rates were already rising sharply throughout 2025, and Q1 2026 suggests the trend is accelerating rather than stabilizing.
How much do internet outages cost businesses?
The financial exposure is significant. Costs depend on how many services are affected and how quickly you can fail over. For Q1 2026's longest events (Iran at 60+ days, AWS Middle East at 19+ days), the theoretical cost exposure runs into hundreds of millions per enterprise, though real-world costs vary based on failover capability and regional revenue exposure. See our Enterprise Business Impact Assessment section above for detailed cost breakdowns per event.
Is the internet getting less reliable in 2026?
The honest answer is "not obviously by volume, but the failure modes are shifting." Across two quarters we tracked 26 verified outages in Q1 and 25 in Q2, a steady pace rather than an acceleration. Year over year, Cloudflare's curated count actually fell (65 events in Q2 2025 to 25 in Q2 2026), though that drop is inflated by how day-by-day exam shutdowns are counted (see the Q2-vs-Q2 section above). What's genuinely changing is the cause mix, not the count: Q1 2026 was dominated by power failures (42%), Q2 by government-directed shutdowns (56%), and military strikes on cloud infrastructure showed up as a category in 2026 that barely existed before. So the internet isn't clearly less reliable by event count, but its outages are trending toward deliberate, harder-to-mitigate causes.
What cloud regions were affected by outages in Q1 2026?
AWS ME-CENTRAL-1 (Dubai) and ME-SOUTH-1 (Bahrain) were the only major public cloud regions directly affected by outages in Q1 2026. ME-CENTRAL-1 experienced two events: a 12-day power issue (March 1-13) and a military-strike-related outage starting March 31 that resolved May 1, 2026. ME-SOUTH-1 had an 11-day power issue (March 2-13) and an 8-day disruption from drone activity (March 23 - April 1). No other major cloud provider regions (Azure, Google Cloud, Oracle Cloud) reported comparable outages during Q1 2026.
How should SaaS companies prepare for country-level internet outages?
Build your architecture around the assumption that entire countries can go offline for weeks. Practical steps include: implementing offline-capable features in mobile apps for high-risk markets, using queued data synchronization that processes automatically when connectivity returns, deploying edge caching in multiple geographic regions so users in unaffected areas aren't impacted, and monitoring country-level traffic data through services like Cloudflare Radar. For B2B SaaS specifically, set up automated customer notifications when you detect outages in regions where your users are concentrated. This turns a reactive support burden into a proactive trust signal.
This edition closes out Q2 2026 (April–June) with a full-quarter comparison against Q1 2026 and against Q2 2025. Our Q3 2026 report will follow in October. If you want to track how these outages affect technology adoption patterns, explore our technology detection platform to see real-time changes across 29.9 million active domains.
Analysis by Emma Davies, Data Analyst at TechnologyChecker. Emma's work involves analyzing technology adoption data across millions of domains to identify patterns, trends, and signals for enterprise sales teams.
Emma Davies
Data Analyst

