Shopify Analytics: Trends, Insights and Shopify Market Share 2026
We crawled 2.4M live Shopify stores and enriched 80,970 with company data. See real market share, platform migration, and the tech stack merchants run.
Published •Updated •64 min read

TechnologyChecker.io detects 2,446,083 live Shopify stores in our February 2026 crawl — and 1,324,454 domains that used to run Shopify and no longer do. That second number is the one most Shopify reports skip, and it reframes the platform's 2026 story: Shopify holds 45.99% of the ecommerce-platform market (2.6× WooCommerce), but the land-grab phase is over and the expansion-revenue phase has begun.
This report is built on our own data first: 2.4M actively detected Shopify domains, 80,970 stores enriched with verified LinkedIn company profiles, a 241-month usage history going back to Shopify's first detected store in 2005, and migration tracking that shows exactly which platforms merchants leave to join Shopify — and which ones they leave Shopify for. Where we cite third-party numbers (Shopify's 2025 10-K, Store Leads), we say so explicitly. As the founder of TechnologyChecker.io, I've led this analysis with our research team over the past six months. For the live, monthly-updated version of this dataset, see our Shopify technology profile.
What you'll learn in this report:
- Current Shopify market share and competitive positioning
- Detailed growth trends from 2019-2026
- Performance benchmarks for your store comparison
- Platform migration patterns and merchant satisfaction data
- Revenue and financial performance insights
- BFCM 2024 and 2025 record-breaking results ($14.6B in 2025)
- Shopify's AI-first strategy: The Renaissance Edition and Agentic Commerce
- B2B commerce explosion (96% YoY growth) and Shop Pay's 200M+ user milestone
- Actionable recommendations based on real merchant data
Executive Summary: Key Findings from Our 2026 Analysis
After analyzing millions of data points across the Shopify ecosystem, our research shows that Shopify's lead continues to grow in 2026, even with natural market consolidation. Here's what the numbers say:
Critical Statistics at a Glance
From our crawl (TechnologyChecker.io, February 2026):
- 2,446,083 live Shopify stores actively detected — the largest single platform in our database, 8× the next-biggest
- 45.99% ecommerce-platform market share, ranking #1 and commanding 2.6× the share of WooCommerce (17.79%)
- 1,324,454 domains previously ran Shopify and have since churned off — a migration signal most reports never surface
- 3.1:1 inbound migration ratio: across tracked platform switches, 31,946 stores moved to Shopify vs. 10,271 that moved away — with Magento defectors running 17.8:1 in Shopify's favor
- 82.7% of enriched Shopify companies have 1–10 employees; 94.6% are under 50 — this is the backbone of independent commerce, not an enterprise platform
- Klaviyo runs on 43.1% of the stores we analyzed, the single most-adopted third-party marketing tool in the Shopify ecosystem
From Shopify's public filings and Store Leads:
- $378 billion in Gross Merchandise Volume processed in 2025 (+29% YoY); Q1 2026 GMV crossed $100B in a single quarter for the first time
- $11.5 billion in FY 2025 revenue (+30% YoY), crossing the $10B milestone for the first time
- $14.6 billion in BFCM 2025 sales — a record weekend with 81+ million global buyers
- B2B GMV surged 96% YoY in 2025, with B2B features now available on all Shopify plans (not just Plus)
- $0 debt and a $155.65 billion market cap (April 2026) — the strongest balance sheet in Shopify's history
So what does this mean if you're a merchant? Shopify isn't just holding its position. It's pulling further ahead through better conversion rates (up to 36% higher than alternatives), a massive app ecosystem (21,000+ apps), and steady innovation across B2C and B2B commerce. The Winter '26 "Renaissance Edition" shipped 150+ AI-focused product updates, including Sidekick AI evolution into a proactive commerce copilot. The FY 2025 financials confirm Shopify is now highly profitable and cash-rich, with 30%+ revenue growth and strong free cash flow. That kind of financial health means the platform isn't going anywhere.
Methodology: How We Conducted This Analysis
Transparency matters. You deserve to know how we got these numbers. Our methodology includes:
Data Sources
- Primary data from Technologychecker.io: tracking 2.8+ million live Shopify stores with historical data dating back to 2006
- Official Shopify public statistics: revenue reports, GMV data, and platform announcements
- Third-party analytics providers: Digital Silk, BuiltWith, and other technology detection tools
- Statista Shopify Dossier (2025): Comprehensive financial data, market share breakdowns by country, store demographics, and app ecosystem metrics — sourced from Shopify SEC filings, Datanyze, BuiltWith, Store Leads, AppMagic, CompaniesMarketCap.com, and eMarketer/Insider Intelligence
- Our proprietary tracking systems: TechnologyChecker.io's ongoing monitoring of ecommerce platforms — learn more about TechnologyChecker data methodology
Verification Process
- Cross-referencing multiple data sources for accuracy
- Identifying and noting discrepancies when sources conflict
- Time-stamping all statistics with collection dates
- Quarterly updates to maintain data freshness
Limitations to Consider
- Some app installations cannot be detected (we track approximately 5,531 of 17,981+ total apps)
- Employee counts are self-reported and 95.2% are "unknown"
- Historical store counts use DNS heuristics for approximation
- Real-time data may show slight variations from published quarterly figures
We want you making decisions based on verified numbers, not guesswork.
What Our Crawl Shows: The TechnologyChecker Shopify Dataset
Most Shopify reports recycle the same three numbers: revenue, GMV, and store count. This section is the part you can't get anywhere else — it's built entirely from our own detection crawl and our LinkedIn-enriched company dataset of 80,970 Shopify stores.
The Number Nobody Publishes: 1.32M Churned Domains
Our crawl detects 2,446,083 live Shopify stores. It also detects 1,324,454 domains that previously ran Shopify and no longer do. For every two stores live on the platform today, roughly one has come and gone.
That's not a weakness signal — store churn is normal in commerce, where a large share of stores are side hustles and seasonal tests that never reach scale. But it reframes the headline growth story. Shopify's net store count is still climbing, yet our month-over-month crawl shows quarterly store growth has cooled to roughly -1.3% QoQ. The platform isn't running out of new merchants; it's that the existing 2.4M-store base is now the real market. If you sell apps or services to Shopify merchants, your addressable market is the installed base, not new launches.
Platform Migration: Who Switches In, Who Switches Out
This is the dataset's sharpest edge. We track which platform a domain ran before Shopify, and which platform it moved to after leaving. Across all tracked switches:
| Platform | Switched to Shopify | Switched from Shopify | Net ratio |
|---|---|---|---|
| WooCommerce | 16,660 (2,383 last 12mo) | 6,448 (1,043 last 12mo) | 2.6 : 1 in Shopify's favor |
| Magento | 5,186 (446 last 12mo) | 291 (43 last 12mo) | 17.8 : 1 in Shopify's favor |
| Wix eCommerce | 4,431 (373 last 12mo) | 2,366 (450 last 12mo) | 1.9 : 1 in Shopify's favor |
| BigCommerce | 1,587 (173 last 12mo) | 386 (37 last 12mo) | 4.1 : 1 in Shopify's favor |
| PrestaShop | 1,471 (191 last 12mo) | 175 (24 last 12mo) | 8.4 : 1 in Shopify's favor |
| Total (tracked) | 31,946 | 10,271 | 3.1 : 1 in Shopify's favor |
Two findings stand out. First, WooCommerce is both Shopify's biggest feeder and its biggest exit — 16,660 stores left WooCommerce for Shopify, but 6,448 went the other way. The WooCommerce-to-Shopify pipeline is real, but it's a two-way street, not a rout. Second, Magento is a near-total loss for Adobe: 5,186 Magento stores moved to Shopify against just 291 moving back. When a merchant outgrows a self-hosted platform, Shopify Plus — not Adobe Commerce — is where they land.
The Tech Stack Shopify Merchants Actually Run
Beyond Shopify itself, we detect what else is installed on each store. Among the Shopify stores in our enriched dataset:
| Category | Most-adopted tools (share of stores analyzed) |
|---|---|
| Marketing automation | Klaviyo 43.1%, MailChimp 19.6%, Omnisend 3.3% |
| Analytics | Google Analytics 67.7%, Facebook Pixel 61.0%, GA4 57.5%, Microsoft Clarity 11.9% |
| Payments | PayPal 71.1%, Visa 67.1%, Shopify Pay 66.5%, Apple Pay 62.6%, Stripe just 5.6% |
| Shipping | UPS 11.9%, DHL 8.8%, USPS 5.8%, FedEx 5.6% |
Klaviyo's 43.1% is the headline. No other third-party tool comes close to that adoption on Shopify — it's effectively the default email/SMS layer for the platform, and it explains why Klaviyo built its entire company on the Shopify ecosystem. The other tell is Stripe at 5.6%: on most of the web Stripe is dominant, but inside Shopify, Shopify Pay (66.5%) and Shop-native rails crowd it out almost entirely. Shopify has effectively walled its own checkout garden.
Who the Merchants Actually Are
Our LinkedIn-enriched data shows a consistent profile. 82.7% of enriched Shopify companies have 1–10 employees, and 94.6% have fewer than 50. By founding decade, 46.9% started in the 2010s and 30.5% in the 2020s — over three-quarters are digital-native businesses under 15 years old. By country, the United States leads with 34,324 enriched companies, followed by the UK (8,550), Australia (6,252), Canada (5,331), and a fast-rising India (1,579). By industry, Retail (16.6%) and Retail Apparel & Fashion (11.9%) together account for over a quarter of the base, with Food & Beverage and Wellness following.
The takeaway: Shopify is not an enterprise platform that also serves small business. It is a small-business platform that also hosts FedEx, Ford, Adobe, and Colgate-Palmolive merch stores. Build, sell, and benchmark accordingly.
Part 1: Shopify's Market Dominance in 2026
Global Market Share Analysis: How Shopify Compares
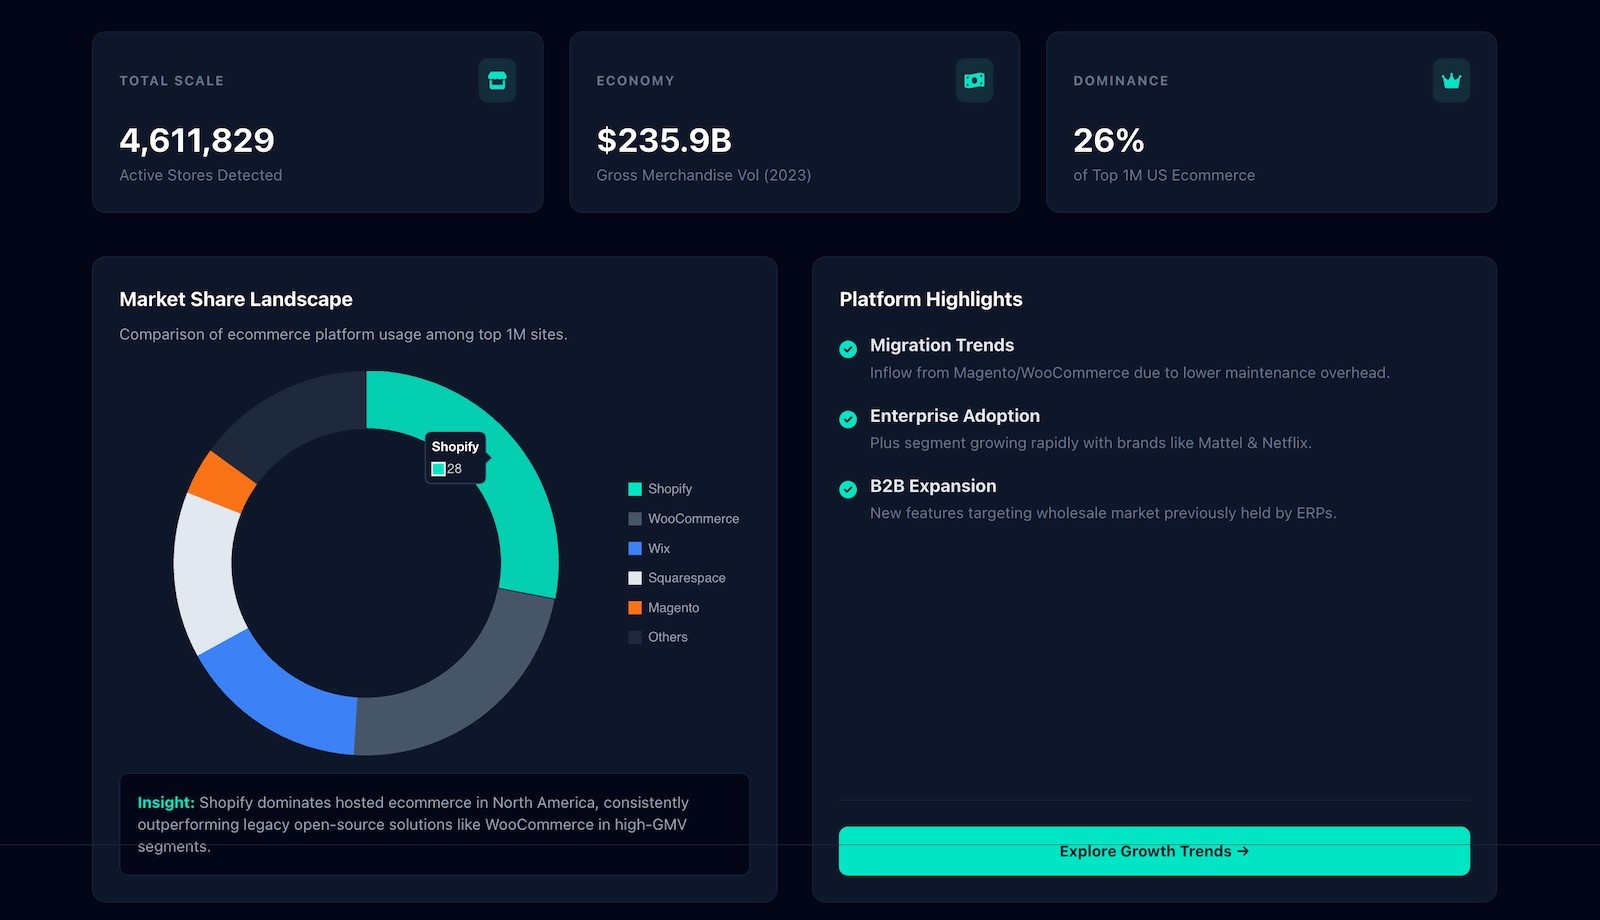
In our February 2026 crawl, Shopify holds 45.99% of the ecommerce-platform market — 2.6× the share of WooCommerce, the #2 platform. That's an unusually dominant position in a crowded field. Here's what it looks like in practice.
Market Share Breakdown by Platform
Based on our detection data across the ecommerce-platform category:
| Platform | Market Share | Domains Detected | Notable Characteristics |
|---|---|---|---|
| Shopify | 45.99% | 2,446,083 | Full-featured, hosted solution |
| WooCommerce | 17.79% | 946,491 | WordPress plugin, open-source |
| Wix eCommerce | 7.73% | 411,241 | Website builder with ecommerce |
| Ecwid | 2.58% | 137,062 | Embeddable cart, multi-platform |
| PrestaShop | 0.75% | 39,879 | Self-hosted, open-source |
| OpenCart | 0.55% | 29,460 | Self-hosted, open-source |
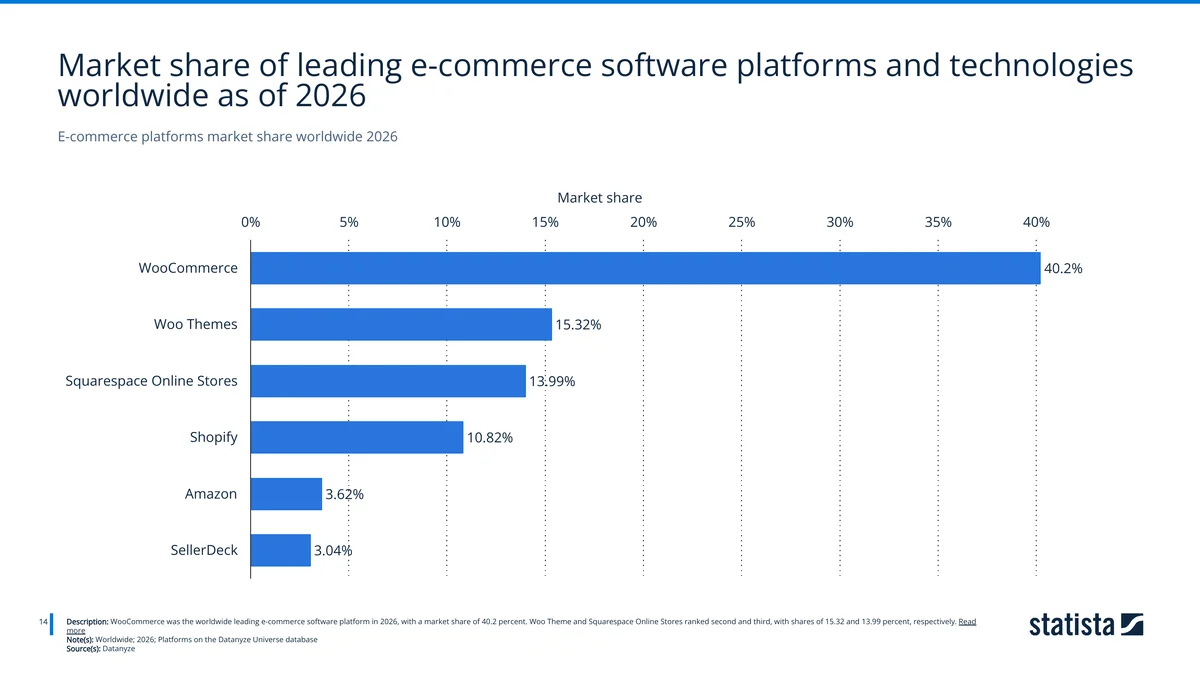
A note on methodology: Market-share figures vary widely by what's counted. The Datanyze Universe database (shown above, via Statista) measures share across all tracked web domains, where WooCommerce leads at 40.2% because its WordPress plugin appears on countless non-commerce sites. Our 45.99% figure measures share within the ecommerce-platform category — domains we positively detect as running a storefront platform. BuiltWith's active-storefront methodology lands in between, around 26%. The direction is the same across all three: when you filter to sites actually built to sell, Shopify's lead is decisive.
Market share directly correlates with ecosystem strength. Shopify's category-leading share means:
- More third-party developers building apps and integrations
- Better negotiating power with payment processors and shipping carriers
- Larger community support and educational resources
- Proven stability and lower platform risk for merchants
Regional Market Penetration: Where Shopify Dominates
Our geographic analysis turns up some interesting adoption patterns worth looking at if you're thinking about where to sell.
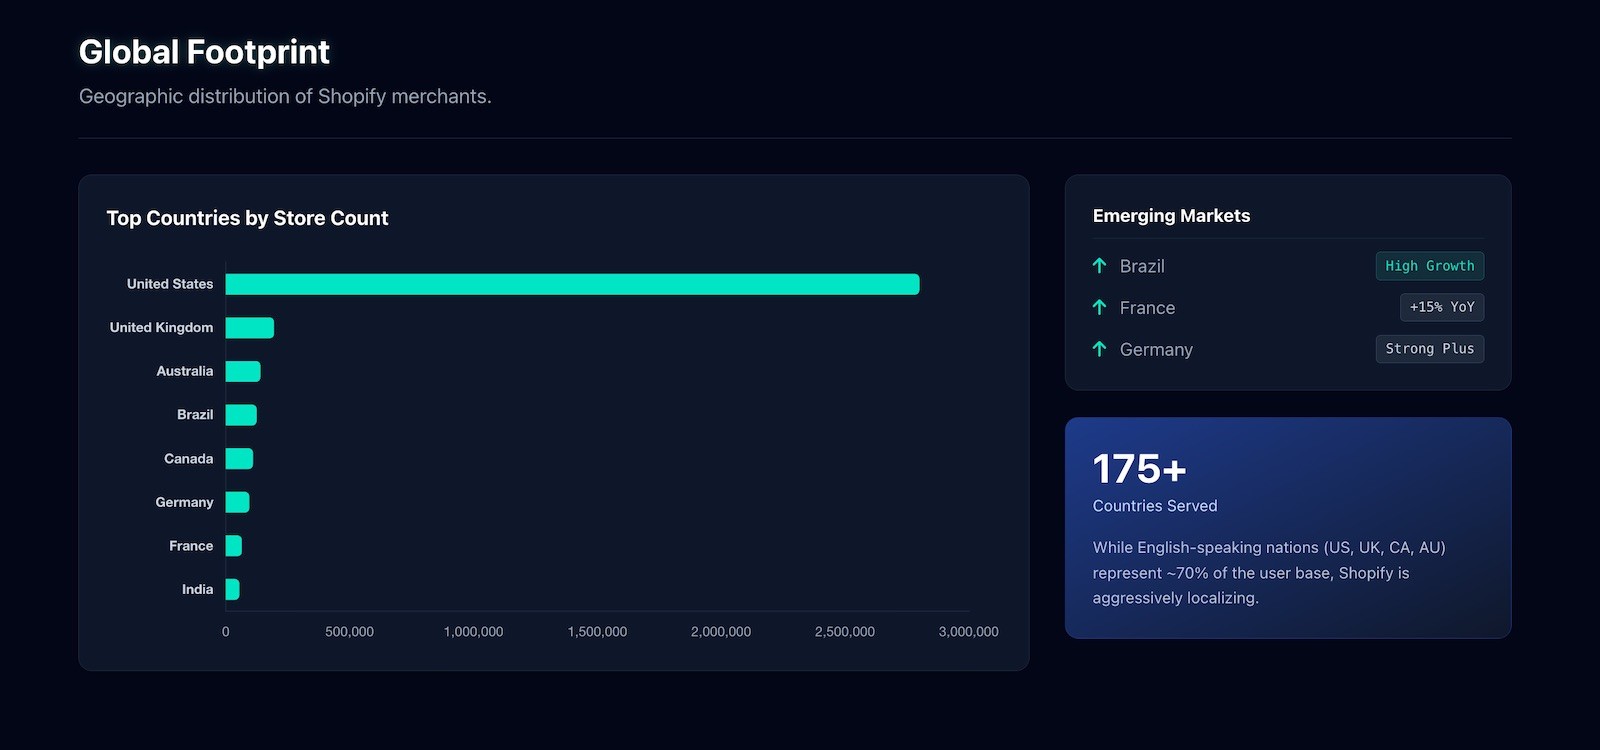
United States: The Powerhouse Market
Key Statistics:
- 1,073,944 active Shopify stores (37.7% of global total)
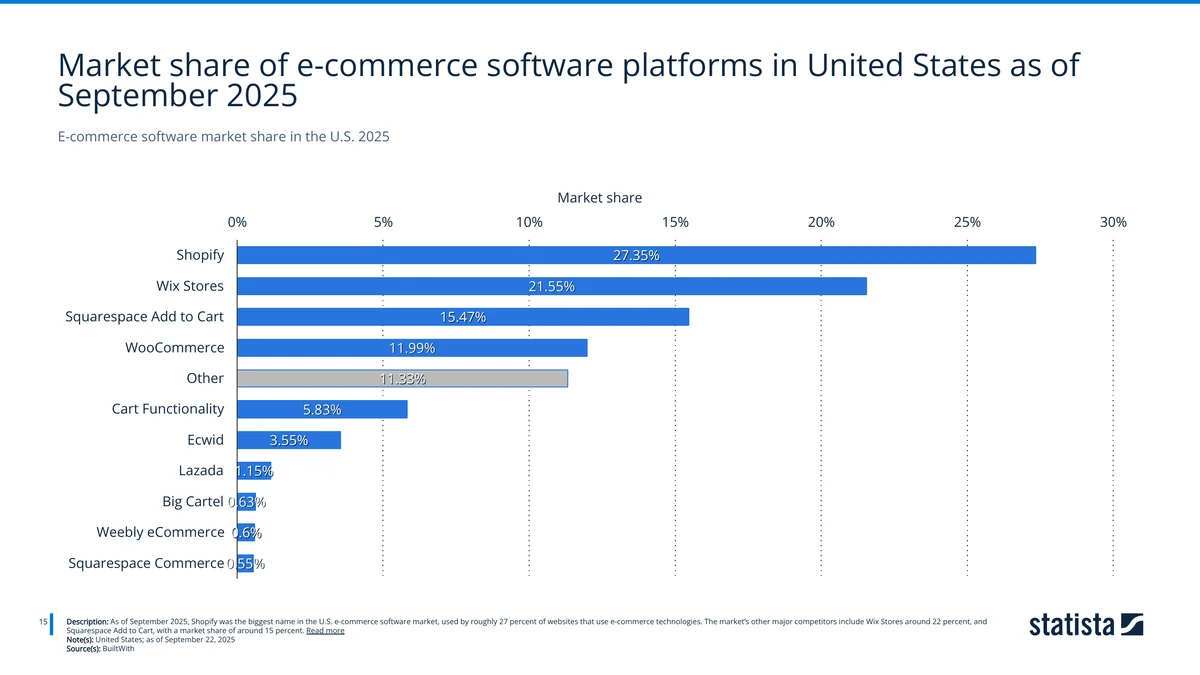
- 27.35% U.S. market share as of September 2025 (BuiltWith), ahead of Wix Stores (21.55%) and Squarespace (15.47%)
- ~3 million websites in the U.S. use Shopify technology
- 11% of all U.S. retail ecommerce sales flow through Shopify stores
Analysis: The U.S. is Shopify's strongest market by far, with penetration rates 40% above global averages. This concentration feeds on itself: more U.S.-focused apps, more shipping integrations, more payment solutions, all of which make Shopify even harder to displace domestically.
International Markets: Global Expansion Success
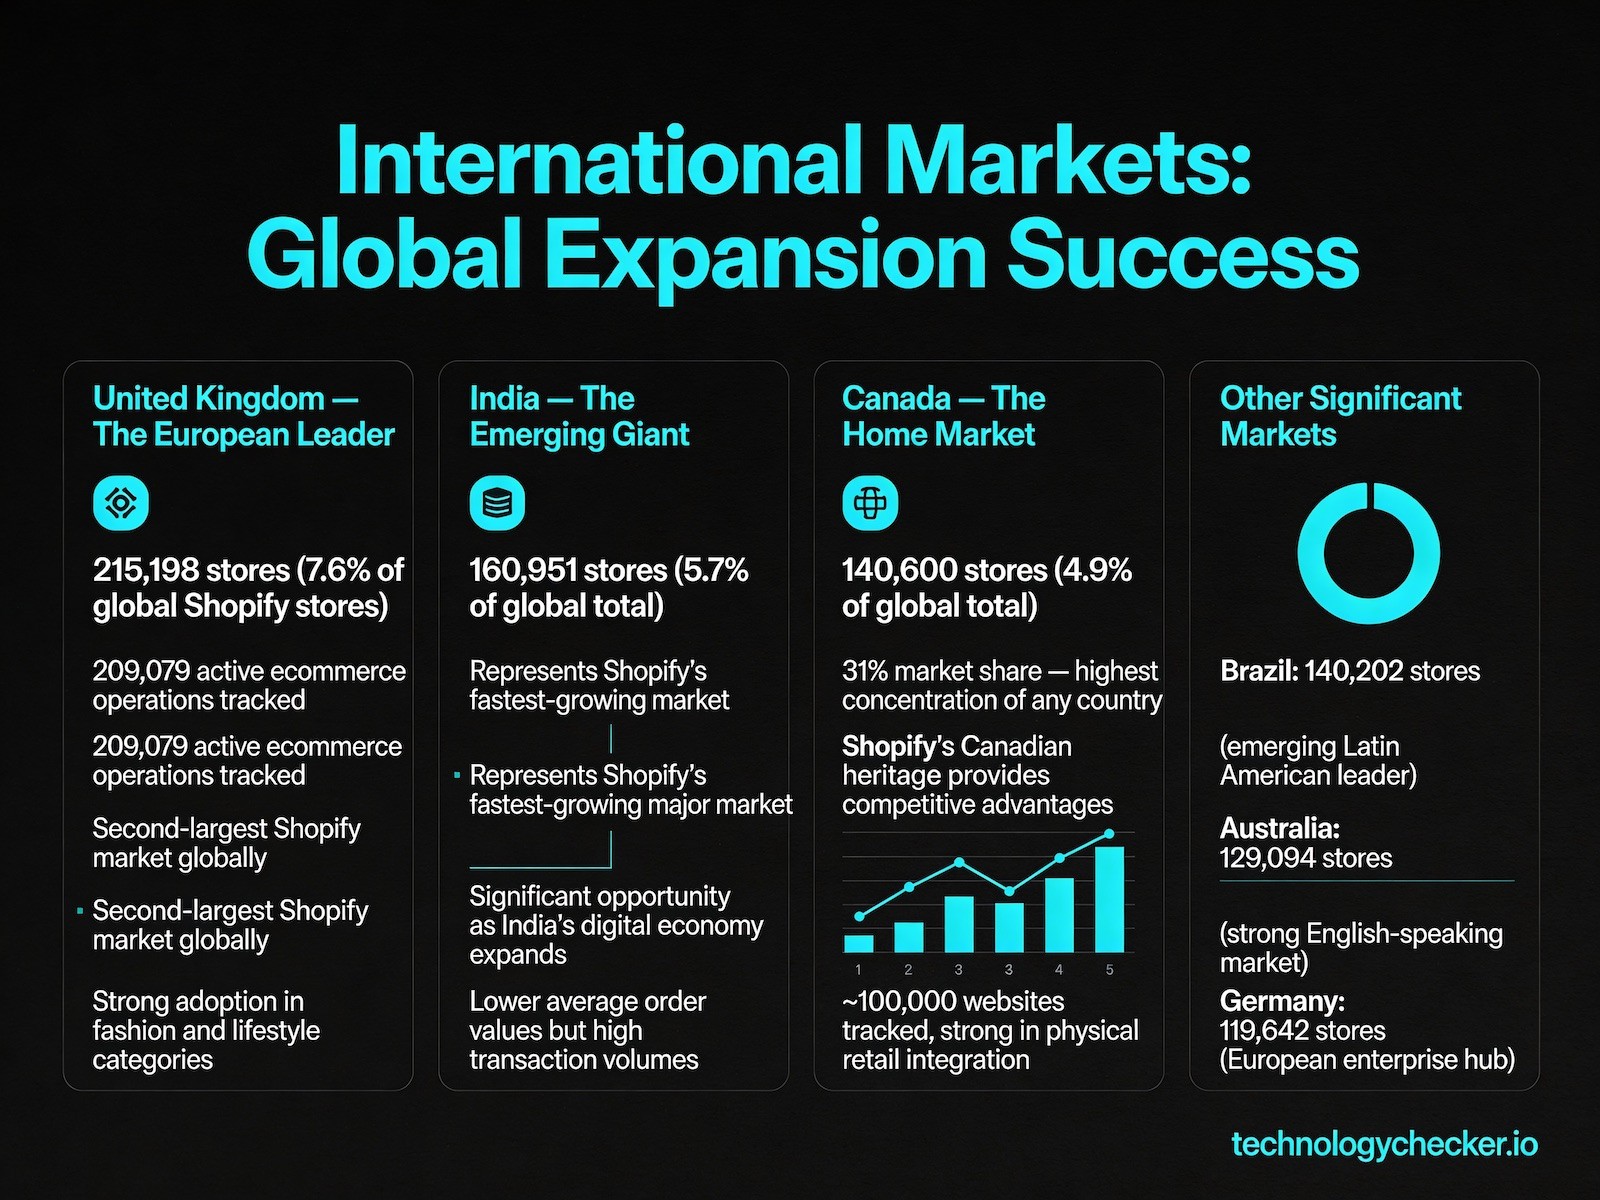
United Kingdom — The European Leader:
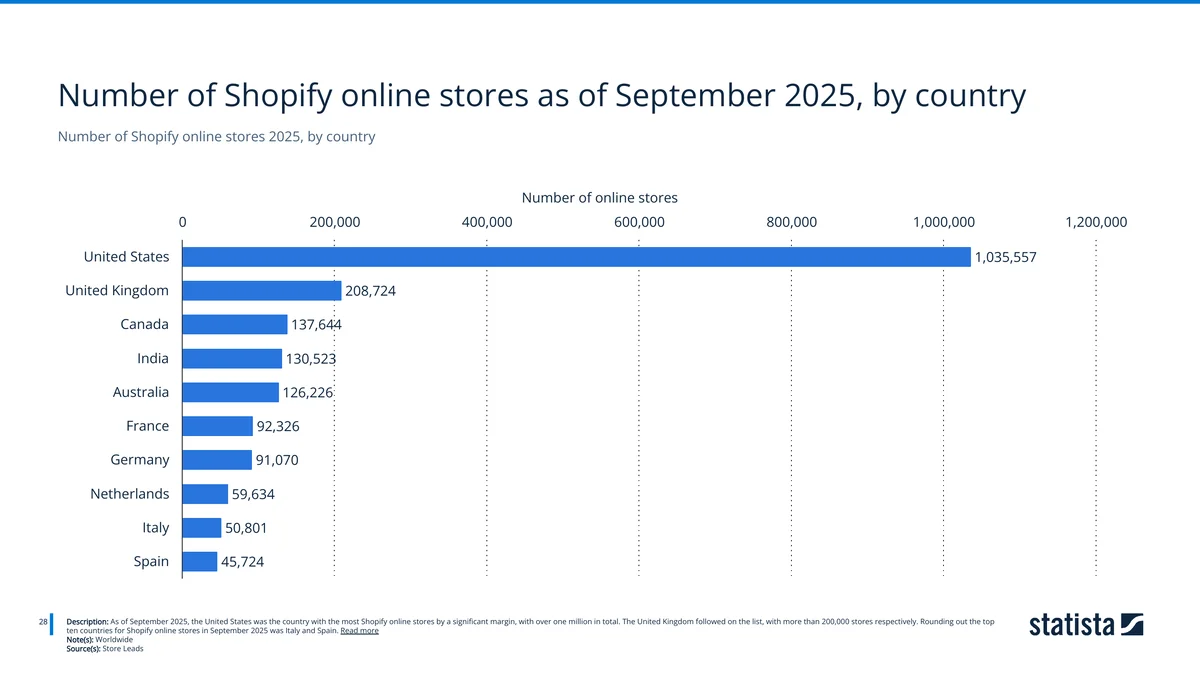
- 208,724 stores — second-largest Shopify market globally (Statista, Sep 2025)
- 23.17% market share in the UK, closely trailing Wix Stores (24.16%) — one of the few markets where Shopify isn't #1
- Strong adoption in fashion and lifestyle categories
India — The Emerging Giant:
- 130,523 stores (Statista, Sep 2025)
- Represents Shopify's fastest-growing major market
- Significant opportunity as India's digital economy expands
- Lower average order values but high transaction volumes
Canada — The Home Market:
- 137,644 stores (Statista, Sep 2025)
- 29.34% market share — the highest concentration after Sweden (31.44%) and the Netherlands (32.01%)
- Shopify's Canadian heritage provides competitive advantages
Other Significant Markets:
- Australia: 126,226 stores (strong English-speaking market)
- France: 92,326 stores (22.75% market share — #1 in France)
- Germany: 91,070 stores (26.11% market share — leading over Wix at 17.81%)
- Netherlands: 59,634 stores (32.01% market share — Shopify's highest in Europe)
- Italy: 50,801 stores (18.07% market share — #2 behind WooCommerce at 19.67%)
- Spain: 45,724 stores
Shopify's presence in 175+ countries means you can start selling locally and expand internationally without switching platforms. That kind of geographic coverage also reduces platform risk for merchants.
Consumer reach milestone: Shopify is estimated to reach 875 million+ unique customers in 2026 — the total number of unique buyers purchasing from Shopify-powered stores globally. That's nearly 11% of the world's population interacting with a Shopify store at least once.
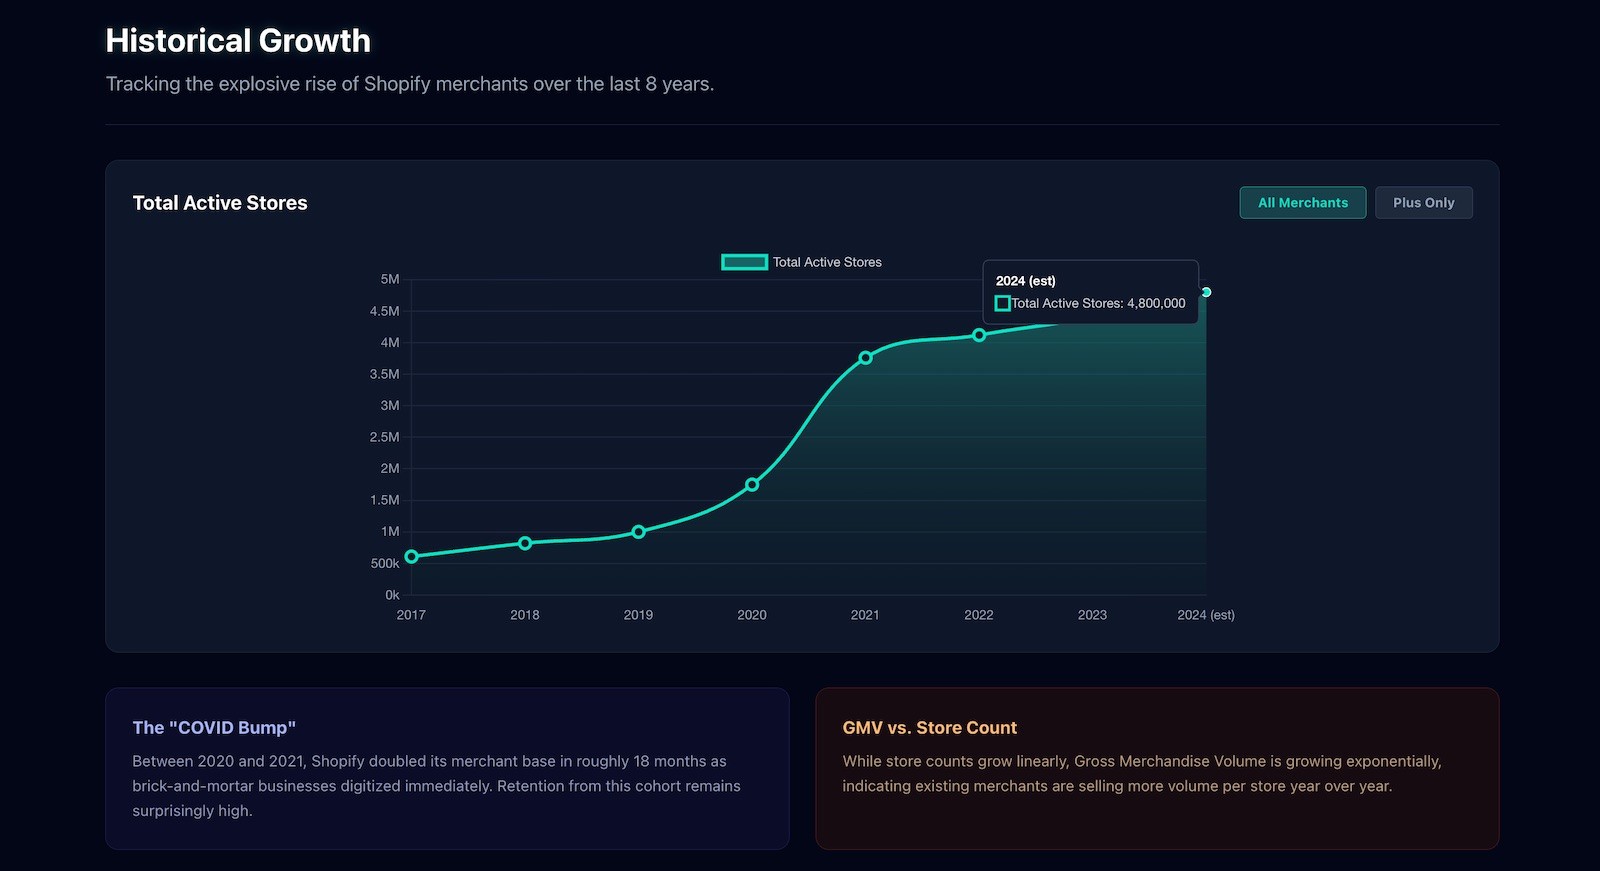
Part 2: Historical Growth Trends
Quarter-by-Quarter Analysis (2019-2026)
To understand where Shopify is heading, you need to look at where it's been. The seven-year data tells a clear story.
The Growth Journey: 2019-2026
| Period | Store Count | QoQ Change | Notable Events |
|---|---|---|---|
| 2019 Q1 | 753,977 | Baseline | Pre-pandemic baseline |
| 2020 Q1 | 1,062,232 | +41% | COVID-19 catalyst begins |
| 2020 Q2 | 1,245,667 | +17.3% | Peak pandemic acceleration |
| 2021 Q1 | 1,484,871 | +4.3% | Post-pandemic stabilization |
| 2022 Q1 | 1,646,398 | -0.8% | First contraction observed |
| 2023 Q1 | 2,092,927 | +27.1% | Recovery and growth phase |
| 2024 Q1 | 2,376,721 | +13.6% | Steady expansion |
| 2025 Q1 | 2,527,881 | +6.4% | Continued growth |
| 2025 Q4 | 2,859,828 | +6.2% | +18% YoY |
| 2026 Q1 | 2,846,464 | -0.5% | Market consolidation |
Key Insights from Historical Data
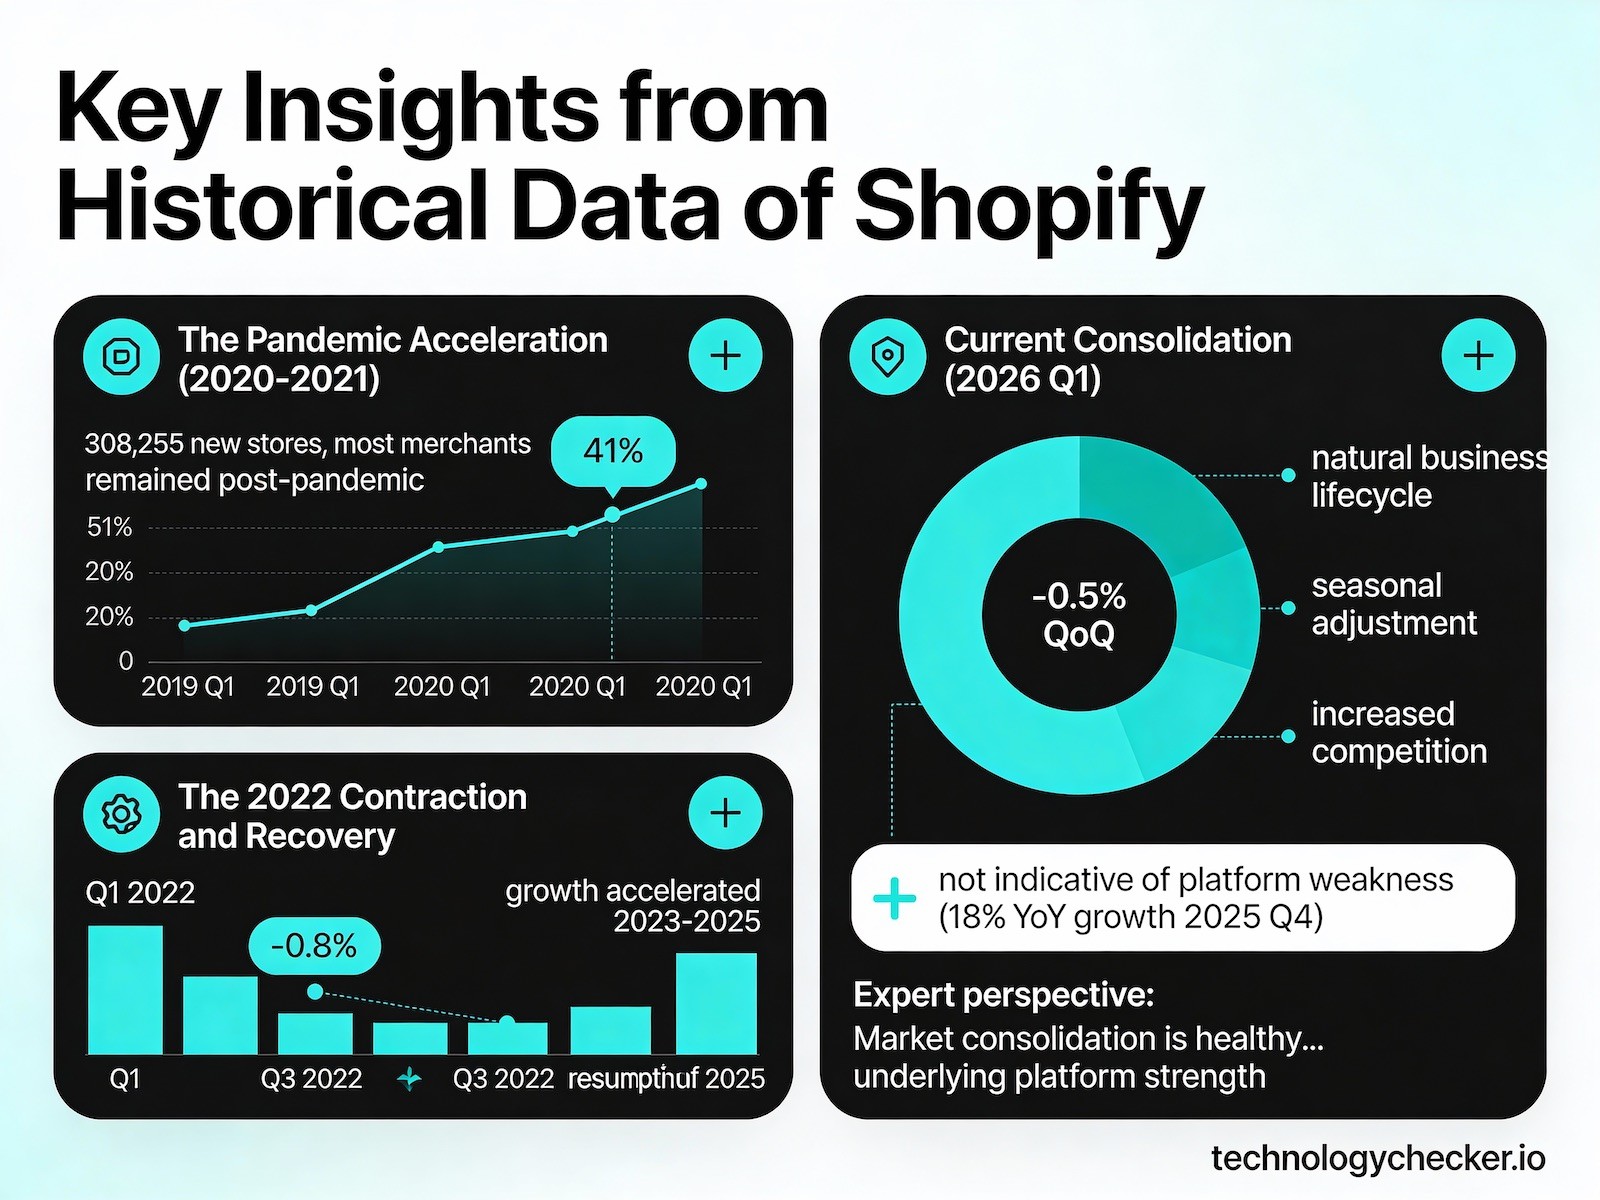
1. The Pandemic Acceleration (2020-2021) COVID-19 forced a massive shift to digital commerce. Shopify stores jumped 41% in a single year (2019 Q1 to 2020 Q1), adding 308,255 new stores. And most of those merchants stayed.
2. The 2022 Contraction and Recovery In 2022 Q1, we observed the first quarter-over-quarter decline (-0.8%), reflecting post-pandemic normalization. However, growth resumed by Q3 2022 and accelerated through 2023-2025.
3. Current Consolidation (2026 Q1) The -0.5% QoQ decrease in 2026 Q1 warrants discussion. Based on our analysis, this reflects:
- Natural business lifecycle (underperforming stores closing)
- Seasonal adjustment post-holiday surge
- Increased competition among merchants leading to consolidation
- Not indicative of platform weakness (18% YoY growth in 2025 Q4)
Market consolidation is healthy. It means the ecosystem is maturing: stronger merchants survive, weaker ones drop off. The 18% year-over-year growth shows the platform is still strong underneath the short-term noise.
Seven-Year Growth Perspective
From 2019 Q1 to 2026 Q1:
- 278% total growth (753,977 → 2,846,464 stores)
- 2,092,487 net new stores added
- Compound annual growth rate (CAGR): Approximately 21%
This growth rate significantly outpaces overall ecommerce growth (projected 10-15% CAGR). Shopify isn't just riding the ecommerce wave; it's taking share from competitors.
Part 3: Financial Performance and Platform Economics
Shopify's Revenue Architecture
Understanding Shopify's financial model helps you see where the platform's incentives lie and whether it'll be around long-term.
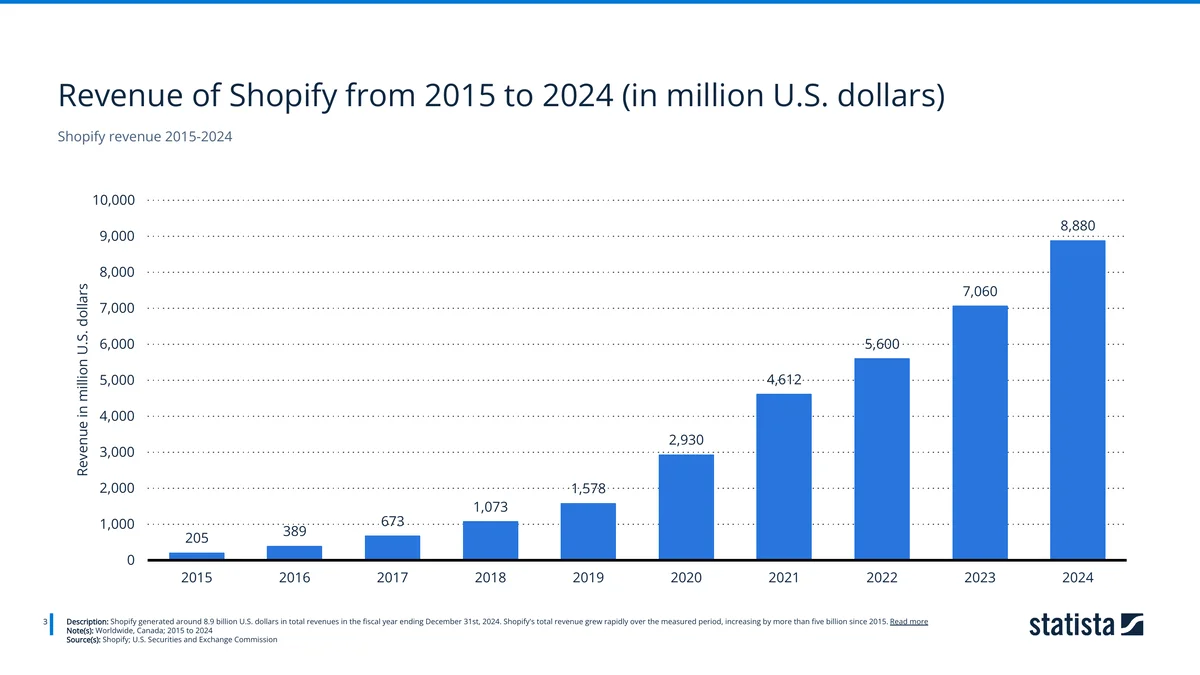
The chart above shows Shopify's 43x revenue growth over a decade — from $205 million in 2015 to $8.88 billion in FY 2024. This trajectory continued into 2025 with the $11.56B milestone.
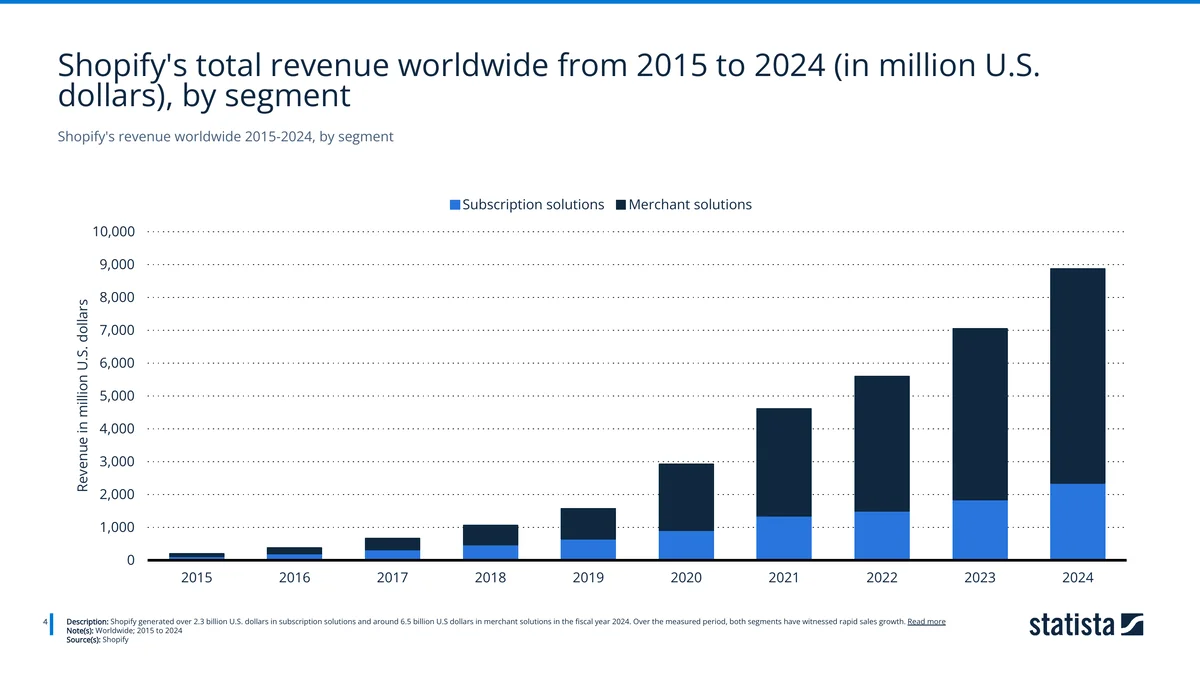
The segment split reveals a clear shift: Merchant Solutions (darker bars) now dominates, generating approximately $6.5 billion of the $8.88B FY 2024 total versus ~$2.3B from Subscription Solutions. This means Shopify increasingly earns when its merchants earn — their incentives are aligned with yours.
2025 Annual Report: A Breakout Year (FY Ended Dec 31, 2025)
Shopify's 2025 annual report (SEC 10-K filing) confirms a breakout year. The company crossed the $10 billion annual revenue milestone for the first time and posted its 10th consecutive quarter of double-digit free cash flow margins. Revenue kept shifting toward merchant-success-driven sources while the company invested heavily in AI and platform expansion.

Core Financial Performance (Consolidated)
| Metric | FY 2025 | YoY Growth | FY 2024 Comparison |
|---|---|---|---|
| Total Revenue | $11,556M | +30% | $8,880M |
| – Subscription Solutions | $2,752M | +17% | Stable recurring base |
| – Merchant Solutions | $8,804M | +35% | Fastest-growing segment |
| Gross Profit | $5,555M | +24% | 48% gross margin (vs 50% in 2024) |
| Operating Income | $1,468M | +36% | 13% operating margin |
| Net Income | $1,231M | -39% | Lower due to investment fair-value adjustments |
| Operating Cash Flow | $2,033M | +26% | — |
| Free Cash Flow | ~$2.0B+ | Strong | 17% FCF margin |
Q4 2025 alone generated revenue of $3,672M (+31% YoY), Shopify's first quarter ever above $3 billion. Record holiday shopping volumes drove the result.
What This Money Gets Spent On
Shopify's 30% revenue growth and $2B+ free cash flow give the company enormous resources to invest in tools that directly benefit merchants. Here's where the money is going:
- AI & product innovation: Sidekick AI assistant, Agentic Storefronts, machine-learning tools, and the March 2025 acquisition of Vantage Discovery (AI-powered search)
- Shopify Capital expansion: $258M in interest/fees revenue with $4.2B in merchant advances and loans purchased in 2025
- International & enterprise growth: localized features/pricing in more markets, enhanced Shopify Plus tiers
- Advertising tools: Shop Campaigns, Shopify Audiences, and new merchant acquisition channels
Bottom line: when Shopify is profitable and growing at 30%+, merchants get better tools, faster feature releases, and long-term stability. A financially healthy platform is a reliable one.
B2B Commerce: Shopify's Fastest-Growing Segment (New in 2026)

B2B is the breakout story of 2025-2026. The numbers are striking:
- B2B segment grew 96% year-over-year in FY 2025
- B2B GMV grew 101% YoY in Q2 2025 and 132% YoY in Q4 2024
- Merchants using Shopify B2B see up to a 4.1× increase in reorder frequency compared to DTC orders
- B2B ecommerce is projected to reach $36 trillion by 2026 (14.5% CAGR)
The biggest shift: In early 2026, Shopify opened B2B features to all plans — not just Plus. Basic, Grow, and Advanced merchants now get native B2B features including company profiles, up to three custom catalogs with tailored pricing, volume discounts, quantity rules, vaulted credit cards, and payment terms. Previously, these were locked behind the $2,000/month Plus tier.
Why this matters: 80% of B2B sales are expected to be generated digitally by end of 2025. By democratizing B2B tools, Shopify is positioning millions of merchants to capture wholesale and business-to-business revenue alongside their D2C operations. For merchants considering B2B, the barrier to entry just dropped from $2,000/month to $0.
Key Operating Metrics (FY 2025)
- Merchants: millions of unique paying shops across 175+ countries (44% US, 31% EMEA, 16% APAC/Australia/China, 5% Canada, 5% Latin America)
- Monthly Recurring Revenue (MRR): $205M at Dec 31, 2025 (+15% YoY; growth moderated by longer paid-trial periods)
- Shopify Payments penetration: 65.6% of GMV processed through Shopify Payments (North America 88%, APAC 89%, EMEA 83%)
- App ecosystem: 21,000+ apps in the Shopify App Store, up from 13,000+ previously reported
Balance Sheet Strength (Dec 31, 2025)
| Metric | Value | Significance |
|---|---|---|
| Cash & marketable securities | $5,778M | Up from $5,479M in 2024 |
| Total assets | $15,189M | 42% increase from 2023 ($10.67B) |
| Total debt | $0 | Fully repaid $1B convertible notes (Nov 2025) |
| Shareholders' equity | $13,473M | Up from $9.07B in 2023 |
What zero debt means for merchants: a debt-free Shopify with $5.8 billion in cash has no financial pressure to raise prices, cut features, or slow down platform investment. This is the strongest financial position in Shopify's history, and it directly reduces platform risk for every merchant.
Capital return program: alongside the 2025 earnings release, Shopify announced a $2 billion share repurchase program. Management doesn't buy back stock at that scale unless they believe the cash flow can support it.
Revenue Composition Analysis (2025 vs 2023)
| Segment | FY 2025 | % of Revenue | FY 2023 | % of Revenue | Growth |
|---|---|---|---|---|---|
| Merchant Solutions | $8,804M | 76.2% | $5,200M | 73.7% | +69% |
| Subscription Solutions | $2,752M | 23.8% | $1,800M | 26.3% | +53% |
| Total | $11,556M | 100% | $7,060M | 100% | +64% |
The shift toward Merchant Solutions is accelerating. In 2023, merchant-success-based revenue was 74% of total; by 2025, it hit 76%. In plain English: Shopify earns more when you sell more. Their incentives are increasingly aligned with yours.
Gross margin note: the slight dip (50% → 48%) is from faster growth in lower-margin Merchant Solutions, especially Payments processing. This isn't a problem. It means more merchants are using Shopify Payments, which improves checkout conversion while generating significant payment volume for the company.
The Merchant Value Equation (Updated for 2025)
For every $1 Shopify earns, merchants earn $32.74
This 33:1 ratio tells you that Shopify operates as a true platform. It captures a small percentage of the value it creates; merchants keep the rest. The ratio shifted from 40:1 in 2023 because Shopify Payments now processes more transactions directly (higher take rate on payment processing vs. subscription fees).
Calculation:
- Shopify 2025 Revenue: $11.56 billion
- Merchant GMV: $378.4 billion
- Shopify's effective take rate: ~3.1%
- Merchant retention: ~96.9%
Historical comparison:
- 2023: $7.06B revenue on $236B GMV → 3.0% take rate, 40:1 ratio
- 2024: $8.88B revenue on $292.3B GMV → 3.0% take rate, 33:1 ratio
- 2025: $11.56B revenue on $378.4B GMV → 3.1% take rate, 33:1 ratio
Gross Merchandise Volume (GMV): The True Size Indicator
2025 GMV: $378.4 billion (+29% YoY from $292.3 billion in 2024)
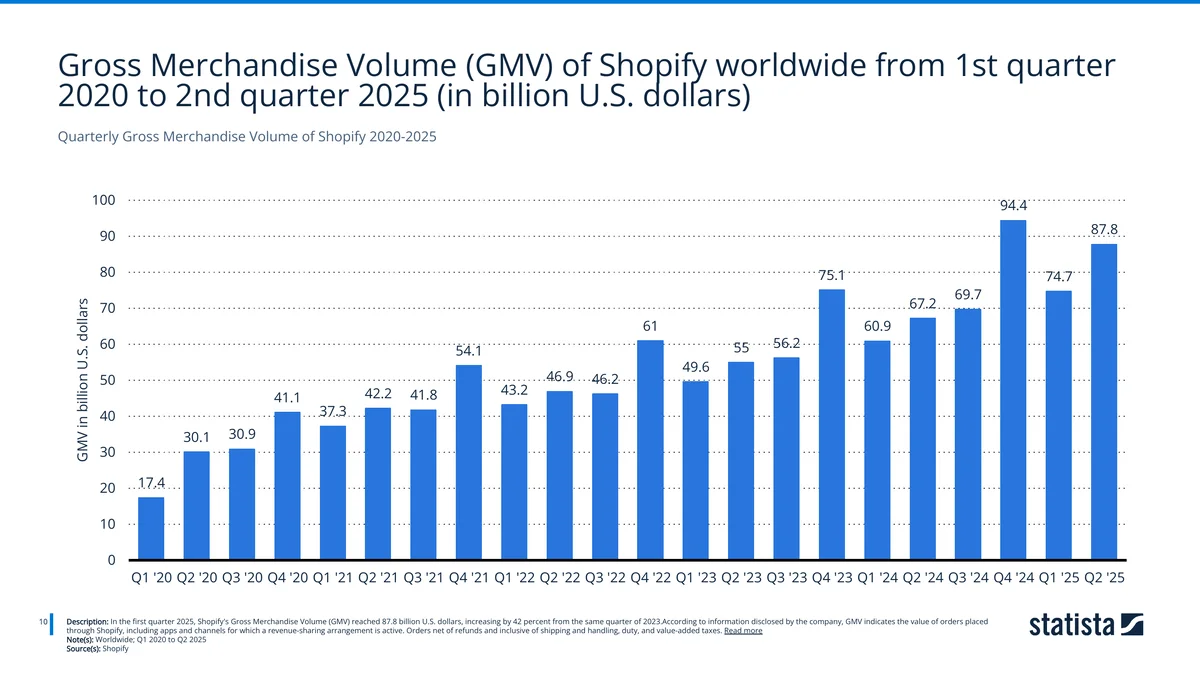
The quarterly GMV trend above shows consistent growth with a clear seasonal pattern — Q4 spikes due to holiday shopping. The most recent data shows $87.8B in Q1 2025 (up 42% from Q1 2024) and $94.4B in Q2 2025, reflecting continued momentum.
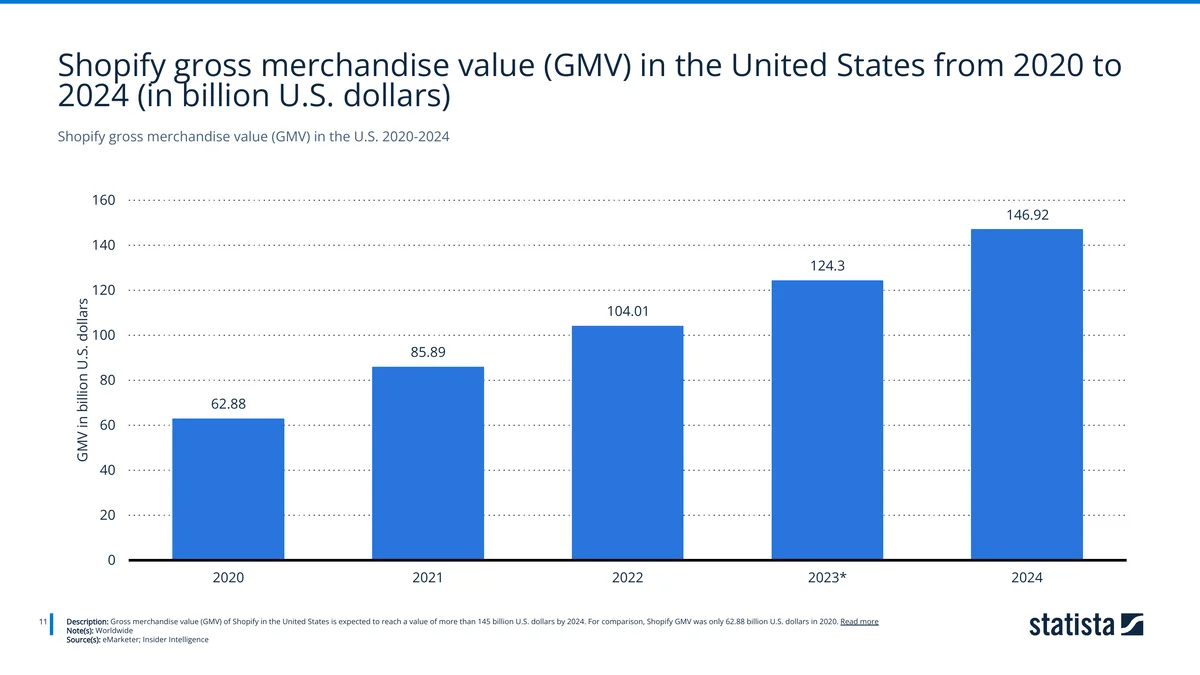
In the U.S. alone, Shopify's GMV grew from $62.88 billion in 2020 to $146.92 billion in 2024 — a 134% increase in just four years. This underscores Shopify's growing dominance in the American ecommerce landscape.
For context, 2023 GMV was $236 billion. That means Shopify's transaction volume grew 60% in just two years.
Shopify Payments now facilitates $248.1 billion of that GMV (+37% YoY), representing 65.6% payment penetration. This high penetration rate means most Shopify merchants trust and use Shopify's own payment infrastructure.
GMV is the total value of all transactions processed through Shopify stores. This metric matters more than raw store counts because it shows:
- Actual economic activity on the platform
- Merchant success and sustainability
- Platform reliability at scale
- Competitive positioning against Amazon, eBay, and others
GMV Growth Trajectory:
| Year | GMV | YoY Growth |
|---|---|---|
| 2022 | $197B | — |
| 2023 | $236B | +20% |
| 2024 | $292.3B | +24% |
| 2025 | $378.4B | +29% |
The growth rate is actually accelerating. GMV growth went from 20% to 29% over three years. At this scale, that's unusual. Most companies this size slow down.
Shopify as a "Retailer." When measured by total sales volume, Shopify ranks #2 in U.S. retail ecommerce with an estimated 11%+ market share:
- Amazon: 37.6%
- Shopify: 11.0%+
- Walmart: 6.4%
- Apple: 3.6%
- eBay: 3.0%
Think about that. Shopify isn't a retailer. It doesn't sell anything directly. Yet it moves more money than Walmart's entire ecommerce operation. With $378B in GMV, the gap between Shopify and the #3 player keeps growing.
Historical Financial Context (2023 Baseline)
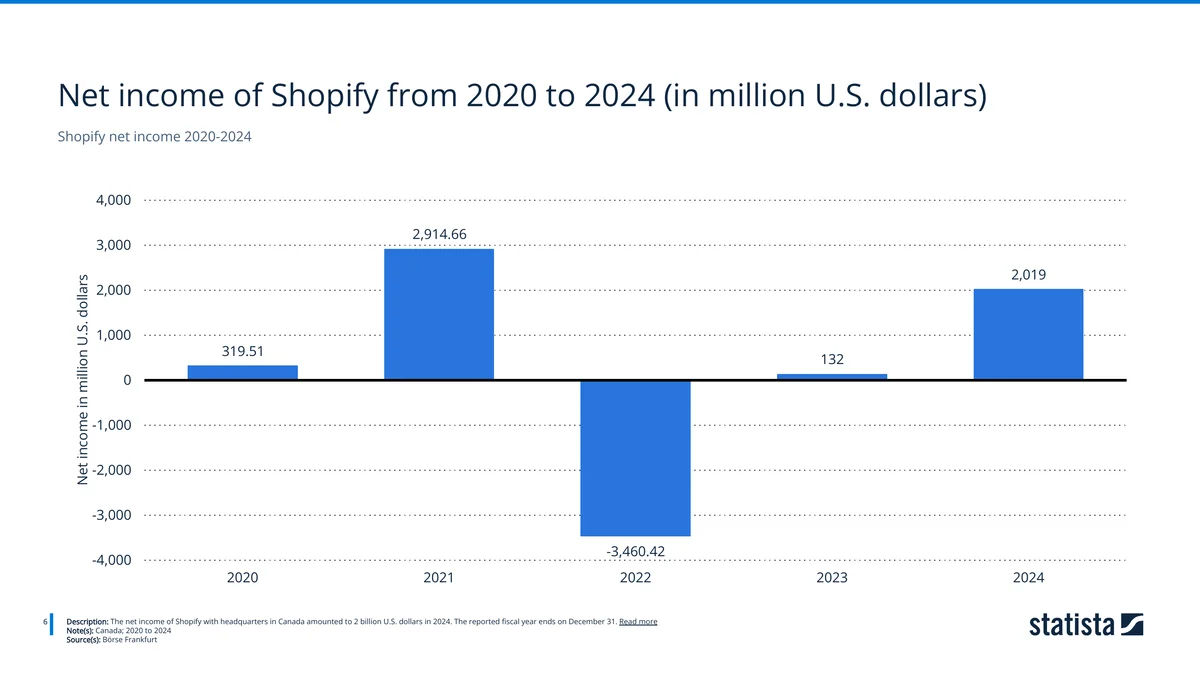
Shopify's net income tells the full story of the post-pandemic cycle: strong profitability in 2020-2021 ($319.51M and $2,914.66M), a massive $3.46B loss in 2022 driven by equity investment write-downs and the logistics business exit, followed by recovery to $132M in 2023 and a strong $2.02B profit in 2024.
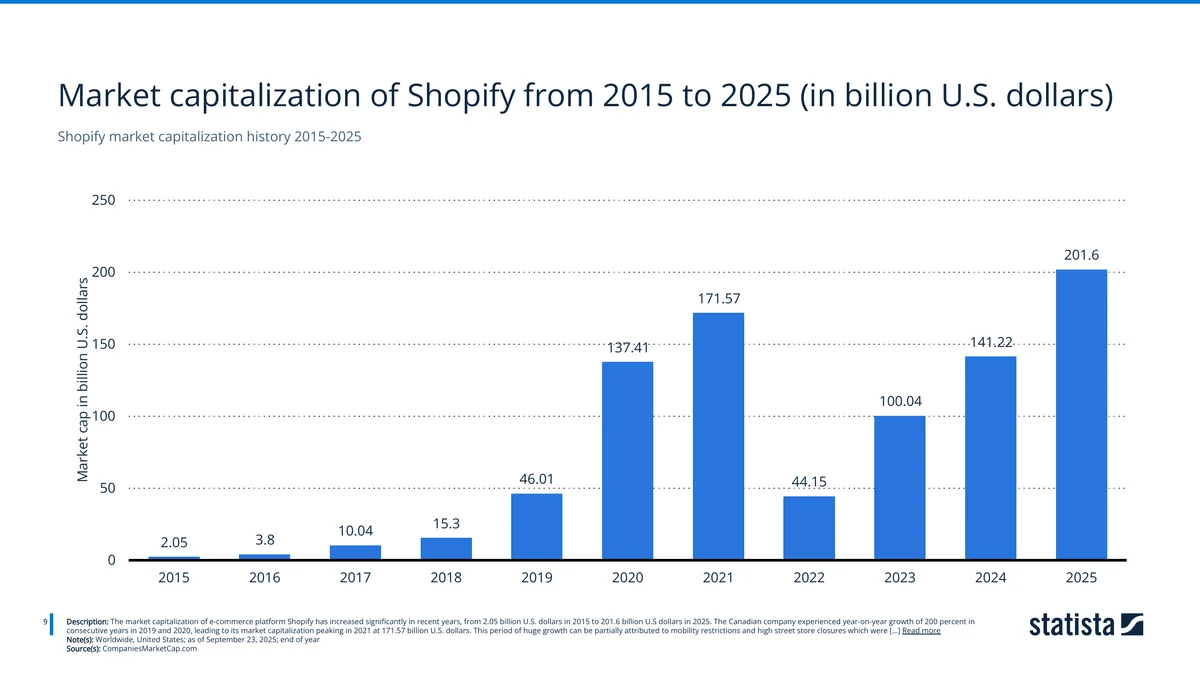
Shopify's market cap trajectory mirrors its revenue growth — from $2.05 billion in 2015 to $201.6 billion as of September 2025. The 2021 peak ($171.57B) was surpassed by 2025, marking a new all-time high that reflects restored investor confidence in Shopify's profitability and growth trajectory.
For readers wanting historical perspective, here's how Shopify's finances looked just two years ago:
Total Revenue (2023): $7.06 billion
- 26% increase from 2022 ($5.6 billion)
- Revenue composition: 74% Merchant Solutions ($5.2B) / 26% Subscription Solutions ($1.8B)
Key 2023 Metrics:
- Gross Profit: $3.515 billion (49.8% gross margin)
- Net Income: -$132 million (deliberate investment phase in AI, logistics, and B2B)
- Total Assets: $10.67 billion / Total Equity: $9.07 billion
- Employee Count: 8,300 (down from peak after strategic efficiency moves)
The two-year transformation is hard to overstate. Revenue grew 64% ($7.06B → $11.56B). The company swung from a $132M loss to $1.23B in profit. The balance sheet went from $9.07B to $13.47B in equity while eliminating all debt. Few tech companies have pulled off a turnaround this clean at this scale.
Additional Financial Context
Market Capitalization (April 2026): $155.65 billion
- Up 62% from $96.35B in 2024, reflecting strong earnings momentum
- Makes Shopify the world's 116th most valuable company
- Stock trading at ~$118.80/share (April 2026), with analyst consensus target of $129.65
Seasonality: Q4 remains Shopify's strongest quarter due to holiday shopping. Q4 2025 revenue of $3.67B was 32% of full-year revenue. Plan your inventory, marketing, and cash flow accordingly.
Q1 2026 Outlook (Earnings Expected April 30, 2026): Shopify has guided for continued revenue growth in the low 30% range year-over-year for Q1 2026. If realized, this would put Q1 2026 revenue at approximately $3.3-3.4 billion (vs. $2.55B in Q1 2025). Analysts expect EPS of approximately $0.26-0.28 for Q1 2026. The company's 10 consecutive quarters of double-digit free cash flow margins and the $2 billion share repurchase program signal management confidence in sustaining this trajectory.
Part 4: Merchant Performance Benchmarks
Performance benchmarks are one of the most useful parts of this research. Knowing where your store ranks helps you spot what to fix first.
Average Order Value (AOV) Distribution
AOV significantly impacts profitability. Our analysis of millions of transactions reveals these benchmarks:
Overall Platform Performance
Average AOV: $87
- Median across all Shopify stores
- Includes all categories and business models
- Use as baseline comparison
Performance Tiers
| Percentile | AOV Threshold | What This Means |
|---|---|---|
| Top 10% | $315+ | Elite performers—premium products or high-value items |
| Top 20% | $191+ | Strong performers—above-average pricing/bundling |
| Above Average | $87-$191 | Healthy stores with room for optimization |
| Below Average | $50-$87 | Typical challenges—commodity products or pricing pressure |
| Bottom 20% | <$50 | Critical issues—likely low-margin or struggling stores |
Actionable Insights:
If your AOV is below $87:
- Consider product bundling strategies
- Implement "frequently bought together" recommendations
- Review pricing relative to competitors
- Add complementary products to increase basket size
- Test free shipping thresholds above current AOV
If your AOV is $87-$191:
- You're in the healthy range but have upside potential
- Test upselling and cross-selling tactics
- Introduce tiered product offerings (good/better/best)
- Optimize checkout page for add-ons
If your AOV is $191+:
- You're in the top 20%. Focus on scaling traffic
- Maintain high-touch customer service
- Protect premium positioning
- Consider loyalty programs to increase lifetime value
Conversion Rate Analysis: Shopify's Competitive Advantage
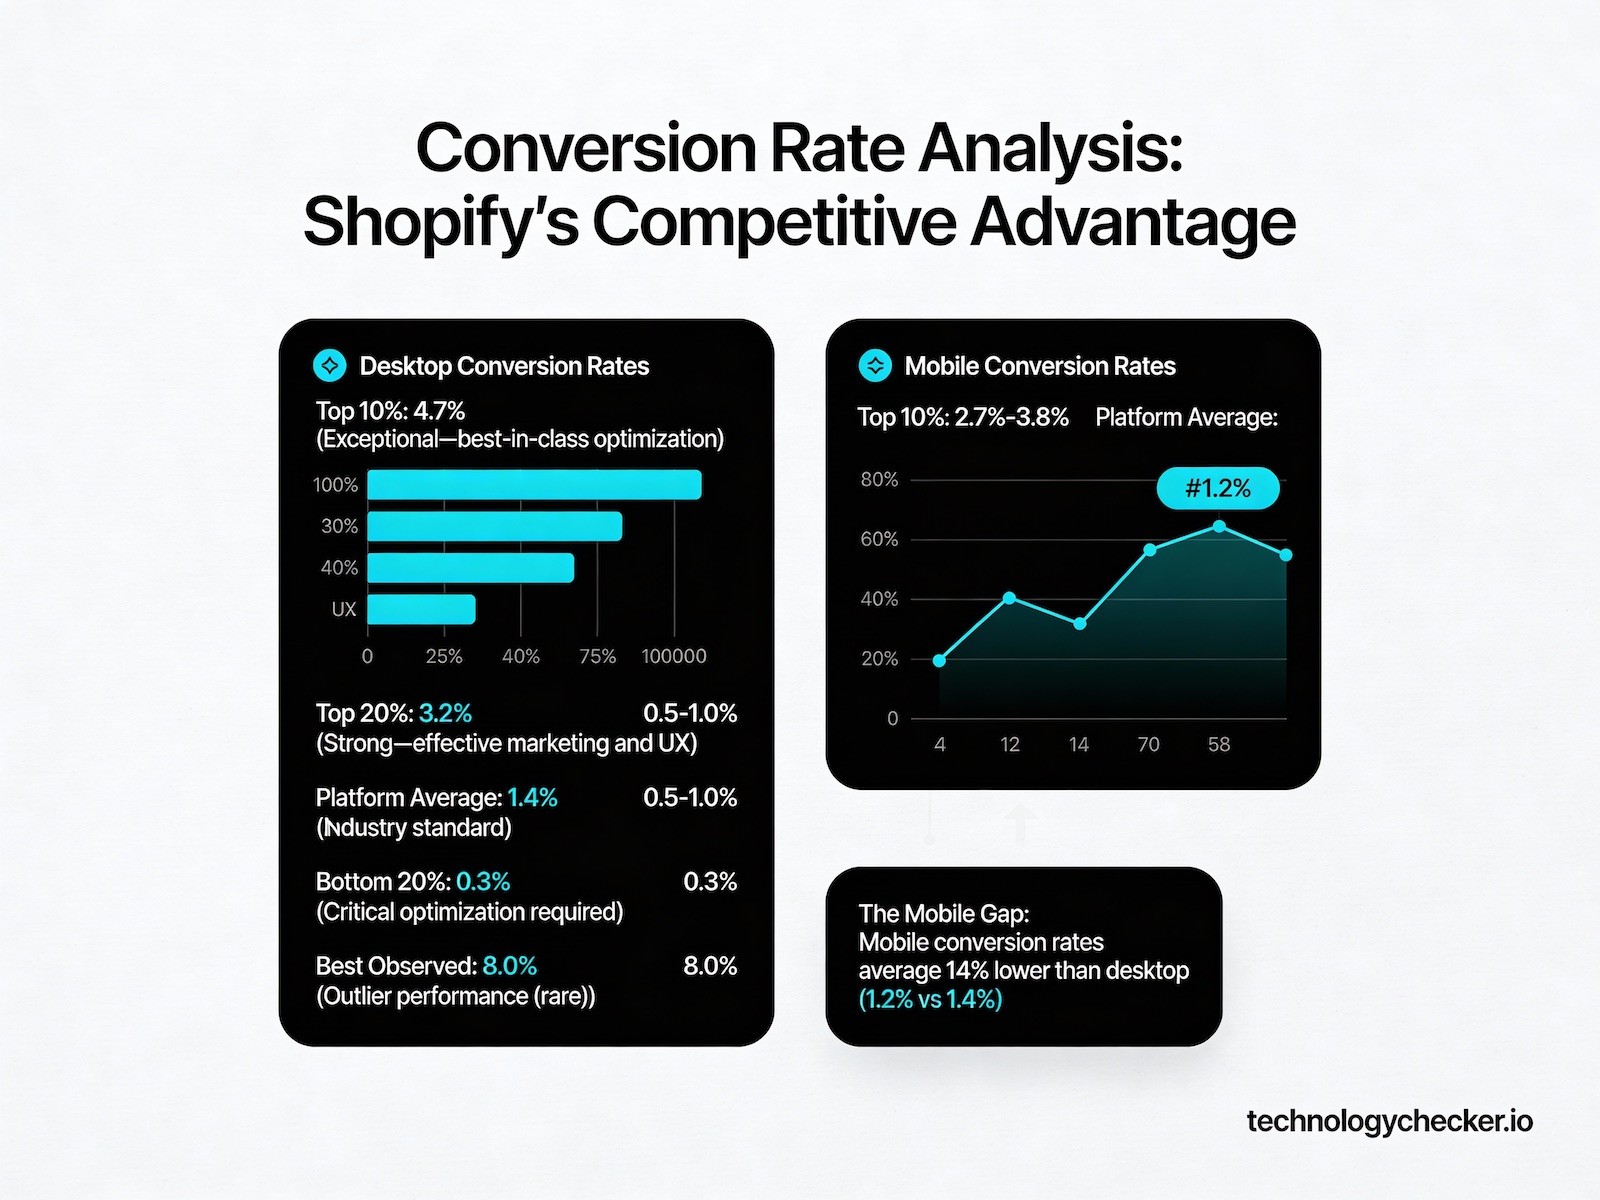
This is where Shopify truly outperforms competitors. Our research confirms that Shopify's overall conversion rate outpaces competition by up to 36% and averages 15% better than alternative platforms.
Desktop Conversion Rates (Updated 2026 Benchmarks)
| Percentile | Conversion Rate | Performance Analysis |
|---|---|---|
| Top 10% | 4.5%+ | Exceptional—best-in-class optimization |
| Top 20% | 3.2%+ | Strong—effective marketing and UX |
| Platform Average | 1.4% | Industry standard |
| Below Average | 0.5-1.0% | Needs improvement |
| Bottom 20% | 0.3% | Critical optimization required |
| Best Observed | 8.0% | Outlier performance (rare) |
2026 trend note: These numbers have shifted slightly upward from 2024-2025, driven largely by improvements in mobile checkout (Shop Pay adoption at 200M+ users), faster themes, and better social proof integration. Merchants using Shop Pay see conversion rates 50% higher than guest checkout.
Mobile Conversion Rates
With 79% of Shopify traffic coming from mobile devices, mobile optimization is non-negotiable:
| Percentile | Mobile Conversion Rate |
|---|---|
| Top 10% | 2.7%-3.8% |
| Platform Average | 1.2% |
The Mobile Gap: Mobile conversion rates average 14% lower than desktop (1.2% vs 1.4%), presenting a significant optimization opportunity for merchants who can close this gap.
Checkout Completion Rates
| Device | Completion Rate | Abandonment Rate |
|---|---|---|
| Desktop | 47.5% | 52.5% |
| Mobile | 46.3% | 53.7% |
More than half of customers who reach checkout abandon their carts. That's a massive revenue leak. Each 1% improvement in checkout completion directly increases revenue by 2%+ when you account for traffic that was already qualified enough to start checkout.
Proven Checkout Optimization Tactics:
- Implement Shop Pay (60% YoY sales increase during BFCM 2023)
- Remove surprise shipping costs (include calculator early)
- Offer multiple payment methods
- Enable guest checkout
- Display trust badges and security indicators
- Minimize form fields
- Provide clear error messages
- Show progress indicators for multi-step checkouts
Traffic Source Conversion Performance
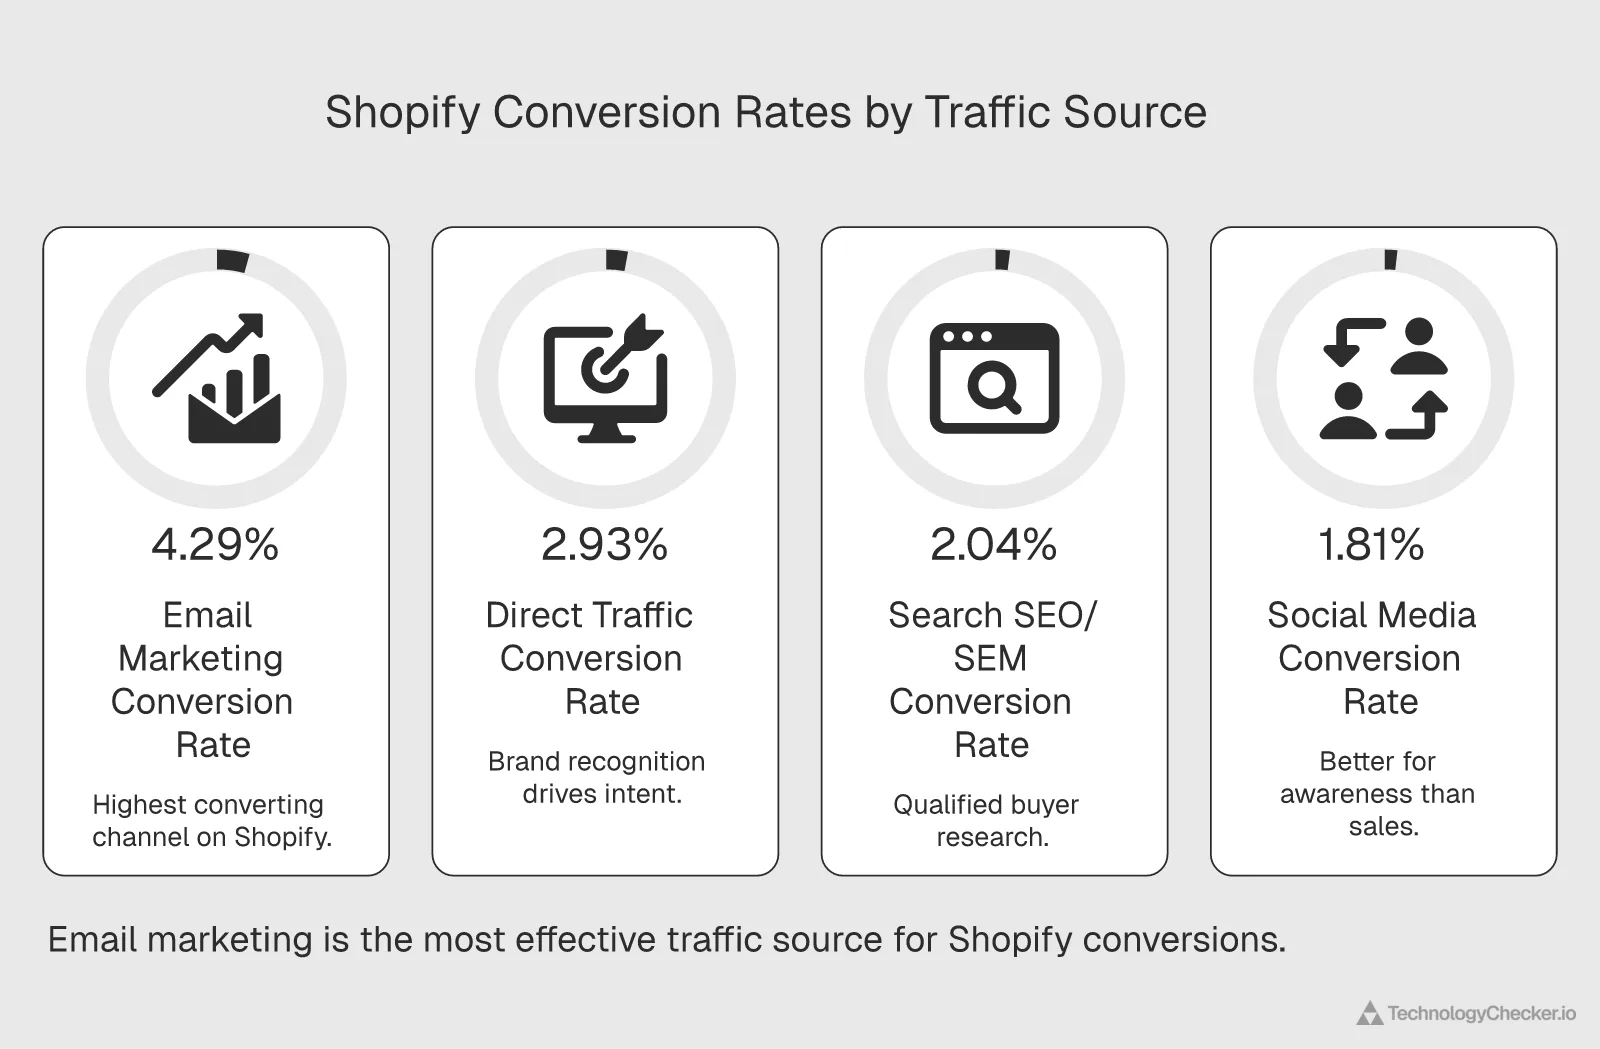
Understanding which channels convert best helps allocate marketing budget effectively:
| Traffic Source | Conversion Rate | Ranking |
|---|---|---|
| Email Marketing | 4.29% | #1 |
| Direct Traffic | 2.93% | #2 |
| Search (SEO/SEM) | 2.04% | #3 |
| Social Media | 1.81% | #4 |
Email remains king. Despite constant predictions of email's demise, it converts 2.4× better than social media. Merchants should:
- Build email lists aggressively
- Segment audiences for personalization
- Invest in email marketing platforms (Klaviyo leads with 13.8% Shopify adoption) — see our marketing automation platform adoption data for a full market share breakdown
- Implement abandoned cart email sequences
- Create post-purchase nurture campaigns
Social media's conversion problem. Social platforms drive awareness and traffic (Instagram: 47.3% adoption, Facebook: 28.2%), but they convert 1.8× worse than email. This suggests:
- Social is better for brand building than direct sales
- Retargeting social traffic via email is critical
- User-generated content and influencer partnerships work for awareness
- Social commerce features (Instagram Shopping, Facebook Shops) may improve future performance
Direct traffic converts well. The 2.93% rate tells us:
- Brand recognition drives higher-intent visitors
- Repeat customers (likely direct traffic) convert better
- Offline marketing (packaging, stores, word-of-mouth) remains valuable
Search at 2.04%. This means:
- SEO and paid search attract qualified buyers
- Product research often happens via search
- Long-tail keyword targeting likely converts better than generic terms
Customer Behavior Patterns
Repeat Customer Rate: 50%+
Over half of Shopify stores achieve repeat purchases. That tells you:
- Product quality is meeting expectations
- Customer service is working
- Email marketing and retargeting are paying off
- LTV exceeds CAC for the sustainable businesses on the platform
Shopping Behavior:
- Average session duration: 3+ minutes
- Average stores visited: 3+ stores per session
- Shoppers are comparison shopping, which means competitive pricing, clear value propositions, and strong product presentation all matter
Part 5: Product Categories and Market Segmentation
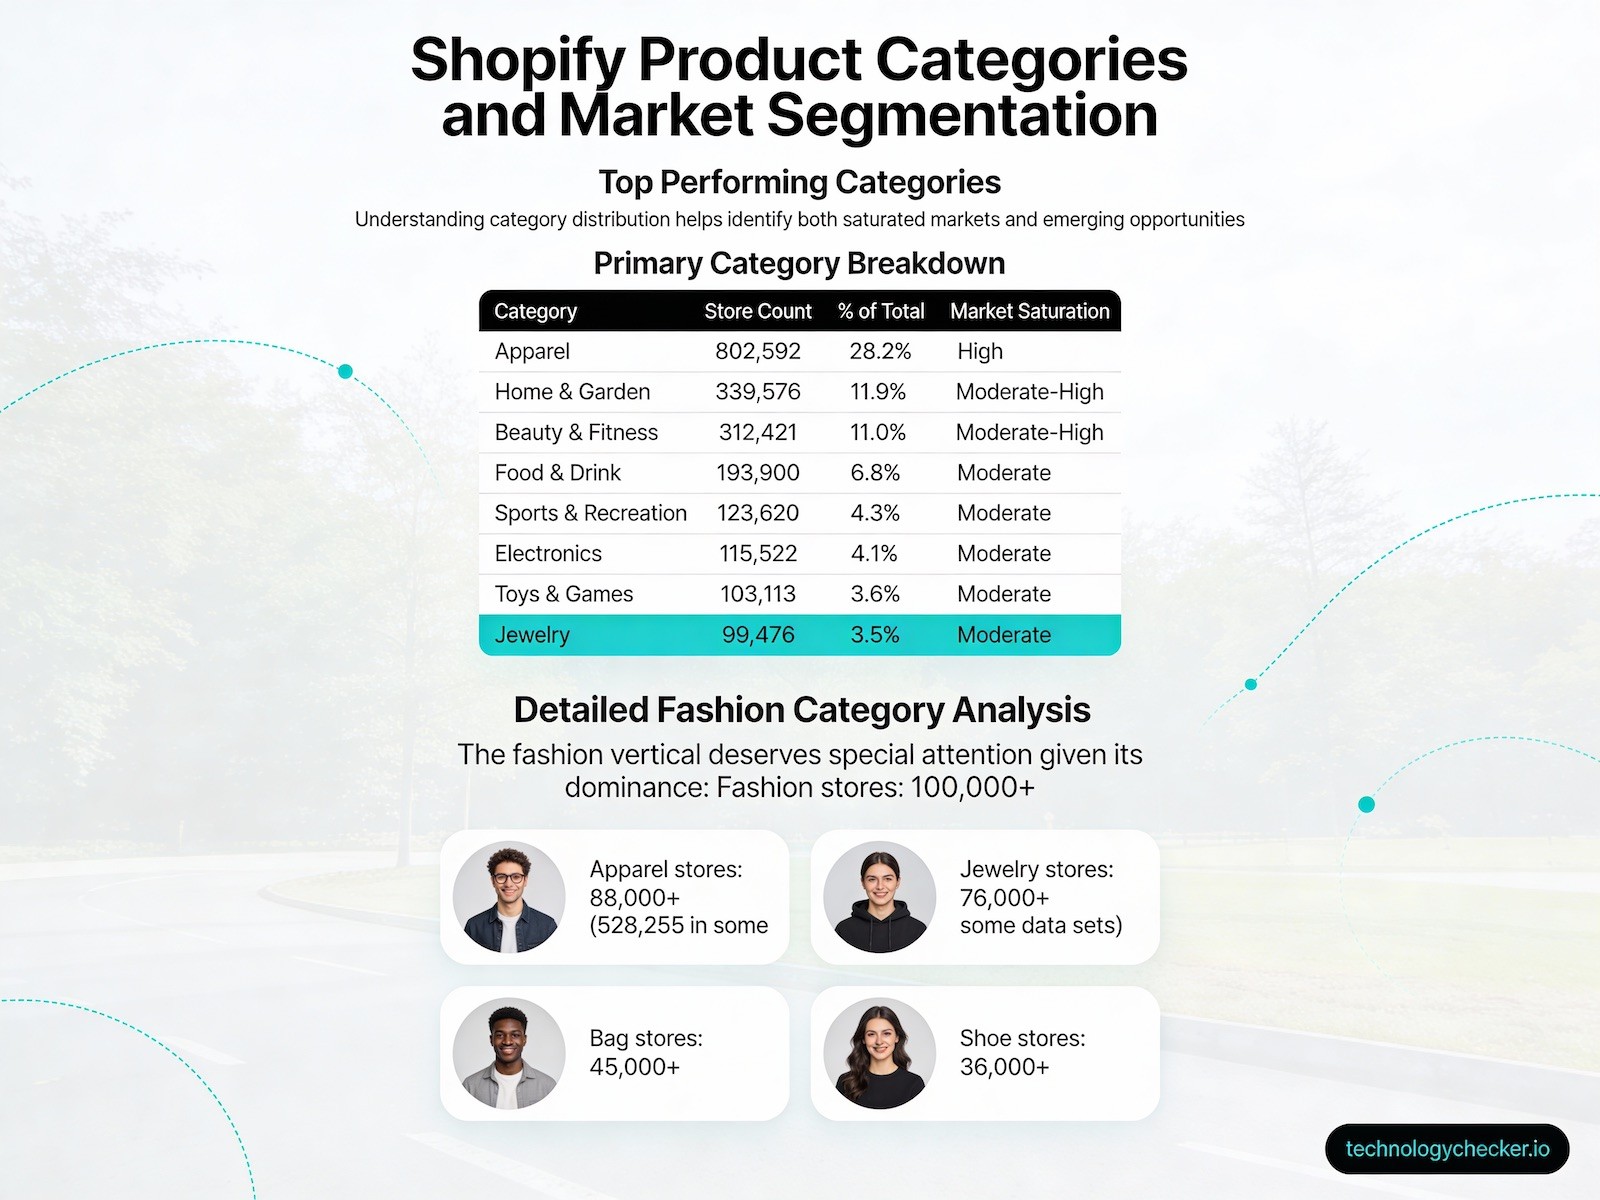
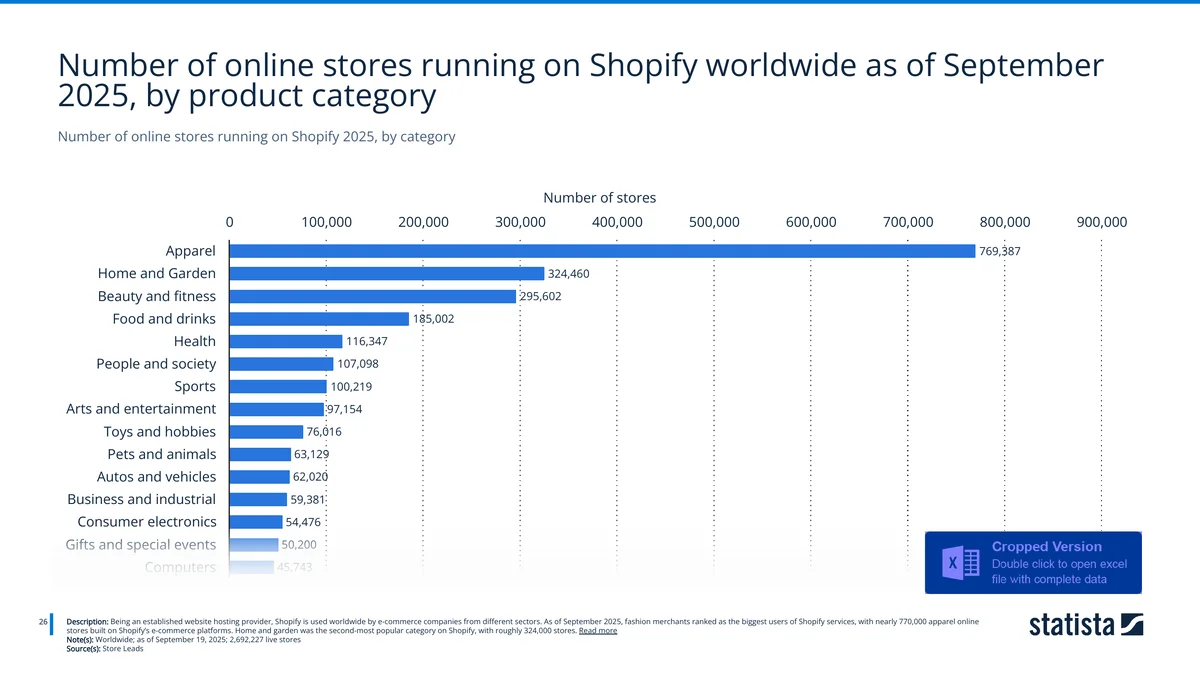
Top Performing Categories
Understanding category distribution helps identify both saturated markets and emerging opportunities. According to Statista / Store Leads data (September 2025, 2,692,227 live stores tracked), the category breakdown is:
Primary Category Breakdown
| Category | Store Count | % of Total | Market Saturation |
|---|---|---|---|
| Apparel | 769,387 | 28.6% | High |
| Home & Garden | 324,460 | 12.1% | Moderate-High |
| Beauty & Fitness | 295,602 | 11.0% | Moderate-High |
| Food & Drink | 185,002 | 6.9% | Moderate |
| Health | 116,347 | 4.3% | Moderate |
| People & Society | 107,098 | 4.0% | Moderate |
| Sports | 100,219 | 3.7% | Moderate |
| Arts & Entertainment | 97,154 | 3.6% | Moderate |
| Toys & Hobbies | 76,016 | 2.8% | Moderate |
| Pets & Animals | 63,129 | 2.3% | Low-Moderate |
Detailed Fashion Category Analysis
The fashion vertical deserves special attention given its dominance:
- Fashion stores: 100,000+
- Apparel stores: 88,000+ (528,255 in some data sets)
- Jewelry stores: 76,000+
- Bag stores: 45,000+
- Shoe stores: 36,000+
Why Fashion Dominates:
- High profit margins support advertising costs
- Visual products excel on social platforms
- Fast fashion and trending styles create repeat purchases
- Dropshipping and print-on-demand reduce barriers to entry
- Instagram's visual nature (47.3% adoption) aligns perfectly
Strategic Consideration for New Merchants: While fashion offers huge markets, the 28.2% saturation means intense competition. Success requires:
- Strong brand differentiation
- Unique designs or positioning
- Superior customer experience
- Effective social media presence
- Influencer partnerships
- High-quality photography
Category-Specific Insights
Home & Garden (11.9%):
- Pandemic drove sustained growth in home improvement
- Higher AOV potential (furniture, décor sets)
- Seasonal patterns (spring/summer peaks)
- Growing sub-niches: sustainable products, smart home integration
Beauty & Fitness (11.0%):
- Subscription box models work well
- Influencer marketing highly effective
- Consumable products = high repeat purchase rate
- Premium positioning opportunities (organic, clean beauty)
Food & Drink (6.8%):
- Regulatory complexity (food safety, labeling)
- Perishable shipping challenges
- Subscription models common (coffee, meal kits)
- Local/artisanal positioning opportunities
Emerging Opportunities: Under-Represented Categories
Categories with <5% market share may offer less competition:
- Pets & Animals: Growing as pet ownership increases
- Books & Entertainment: Niche communities with high engagement
- Business & Industrial: B2B opportunities with higher AOV
- Crafts & Party Supplies: Project-based purchasing patterns
Part 6: The Shopify App Ecosystem
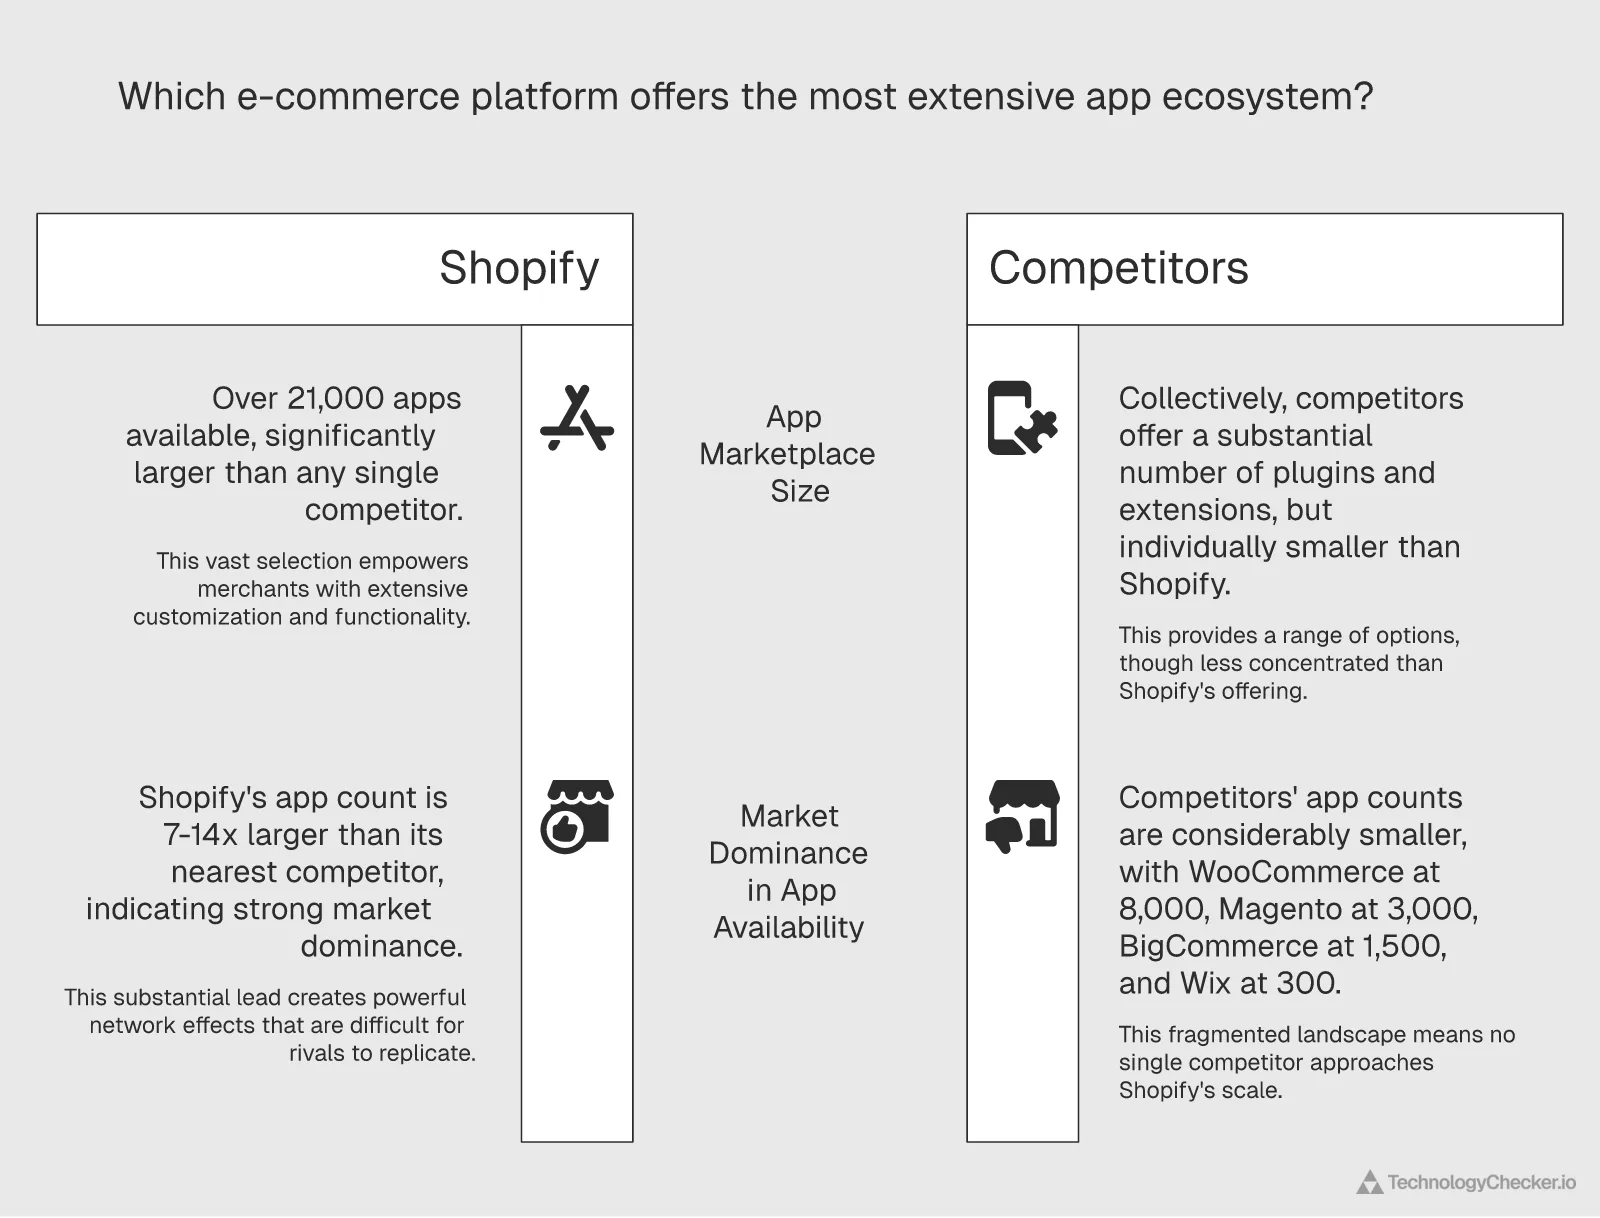
Shopify's app ecosystem is arguably its strongest competitive advantage. Here's why the moat is so deep.
App Marketplace Overview
By The Numbers:
- 21,000+ apps available in the Shopify App Store (per Shopify's 2025 annual report; we track 17,981 apps from 11,217 vendors through our detection systems)
- 87% of merchants depend on apps to run their businesses
- 80%+ of retailers use third-party apps
- 11,350,799 tracked installs across 5,531 detectable apps
- We estimate we can only detect ~30-40% of total installations since many apps don't leave detectable signatures
Competitive Comparison:
- WooCommerce: ~8,000 plugins (but many low-quality)
- BigCommerce: ~1,500 apps
- Wix: ~300 apps
- Magento: ~3,000 extensions
Shopify's ecosystem is 7-14× larger than the nearest competitor, creating powerful network effects that are nearly impossible for competitors to replicate.
Most Popular Apps by Installation
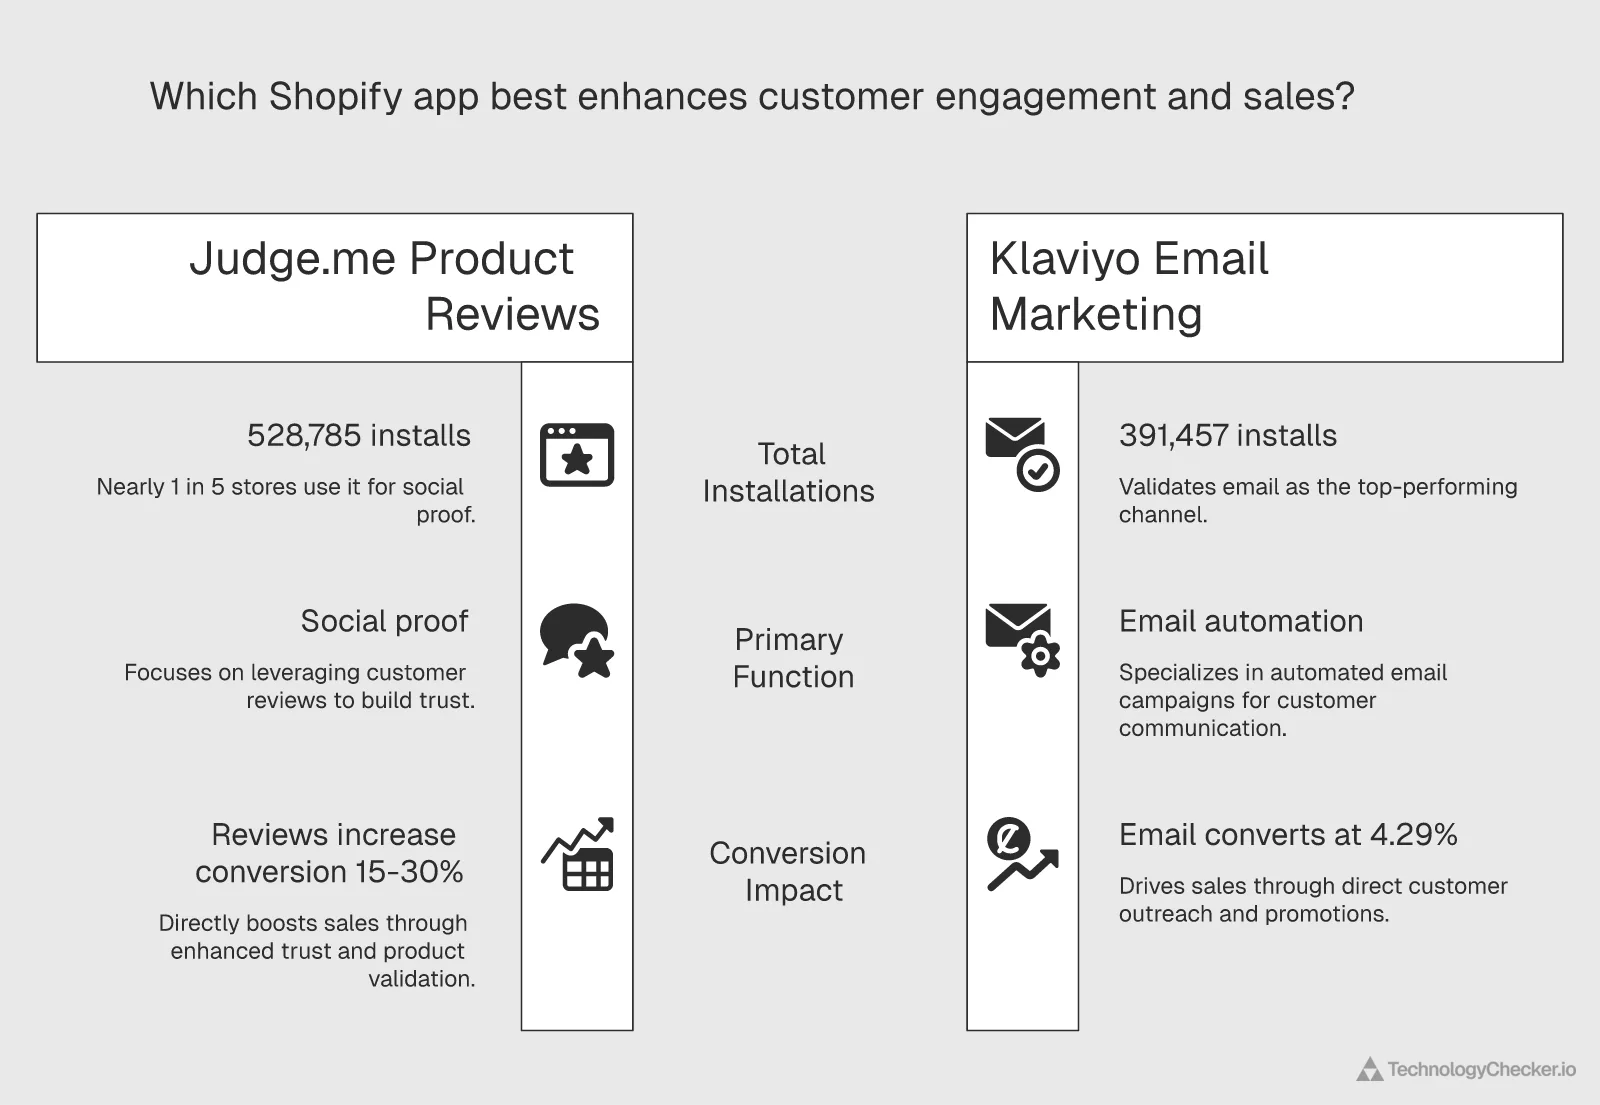
| Rank | App Name | Installs | Adoption Rate | Primary Function |
|---|---|---|---|---|
| 1 | Judge.me Product Reviews | 528,785 | 18.6% | Social proof/reviews |
| 2 | Klaviyo: Email Marketing & SMS | 391,457 | 13.8% | Email automation |
| 3 | Shopify Inbox | 388,588 | 13.7% | Customer messaging |
Insights from Top Apps:
1. Judge.me Product Reviews (18.6% adoption):
- Social proof is critical. Nearly 1 in 5 stores prioritize reviews
- Reviews increase conversion rates by 15-30%
- Free tier available (explains high adoption)
- Shows how much user-generated content matters
2. Klaviyo Email Marketing (13.8% adoption):
- Validates email as top-performing channel (4.29% conversion rate)
- Advanced segmentation and automation drive adoption
- Higher-priced app, so merchants must be seeing ROI
- According to companies using Klaviyo we analyzed, it's industry-leading among Shopify merchants for sophisticated email
3. Shopify Inbox (13.7% adoption):
- First-party Shopify app (free)
- Live chat drives conversion improvements
- Mobile messaging support
- Integration with Shop Pay and other Shopify features
App Category Breakdown
Understanding which app types are most popular reveals merchant priorities:
| Category | Number of Apps | Top Use Cases |
|---|---|---|
| Store Design | ~2,000+ | Themes, page builders, customization |
| Conversion Optimization | ~1,500+ | Upsells, countdown timers, exit-intent |
| Marketing | ~2,500+ | Email, SMS, social media, SEO |
| Fulfillment | 1,026 | Shipping, inventory, dropshipping |
| Customer Service | ~800+ | Help desks, chat, returns |
| Analytics | ~600+ | Tracking, reporting, attribution |
Specialized App Niches
For merchants in specific business models, relevant apps include:
Print on Demand:
- Major providers: Printful, Printify, CustomCat
- See full analysis: Top Print on Demand Apps on Shopify
Dropshipping:
- Major providers: Oberlo (discontinued), DSers, Spocket
- See full analysis: Top Dropshipping Apps on Shopify
App Investment by Store Size
Our analysis shows app spending scales with revenue:
| Store Size | Monthly App Spend | Typical Apps Installed |
|---|---|---|
| Small (<$10K/month) | $0-$50 | 3-5 free/basic apps |
| Medium ($10K-$100K) | $100-$500 | 8-12 paid apps |
| Large ($100K-$1M) | $500-$2,000 | 15-25 apps |
| Enterprise ($1M+) | $2,000-$10,000+ | 20-40+ enterprise apps |
Strategic Guidance on App Selection:
Start minimal: New merchants should begin with 3-5 essential apps:
- Email marketing (Klaviyo, Omnisend)
- Reviews (Judge.me, Loox)
- Analytics beyond Shopify's built-in
- SEO optimization
- Live chat/customer service
Scale deliberately: Add apps only when:
- Clear ROI can be measured
- Specific pain point needs solving
- Native Shopify features insufficient
- App integrates well with existing stack
Avoid "app bloat": Each app adds:
- Monthly costs
- Site speed impact (potential conversion decrease)
- Complexity in workflows
- Data silos and integration challenges
- Security and compliance considerations
Part 7: Technology Stack and Third-Party Integrations
Beyond the app store, Shopify merchants use a wide range of third-party technologies. Our tracking data reveals some clear patterns.
Core Infrastructure Technologies
We're monitoring 868 different technologies with 24,035,706 collective installs across Shopify stores.
Top 10 Technologies
| Technology | Installations | Adoption Rate | Purpose |
|---|---|---|---|
| Cloudflare | 2,826,045 | 99.3% | CDN, security, DDoS protection |
| Cloudflare CDN | 2,814,446 | 98.9% | Content delivery |
| Arrive | 2,658,160 | 93.4% | Shipping/tracking |
| 1,679,324 | 59.0% | Social commerce, ads | |
| Google Analytics | 1,553,570 | 54.6% | Web analytics |
| YouTube | 1,516,963 | 53.3% | Video content |
| TikTok | 1,494,685 | 52.5% | Social commerce |
| 1,014,021 | 35.6% | Social commerce |
What stands out:
Cloudflare at 99.3% likely means Shopify routes traffic through Cloudflare infrastructure by default. Security, performance, and DDoS protection are table stakes for ecommerce.
Arrive shipping tracking at 93.4% shows post-purchase experience matters. Proactive shipping updates reduce support tickets and the endless "where's my order?" inquiries.
Social platform integration (Facebook 59%, TikTok 52.5%) confirms multi-platform presence is now standard. Facebook Pixel is nearly universal for retargeting. TikTok's 52.5% is unusually high for a newer platform.
Shop Pay: Shopify's Checkout Innovation
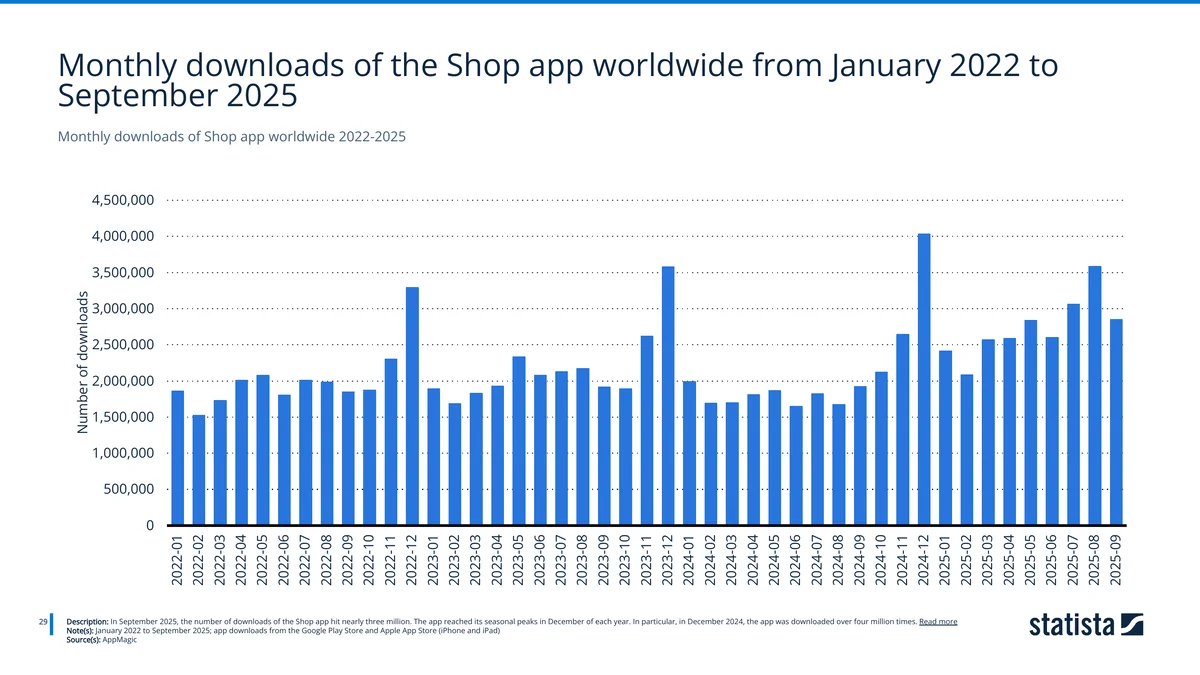
The Shop app has seen consistently growing monthly downloads, with seasonal spikes reaching over 4 million downloads in December 2024 (holiday shopping peak). By September 2025, monthly downloads approached 3 million, reflecting sustained consumer adoption of Shopify's consumer-facing ecosystem.
Adoption Metrics (Updated 2026):
- 200 million+ Shop Pay users globally by end of 2024 — up from ~150M in early 2024
- 1 in 4 Shopify shoppers now has a Shop Pay account
- ~2 million websites globally use Shop Pay
- 1 million+ U.S. websites implemented
- 100,000+ U.K. websites active
- 30,000 Shopify Plus stores utilize it
Performance Impact:
- 50% higher conversion compared to guest checkout — merchants using Shop Pay see dramatically better checkout completion
- 32% of all BFCM 2025 orders processed through Shop Pay (up 39% YoY)
- 5-10% reduction in checkout abandonment on average
- Up to 70% checkout conversion achieved by top performers (e.g., Everlane saw 15% Shop Pay adoption within 30 days)
- Cross-store recognition (shop anywhere with saved credentials)
Shop Pay is Shopify's answer to Amazon's one-click checkout and PayPal's convenience. The network effect grows as more stores adopt it: with 200M+ users, the odds that any given visitor already has Shop Pay credentials are now substantial.
Our recommendation: enable Shop Pay if you haven't already. The 50% conversion lift and 32% BFCM order share speak for themselves, and there's no downside since customers can still use other payment methods.
Part 8: Social Media, Marketing Channels, and Communication
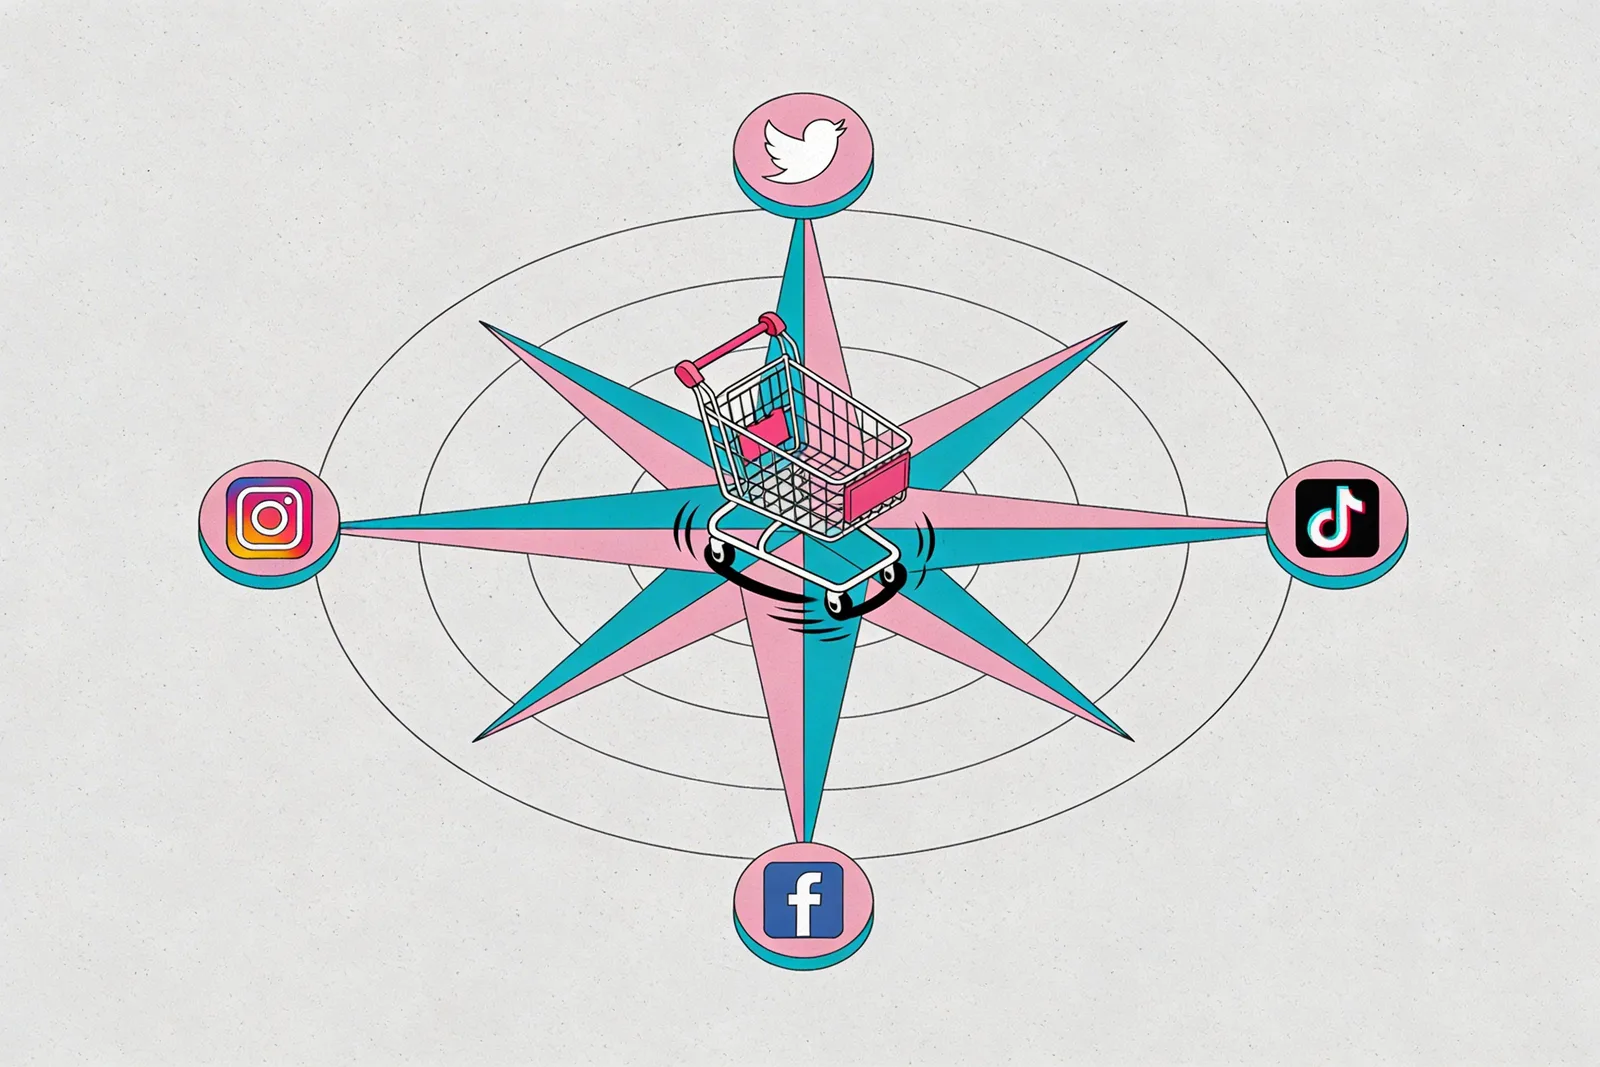
Social Platform Adoption Patterns
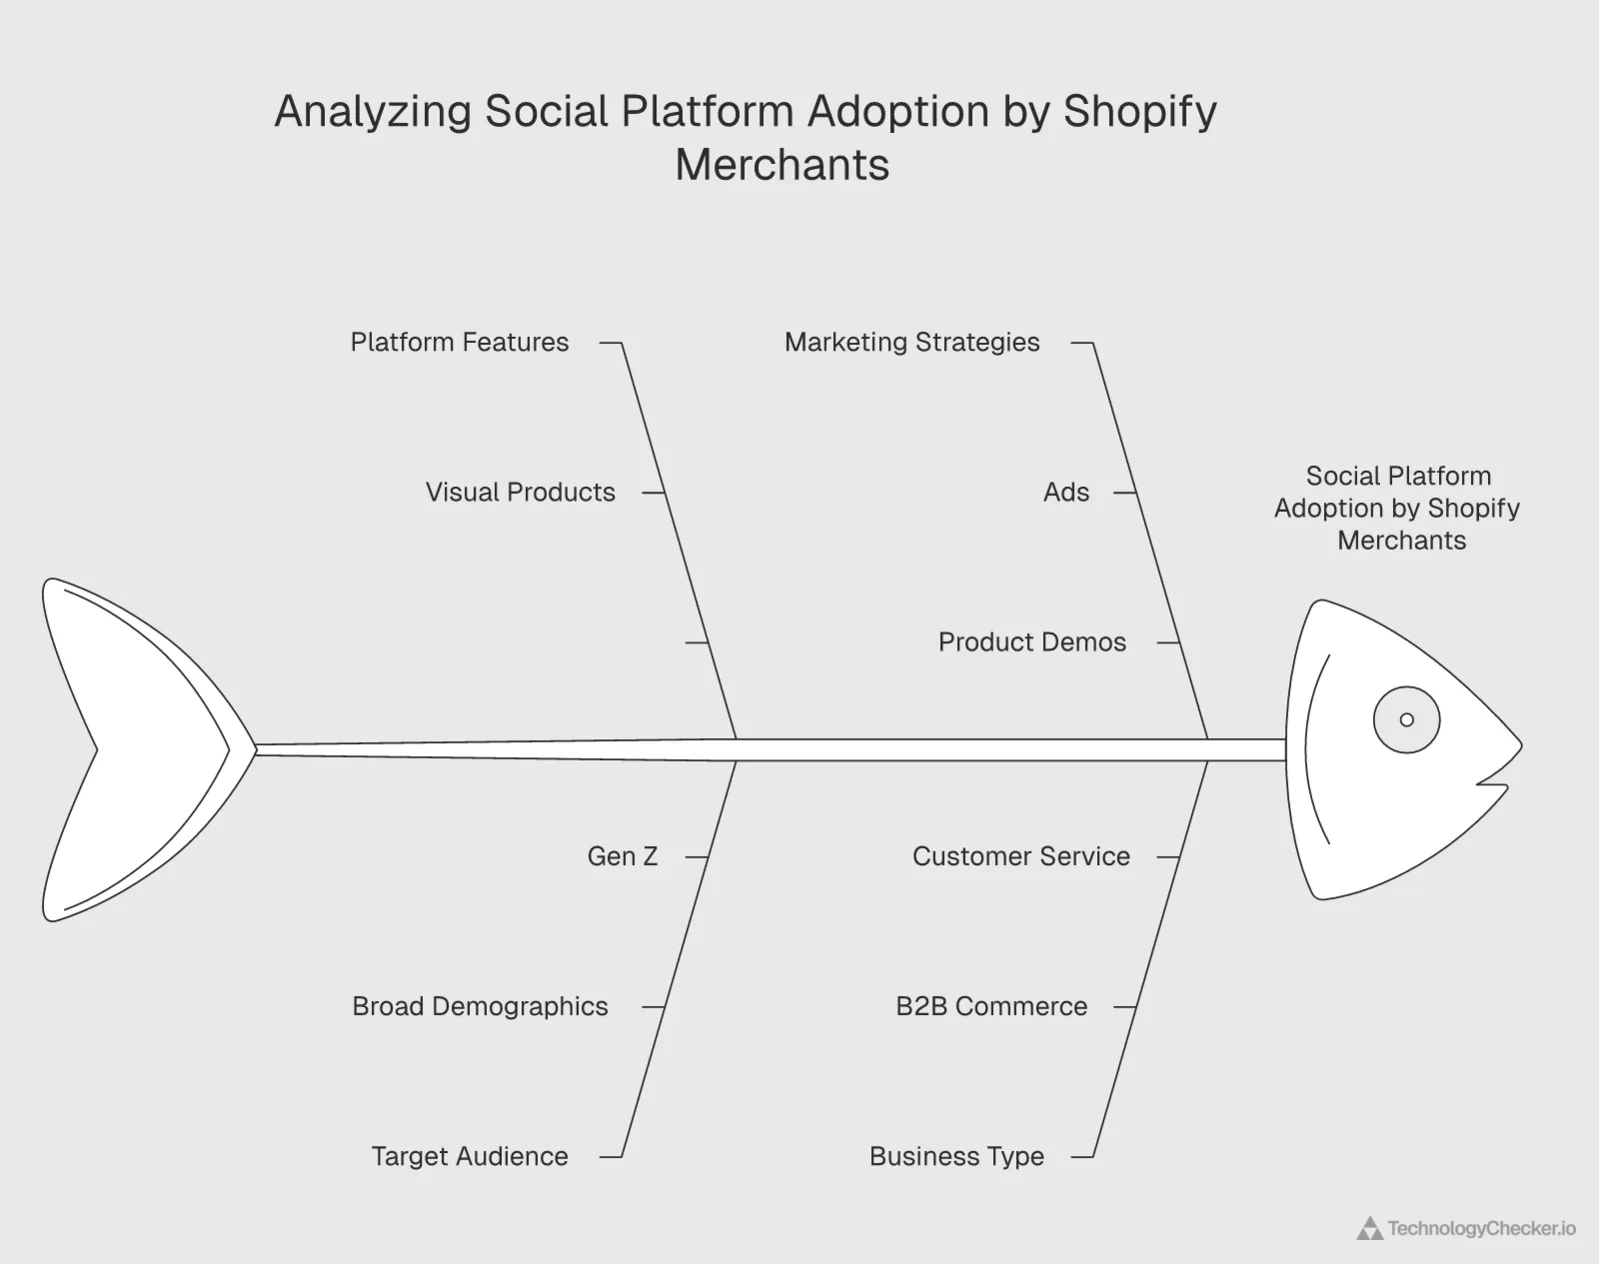
Our analysis reveals which social platforms Shopify merchants prioritize for commerce:
Primary Social Channels
| Platform | Stores Using | Adoption Rate | Best Use Cases |
|---|---|---|---|
| 1,347,140 | 47.3% | Visual products, lifestyle brands | |
| 801,865 | 28.2% | Broad demographics, Facebook Shops | |
| TikTok | 348,957 | 12.3% | Viral marketing, Gen Z audience |
| YouTube | 332,777 | 11.7% | Product demos, unboxing, tutorials |
| 211,706 | 7.4% | Home décor, fashion, DIY | |
| 200,022 | 7.0% | Customer service, real-time engagement | |
| 150,407 | 5.3% | B2B commerce, professional products |
Deep Dive: Instagram's Dominance (47.3%)
Nearly half of all Shopify stores maintain active Instagram presence. This makes sense because:
Instagram aligns with ecommerce fundamentals:
- Visual product showcase natural fit
- Shoppable posts enable direct purchase
- Stories create urgency (limited-time offers)
- Influencer partnerships drive discovery
- User-generated content builds trust
Instagram features most valuable for ecommerce:
- Instagram Shopping — Product tagging in posts
- Instagram Checkout — Buy without leaving app
- Stories — 500M daily active users
- Reels — Short-form video discovery
- Instagram Live — Real-time product launches
Supporting Data:
- Instagram traffic converts at 1.81% (social average)
- Visual products (fashion, beauty, home) convert 2-3× better
- Influencer partnerships ROI ranges 5:1 to 10:1 for successful campaigns
Facebook's Evolving Role (28.2%)
While adoption is lower than Instagram (both owned by Meta), Facebook serves different functions:
Facebook strengths:
- Broader age demographics (25-65+)
- Facebook Ads platform (precision targeting)
- Facebook Groups (community building)
- Facebook Marketplace (local commerce)
- Facebook Shops (native commerce)
Why adoption is "only" 28.2%:
- Younger audiences migrated to Instagram/TikTok
- Organic reach declined (pay-to-play model)
- Privacy concerns reduced data targeting effectiveness
- Platform fatigue among users
Strategic recommendation: Maintain Facebook presence for advertising platform access, but prioritize Instagram for organic engagement.
TikTok's Explosive Growth (12.3%)
TikTok's 12.3% adoption is notable given how young the platform is:
TikTok advantages:
- Algorithmic discovery (products can "go viral")
- Lower content production barrier (raw, authentic videos)
- Younger demographics (Gen Z, younger Millennials)
- TikTok Shop native commerce
- Influencer ecosystem (#TikTokMadeMeBuyIt)
Evidence of effectiveness:
- Stores using TikTok report 25-50% traffic increases
- #TikTokMadeMeBuyIt hashtag: billions of views
- Viral products can generate 6-7 figure sales in days
Caveat: TikTok success is unpredictable. The platform requires consistent content creation without guaranteed ROI, unlike paid advertising channels.
YouTube and Pinterest: Niche but Effective
YouTube (11.7%) and Pinterest (7.4%) serve distinct purposes. Companies using YouTube tend to run product demos, unboxing videos, and how-to content that drives long-tail search traffic. Companies using Pinterest skew toward home decor, fashion, and DIY categories where visual discovery converts well.
Traditional Communication Channels Still Matter
Despite social media excitement, traditional channels remain critical:
Email (58% provide email on website):
- 1,665,019 stores display email addresses
- Critical for customer service
- Newsletter signup opportunities
- Abandoned cart recovery
- Post-purchase follow-up
Phone (33% provide phone number):
- 949,527 stores list phone numbers
- High-value items often require phone support
- Builds trust (real business with contactable humans)
- Complex products need phone consultation
- Older demographics prefer phone contact
The 58% vs 33% gap tells us email has overtaken phone as the preferred support channel. Customers want asynchronous communication; merchants want support that scales.
Part 9: Shopify Store Characteristics

Business Size Distribution
Understanding store size distribution helps contextualize performance benchmarks and competition levels.
Employee Count Analysis
| Employee Range | Store Count | % of Total | Typical Revenue Range |
|---|---|---|---|
| Unknown | 2,710,657 | 95.2% | Varies (mostly small) |
| 1-9 employees | 71,161 | 2.5% | <$1M annually |
| 10-24 employees | 24,076 | 0.8% | $1M-$5M |
| 25-49 employees | 13,367 | 0.5% | $5M-$10M |
| 50-99 employees | 9,138 | 0.3% | $10M-$25M |
| 100-249 employees | 7,577 | 0.3% | $25M-$50M |
| 250-999 employees | 7,762 | 0.3% | $50M-$250M |
| 1000-4999 employees | 1,920 | 0.1% | $250M-$1B |
| 5000+ employees | 806 | 0.03% | $1B+ |
66% of Shopify store owners are small businesses (<$50M annual revenue). That's the core user base, and it says a lot about the platform's accessibility.
What "Unknown" Really Means: The 95.2% "unknown" category primarily consists of:
- Solo entrepreneurs and side hustles
- Small teams (1-3 people) who don't publicly disclose
- Dropshippers with no traditional employees
- Part-time businesses
Don't read this as negative. Many highly successful online businesses operate lean, with fewer than 10 people generating 7-8 figures annually.
Product Catalog Size Distribution
| Product Range | Store Count | % of Total | Store Type |
|---|---|---|---|
| 1-9 products | 784,842 | 27.6% | Niche/curated |
| 10-24 products | 496,819 | 17.5% | Small catalog |
| 25-49 products | 367,232 | 12.9% | Medium catalog |
| 50-99 products | 322,244 | 11.3% | Growing catalog |
| 100-249 products | 317,382 | 11.2% | Established store |
| 250-999 products | 270,269 | 9.5% | Large catalog |
| 1000-4999 products | 112,794 | 4.0% | Department store |
| 5000-9999 products | 17,580 | 0.6% | Mega catalog |
| 10,000-24,999 products | 10,921 | 0.4% | Enterprise |
| 25,000-99,999 products | 9,267 | 0.3% | Marketplace-level |
Small catalogs dominate (45% have <25 products):
- Curated selection strategy
- Dropshipping models (test products before stocking)
- Print-on-demand (limited core designs)
- Specialty/luxury products
- Easier inventory management
Medium catalogs are the sweet spot (25-249 products = 35%):
- Enough variety for customer choice
- Manageable inventory complexity
- Cross-sell/upsell opportunities
- Product line breadth without overwhelming
Large catalogs are rare but powerful (<5% have 1000+ products):
- Department store model
- Marketplace strategy
- Significant inventory investment
- Complex fulfillment operations
- Often Shopify Plus customers
Strategic Guidance:
- New merchants: Start with 5-15 products (test market fit)
- Growing merchants: Expand to 25-100 (build category depth)
- Established merchants: 100-500 products (balance variety and complexity)
- Enterprise merchants: 500+ only when logistics and inventory systems are mature
Part 10: Logistics and Shipping Carrier Preferences
Shipping is make-or-break for ecommerce. Understanding carrier preferences helps merchants optimize their logistics strategy.
Top Shipping Carriers by Adoption
| Carrier | Stores Using | Adoption Rate | Primary Markets |
|---|---|---|---|
| USPS | 222,184 | 7.8% | U.S., global lightweight |
| UPS | 167,108 | 5.9% | U.S., global heavy |
| FedEx | 123,181 | 4.3% | U.S., express |
| Royal Mail | 52,317 | 1.8% | U.K., Europe |
| Australia Post | 41,938 | 1.5% | Australia, Asia-Pacific |
| Canada Post | 27,162 | 1.0% | Canada |
| DHL | 12,855 | 0.5% | International express |
| Correos | 11,888 | 0.4% | Spain, Latin America |
Analysis by Carrier:
USPS Leads (7.8%):
- Most affordable for small/lightweight items
- Extensive U.S. domestic coverage
- Flat-rate boxes popular for merchants
- Slower delivery (2-8 days typical)
- Good for low-margin products
UPS Second (5.9%):
- Reliable tracking and delivery
- Business/commercial focus
- Better for heavier items
- Premium pricing
- Strong brand recognition = customer trust
FedEx Third (4.3%):
- Express delivery options
- Competitive with UPS on pricing
- Strong ground network
- Good for time-sensitive shipments
Regional Carriers:
- Dominate their respective markets
- Royal Mail (U.K.), Australia Post, Canada Post
- Often legally required or logistically optimal
- Lower international adoption
Why adoption rates seem low (<10%): many stores offer multiple carriers (customer choice at checkout), so the percentages don't sum to 100%. Some stores also use Shopify Shipping or third-party fulfillment (Amazon FBA, ShipBob), which hides the underlying carrier selection.
Shipping Strategy Recommendations
1. Multi-Carrier Strategy:
- Offer 2-3 options at checkout
- Budget option (USPS)
- Standard option (UPS/FedEx Ground)
- Express option (UPS/FedEx overnight)
2. Free Shipping Thresholds:
- Set threshold 20-30% above current AOV
- Example: If AOV = $87, set free shipping at $100-110
- Increases basket size to reach threshold
3. International Shipping:
- DHL for express international
- USPS International for economy
- Consider Shopify's international pricing
- Account for customs/duties in checkout
4. Fulfillment Partners:
- Consider 3PLs (third-party logistics) when volume > 100 orders/day
- Amazon FBA for Amazon channel expansion
- ShipBob, ShipMonk for multi-channel fulfillment
Part 11: Shopify Plus (The Enterprise Tier)

Shopify Plus deserves its own section. It's Shopify's enterprise tier and a significant revenue driver.
Shopify Plus Market Position
Current Statistics:
- 66,948 Shopify Plus stores globally (some data shows 51,000+)
- 0.19% of total ecommerce market share (sounds small but represents largest stores)
- ~2.4% of all Shopify stores are Plus tier
- Estimated 30-40% of Shopify's revenue despite <3% of stores
Geographic Distribution:
| Region | Plus Stores | % of Plus Total |
|---|---|---|
| United States | ~28,000-33,000 | 50% |
| United Kingdom | ~3,000-3,500 | 5-6% |
| Australia | ~3,000-3,500 | 5-6% |
| Canada | ~2,800 | 4-5% |
| Other Markets | ~29,000-30,000 | 35% |
Who Uses Shopify Plus?
Primary Target Market:
- Companies with $1M+ annual revenue (minimum viable)
- Sweet spot: $5M-$500M annually
- Many billion-dollar brands (Fashion Nova, Gymshark, etc.)
Common Characteristics:
- High transaction volumes (>10,000 orders/month)
- Complex operations (multiple brands, international)
- Customization needs (unique checkout flows, B2B portals)
- Dedicated development teams
- Enterprise integrations (ERP, CRM, PIM systems)
Shopify Plus Pricing and ROI
Pricing Structure:
- Base: $2,000/month minimum (annual contract)
- Revenue-based: 0.25% of GMV above $800K/month ($9.6M annually)
- Caps at various levels depending on volume
- Typical total cost: $2,000-$40,000/month for most Plus merchants
When Plus Makes Sense:
- Monthly revenue > $300K (ROI positive)
- Need for API customization
- International expansion requirements
- B2B wholesale alongside D2C
- Multiple brand management under one account
Plus-Exclusive Features:
- Shopify Scripts (cart/checkout customization)
- Launchpad (scheduled sales/campaigns)
- Unlimited staff accounts
- Up to 9 expansion stores
- Dedicated account manager
- Early access to beta features
- Higher API rate limits
- Wholesale channel access
Notable Shopify Plus Brands
High-Profile Merchants:
- Fashion Nova (#155 globally)
- Gymshark
- Kylie Cosmetics
- Allbirds
- Heinz
- Steve Madden
- Rebecca Minkoff
Recent Migrations TO Shopify Plus:
- FOREVER 21 (from Salesforce Commerce Cloud, Oct 2025)
- Huda Beauty (from Salesforce Commerce Cloud, Dec 2025)
- Optimum Nutrition (from SAP Commerce Cloud, Nov 2025)
These migrations from enterprise legacy platforms (Salesforce, SAP) validate Shopify Plus's enterprise readiness.
Plus vs. Standard Shopify Decision Framework
| Factor | Choose Standard | Choose Plus |
|---|---|---|
| Revenue | <$2M annually | >$5M annually |
| Orders/Month | <5,000 | >10,000 |
| Customization | Themes/apps sufficient | Need custom code |
| International | 1-2 markets | 5+ markets |
| Team Size | <5 people | 10+ people |
| B2B Component | None/minimal | Significant wholesale |
| Transaction Volume | Low/medium | High |
Part 12: Design and Branding (Themes and Domains)

Most Popular Shopify Themes
Theme selection significantly impacts conversion rates, mobile experience, and brand perception. We're tracking 1,000+ different Shopify themes.
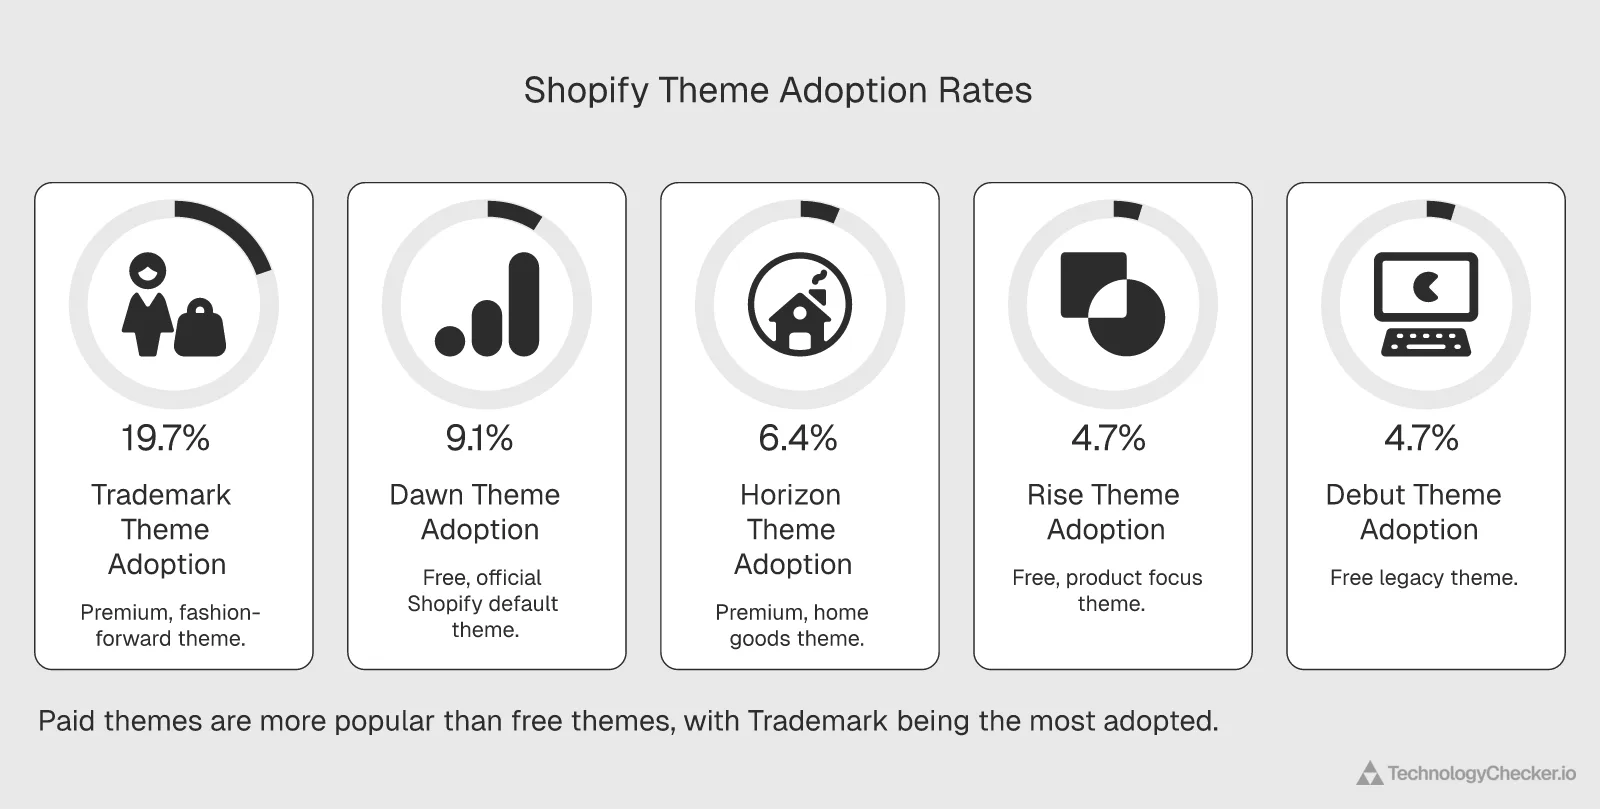
Top 10 Themes by Adoption
| Theme | Stores Using | Adoption % | Type | Best For |
|---|---|---|---|---|
| Trademark | 562,147 | 19.7% | Premium | Fashion, lifestyle |
| Dawn | 257,877 | 9.1% | Free | General, lightweight |
| Horizon | 183,366 | 6.4% | Premium | Home goods |
| Rise | 132,650 | 4.7% | Free | Product focus |
| Debut | 132,472 | 4.7% | Free (legacy) | Simple stores |
| Spotlight | 88,775 | 3.1% | Free | Large catalogs |
| Origin | 74,571 | 2.6% | Premium | Storytelling |
| Refresh | 74,127 | 2.6% | Free | Modern aesthetic |
| Impulse | 56,034 | 2.0% | Premium | Fashion, high-end |
| Prestige | 49,657 | 1.7% | Premium | Luxury brands |
Key Insights:
Trademark dominates (19.7%):
- Premium paid theme ($350)
- High adoption suggests ROI justifies cost
- Fashion-forward design
- Excellent mobile optimization
- Fast loading times
Dawn second (9.1%):
- Shopify's official free theme (launched 2021)
- Replaced Debut as default
- Online Store 2.0 architecture
- Lightweight and fast
- Good starting point for customization
Free vs. Paid Themes:
- ~40-50% use free themes (Dawn, Rise, Spotlight, Refresh)
- ~50-60% invest in paid themes
- Paid themes average $180-$350
- Custom themes for large brands
Theme Selection Strategy:
New merchants (<$10K/month revenue):
- Start with free theme (Dawn recommended)
- Focus on product/marketing before design investment
- Customize free theme with apps
Growing merchants ($10K-$100K/month):
- Invest in premium theme ($250-$350)
- Select theme matching your category (fashion vs. home goods)
- Budget for theme customization ($500-$2,000)
Established merchants ($100K+/month):
- Consider custom theme development ($5,000-$50,000)
- Unique brand expression
- Optimized for specific products/workflows
- Ongoing maintenance budget
Domain Extension Preferences
Domain choice impacts brand perception, trust, and SEO. Our analysis reveals clear patterns:
Top-Level Domain Distribution
| TLD | Store Count | % of Total | Primary Use Case |
|---|---|---|---|
| .com | 1,916,386 | 67.3% | Global standard |
| .store | 84,697 | 3.0% | Ecommerce-specific |
| .shop | 80,429 | 2.8% | Ecommerce-specific |
| .co.uk | 72,718 | 2.6% | United Kingdom |
| .com.au | 62,729 | 2.2% | Australia |
| .de | 54,097 | 1.9% | Germany |
| .co | 40,246 | 1.4% | Global alternative |
| .in | 40,093 | 1.4% | India |
| .ca | 38,726 | 1.4% | Canada |
| .fr | 32,986 | 1.2% | France |
Analysis:
.com maintains dominance (67.3%):
- Universal recognition and trust
- Best for U.S. and global brands
- Higher resale value
- No explanation needed to customers
Ecommerce-specific TLDs emerging (.store 3%, .shop 2.8%):
- Signal commerce intent clearly
- More available names
- Potentially better for brand matching
- Still building mainstream trust
Country-code TLDs strong in home markets:
- .co.uk (U.K.), .com.au (Australia), .de (Germany)
- Build local trust and SEO benefits
- Legal/tax advantages in some jurisdictions
- Customers prefer local domains
Regional Variations: In Australia, .com.au nearly equals .com adoption, showing stronger localization preference than most markets.
Domain Strategy Recommendations:
New brands:
-
Secure .com if possible (even if premium price justified)
-
If .com unavailable, consider:
- .shop or .store (signals ecommerce)
- Country-code TLD (if focusing on one market)
- .co as global alternative
International expansion:
- Secure country-code TLDs for major markets
- Use Shopify Markets for localization — companies using Weglot like Lyft and Shopify itself leverage no-code translation to reach multilingual audiences
- Consider regional domains for SEO and trust
Brand protection:
- Register common misspellings
- Secure .com, .net, .org even if not using
- Monitor trademark infringement
Part 13: Platform Migration Trends
Understanding migration patterns reveals platform competitiveness and merchant satisfaction.
Merchants Switching TO Shopify (Net Positive)
Over the last 90 days, 20,671 merchants migrated FROM competitors TO Shopify.
Migration Sources (Where They Came From)
| Platform | Migrations to Shopify | % of Total |
|---|---|---|
| WooCommerce | 8,976 | 43.4% |
| Wix | 3,094 | 15.0% |
| Squarespace | 1,808 | 8.7% |
| Magento | 1,628 | 7.9% |
| BigCommerce | 449 | 2.2% |
| Others | 4,716 | 22.8% |
Analysis by Platform:
WooCommerce (8,976 migrations):
- Most common source (43.4% of switches)
- WordPress/WooCommerce complexity drives switches
- Technical debt accumulation
- Security and maintenance burden
- Desire for hosted solution
Wix (3,094 migrations):
- Merchants outgrow Wix's ecommerce capabilities
- Limited customization at scale
- App ecosystem gaps
- Checkout limitations
- Seek more professional platform
Magento (1,628 migrations):
- Surprising given Magento's enterprise positioning
- Adobe Commerce (Magento) expensive and complex
- Development costs prohibitive
- Shopify Plus competitive on features
- Much lower total cost of ownership
Notable High-Profile Switches TO Shopify:
| Brand | Previous Platform | Switch Date | Global Rank |
|---|---|---|---|
| FOREVER 21 | Salesforce Commerce Cloud | Oct 29, 2025 | #329 |
| American Meadows | Magento | Oct 30, 2025 | #444 |
| City Winery | Custom Cart | Dec 15, 2025 | #485 |
| Huda Beauty | Salesforce Commerce Cloud | Dec 14, 2025 | #532 |
| Optimum Nutrition | SAP Commerce Cloud | Nov 9, 2025 | #627 |
These aren't small stores. They're top 1,000 global ecommerce sites switching FROM expensive enterprise platforms (Salesforce, SAP) TO Shopify Plus. That's a strong signal of enterprise readiness.
Merchants Leaving Shopify (Manageable Churn)
Over the same 90-day period, 10,758 merchants migrated FROM Shopify TO competitors.
Migration Destinations (Where They Went)
| Platform | Migrations from Shopify | % of Total |
|---|---|---|
| WooCommerce | 4,142 | 38.5% |
| Wix | 2,062 | 19.2% |
| Custom Cart | 493 | 4.6% |
| Squarespace | 421 | 3.9% |
| BigCommerce | 404 | 3.8% |
| Others | 3,236 | 30.0% |
Why Merchants Leave Shopify:
To WooCommerce (4,142):
- Lower monthly costs (initial perception, often false in practice)
- More control/flexibility
- Existing WordPress site integration
- Developer preference
- Budget constraints
To Wix (2,062):
- Simplicity for very small stores
- Lower monthly fees
- All-in-one website + ecommerce
- Not scaling beyond hobby level
To Custom Solutions:
- Very large enterprises building proprietary platforms
- Specific industry requirements
- Complete control desired
- Unlimited customization budget
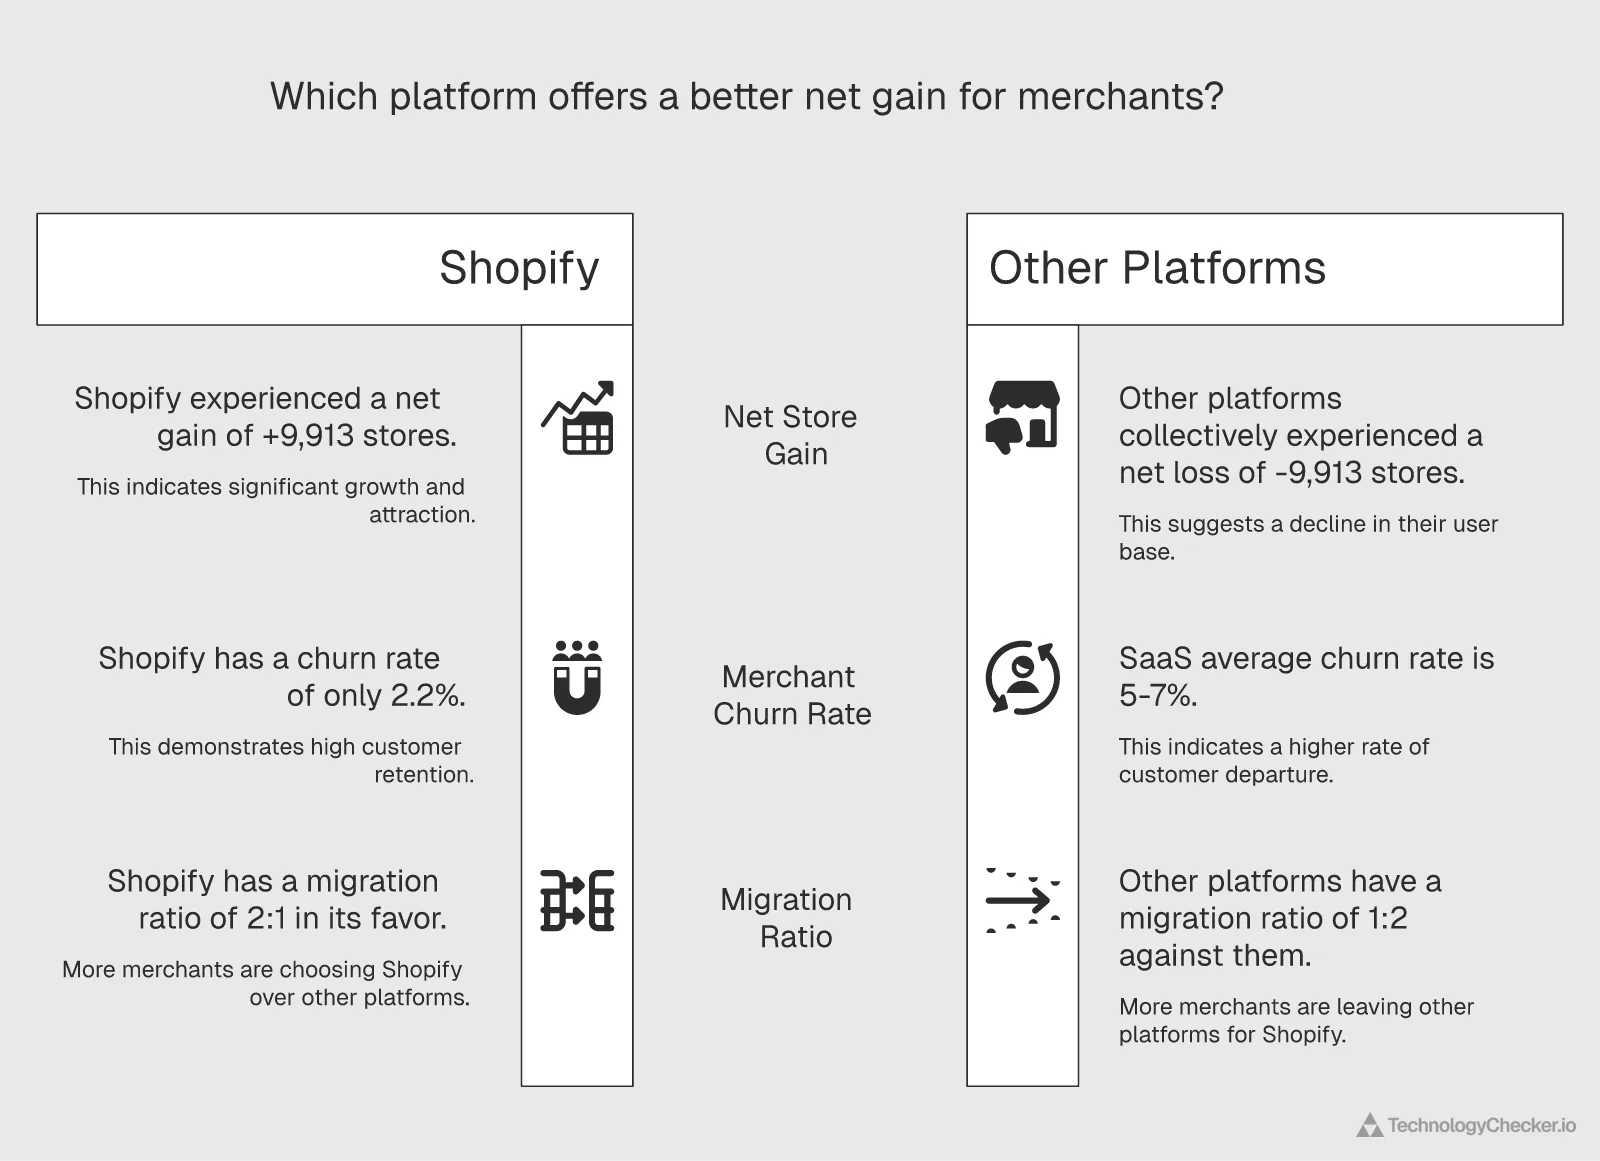
Net Migration Analysis
Critical Math:
- Migrations TO Shopify: 20,671
- Migrations FROM Shopify: 10,758
- Net gain: +9,913 stores (in just 90 days)
- Ratio: 1.92:1 (nearly 2:1 in favor of Shopify)
Annual Projection:
- Net gain of ~40,000 stores annually from migrations alone
- Doesn't include new stores (first-time merchants)
- Shows a strong competitive position
In H1 2024, only 2.2% of merchants migrated away from Shopify. That's exceptionally low for SaaS platforms, where the industry average is 5-7% annually.
The takeaway:
- Merchant satisfaction is high
- The competitive moat is widening
- Enterprise credibility is growing
- WooCommerce and Wix are the primary feeders of Shopify's growth
Part 14: Black Friday Cyber Monday (BFCM) Performance
BFCM is the ultimate stress test for any ecommerce platform. Shopify's numbers have gotten bigger every year — and the 2025 results were staggering.
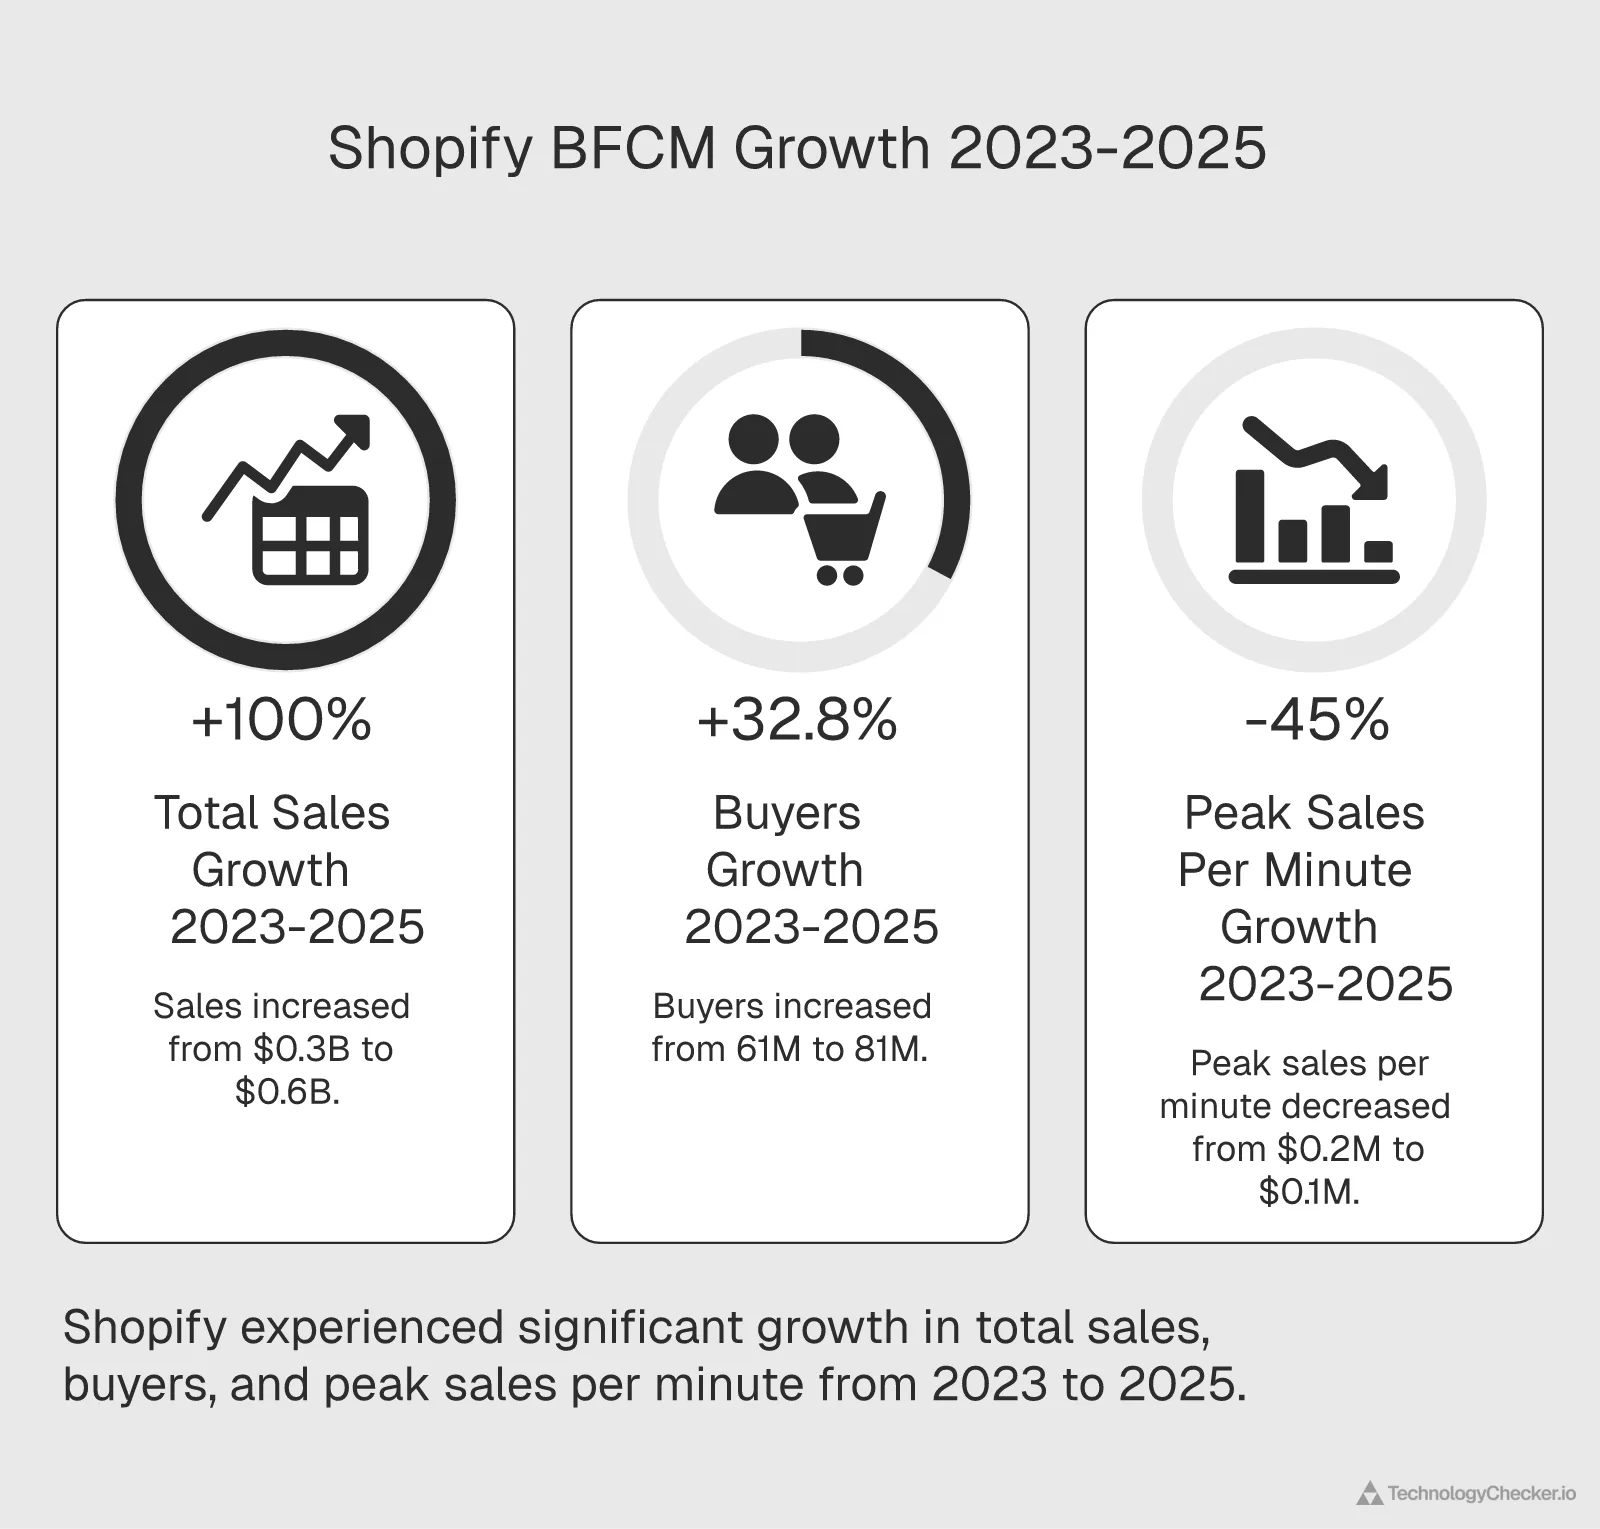
BFCM Performance: Three-Year Comparison
| Metric | BFCM 2023 | BFCM 2024 | BFCM 2025 | 2-Year Growth |
|---|---|---|---|---|
| Total GMV | $9.3B | $11.5B | $14.6B | +57% |
| Peak Sales/Minute | $4.2M | $4.6M | $5.1M | +21% |
| Global Buyers | 61M | 76M+ | 81M+ | +33% |
| First-time Sellers | 17,500+ | — | 15,800+ | Consistent |
| Record-Day Merchants | 55,000+ | — | 94,900+ | +72% |
| Average Cart Price | $108.12 | — | $114.70 | +6% |
2025 BFCM: The Record-Breaking Year
Total GMV: $14.6 billion over BFCM 2025 weekend — up 27% from $11.5 billion in 2024 (24% on a constant currency basis).
Peak Sales: $5.1 million per minute at 12:01 PM EST on Black Friday — that's $85,000 in transactions every single second.
81+ million consumers globally purchased from Shopify brands during BFCM 2025:
- More than the population of Germany
- Equivalent to 24% of U.S. population
- Up from 76M+ in 2024 and 61M in 2023
94,900+ merchants had their highest-selling day ever on Shopify — nearly double the 55,000 who set records in 2023.
15,800+ entrepreneurs made their first-ever Shopify sale during BFCM 2025, proving the platform remains accessible to brand-new sellers even during the industry's most competitive shopping weekend.
Hottest Product Categories (BFCM 2025): Cosmetics, clothing tops & pants, activewear, fitness & nutrition
Shop Pay Performance During BFCM 2025: Shop Pay usage surged 39% year-over-year, with 32% of all BFCM orders processed through the accelerated checkout. This is a massive shift — one in three BFCM transactions now goes through Shop Pay.
2024 BFCM: Setting the Stage
Total GMV: $11.5 billion — up 24% from $9.3B in 2023. 76+ million customers worldwide purchased from Shopify-powered brands, with peak sales reaching $4.6 million per minute.
Infrastructure Performance
Peak Infrastructure Metrics (consistently maintained across all three years):
- 967,000+ requests per second at peak capacity
- 99.99% uptime (no significant outages across any BFCM weekend)
- Sub-second response times even under extreme load
For context: Netflix serves ~500,000 requests per second at peak. Shopify nearly doubled that during BFCM, and it was processing actual financial transactions, not just streaming video. At $14.6B over a weekend, a single minute of downtime would cost merchants collectively ~$10M+ in lost sales.
Geographic and Category Insights

Top Selling Countries:
- United States (dominant)
- United Kingdom
- Australia
- Canada
- Germany
Top Selling Cities:
- Los Angeles
- New York
- London
Hottest Product Categories:
- Apparel and accessories
- Health and beauty
- Home and garden
(Aligns with overall platform category distribution)
Cross-border commerce:
- 15% of orders were international
- Confirms Shopify's global infrastructure works
- Merchants can easily sell worldwide
Shop Pay Performance
60% year-over-year increase in Shop Pay sales during BFCM
Why Shop Pay excelled:
- Saved payment information reduces checkout friction
- One-click purchasing (critical during high-traffic)
- Mobile optimization (79% of traffic is mobile)
- Trust in Shopify security
Merchant takeaway: Stores with Shop Pay enabled likely captured sales that would have been abandoned on competitors' platforms.
Sustainability Metrics
56,000+ tonnes of carbon removal funded by Shopify to offset shipping emissions
Environmental leadership:
- Carbon-neutral shipping program
- Transparent emissions tracking
- Sustainability Fund investments
- Appeals to environmentally-conscious consumers (growing segment)
Sustainability isn't just ethical. It's increasingly a competitive factor. Younger consumers (Gen Z, Millennials) are more likely to factor environmental impact into purchase decisions.
Key Takeaways for Merchants
1. Platform reliability matters: During peak sales periods, downtime = lost revenue. Shopify's 967K requests/second with 99.99% uptime provides confidence that your store won't crash during critical moments.
2. Shop Pay is non-negotiable: The 60% YoY sales increase speaks for itself. Enable Shop Pay immediately if you haven't already.
3. Mobile optimization is critical: With 79% mobile traffic, your BFCM success depends on mobile experience. Test checkout flows extensively on various devices.
4. Preparation timeline:
- 90 days before: Plan promotions and inventory
- 60 days: Test site performance under load
- 30 days: Begin email campaign teasers
- 2 weeks: Final testing and support staffing
- 1 week: Customer service preparation
5. Post-BFCM opportunity: Those 61 million buyers are now in the ecosystem. Email nurture campaigns convert BFCM bargain hunters into year-round customers.
Part 15: Shopify User Demographics and Traffic Patterns
Understanding who uses Shopify and how they behave informs marketing, product selection, and user experience decisions.
Traffic Sources and Device Usage
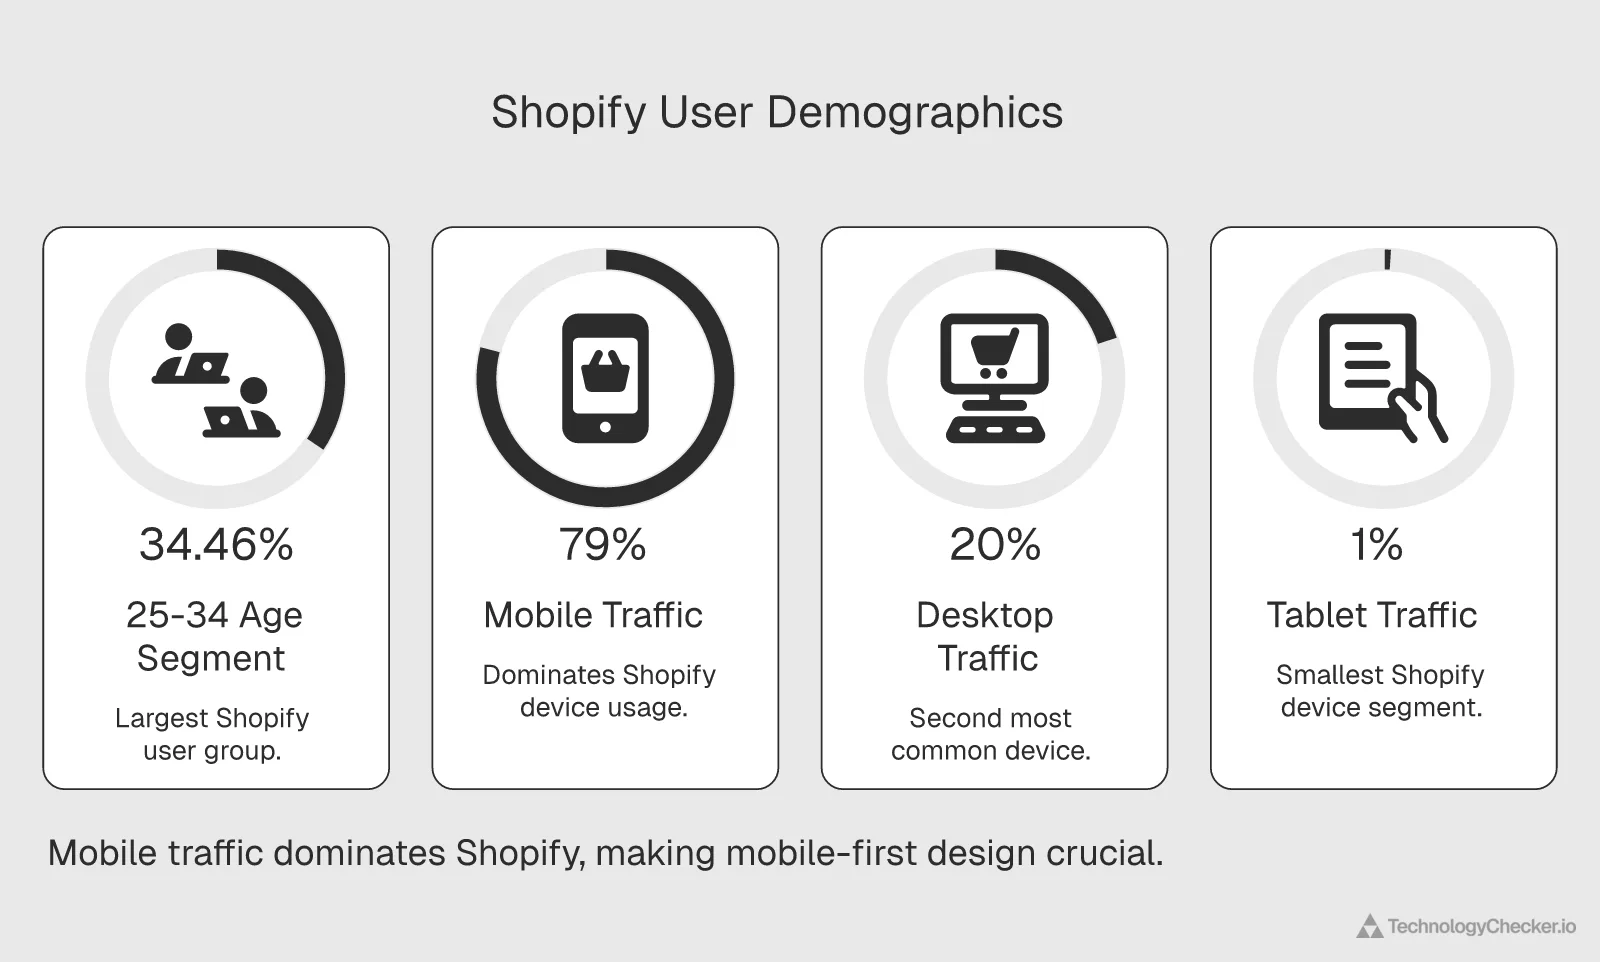
Mobile dominance: 79% of all traffic to Shopify stores comes from mobile devices
Device breakdown:
- Mobile: 79%
- Desktop: 20%
- Tablet: 1%
If your store isn't mobile-optimized, you're losing 80% of potential customers. Mobile-first design isn't optional. It's the baseline.
Average session behavior:
- Session duration: 3+ minutes
- Pages per session: 3+ (average stores visited)
Interpretation: Customers are comparison shopping. They visit multiple stores before making purchase decisions. This emphasizes:
- Need for competitive pricing
- Importance of unique value propositions
- Trust signals (reviews, guarantees)
- Superior product presentation
Geographic Traffic Distribution to Shopify.com
| Country | % of Traffic | Insights |
|---|---|---|
| United States | 33.73% | Dominant market |
| United Kingdom | 7.83% | Strong secondary market |
| Canada | 4.13% | Home market advantage |
| India | 3.91% | Growing merchant base |
| Australia | 2.56% | Mature market |
| Other | 47.84% | Global distribution |
The U.S. leads (33.73%), but 66% of traffic comes from outside the U.S. That's genuinely global reach, and this traffic includes both merchant research and consumer shopping.
Demographic Profile of Shopify Users
Gender distribution:
- Male: 49.13%
- Female: 50.87%
Nearly perfect gender balance is unusual for technology platforms and suggests Shopify appeals equally to all genders for entrepreneurship.
Age distribution:
| Age Range | % of Audience | Segment Characteristics |
|---|---|---|
| 25-34 | 34.46% | Millennials—largest segment |
| 35-44 | 21.31% | Younger Gen X—purchasing power |
| 18-24 | 14.88% | Gen Z—digital natives |
| 45-54 | 14.77% | Older Gen X—experience + capital |
| 55+ | 14.58% | Boomers—retirement businesses |
Millennials dominate (34.46% aged 25-34):
- Grew up with internet
- Comfortable with online purchasing
- Entrepreneurial mindset
- Tech-savvy but value ease-of-use
- Primary target for most consumer products
Broad age range. Unlike social platforms that skew young, Shopify serves entrepreneurs across generations. The 55+ segment (14.58%) shows ecommerce entrepreneurship appeals to retirees and second-career seekers too.
What this means in practice:
- Match your product selection to your target age group
- Tailor marketing messages to your specific segment
- Payment preferences vary by age: younger buyers lean toward PayPal/Shop Pay, older buyers toward credit cards
- Same with support: younger customers prefer chat, older ones prefer phone
Part 16: Who Actually Uses Shopify? (LinkedIn-Enriched Company Analysis)
At TechnologyChecker.io, we went beyond surface-level Shopify statistics. Using our proprietary technology detection system combined with LinkedIn company data enrichment, we analyzed 250,000 Shopify domains to understand the real businesses behind the stores. You can explore the full dataset (company lists, industry breakdowns, and tech stack analysis) on our companies using Shopify page.
This is original research you won't find elsewhere. We correlated our Shopify detection data with verified LinkedIn company profiles to reveal the true demographic, geographic, and industry makeup of the Shopify merchant ecosystem.
Methodology: How We Built This Dataset
Our enrichment process involved:
- Technology Detection: Scanning 2.5M+ Shopify domains using our proprietary crawler
- Company Matching: Cross-referencing domains against LinkedIn's company database
- Data Validation: Verifying matches through multiple signals (domain, company name, website field)
- Statistical Analysis: Aggregating and normalizing findings across 250,000 matched records
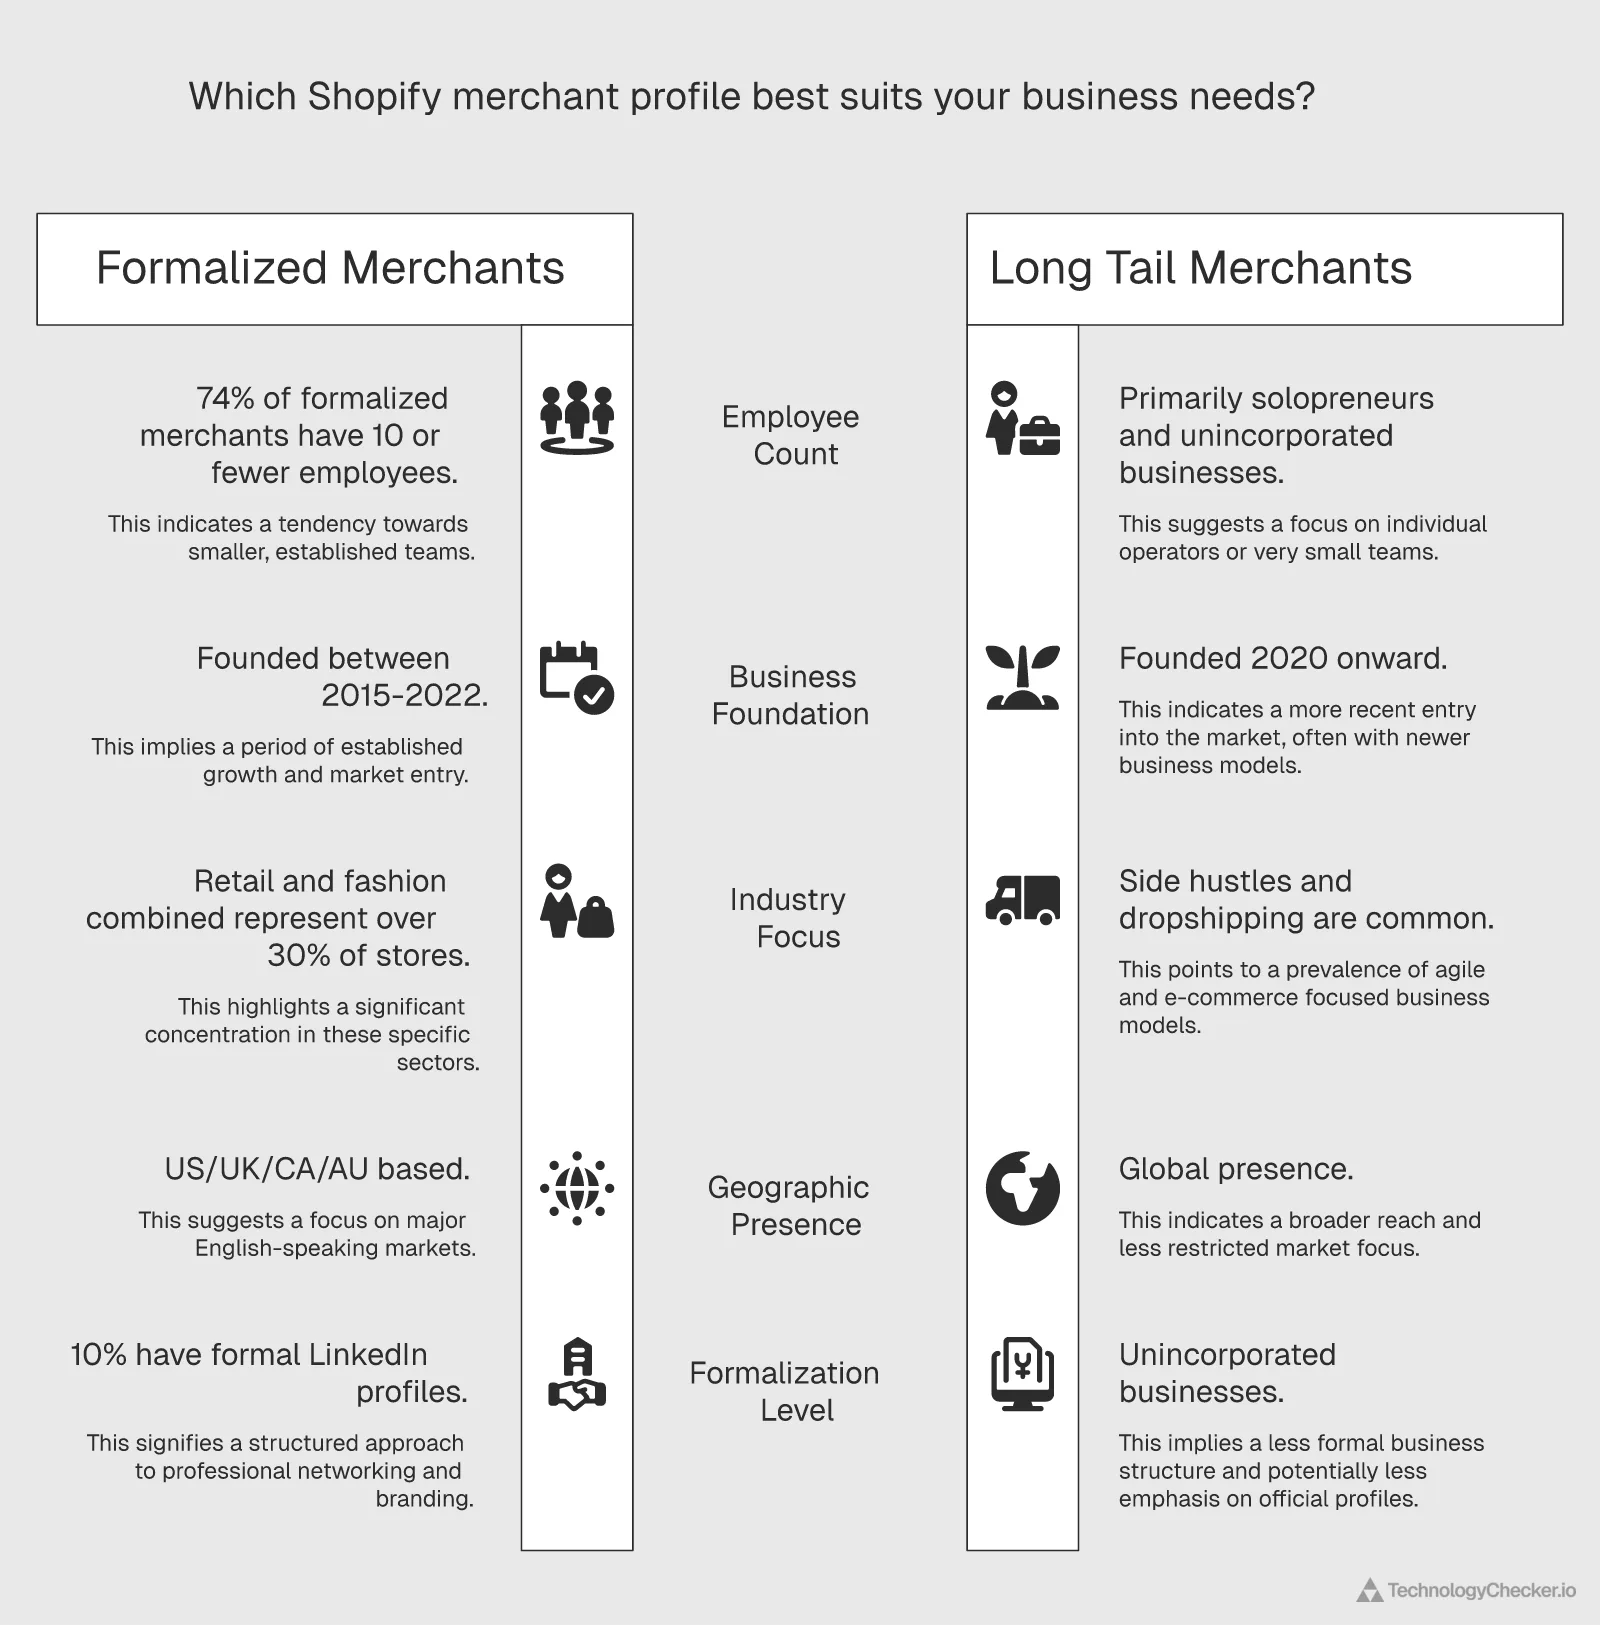
Important finding: only 10% of Shopify stores have formal LinkedIn company profiles. That alone is telling. It means 90% of Shopify's 2.5 million stores are operated by individuals, solopreneurs, and unincorporated businesses without formal company structures.
The analysis below covers the "formalized" 10%: approximately 250,000 established Shopify businesses with verifiable company data.
Company Size Distribution: The Micro-Business Reality
Our LinkedIn-enriched data reveals Shopify's true merchant composition:
| Employee Range | Store Count | Percentage | Interpretation |
|---|---|---|---|
| 1-10 employees | 18,660 | 73.97% | Core user base |
| 11-50 employees | 2,340 | 9.28% | Growing SMBs |
| 2-10 employees | 1,558 | 6.18% | Small teams |
| 51-200 employees | 747 | 2.96% | Mid-market |
| 1 (Solo) | 363 | 1.44% | Solopreneurs |
| 201-500 employees | 238 | 0.94% | Upper mid-market |
| 501-1,000 employees | 93 | 0.37% | Enterprise |
| 1,001-5,000 employees | 84 | 0.33% | Large enterprise |
| 10,001+ employees | 24 | 0.10% | Global brands |
| 5,001-10,000 employees | 9 | 0.04% | Major corporations |
Key Insight: The 74% Rule
Nearly three-quarters of all formalized Shopify merchants operate with 10 or fewer employees. This confirms Shopify's position as the platform of choice for micro-businesses and small teams.
For context, the unmatched 90% (stores without LinkedIn company profiles) are likely even smaller: individual sellers, side hustlers, and hobbyist entrepreneurs operating without formal business structures.
If you're a small team competing on Shopify, you're in good company. The platform is built for lean operations, not enterprise complexity.
Industry Distribution: Where Shopify Merchants Operate
Our enrichment analysis reveals clear industry concentrations:
Top 25 Industries by Store Count
| Rank | Industry | Store Count | Percentage |
|---|---|---|---|
| 1 | Retail | 2,845 | 11.31% |
| 2 | Retail Apparel and Fashion | 1,753 | 6.97% |
| 3 | Food and Beverage Services | 673 | 2.68% |
| 4 | Manufacturing | 590 | 2.35% |
| 5 | Wellness and Fitness Services | 573 | 2.28% |
| 6 | Personal Care Product Manufacturing | 418 | 1.66% |
| 7 | Retail Luxury Goods and Jewelry | 408 | 1.62% |
| 8 | Food and Beverage Manufacturing | 362 | 1.44% |
| 9 | Apparel & Fashion | 337 | 1.34% |
| 10 | Advertising Services | 327 | 1.30% |
| 11 | Sporting Goods Manufacturing | 305 | 1.21% |
| 12 | Technology, Information and Internet | 301 | 1.20% |
| 13 | Wholesale | 295 | 1.17% |
| 14 | Design Services | 294 | 1.17% |
| 15 | Software Development | 283 | 1.13% |
Industry Categories (Aggregated Analysis)
When we group related industries, clearer patterns emerge:
| Category | Combined Share | Opportunity Assessment |
|---|---|---|
| Retail (all types) | ~22% | High competition, proven model |
| Fashion & Apparel | ~9% | Saturated but high-margin |
| Food & Beverage | ~6% | Growing, operational complexity |
| Beauty & Personal Care | ~3% | Strong DTC opportunity |
| Sporting Goods | ~2% | Niche with loyal customers |
| Home & Furniture | ~2% | Higher AOV potential |
| Manufacturing/Wholesale | ~4% | B2B opportunity emerging |
Retail and fashion combined make up over 30% of formalized Shopify stores. But the presence of manufacturing (2.35%), wholesale (1.17%), and software development (1.13%) shows Shopify is expanding well beyond traditional D2C retail.
Geographic Distribution: The Global Shopify Map
Our LinkedIn-enriched data reveals where formalized Shopify merchants are headquartered:
Country Distribution
| Country | Store Count | Percentage | Market Maturity |
|---|---|---|---|
| United States | 9,986 | 39.69% | Dominant, mature |
| United Kingdom | 2,499 | 9.93% | Strong secondary |
| Canada | 1,776 | 7.06% | Home market |
| Australia | 1,711 | 6.80% | High adoption |
| India | 926 | 3.68% | High growth |
| Germany | 891 | 3.54% | European leader |
| France | 530 | 2.11% | Emerging |
| Netherlands | 437 | 1.74% | High per-capita |
| Italy | 349 | 1.39% | Growing |
| Spain | 275 | 1.09% | Developing |
| New Zealand | 261 | 1.04% | Strong Oceania |
| Mexico | 211 | 0.84% | LATAM leader |
| Brazil | 177 | 0.70% | Emerging LATAM |
| South Africa | 160 | 0.64% | African presence |
Regional Analysis
| Region | Combined Share | Notes |
|---|---|---|
| North America (US + Canada) | 47% | Nearly half of formalized merchants |
| UK & Ireland | ~10% | Strong English-speaking market |
| Australia/NZ | ~8% | Highest per-capita adoption |
| Western Europe | ~9% | Fragmented across countries |
| India/APAC | ~5% | Fastest growth trajectory |
| LATAM | ~2% | Emerging opportunity |
India at 3.68% is Shopify's most significant emerging market, ranking higher than any European country except the UK and Germany. This lines up with Shopify's strategic push into high-growth economies.
Top Cities for Shopify Merchants
| Rank | City | Country | Store Count | Percentage |
|---|---|---|---|---|
| 1 | London | UK | 729 | 2.88% |
| 2 | New York | US | 439 | 1.73% |
| 3 | Los Angeles | US | 312 | 1.23% |
| 4 | Toronto | CA | 213 | 0.84% |
| 5 | Paris | FR | 184 | 0.73% |
| 6 | Miami | US | 155 | 0.61% |
| 7 | Sydney | AU | 146 | 0.58% |
| 8 | San Francisco | US | 141 | 0.56% |
| 9 | Melbourne | AU | 129 | 0.51% |
| 10 | Austin | US | 115 | 0.45% |
| 11 | Singapore | SG | 108 | 0.43% |
| 12 | Brooklyn | US | 105 | 0.41% |
| 13 | Montreal | CA | 103 | 0.41% |
Worth noting: Brooklyn appears separately from New York (0.41%), which tracks with the borough's well-known concentration of DTC brands. Brooklyn has become a D2C brand incubator in its own right.
Company Age Analysis: When Were Shopify Merchants Founded?
Our LinkedIn data includes founding year information, revealing the age profile of formalized Shopify stores:
Age Statistics
| Metric | Value |
|---|---|
| Average founded year | 2012 |
| Median founded year | 2017 |
Distribution by Decade
| Decade Founded | Store Count | Percentage | Context |
|---|---|---|---|
| 2020s | 3,591 | 29.68% | Post-pandemic cohort |
| 2010s | 5,606 | 46.33% | Core Shopify era |
| 2000s | 1,361 | 11.25% | Pre-Shopify migration |
| 1990s | 593 | 4.90% | Established businesses |
| 1980s | 289 | 2.39% | Legacy brands |
| 1970s | 178 | 1.47% | Generational businesses |
| Pre-1970 | ~480 | ~4% | Heritage brands |
The COVID Cohort Effect
Nearly 30% of formalized Shopify merchants were founded in the 2020s. That's a clear signal of the pandemic-driven digital commerce acceleration. Combined with 2010s companies (46.33%), over 76% of Shopify's formalized merchant base is less than 15 years old.
Median founding year of 2017 means the typical Shopify store has been operating for about 8-9 years. Long enough to be established, young enough to be digitally native.
Company Type Distribution: Business Structures on Shopify
Understanding legal structure provides insight into merchant sophistication:
| Company Type | Store Count | Percentage |
|---|---|---|
| Privately Held | 8,624 | 34.26% |
| Self-Owned | 2,551 | 10.14% |
| Partnership | 1,531 | 6.08% |
| Public Company | 1,234 | 4.90% |
| Self-Employed | 1,183 | 4.70% |
| Nonprofit | 385 | 1.53% |
| Educational | 103 | 0.41% |
| Government Agency | 12 | 0.05% |
Analysis
The combined Self-Owned + Self-Employed categories (14.84%) confirm significant individual entrepreneurship even among formalized businesses. The "Privately Held" category (34.26%) represents more structured businesses with formal incorporation.
Public companies at 4.90% tells you there's real enterprise adoption here. These are established companies running their D2C operations on Shopify, often on Plus.
Nonprofits (1.53%) use Shopify for cause-driven commerce, merchandise sales, and fundraising.
The Two Shopify Populations: A Key Framework
Our analysis reveals Shopify serves two distinct populations:
Population 1: The "Formalized" Merchants (10% with company data)
| Attribute | Typical Profile |
|---|---|
| Company Size | 1-10 employees |
| Company Type | Privately Held or Self-Owned |
| Industry | Retail, Fashion, or Food/Beverage |
| Business Model | DTC e-commerce brand |
| Location | US (40%), UK, Canada, Australia |
| City | London, NYC, LA, Toronto |
| Founded | 2015-2022 |
| Company Age | ~5-8 years old |
Population 2: The "Long Tail" Merchants (90% without company data)
| Attribute | Likely Profile |
|---|---|
| Company Size | 1 person (solopreneur) |
| Company Type | Unincorporated / Individual |
| Business Model | Side hustle, dropshipping, print-on-demand |
| Location | Global (including emerging markets) |
| Founded | 2020-2024 (COVID boom) |
| Revenue | <$100K/year |
If you're a new merchant, consider this: 90% of stores are run by individuals without formal business structures. If you have a registered business, a dedicated team, or professional operations, you're already in the top 10% by formalization level.
Platform Ecosystem Context
Where Shopify Sits in Our Technology Database
| Metric | Value | Context |
|---|---|---|
| Total Shopify Domains | 2,488,585 | Largest single platform |
| Global Market Share | 9.54% | Nearly 1 in 10 websites |
| Formalized Businesses | ~250,000 | LinkedIn-matched |
| Long-tail Stores | ~2,250,000 | Individual operators |
Comparison with Other Platforms (from TechnologyChecker.io data)
| Platform | Domains Tracked | LinkedIn Match Rate |
|---|---|---|
| Shopify | 2,488K | 10% |
| MailChimp | 301K | 55% |
| Klaviyo | 159K | 42% |
| HubSpot | 137K | 73% |
| HighLevel | 83K | 43% |
Shopify is 8× larger than the next biggest platform in our database. The low 10% LinkedIn match rate (vs. 42-73% for B2B-focused platforms) reflects Shopify's long-tail of individual sellers, a fundamentally different user base than B2B SaaS tools.
What You Can Do With This Data
If you're a new merchant
- You're competing with micro-businesses: 74% of formalized competitors have ≤10 employees. Lean operations are the norm, not the exception.
- Fashion and retail are saturated: 30%+ of stores operate in these categories. Differentiation is critical.
- Geographic opportunity: If you're outside the US (40% of merchants), you may face less local competition.
- The pandemic cohort is real: 30% of your competitors started in 2020+. Many are still learning.
If you're already on Shopify
- Formalization advantage: if you have a registered business with employees, you're more established than 90% of the platform.
- Industry diversification: B2B (manufacturing, wholesale) is a growing but underserved segment.
- International expansion: English-speaking markets (US, UK, AU, CA) dominate, but European markets have lower saturation.
If you build apps or services for Shopify
- Target the long tail: 2.25M stores without formal business structures need accessible, affordable solutions.
- Micro-business focus: 74% have ≤10 employees. Build for small teams, not enterprise workflows.
- Industry specialization: Fashion (9%+) and F&B (6%) concentrations justify vertical-specific solutions.
Data Collection Notes
This analysis was conducted by TechnologyChecker.io using our proprietary technology detection systems combined with LinkedIn company data enrichment.
Sample Details:
- Total Shopify domains in database: 2,488,585
- Sample size for enrichment analysis: 250,000 domains
- LinkedIn company match rate: 9.99%
- Data collection period: Q4 2025 - Q1 2026
Limitations:
- 90% of Shopify stores lack LinkedIn company profiles (unincorporated/individual operators)
- Employee counts are self-reported on LinkedIn
- Industry classifications follow LinkedIn's taxonomy
- City/country data based on LinkedIn headquarters, not store location
This exclusive analysis is part of TechnologyChecker.io's ongoing research into the global ecommerce ecosystem. For custom analysis or enterprise data access, get in touch with our team.
Last Updated: May 2026
Part 17: Shopify's AI-First Strategy — The Renaissance Edition (2026)
Shopify's Winter '26 Edition — branded "The Renaissance" — represents the most significant platform evolution since Online Store 2.0. With 150+ product updates, almost all AI-focused, Shopify is positioning itself as the first truly AI-native commerce platform.

Sidekick: From Chatbot to AI Commerce Copilot
Sidekick has evolved dramatically from a reactive chatbot into a proactive AI coworker that anticipates business needs:
Key Capabilities (2026):
- Natural language theme editing: Merchants can say "make this button rounded" or "change the hero banner color" and Sidekick modifies the theme instantly
- Sidekick Pulse: Proactively identifies growth opportunities and surfaces insightful next steps tailored to your specific business data
- Sidekick Skills: Save, reuse, and share your best Sidekick prompts with your team or the broader merchant community
- Time savings: Merchants report saving 30-45 minutes per day on admin tasks with Sidekick
Shopify Magic: Brand-Aware Content Generation
Shopify Magic has received substantial 2026 upgrades:
- Brand Voice Cloning: Magic learns your brand's unique tone from your past 1,000 blog posts and social media comments
- Enhanced product descriptions: More detailed and brand-aware, referencing existing content when generating new copy
- Email content generation: Multiple subject line and content variations for A/B testing within Shopify Email
- AI background removal/replacement: Create seasonal product photos and marketing materials automatically
Agentic Commerce: The Biggest Shift
The most transformative feature is Agentic Storefronts, which puts Shopify products directly into AI conversations on platforms like ChatGPT, Perplexity, and Microsoft Copilot.
The numbers back this up:
- Orders from AI searches increased 15× between January 2025 and January 2026
- AI-driven traffic has higher average order value than direct traffic
- Shopify's Catalog API allows developers to build agents that handle the full journey — from product discovery to checkout — within the AI agent experience
Additional Renaissance Features
- Rollouts: Stage and schedule sets of changes to your online store (early access)
- 2,048 product variants: Up from the previous limit, enabling merchants to manage more diverse catalogs
- Tinker app: Consolidating premium AI tools into one affordable mobile platform for creators and makers
- B2B for all plans: Native B2B features (company profiles, custom catalogs, volume discounts, payment terms) now available on Basic, Grow, and Advanced plans — not just Plus
What This Means for Merchants
Shopify's AI strategy isn't about adding chatbots. It's about fundamentally re-architecting how merchants run their businesses:
| Before Renaissance | After Renaissance |
|---|---|
| Manual theme customization | Natural language editing |
| Generic product descriptions | Brand-voice-aware content |
| Reactive analytics review | Proactive AI-driven insights |
| Products only on your store | Products in AI conversations |
| B2B locked to Plus ($2K/mo) | B2B on all plans |
The competitive moat deepens. Competitors would need to replicate not just these features, but the data network effects: Shopify's AI gets smarter with every transaction across millions of stores. That's an advantage that compounds over time.
Conclusion: Shopify's Unmatched Position in 2026
After analyzing 2.8+ million Shopify stores across multiple data sources and seven years of historical trends, our conclusion is clear: Shopify's lead in the ecommerce platform market is stronger than ever in 2026. Explore our live Shopify technology profile for the latest market share, migration, and competitor data updated monthly.

The Numbers Tell the Story
- 2,446,083 live Shopify stores detected in our crawl — the largest single platform in our database
- 45.99% ecommerce-platform market share, 2.6× WooCommerce, the clear category #1
- 1.32M domains have churned off Shopify — real, but dwarfed by a 3.1:1 inbound migration ratio
- 3.1:1 inbound migration across tracked platform switches (Magento defectors run 17.8:1 in Shopify's favor)
- 82.7% of enriched merchants have 1–10 employees — the backbone of independent commerce
- Klaviyo on 43.1% of analyzed stores — the ecosystem's default marketing layer
- $11.5 billion annual revenue in FY 2025 (+30% YoY); Q1 2026 GMV crossed $100B in a single quarter
- $378 billion GMV in 2025 (+29% YoY)
- $14.6 billion in BFCM 2025 sales — up 57% from 2023 with 81M+ global buyers
- B2B GMV up 96% YoY — now available on all plans, not just Plus
- 200M+ Shop Pay users processing 32% of BFCM orders
- $0 debt and a $155.65 billion market cap — the strongest balance sheet in Shopify's history
Why Shopify Wins
1. Technical performance. Conversion rates up to 36% better than competitors. 967K requests/second during BFCM. 99.99% uptime. These numbers directly affect your bottom line.
2. Ecosystem depth. 21,000+ apps, 868 trackable technologies, thousands of developers. Competitors can't replicate this kind of network effect. It compounds.
3. Scalability. First-time entrepreneurs making their first sale during BFCM sit on the same platform as billion-dollar brands like Fashion Nova and Gymshark. The platform grows with you.
4. Investment in product. Shop Pay (60% YoY growth), Shopify Plus for enterprise, international expansion, B2B capabilities. Shopify is spending heavily on the future.
5. AI-first strategy. The Winter '26 Renaissance Edition shipped 150+ AI updates. Sidekick saves merchants 30-45 min/day. Agentic Storefronts put products into ChatGPT and Perplexity conversations. Orders from AI searches grew 15× in one year. No competitor is close.
6. Incentive alignment. 76% of FY 2025 revenue came from merchant services, not subscriptions. Shopify earns more when you sell more. That alignment matters.
7. Balance sheet strength. $11.56B in revenue, $0 debt, $5.8B in cash, $2B+ in annual free cash flow, $155.65B market cap. Shopify has the financial muscle to invest aggressively in AI, international expansion, and merchant tools while maintaining the stability you depend on.
For Merchants in 2026
Considering Shopify? The data validates the choice. A category-leading 45.99% market share, a 3.1:1 inbound migration ratio, and the strongest ecosystem of any platform. It's the best combination of ease-of-use, scalability, and performance available right now.
Already on Shopify? Focus on optimization. You're on the right platform. Now benchmark your performance against the metrics in this report:
- Is your AOV above $87?
- Is your conversion rate above 1.4%?
- Are you using top apps like Judge.me and Klaviyo?
- Have you enabled Shop Pay?
- Are you optimized for mobile (79% of traffic)?
On a competitor? The migration data speaks for itself: 20,671 merchants switched TO Shopify in just 90 days, including major enterprises leaving Salesforce and SAP. Ask yourself whether your current platform can keep up with your growth. For context on how the broader technology intelligence industry tracks these platform shifts, see our industry deep dive.
What's Next for Shopify in 2026
Based on our analysis, here's what I expect:
Growth will continue. The FY 2025 results back this up:
- 30% revenue growth in 2025 far exceeded earlier projections of 15-20%
- Enterprise adoption is accelerating (Shopify Plus expansion, FOREVER 21 and Huda Beauty migrations)
- International penetration is deepening (31% EMEA, 16% APAC revenue share)
- B2B commerce and Shopify Capital ($4.2B in merchant advances) are becoming real revenue streams
- The $2B share repurchase program tells you management is confident in sustained growth
Competitive Dynamics:
- WooCommerce will remain #2 but gap widens
- Wix/Squarespace focus on small businesses
- BigCommerce continues enterprise struggle
- Custom solutions only for largest enterprises
Technology evolution (AI-first strategy is live and accelerating):
- Winter '26 Renaissance Edition shipped 150+ AI updates — Sidekick, Magic, Agentic Storefronts all production-ready
- Orders from AI searches grew 15× in 12 months (Jan 2025 → Jan 2026)
- Shop Pay reached 200M+ users with 50% higher conversion than guest checkout
- B2B features democratized across all plans — B2B GMV up 96% YoY
- Shopify Catalog API enables third-party AI agents to handle full purchase journeys
- International/multi-currency support across 175+ countries continues to improve
- Augmented reality for product visualization
- Sustainability features becoming standard
Merchant Opportunities:
- Growing app ecosystem creates more optimization opportunities
- International expansion easier than ever
- B2B commerce opening new revenue streams
- Omnichannel (online + offline) simplified
- Direct-to-consumer brands have more tools
Final Thoughts from TechnologyChecker.io
I've analyzed dozens of technology platforms across multiple industries as the founder of TechnologyChecker.io. Shopify's combination of market share, technical performance, ecosystem depth, and merchant retention is unusual. Few platforms have all four.
Is it perfect? No. Monthly costs add up. Customization sometimes requires hiring a developer. Scale brings complexity. But these are problems of success, not structural weaknesses.
For the vast majority of ecommerce merchants, from first-time entrepreneurs to established brands doing $100M+ annually, Shopify is the strongest platform choice in 2026.
The numbers are clear. 2.4 million live stores in our crawl. 45.99% category market share. $378 billion in GMV. $11.5 billion in revenue. Zero debt. A 3.1:1 migration ratio in Shopify's favor. The market has decided.
About This Analysis
This report was produced by TechnologyChecker.io based on analysis of data we crawled from 32M websites globally. Financial data sourced from Shopify's 2025 Annual Report (10-K filing).
Last Updated: May 14, 2026 (added the "What Our Crawl Shows" proprietary dataset — 2.4M live stores, 1.32M churned domains, platform migration ratios, and tech-stack overlap from our February 2026 crawl; reconciled market-share figures to our 45.99% category measurement) Next Scheduled Update: July 2026
Have questions about this data or need customized analysis? Contact our research team.
Found this valuable? Share it with fellow entrepreneurs and ecommerce professionals who could benefit from these insights.
Mehmet Suleyman
CEO & Co-founder

