Search Engine Market Share 2026: Google Still Sends 87.6% of Referrals (July 2026 Update)
Q2 2026 close plus the first full-year view of Cloudflare Radar referral data: Google still sends ~88% of search referrals and AI chatbots just 0.3%, while ClaudeBot's crawl-to-refer ratio fell from 91,702:1 to 5,143:1 in a year and declared training crawling nearly doubled.
Published •Updated •28 min read


Google sent 87.63% of all search referral traffic observed by Cloudflare Radar across May 2026. Bing sent 3.45%. TikTok sent 3.26%. Yandex 2.10%. DuckDuckGo 1.38%. Every AI chatbot put together (ChatGPT, Gemini, Claude, Perplexity) sent 0.29%. Meanwhile, Anthropic's ClaudeBot crawled 11,122 pages for every 1 human visit Anthropic sent back. OpenAI's crawl-to-refer ratio is 857:1. Google's is 5:1.
I spent the last 18 months at Microsoft Bing and then on the AI team before co-founding TechnologyChecker, so search engine market share is a chart I've stared at for a long time. The version of that chart I grew up with is a pie slice labeled "Google" next to slivers labeled "Bing," "Yandex," and "DuckDuckGo." Almost every SEO blog still publishes that version. In 2026, it isn't enough.
The real story in this year's search data isn't whether AI is "taking share" from Google. It isn't. The real story is that AI platforms invented an entirely new web traffic pattern: enormous outbound crawling with near-zero inbound referrals. The asymmetry is so extreme it has changed what "search engine market share" even means in practice.
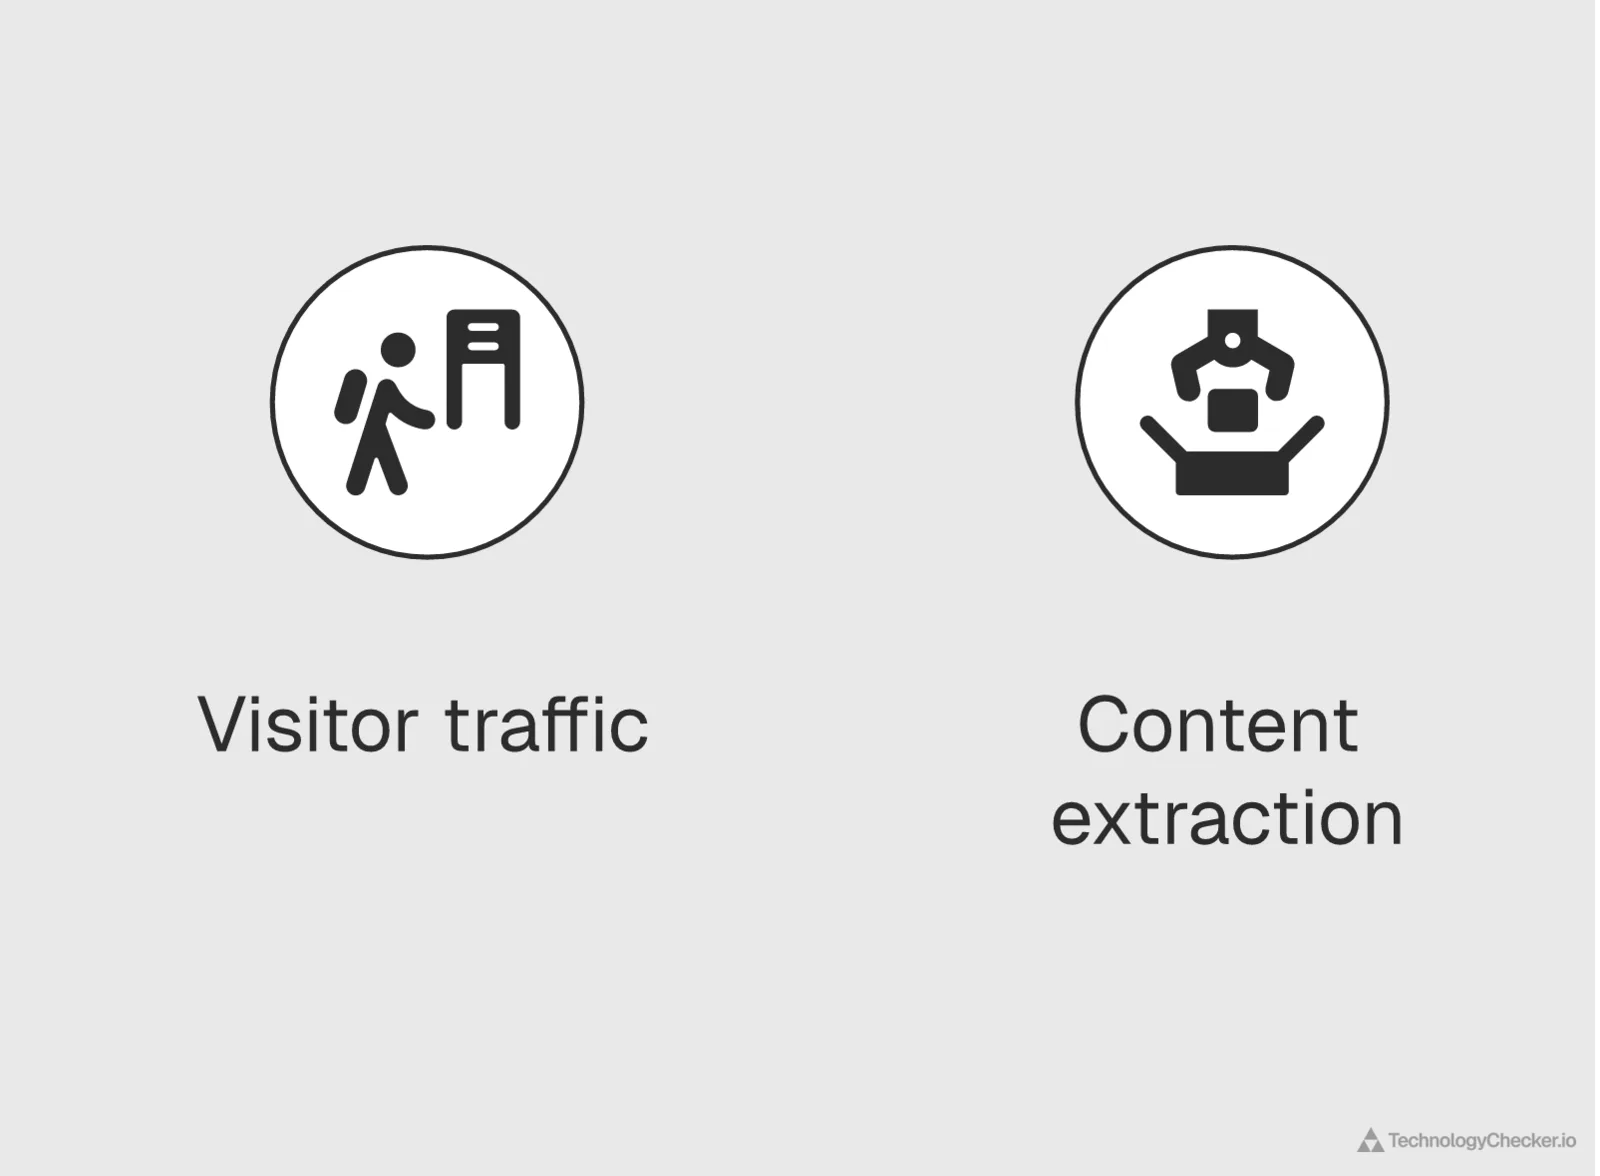
"Search engine market share" now describes two different markets: who sends visitor traffic to websites (Google's 87.6%), and who crawls websites to extract content for AI (the operators that send almost nothing back).
This post is the full breakdown for May 2026, pulled live from the Cloudflare Radar API across a full month of global HTTP traffic. Who sends traffic, who takes it, and what that means if you run a website, do SEO, or build AI.
Where search market share stands at the Q2 2026 close: the full-year view
Updated July 3, 2026. The May breakdown below is the deep dive, and every chart in it still holds. This section sits on top of it with two things the original snapshot could not have: the full Q2 2026 quarter (April 1 to June 30), and the first clean year-over-year read against Q2 2025. One of those year-over-year numbers is a trap, and it is the most important thing on this page to get right.
The full May 2026 monthly breakdown, the vertical splits, and all the charts are preserved unchanged below this section.
The referral year-over-year is mostly a measurement artifact. Here is what actually moved.
Pulling the referral share across three quarters lines up the trap immediately.
| Search source | Q2 2025 | Q1 2026 | Q2 2026 | Year-over-year |
|---|---|---|---|---|
| 82.22% | 84.61% | 87.90% | n/c* | |
| TikTok | 9.01% | 7.14% | 3.11% | n/c* |
| Bing | 2.64% | 3.13% | 3.36% | +0.72pt |
| Yandex | 2.43% | 1.75% | 2.06% | −0.36pt |
| Baidu (mobile + desktop) | 2.17% | 1.59% | 1.61% | −0.56pt |
| DuckDuckGo | 1.05% | 1.28% | 1.36% | +0.31pt |
| ChatGPT | 0.19% | 0.20% | 0.28% | +47% |
Source: Cloudflare Radar — bots/crawlers/summary/referer, referral share by search source. Q2 2026 = 2026-04-01 to 2026-06-30, Q1 2026 = 2026-01-01 to 2026-03-31, Q2 2025 = 2025-04-01 to 2025-06-30. Pulled 2026-07-03. *n/c = not comparable: Cloudflare reclassified a large block of TikTok link-out referrals in the reporting week of February 16, 2026 (documented in the trend section below), which mechanically transferred share from TikTok to Google. The Google and TikTok deltas across that boundary are a methodology change, not a behavior change.
Read the Google row as a real +5.7-point gain and you have been fooled by your own data. Q1 2026 is the tell: at 84.61%, it sits exactly halfway between the two regimes because the quarter straddles the February reclassification, with pre-change January weeks pulling it down and post-change March weeks pulling it up. The Google climb and the TikTok collapse are the same accounting event seen from two sides. Neither is a search-behavior story.
The rows that do survive the boundary tell a quieter, truer one. Bing gained a clean 0.72 points year-over-year (2.64% to 3.36%), DuckDuckGo added 0.31, and every classic engine that was not touched by the reclassification held or drifted by tenths of a point. The referral layer of the web is doing in a year what it used to do in a decade: almost nothing. Google's grip is a fact of physics, not a trend.
And the number everyone actually came to check: ChatGPT's referral share rose 47% year-over-year, from 0.19% to 0.28%. That is the fastest-growing line in the table by far, and it is still a rounding error. ChatGPT is the only AI source that clears Radar's quarterly reporting threshold at all; Gemini, Claude, and Perplexity each sit below it, folded into an "other" bucket worth 0.18% in total. A 47% gain on a base this small means the AI-replaces-search-referrals thesis is technically accelerating and practically still not real. One AI chatbot, growing fast, sends one-fifth of what DuckDuckGo alone sends.
The crawl-to-refer gap compressed from both ends (net-new: the full-year view)
The referral market barely moved. The crawl market, the other half this post is built on, moved a lot. Refreshing the crawl-to-refer ratio to the full Q2 quarter and adding the year-ago column turns the single-week snapshot below into a trajectory.
| Operator | Q2 2025 | Q2 2026 | What changed |
|---|---|---|---|
| Anthropic | 91,702 : 1 | 5,143 : 1 | 18× less extractive, still ~1,000× worse than Google |
| OpenAI | 1,257 : 1 | 870 : 1 | improving, still an order of magnitude off search |
| Perplexity | 230 : 1 | 153 : 1 | improving |
| Microsoft | 43 : 1 | 33 : 1 | improving |
| 17 : 1 | 5 : 1 | back to its decade-long baseline | |
| Yandex | 15 : 1 | 23 : 1 | slightly more extractive |
| Baidu | 1.2 : 1 | 10.5 : 1 | 9× more extractive |
| ByteDance | 1.8 : 1 | 9.1 : 1 | 5× more extractive |
| Mistral | 1.6 : 1 | 63 : 1 | 40× more extractive |
| DuckDuckGo | 0.3 : 1 | 1.7 : 1 | still the healthiest ratio of any major operator |
Source: Cloudflare Radar — bots/crawlers/summary/crawl_refer_ratio (normalization RATIO, keyed by operator: pages crawled per 1 referral sent back). Q2 2026 vs Q2 2025, full quarters. Pulled 2026-07-03.
The story is a vise closing. At the top, the worst offenders improved by orders of magnitude: Anthropic's ClaudeBot went from crawling 91,702 pages per return visit to 5,143, roughly an 18× improvement in a year, and OpenAI, Perplexity, and even Google's own ratio all fell. At the bottom, several smaller operators moved the opposite way: Mistral went from a near-healthy 1.6:1 to 63:1, ByteDance from 1.8 to 9.1, Baidu from 1.2 to 10.5, as their crawl volumes outran their trivial referral flows. The spread between the most and least extractive major operator narrowed from roughly 90,000:1 to roughly 3,000:1. The extremes are converging toward a middle that is still nothing like a search relationship. Anthropic improved 18× and remains about a thousand times more extractive than Google. This is the same metric that drives the robots.txt blocking wave, read here as an economics question rather than an enforcement one.
AI crawlers now declare what they are: training nearly doubled (net-new axis)
The most revealing year-over-year cut is the one where the crawlers describe themselves. Every AI bot sends a crawl_purpose header, and the mix flipped over the year.
| Declared crawl purpose | Q2 2025 | Q2 2026 | Change |
|---|---|---|---|
| Training | 28.73% | 44.86% | +16.1pt |
| Mixed Purpose | 65.14% | 42.96% | −22.2pt |
| Search | 4.63% | 9.13% | +4.5pt |
| User Action | 1.07% | 2.45% | +1.4pt |
| Undeclared | 0.42% | 0.60% | +0.2pt |
Source: Cloudflare Radar — ai/bots/summary/crawl_purpose, share of AI-crawler requests by declared purpose. Q2 2026 vs Q2 2025, full quarters. Pulled 2026-07-03.
A year ago, the plurality of AI crawling hid behind "Mixed Purpose," a bucket vague enough to mean anything. In Q2 2026, declared Training is the single largest category at 44.86%, up from 28.73%, while Mixed Purpose fell by 22 points. The crawlers stopped being coy. The one category with any referral mechanism behind it, Search (a bot fetching a page in real time to answer a live prompt), doubled from 4.63% to 9.13%, which is real growth and still under a tenth of all AI crawling. The thesis at the center of this post, that AI operators are running a training pipeline that occasionally does a little search, is no longer an inference from crawl ratios. As of Q2 2026 the crawlers say it themselves.
One measurement note for completeness. The visitor-type split (humans versus bots) refreshes cleanly for Q2 2026, where humans are still a minority at 43.98% of requests, but Radar does not return the same breakdown for the Q2 2025 window, so there is no honest year-over-year on that particular cut and none is claimed here.
The Q2 2026 bottom line
Two markets, a full year apart, still moving at completely different speeds. The referral market is frozen: Google-dominant, glacial, and the loud AI-referral story is still a rounding error growing off a rounding-error base. The crawl market is in motion: the extraction ratios are compressing hard at the top, drifting worse at the bottom, and, for the first time, openly declaring themselves as training. If you optimize for traffic, nothing here changes your plan. If you pay the origin-bandwidth bill, the bots taking your content just told you, on the record, what they are taking it for.
The topline: Google still owns 87.6% of search referrals in May 2026
Search Engine Market Share 2026: Google Sends 87.63% of All Search Referrals
Google sends 87.63% of all search referral traffic observed by Cloudflare Radar across May 2026. Bing holds 3.45%, TikTok 3.26%, Yandex 2.10%, DuckDuckGo 1.38%. Every AI search engine combined — ChatGPT, Gemini, Claude, Perplexity — accounts for 0.29% of search referrals sent.
Source: Cloudflare Radar · May 1 – May 31, 2026
| Search Source | Share of Referrals (%) |
|---|---|
| 87.63% | |
| Bing | 3.45% |
| TikTok | 3.26% |
| Yandex | 2.1% |
| Baidu | 1.64% |
| DuckDuckGo | 1.38% |
| ChatGPT | 0.23% |
| Bing (China) | 0.15% |
| Google Scholar | 0.08% |
| Gemini | 0.028% |
| Claude.ai | 0.016% |
| Perplexity | 0.013% |
- Google's 87.63% share is the highest concentration of any major internet market in 2026
- All four AI chatbots combined (ChatGPT + Gemini + Claude + Perplexity) send 0.29% of search referrals
- TikTok at 3.26% sends more search referral traffic than Yandex, DuckDuckGo, or Baidu individually
- Google's share rose only 0.24 percentage points month over month — no measurable AI disruption yet
The first chart is the one most people came for. It answers the question every marketing dashboard tries to answer. When someone lands on a website from a search engine, which search engine did they come from?
According to Cloudflare Radar's get_bots_crawlers_data endpoint (REFERER dimension, full month of May 2026), the split is:
| Search Source | Referral Share | Category |
|---|---|---|
| 87.63% | Traditional search | |
| Bing | 3.45% | Traditional search |
| TikTok | 3.26% | Social search |
| Yandex | 2.10% | Traditional search |
| Baidu (mobile + desktop) | 1.64% | Traditional search |
| DuckDuckGo | 1.38% | Privacy search |
| ChatGPT | 0.23% | AI search |
| Bing China | 0.15% | Traditional search |
| Google Scholar | 0.08% | Vertical search |
| Gemini | 0.028% | AI search |
| Claude.ai | 0.016% | AI search |
| Perplexity.ai | 0.013% | AI search |
Source: Cloudflare Radar get_bots_crawlers_data endpoint, REFERER dimension, May 1 to May 31, 2026.
Two things jump out.
Google's 87.63% is one of the most concentrated market shares in any major internet metric. For context, global mobile OS splits 72/27 Android to iOS, and cloud infrastructure splits 31/25/11 AWS/Azure/Google. A single company sending 87.63% of the traffic-sending layer of the web is historically rare. That same concentration shows up one layer down in the browser market, where Chrome holds about 68% of web traffic, another near-monopoly hiding in plain sight.
The second thing is the AI chatbot column. Combining every major model (ChatGPT at 0.23%, Gemini at 0.028%, Claude at 0.016%, Perplexity at 0.013%) gets you to 0.29% of search referrals. That's about one-fifth of what DuckDuckGo sends, one-twelfth of what Bing sends, and one 300th of what Google sends. The "AI is replacing search" narrative has been loud since 2023. In the Cloudflare referral data for May 2026, it isn't yet real.
TikTok is now a bigger search engine than DuckDuckGo and Yandex
The single most interesting row in that table is TikTok at 3.26%. That isn't page-load traffic or in-app traffic. It's traffic where someone tapped a link inside TikTok and ended up on an external website. That's the classic definition of a search referral.
Three years ago, TikTok didn't meaningfully exist in the search referrer table. In May 2026, it sends more traffic to the rest of the web than Yandex (2.10%), DuckDuckGo (1.38%), and Baidu (1.64%) send individually. It sits just behind Bing (3.45%).
The mechanism is "social search." Young users open TikTok and type "best Italian restaurant Brooklyn" into the app's search bar the way their parents opened Google. Prabhakar Raghavan, Google's then-head of Search, said publicly at Fortune's Brainstorm Tech in July 2022 that nearly 40% of 18-to-24-year-olds in Google's internal studies now use TikTok or Instagram for local discovery instead of Google Maps. Cloudflare's 2026 referral data suggests that behavior now drives roughly 3% of the web's search-driven traffic.
If you run SEO for a consumer brand, TikTok isn't an awareness channel anymore. It's a search engine.
Which search engines win which verticals?
Search engine market share isn't uniform across the web. Cloudflare Radar lets you filter referral share by the vertical of the destination site, and the splits move a lot. Here's the same REFERER data cut by vertical for May 2026.
TikTok sent 9.6% of all referrals to shopping and general-merchandise sites in May 2026, nearly triple its 3.26% all-web share, while ChatGPT's referral share more than doubled in finance (0.60%, versus 0.23% globally). Source: Cloudflare Radar get_bots_crawlers_data REFERER dimension filtered by vertical, May 2026.
| Vertical | Bing | TikTok | Yandex | DuckDuckGo | ChatGPT | |
|---|---|---|---|---|---|---|
| All verticals (global) | 87.63% | 3.45% | 3.26% | 2.10% | 1.38% | 0.23% |
| Shopping & General Merchandise | 85.46% | 2.17% | 9.60% | 0.93% | 0.80% | 0.14% |
| Finance | 86.79% | 5.68% | 3.83% | 1.14% | 1.05% | 0.60% |
| Travel & Tourism | 88.31% | 5.61% | 3.16% | 1.11% | 1.06% | 0.15% |
| Computer & Electronics | 88.46% | 4.58% | 2.65% | 1.32% | 1.54% | 0.29% |
| Gambling | 88.27% | 1.40% | 1.58% | 4.52% | 0.27% | 0.01% |
Three patterns stand out.
TikTok is a commerce referral channel, not a general one. Its 9.6% share of shopping referrals is almost triple its all-web average, and shopping is the only vertical where TikTok outsends Bing. Social-commerce link-outs (product tags, the in-app shop tab) drive it. If you sell physical product, TikTok isn't 3% of your search-referral opportunity, it's closer to 10%.
Bing over-indexes on desktop, professional verticals. Finance (5.68%), travel (5.61%), and computer and electronics (4.58%) all run well above Bing's 3.45% global share. That tracks with Bing's Windows and Edge install base skewing toward work machines, where finance research and B2B hardware shopping happen.
AI referral barely registers anywhere, but it's least irrelevant in finance. ChatGPT's 0.60% finance share is 2.6x its global average and the only vertical where it clears half a percent. Gambling is the geographic outlier: Yandex (4.52%) and Baidu lead there, a Russia-and-Asia traffic signature, and ChatGPT is essentially absent at 0.01%.
One caveat on a cut you might expect but won't find here. Cloudflare's referral endpoint supports a vertical filter but not a country one, so this is search-engine share by vertical, not by country. For the country angle, the closest available signal is which verticals AI crawlers pull from per market, which we break down by country in our Claude statistics report.
How has search market share moved over the last 12 months?
Search Engine Market Share Trend: April 2025 to May 2026
Between May 2025 and mid-February 2026, Google's share of global search referrals held between 79.9% and 82.5% while TikTok hovered between 9.3% and 12.2%. In week 43 of 2026 (Feb 16 onward) the picture reset: Google climbed to 86-88% and TikTok collapsed to 3-4%. The jump is consistent with Cloudflare reclassifying a block of TikTok link-out referrals that used to be bucketed as search. Yandex, Bing, and DuckDuckGo held steady across the whole window. May 2026 held the post-reclassification pattern, with Google at 88.3% and TikTok at 3.2%.
Source: Cloudflare Radar · April 21, 2025 – May 31, 2026
| Month | Share of Search Referrals (%) |
|---|---|
| Apr '25 | 83.61% |
| May '25 | 81.51% |
| Jun '25 | 81.46% |
| Jul '25 | 80.31% |
| Aug '25 | 81.48% |
| Sep '25 | 81.86% |
| Oct '25 | 80.21% |
| Nov '25 | 80.94% |
| Dec '25 | 82.5% |
| Jan '26 | 80.21% |
| Feb '26 | 81.14% |
| Mar '26 | 86.69% |
| Apr '26 | 86.96% |
| May '26 | 88.31% |
- Google held between 79.9% and 82.5% for 10 straight months before jumping to 86-88% in mid-February 2026
- TikTok collapsed from 11.08% (Feb 2026) to 3.95% (Mar 2026) in a single reporting window — the largest monthly swing we've ever measured in search referrals
- Bing, Yandex, and DuckDuckGo barely moved all year, ending within 0.7 points of where they started
- The Feb-to-Mar jump almost certainly reflects a Cloudflare reclassification of TikTok link-outs, not a real behavior change
To check whether the May 2026 topline is a snapshot or a trend, I pulled the REFERER dimension across a 52-week window and sampled the first full ISO week of every month. Here's the 14-month trajectory.
| Month (first full week) | TikTok | Bing | Yandex | DuckDuckGo | |
|---|---|---|---|---|---|
| Apr 2025 | 83.61% | 8.66% | 2.75% | 2.43% | 1.04% |
| May 2025 | 81.51% | 9.92% | 2.53% | 2.50% | 1.01% |
| Jun 2025 | 81.46% | 9.31% | 2.69% | 2.60% | 1.06% |
| Jul 2025 | 80.31% | 12.22% | 2.41% | 1.47% | 1.09% |
| Aug 2025 | 81.48% | 10.85% | 2.38% | 1.50% | 1.03% |
| Sep 2025 | 81.86% | 9.77% | 2.97% | 1.59% | 1.13% |
| Oct 2025 | 80.21% | 11.16% | 2.79% | 1.67% | 1.08% |
| Nov 2025 | 80.94% | 10.59% | 2.88% | 1.64% | 1.14% |
| Dec 2025 | 82.50% | 9.62% | 2.76% | 1.69% | 1.13% |
| Jan 2026 | 80.21% | 12.17% | 2.36% | 1.63% | 1.25% |
| Feb 2026 | 81.14% | 11.08% | 2.84% | 1.61% | 1.15% |
| Mar 2026 | 86.69% | 3.95% | 3.91% | 1.74% | 1.31% |
| Apr 2026 | 86.96% | 3.56% | 3.45% | 2.46% | 1.39% |
| May 2026 | 88.31% | 3.16% | 3.24% | 2.04% | 1.26% |
Source: Cloudflare Radar get_bots_crawlers_data endpoint, REFERER dimension, weekly timeseries_groups across 52 weeks ending May 31, 2026.
For ten straight months, Google held between 80.21% and 82.50%. TikTok held between 9.31% and 12.22%. Bing, Yandex, and DuckDuckGo barely moved at all. Then, in the reporting week of February 16, 2026, something happened. Google jumped roughly 6 points to 86-88%. TikTok collapsed from 11.08% to 3.95% in a single window.
That kind of 7-point monthly swing in a traffic share number of this scale doesn't happen organically. It's almost certainly the result of Cloudflare reclassifying a block of TikTok link-out referrals that the platform used to bucket as "search." No public Cloudflare changelog confirms the change as of publication, but the signature is unmistakable. The TikTok loss almost exactly offsets the Google gain (TikTok dropped 7.1 points, Google gained 5.6 points, with the remainder redistributing to Bing and DuckDuckGo). The timing is synchronous. And the rest of the world didn't move.
The practical takeaway: if you've been tracking your "TikTok search share" in any analytics tool that sources from Cloudflare Radar, your number before February 2026 is probably overstated, and your number after is more conservative. Treat the two halves of the year as two different methodologies.
Month-over-month is effectively flat
Search Market Share Month Over Month: Google Moved +0.24pp in May 2026
Month-over-month changes in search engine referral share are tiny — none shifts by more than a quarter of a percentage point. Google rose 0.24 points. Yandex slipped 0.17. ChatGPT gained 0.026. Despite every headline predicting AI disruption of Google, the Cloudflare Radar referral data for May 2026 is effectively flat.
Source: Cloudflare Radar · Compared: May 2026 vs April 2026
| Search Source | Change in Referral Share (pp) |
|---|---|
| 0.24pp | |
| Baidu | 0.05pp |
| ChatGPT | 0.026pp |
| Gemini | -0.007pp |
| TikTok | -0.02pp |
| DuckDuckGo | -0.02pp |
| Bing | -0.07pp |
| Yandex | -0.17pp |
- Google's share rose 0.24 percentage points — essentially flat despite months of AI-disruption headlines
- ChatGPT referral share rose 0.026pp — AI chatbots are still not displacing search referrals
- Yandex (−0.17pp) was the biggest mover, and it is still a rounding error at this scale
Zooming into the last two comparable full months (May 2026 vs April 2026, both post-reclassification), the changes are tiny:
- Google: 87.39% to 87.63%, up 0.24 points
- Bing: 3.52% to 3.45%, down 0.07 points
- TikTok: 3.28% to 3.26%, down 0.02 points
- Yandex: 2.27% to 2.10%, down 0.17 points
- DuckDuckGo: 1.40% to 1.38%, down 0.02 points
- ChatGPT: 0.208% to 0.234%, up 0.026 points
Google moved about a quarter of a point, and upward. ChatGPT's share rose by a rounding error. Every line here is still moving glacially, AI included.
When someone shows you a slide predicting 20% AI-search-referral share by 2027, this is the chart to hold it up against. The referral data is moving glacially. Whatever AI is doing to how users consume information, it isn't yet changing how traffic lands on websites.
The other half of the story: the crawl-to-refer ratio flips everything
Here's where the data gets uncomfortable.
AI Crawl-to-Refer Ratio 2026: Anthropic Crawls 11,122 Pages per 1 Referral
Anthropic's ClaudeBot crawled 11,122 pages for every 1 human visit Anthropic sent back to the web in the week of May 25 to June 1, 2026, per Cloudflare Radar's CRAWL_REFER_RATIO endpoint. That improved from 13,528:1 in April but is still the worst ratio of any major operator. OpenAI's ratio is 857:1, down from 1,252:1. Perplexity moved the wrong way, from 95:1 to 190:1. Google's traditional Googlebot operates at 5:1. This asymmetry is the structural reason publishers have started blocking AI crawlers in robots.txt.
Source: Cloudflare Radar · May 25 – June 1, 2026
| Operator | Pages Crawled per 1 Referral Sent |
|---|---|
| Anthropic | 11122:1 |
| OpenAI | 857:1 |
| Perplexity | 190:1 |
| Microsoft | 34:1 |
| Mistral | 27:1 |
| Yandex | 24:1 |
| Baidu | 12:1 |
| ByteDance | 9:1 |
| 5:1 | |
| DuckDuckGo | 1.5:1 |
- Anthropic crawls 11,122 pages for every 1 referral — still the worst ratio of any major operator, though down from 13,528:1 in April
- OpenAI's 857:1 ratio is roughly 170x worse than Google's traditional 5:1 search exchange
- Google (5:1) and DuckDuckGo (1.5:1) show what a healthy crawl-for-referral exchange looks like
- Perplexity worsened from 95:1 to 190:1 as its crawl volume outran its referrals
I pulled the CRAWL_REFER_RATIO dimension from the same get_bots_crawlers_data endpoint. That metric measures, per AI operator, how many HTML pages that operator's bots crawl for every 1 human visit the operator sends back. For the week of May 25 to June 1, 2026:
| Operator | Pages Crawled per 1 Referral | What This Means |
|---|---|---|
| Anthropic | 11,122 : 1 | Essentially pure extraction |
| OpenAI | 857 : 1 | Crawling 857x more than it returns |
| Perplexity | 190 : 1 | Best of the AI-native operators, but worsening |
| Microsoft | 34 : 1 | Copilot + Bing blended |
| Mistral | 27 : 1 | Small operator, still extractive |
| Yandex | 24 : 1 | Traditional regional search operator |
| Baidu | 12 : 1 | Traditional Chinese search |
| ByteDance | 9 : 1 | TikTok + Bytespider training |
| 5 : 1 | Traditional search, the baseline | |
| DuckDuckGo | 1.5 : 1 | The healthiest ratio of any major operator |
Source: Cloudflare Radar get_bots_crawlers_data endpoint, CRAWL_REFER_RATIO dimension, May 25 to June 1, 2026.
DuckDuckGo's 1.5:1 shows what a healthy relationship looks like. DuckDuckGo crawls your site, indexes it, and for roughly every 1.5 pages it crawls, it sends back 1 human visitor. Google's 5:1 is also fine. For every page Googlebot fetches, Google Search sends back 1 referral for every 5 crawls. That ratio has held roughly steady for a decade. It's why publishers tolerated Googlebot even as it became the largest single source of bot traffic on the web. For the full ranking of who runs the web's bots, see our bot traffic statistics report.
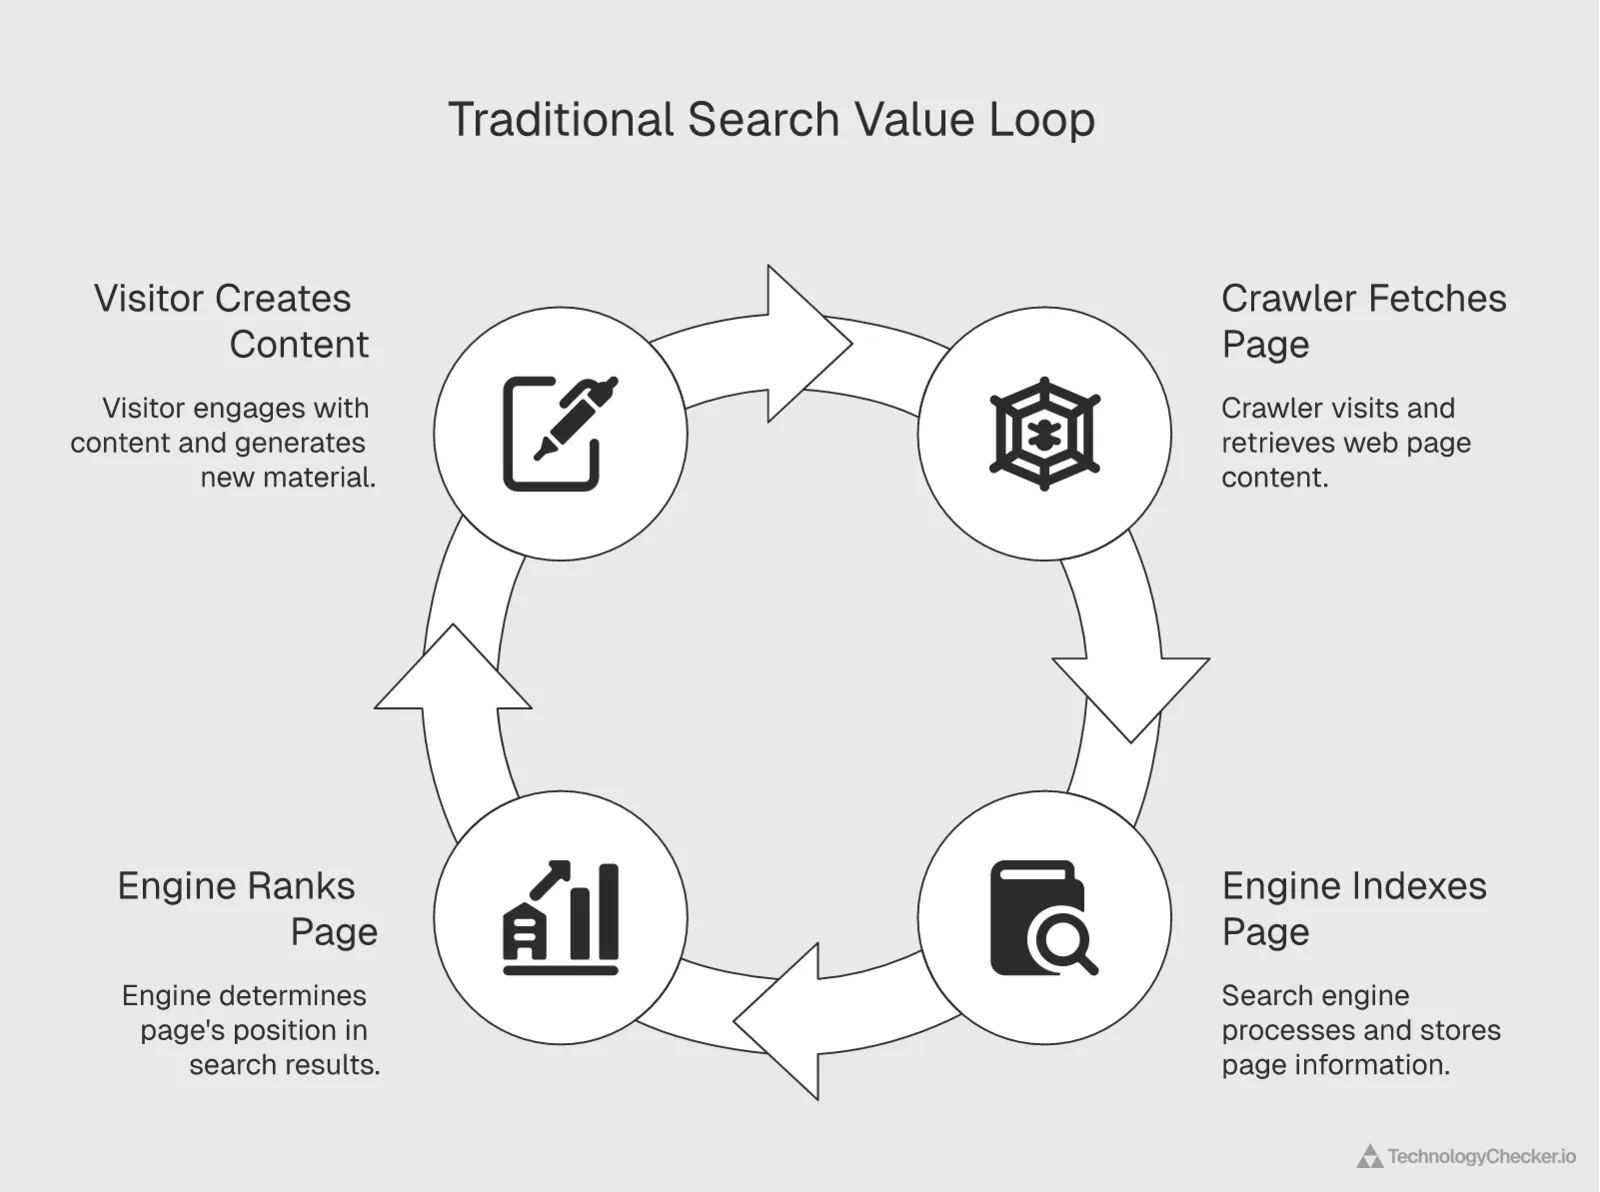
The reciprocal loop that made search crawling tolerable for two decades: every crawl is repaid with a referral that funds the next page of content. AI extraction breaks the loop — it takes the content and sends almost no visitor back.
Now look at Anthropic's 11,122:1.
For every 1 human visit Claude.ai sends back to a publisher, Anthropic's ClaudeBot has already fetched 11,122 pages from that publisher. That ratio improved from 13,528:1 in April, but it still isn't a search relationship. It isn't even a bad search relationship. It's a data extraction pipeline with almost no compensating traffic flow.
OpenAI at 857:1 is roughly 13x better than Anthropic but still 170x worse than Google. OpenAI runs GPTBot (training) plus OAI-SearchBot (live retrieval for ChatGPT), and the blended ratio is still extractive by an order of magnitude. Perplexity moved the other way, from 95:1 in April to 190:1, as its crawl volume outran its referrals.
This is the structural reason publishers started blocking AI crawlers through robots.txt in 2024 and 2025. The economic bargain that let Googlebot access the open web (you crawl my content, you send me visitors) simply doesn't exist for most AI operators.
Humans are now a minority of web traffic
Web Traffic Breakdown 2026: Humans Are Now 45% of HTTP Requests
Across Cloudflare's global network, 44.52% of HTTP requests in May 2026 came from humans. Non-AI bots (search crawlers, monitoring, SEO tools, feed readers, archivers) account for 46.97%. AI bots account for 5.54%, with another 2.98% classed as mixed-purpose automated traffic. The majority of the web — 55.48% — is no longer human.
Source: Cloudflare Radar · May 1 – May 31, 2026
| Label | Value |
|---|---|
| Non-AI Bots (search, SEO, monitoring, archivers) | 46.97% |
| Humans | 44.52% |
| AI Bots (training + agent crawlers) | 5.54% |
| Mixed-Purpose Bots | 2.98% |
- Non-human traffic is now the majority of the web at 55.48%
- Non-AI bots still outweigh AI bots more than 8-to-1 by request volume
- AI bots at 5.54% are small in share but growing fast, led by training crawlers
One last Cloudflare cut to set the context. When Cloudflare classifies every HTTP request by client type, the April 2026 split is:
- Non-AI Bots (search crawlers, SEO tools, monitoring, archivers, feed readers): 46.97%
- Humans: 44.52%
- AI Bots (training + agent crawlers): 5.54%
- Mixed-Purpose Bots: 2.98%
Source: Cloudflare Radar get_bots_crawlers_data endpoint, CLIENT_TYPE dimension, full month of May 2026.
55.48% of HTTP requests observed by Cloudflare in May 2026 are non-human. Humans are the minority.
AI bots at 5.54% are still small relative to non-AI bots, but the composition of that 5.54% is what matters. Non-AI bots are the familiar ecosystem. Googlebot, Bingbot, SEO tools like Ahrefs and Semrush, monitoring services like Pingdom, RSS readers, archivers like the Wayback Machine. They mostly operate with the 5:1 or better ratio Google models. AI bots operate at 100:1, 1,000:1, or 11,000:1. The two categories aren't comparable, and combining them into "bot traffic" obscures the real economic shift.
Which AI crawlers are growing fastest?
Top AI Crawlers May 2026: Googlebot 27%, Meta 13%, GPTBot 11%, Bytespider 10%
GPTBot overtook ClaudeBot to become the third-largest AI crawler in May 2026, holding 11.48% of AI bot HTTP requests vs ClaudeBot's 9.73% — a reversal from April, when ClaudeBot led 11.69% to 9.84%. Bytespider (ByteDance) nearly doubled its share to 10.25% (was 5.73% in April), passing ClaudeBot to become the #4 AI crawler. Googlebot remains the leader but lost about 3 points of share, falling from 30.28% to 27.26%.
Source: Cloudflare Radar · May 1 – May 31, 2026
| User agent | Share of AI bot requests (%) |
|---|---|
| Googlebot | 27.26% |
| Meta-ExternalAgent | 13.23% |
| GPTBot | 11.48% |
| Bytespider | 10.25% |
| ClaudeBot | 9.73% |
| Bingbot | 8.45% |
| Applebot | 7.01% |
| Amazonbot | 5.29% |
| Claude-SearchBot | 2.22% |
| Other | 5.08% |
- GPTBot (11.48%) overtook ClaudeBot (9.73%) on a full-month basis — reversing April, when ClaudeBot led
- Bytespider/ByteDance nearly doubled from 5.73% to 10.25%, passing ClaudeBot to take #4 overall
- Googlebot lost about 3 points of share (30.28% → 27.26%) but remains the AI crawl leader
- Anthropic's Claude-SearchBot entered the top 10 at 2.22% while OpenAI's OAI-SearchBot slipped out of it
Inside that 5.54% AI bot slice, the full-month May user agent breakdown looks like this:
| User Agent | Share of AI Bot Requests | Operator | Primary Purpose |
|---|---|---|---|
| Googlebot | 27.26% | Search indexing + Gemini training | |
| Meta-ExternalAgent | 13.23% | Meta | Llama training |
| GPTBot | 11.48% | OpenAI | GPT training |
| Bytespider | 10.25% | ByteDance | Doubao training |
| ClaudeBot | 9.73% | Anthropic | Claude training |
| Bingbot | 8.45% | Microsoft | Search + Copilot grounding |
| Applebot | 7.01% | Apple | Apple Intelligence training |
| Amazonbot | 5.29% | Amazon | Alexa + Nova training |
| Claude-SearchBot | 2.22% | Anthropic | Claude live web retrieval |
| Other | 5.08% | Various | — |
Source: Cloudflare Radar get_ai_data endpoint, bots/summary/user_agent dimension, full month of May 2026.
Googlebot at 27.26% shows the dual-use problem. Cloudflare classifies Googlebot as AI-adjacent because Google uses the same crawler output to power both Google Search and Gemini training. You can't block Googlebot-for-AI without blocking Googlebot-for-search. They're the same crawler. Google-Extended exists for exactly this reason, but it's opt-out and covers only a subset of training usage.
Bytespider is the fastest mover. ByteDance's crawler rose from 5.73% in April to 10.25% in May, overtaking ClaudeBot to become the #4 AI crawler and feeding Doubao's training pipeline. Applebot, which had tripled to about 9.5% by mid-April, cooled to 7.01% in May, so the momentum crown passed to ByteDance.
Meta-ExternalAgent has no consumer search product behind it. Meta doesn't operate a search engine. 100% of Meta-ExternalAgent's crawl volume is Llama model training. By volume, Meta is now the second-largest AI crawler on the web despite having no referral mechanism to give back.
The AI crawler mix is wildly local: Googlebot owns 61% of crawls in Russia, ChatGPT owns 35% in Japan
The user-agent split above is a global average, and the average hides the most volatile cut in this entire report. Re-run the same ai/bots user-agent query with a country filter and the composition of AI-crawler traffic swings harder between markets than any other number here. I pulled the trailing 28 days — May 12 to June 9, 2026 — for eight countries.
| Country | Googlebot | ChatGPT-User | GPTBot | Meta-ExternalAgent | Bingbot | ClaudeBot |
|---|---|---|---|---|---|---|
| Worldwide | 26.7% | — | 9.9% | 12.6% | 8.2% | 12.3% |
| United States | 29.6% | — | 11.4% | 14.3% | 9.3% | 14.2% |
| United Kingdom | 37.1% | 9.0% | 5.5% | 13.9% | 12.1% | 7.8% |
| Germany | 42.2% | 9.2% | 4.9% | 17.5% | 6.0% | 5.4% |
| France | 28.3% | — | 9.1% | 19.9% | 8.4% | 6.6% |
| Brazil | 54.7% | 27.8% | 1.5% | 6.1% | 4.4% | 0.6% |
| India | 43.7% | 18.9% | — | 7.6% | 19.0% | 1.5% |
| Japan | 25.8% | 34.9% | 3.4% | 3.3% | 11.5% | 2.8% |
| Russia | 61.3% | — | 5.1% | 7.5% | 9.9% | 3.9% |
Source: Cloudflare Radar ai/bots/summary/user_agent endpoint with a per-country location filter, trailing 28 days ending June 9, 2026. Each cell is that user agent's share of the country's AI-bot requests. A dash means the crawler fell below that market's top-user-agent reporting threshold, not that it is zero. ChatGPT-User is OpenAI's live-browsing agent (it fetches a page when a person asks ChatGPT to look something up); GPTBot is OpenAI's training crawler.
Three things break the global picture.
Googlebot's dominance is a developing-market and high-regulation phenomenon. Worldwide, Googlebot is 26.7% of AI-crawler traffic. In Russia it's 61.3%, in Brazil 54.7%, in India 43.7%, in Germany 42.2%. In the United States it's just 29.6%, and in Japan only 25.8% — below the global average. Googlebot's share is highest exactly where Western AI startups crawl least: when the rest of the field doesn't show up, Google is what's left.
ChatGPT's live-browsing agent is the real AI-crawler story, and it barely registers globally. ChatGPT-User is the single largest AI crawler in Japan at 34.9%, the second-largest in Brazil at 27.8%, and 18.9% in India — yet it falls below the reporting threshold worldwide and in the US. This isn't training traffic; it's consumption. ChatGPT-User fires when a person asks ChatGPT to fetch a page, so its map is a map of where people actively use ChatGPT to browse the live web — heavily Japan, Brazil, and India, and visibly Germany and the UK. In the US, OpenAI's footprint is its training and search crawlers (GPTBot at 11.4%, plus OAI-SearchBot), not live browsing. For the user and revenue numbers underneath that usage, see the latest ChatGPT statistics.
Anthropic and ByteDance are Western-concentrated. ClaudeBot is 14.2% of US AI-crawler traffic but 0.6% in Brazil and 1.5% in India. Bytespider, ByteDance's training crawler, doesn't crack the US top tier at all, yet runs around 6-7% in France and Japan. The AI crawler you serve most depends almost entirely on where your readers sit.
What are AI crawlers actually doing?
What AI Crawlers Actually Do, May 2026: 52% Training, 9% Search
Training is the single largest purpose of AI crawling in May 2026, at 51.8% of requests — roughly flat from 51.5% in April. Mixed-purpose crawls (models that index for both training and retrieval) account for another 35.7%, down from 38.3%. Search rose to 9.3% of AI crawler traffic — real-time web retrieval on behalf of a user prompt — up from 7.5% in April. User-action crawls (browser-using agents) remain small at 2.6% but continue to grow.
Source: Cloudflare Radar · May 1 – May 31, 2026
| Label | Value |
|---|---|
| Training | 51.8% |
| Mixed Purpose | 35.71% |
| Search | 9.33% |
| User Action (agents) | 2.58% |
| Undeclared | 0.59% |
- Training crawls still outnumber search crawls more than 5-to-1 — AI remains largely extractive
- Search rose to 9.3% of AI bot traffic (from 7.5% in April) — the only category with a direct path to a referral
- Agent-driven user actions grew to 2.6%, the fastest category in proportional terms
The final Cloudflare cut is the most structurally revealing. AI bots declare a crawl_purpose header. Summed across all AI crawler traffic for the 28-day window:
- Training: 51.80%
- Mixed Purpose: 35.71%
- Search: 9.33%
- User Action: 2.58%
- Undeclared: 0.59%
Source: Cloudflare Radar get_ai_data endpoint, bots/summary/crawl_purpose dimension, full month of May 2026.
Only 9.33% of AI crawler traffic is classified as search. That's a bot fetching a page in real time on behalf of a user prompt, the AI equivalent of "Googlebot indexing in response to a query." It's the only AI crawl category with any plausible referral mechanism behind it. The other 90.67% is training or mixed-purpose extraction with no direct path back to the publisher.
That's the crux of the 2026 search engine market share story. Traditional search engines run a value exchange. They crawl, they index, they send traffic back. AI operators, on aggregate, run at the 50:1 to 11,000:1 ratio because they aren't running a search engine at all. They're running a training pipeline that occasionally (9.33% of the time) does a little search.
What this means if you do SEO, run a website, or build AI
For SEOs, the data has two simple implications. Google's share isn't moving because of AI, and that's unlikely to change in the next year. Google still sends 87.63% of search referrals, and that number moved about a quarter of a point in a month. Separately, your TikTok traffic share matters in a way it didn't 24 months ago. Any consumer-facing brand without a TikTok SEO plan is leaving roughly 3% of search-driven traffic on the table. The AI chatbot referral channel (ChatGPT, Gemini, Claude, Perplexity combined) is 0.29% of search referrals. Worth monitoring. Not yet worth optimizing for the way Bing or Yandex are. (For the user-count, revenue, and crawl footprint underlying ChatGPT's slice of that 0.27%, the latest ChatGPT statistics breakdown has the May 2026 numbers.)
For content websites, the crawl-to-refer numbers are the story. You're paying origin bandwidth to serve ClaudeBot at 11,122 pages per 1 return visit. You're paying OpenAI's training pipeline at 857:1. Some publishers have done the math and started blocking. Cloudflare's own data shows roughly 40% of top websites now block at least one major AI crawler.
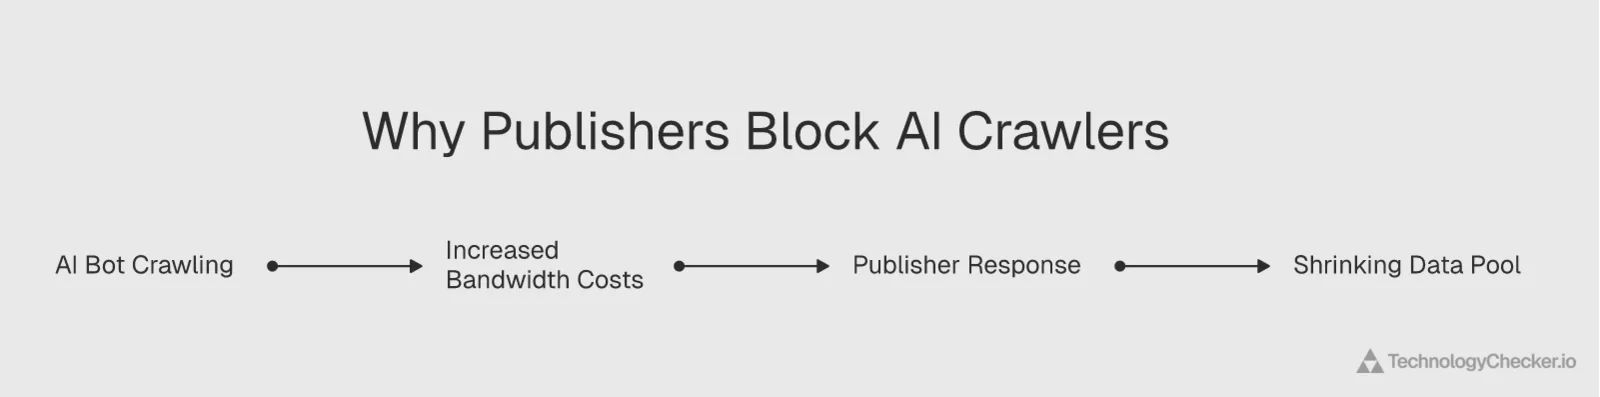
The feedback loop tightening the open web: extractive crawl ratios raise origin-bandwidth costs, publishers respond by disallowing AI bots in robots.txt, and the open training-data pool shrinks.
For AI builders, the asymmetry is also your problem in the medium term. Training data access is tightening. Every month another large publisher adds a new crawler to its robots.txt disallow list. 11,122:1 isn't sustainable. Either the industry builds genuine referral flows back to publishers, or the open web's willingness to be crawled keeps eroding and the training data pipeline narrows.
Frequently asked questions
Did AI search take referral share from Google in 2026?
No. Across the full second quarter of 2026, Google sent 87.9% of the search referral traffic Cloudflare Radar observed, and the four major AI chatbots combined (ChatGPT, Gemini, Claude, Perplexity) sent about 0.3%. ChatGPT, the only one large enough to clear Radar's quarterly reporting threshold, grew 47% year-over-year, from 0.19% to 0.28% of referrals. That is the fastest-growing source in the whole table and still one-fifth of what DuckDuckGo alone sends. AI has changed how people read answers; it has not yet changed where website traffic comes from.
Which AI crawler extracts the most content per visit it sends back?
Anthropic. Across Q2 2026, ClaudeBot crawled roughly 5,143 pages for every 1 human visit Anthropic referred back, the highest ratio of any major operator. That is a large improvement from 91,702:1 a year earlier, but it is still about a thousand times more extractive than Google's steady 5:1. OpenAI runs at 870:1 and Perplexity at 153:1. Traditional search engines and DuckDuckGo (1.7:1) sit near the healthy end, where a crawl is repaid with a referral.
Is TikTok's search referral share really collapsing?
Not in the way the raw numbers suggest. TikTok reads as 9.0% of search referrals in Q2 2025 and 3.1% in Q2 2026, but that drop is a measurement change, not a behavior change: Cloudflare reclassified a block of TikTok link-out referrals in February 2026. Any comparison of TikTok's (or Google's) referral share across that boundary mixes two different counting methods. Within the post-reclassification data, TikTok is a stable ~3% search source, still the top social-search referrer, and worth close to 10% of referrals in shopping and general-merchandise verticals.
Methodology and source data
All data in this post was pulled from the Cloudflare Radar API via the Radar MCP server on June 1, 2026, covering the full month of May. The Q2 2026-close section at the top was refreshed on July 3, 2026 using the Cloudflare Radar REST API directly (bots/crawlers/summary/referer, bots/crawlers/summary/crawl_refer_ratio, and ai/bots/summary/crawl_purpose) across full Q2 2025 and Q2 2026 quarters.
- Search engine referral share (topline):
get_bots_crawlers_dataendpoint, REFERER dimension, full month of May 2026. Control window: full month of April 2026 for month-over-month. - Search engine share by vertical:
get_bots_crawlers_dataendpoint, REFERER dimension with averticalfilter (Finance, Shopping & General Merchandise, Travel and Tourism, Computer and Electronics, Gambling), full month of May 2026. The endpoint supports a vertical filter but not a country filter, so vertical is the available segmentation for referral share. - 14-month search share trend:
get_bots_crawlers_dataendpoint, REFERER dimension,timeseries_groupsformat, 52-week window ending May 31, 2026. One data point per first full ISO week of each month. - AI platform crawl-to-refer ratios:
get_bots_crawlers_dataendpoint, CRAWL_REFER_RATIO dimension, 7-day window, May 25 to June 1, 2026. The longer windows returned an API error at query time, so the 7-day window is the operative one. - Visitor type split:
get_bots_crawlers_dataendpoint, CLIENT_TYPE dimension, full month of May 2026. - AI crawler volume:
get_ai_dataendpoint,bots/summary/user_agentdimension, full month of May 2026. - AI crawler purpose:
get_ai_dataendpoint,bots/summary/crawl_purposedimension, full month of May 2026. - Crawler month-over-month:
get_ai_dataendpoint,bots/summary/user_agentdimension, full months of April and May 2026, PERCENTAGE normalization (Bytespider 5.73% to 10.25%, Applebot 9.23% to 7.01%).
Cloudflare Radar's sample covers traffic across Cloudflare's global network of 330 cities in 125+ countries, including sites that use Cloudflare as a reverse proxy, CDN, or authoritative DNS. The sample is large (hundreds of billions of requests per day) but tilts toward the Cloudflare customer base: Western web traffic, e-commerce, media, and SaaS. Search referrer data specifically only measures referrals to Cloudflare-protected origins, so regional search engines that send traffic exclusively to non-Cloudflare destinations are under-represented. The February 2026 discontinuity in the TikTok/Google trend line is consistent with a Cloudflare-side reclassification rather than a real behavior change. Read the trend section with that caveat in mind.
No referrer data was filtered by geography, vertical, or ASN. All numbers above are global, unfiltered totals.
Data source: Cloudflare Radar (radar.cloudflare.com). Endpoints get_bots_crawlers_data (REFERER, CRAWL_REFER_RATIO, CLIENT_TYPE, USER_AGENT dimensions) and get_ai_data (bots/summary/user_agent, bots/summary/crawl_purpose dimensions). Pulled June 1, 2026 (full-month May data).

CEO & Co-founder
12+ years of experience
Mehmet is the CEO and co-founder of TechnologyChecker.
- BSc Computer Engineering, Bilkent University
- Certified SaaS Growth Strategist
- Member, British Computer Society (BCS)
Never miss our research

