Claude Statistics Q3 2026: #2 in Generative AI for 252 Days
Cloudflare Radar, Q3 2026: Claude held #2 in generative AI for 252 straight days. Anthropic now crawls 988 pages per referral, Perplexity 1,083.
Published •Updated •Data through September 2026•69 min read
Claude held #2 in Cloudflare Radar's Generative AI ranking on every day of Q3 2026, which takes the streak to 252 consecutive days (22 January to 30 September 2026). The crawler side of the quarter tells a different story. ClaudeBot carried 13.23% of AI-bot traffic in Q3, effectively tied with Meta-ExternalAgent (13.28%) for second behind Googlebot, and Anthropic's crawl-to-referral ratio improved to 988:1. For the first time since this post started tracking it, Anthropic is not the weakest return among the operators that send referrals at scale: Perplexity read 1,083:1 for the quarter.
Updated October 1, 2026 with Q3 2026 data (July to September 2026; September is provisional). This is the update promised for early October. Earlier editions are preserved in the update history at the end of this post, annotated where newer data supersedes them.
How much traffic does Claude send back to websites?
In Q3 2026 Anthropic's crawlers fetched 988 pages for every referral Claude sent back to a website, according to Cloudflare Radar's crawl-to-referral ratio. That is 37 times better than Q3 2025 (36,551:1), but it is still about 200 times Google's 4.9:1. claude.ai carried 0.28% of the search and AI referrals Cloudflare observed in the quarter.
| Operator | Q3 2025 | Q2 2026 | Q3 2026 | Sep 2026 (prov.) |
|---|---|---|---|---|
| Anthropic | 36,551:1 | 5,143:1 | 988:1 | 555:1 |
| Perplexity | 168:1 | 153:1 | 1,083:1 | 2,283:1 |
| OpenAI | 882:1 | 870:1 | 309:1 | 354:1 |
| 4.8:1 | 5.0:1 | 4.9:1 | 4.7:1 | |
| claude.ai share of referrals | 0.003% | 0.055% | 0.28% | 0.37% |
Source: Cloudflare Radar radar/bots/crawlers/summary/crawl_refer_ratio (normalization RATIO: pages crawled per referral sent, lower is better) and radar/bots/crawlers/summary/referer with limitPerGroup=30, calendar quarters and September 2026, pulled 2026-10-01.
Q3 2026 analysis: the rank held, the crawler cooled, the referrals arrived
| Metric | Q3 2025 | Q2 2026 | Q3 2026 | QoQ | YoY |
|---|---|---|---|---|---|
| Generative AI rank | not swept | #2 | #2 on 92 of 92 days | held | held |
| ClaudeBot share of AI-bot traffic | 10.26% | 13.87% | 13.23% | −0.64 pt | +2.97 pt |
| GPTBot share | 12.21% | 10.23% | 8.05% | −2.18 pt | −4.16 pt |
| ClaudeBot as a multiple of GPTBot | 0.84x | 1.36x | 1.64x | up | up |
| Claude-SearchBot share | 0.01% | 2.14% | 3.30% | +1.16 pt | +3.29 pt |
| Anthropic share of all verified-bot traffic | not in the top 10 | 4.91% | 8.84% | +3.93 pt | from outside the top 10 |
| Anthropic crawl-to-referral ratio | 36,551:1 | 5,143:1 | 988:1 | 5.2x better | 37x better |
Source: Cloudflare Radar radar/ai/bots/summary/user_agent, radar/bots/summary/bot_operator, radar/bots/crawlers/summary/crawl_refer_ratio and radar/ranking/internet_services/top?serviceCategory=Generative AI (daily snapshots), calendar quarters, pulled 2026-10-01. Q3 2026 is provisional.
I read Q3 as Anthropic changing what its crawling is for, and the referral side is where that shows up. Crawl share barely moved between Q2 and Q3, but referrals per page crawled rose roughly fivefold. For a publisher deciding whether to block ClaudeBot, that changes the arithmetic: in Q2 you handed Anthropic 5,143 pages for one visit back, and in Q3 it was 988. That is still a poor trade next to Google's 4.9, and it depends heavily on what kind of site you run (the vertical table below shows how heavily). It is the first quarter where Claude sends back enough traffic to put a number on what blocking it costs.
Grading two earlier calls. The August edition said a year of ClaudeBot swings had netted to zero (11.88% in August 2026 against 11.92% a year earlier). That held for August and no further: September read 12.00% against 7.90% in September 2025, and the quarter is up 2.97 points. The July edition said Anthropic still returned the least traffic of any operator with real referral volume. Q3 overturns it.
Two smaller Q3 movements. Claude-SearchBot, Anthropic's search crawler, averaged 3.30% for the quarter but slipped to 2.72% in September after four straight monthly rises. And the third Anthropic agent, Claude-User (the fetch Claude makes when a person asks it about a page), registered 0.38% of AI-bot traffic in Q3. The #2 Generative AI rank never wavered: I swept all 30 September days individually and Claude was #2 on 30 of 30, so with the July and August sweeps every day of the quarter is verified. Rank 3 kept alternating between Perplexity and Gemini until 24 September, after which the daily snapshots show Gemini outside the top five (provisional until the re-pull).
2026 month by month: ClaudeBot, GPTBot and the referral ratio
| Month (2026) | ClaudeBot | GPTBot | Claude-SearchBot | Anthropic (all verified bots) | Anthropic crawl:refer | claude.ai referrals |
|---|---|---|---|---|---|---|
| January | 11.84% | 12.65% | below top 10 | below top 10 | 47,265:1 | below top 10 |
| February | 10.40% | 12.94% | below top 10 | below top 10 | 25,023:1 | below top 10 |
| March | 11.81% | 11.85% | below top 10 | below top 10 | 12,526:1 | below top 10 |
| April | 11.62% | 9.82% | below top 10 | below top 10 | 11,136:1 | below top 10 |
| May | 9.92% | 11.27% | 2.06% | below top 10 | 12,854:1 | below top 10 |
| June | 19.77% | 9.40% | 3.27% | 12.69% | 3,386:1 | below top 10 |
| July | 16.54% | 9.73% | 3.54% | 10.97% | 1,917:1 | below top 10 |
| August | 11.88% | 8.34% | 3.69% | 8.47% | 926:1 | 0.30% |
| September (prov.) | 12.00% | 6.26% | 2.72% | 7.29% | 555:1 | 0.37% |
| Jan to Sep | +0.16 pt | −6.39 pt | 85x better |
Source: Cloudflare Radar radar/ai/bots/summary/user_agent, radar/bots/summary/bot_operator, radar/bots/crawlers/summary/{crawl_refer_ratio,referer}, calendar months, pulled 2026-10-01. "Below top 10" means outside the ranked list Cloudflare returns for that month. September cross-checked against a daily timeseries pull: the daily mean reads 11.95% for ClaudeBot against 12.00% from the monthly summary.
RATIO normalization, not a percentage. The 252-day streak is a day-by-day sweep of ranking/internet_services/top, not an inference from monthly snapshots. There is no first-party layer in this post: our crawler has no Anthropic detection signature.By vertical: Claude's referrals land on tech sites
The 988:1 quarterly average describes almost nobody. Cloudflare's crawl-to-referral ratio can be filtered by the vertical of the destination site, and the spread across verticals is three orders of magnitude.
| Destination vertical (share of crawler requests) | Anthropic | OpenAI | Perplexity | |
|---|---|---|---|---|
| Computer and Electronics (19.25%) | 25:1 | 441:1 | 651:1 | 4.0:1 |
| Internet and Telecom (20.80%) | 859:1 | 353:1 | 1,044:1 | 4.2:1 |
| Shopping and General Merchandise (25.71%) | 7,123:1 | 345:1 | 661:1 | 8.9:1 |
| Finance (2.60%) | 11,505:1 | 671:1 | 219:1 | 3.3:1 |
| News, Media and Publications (8.63%) | 13,766:1 | 953:1 | 484:1 | 2.5:1 |
| Gambling (6.63%) | 560,548:1 | 4,061:1 | no finite ratio | 1.8:1 |
Source: Cloudflare Radar radar/bots/crawlers/summary/crawl_refer_ratio?vertical=… and radar/bots/crawlers/summary/vertical, Q3 2026, pulled 2026-10-01. The vertical filter is validated (an invalid value returns error 2001). Ratios inside a single vertical rest on smaller referral counts than the all-site figure and can move sharply from quarter to quarter; the gambling row reflects near-zero referrals and should not be read as a behavior.
If you run a news or finance site, the Q3 improvement mostly did not reach you, and the blocking decision looks much as it did in the spring. If you publish developer documentation or hardware reviews, Claude now behaves more like a search engine than a scraper on your pages. Neither of those shows up in a single sitewide number, which is why I would check the ratio for your own vertical before changing robots.txt.
What changed in 2026: a month-by-month look
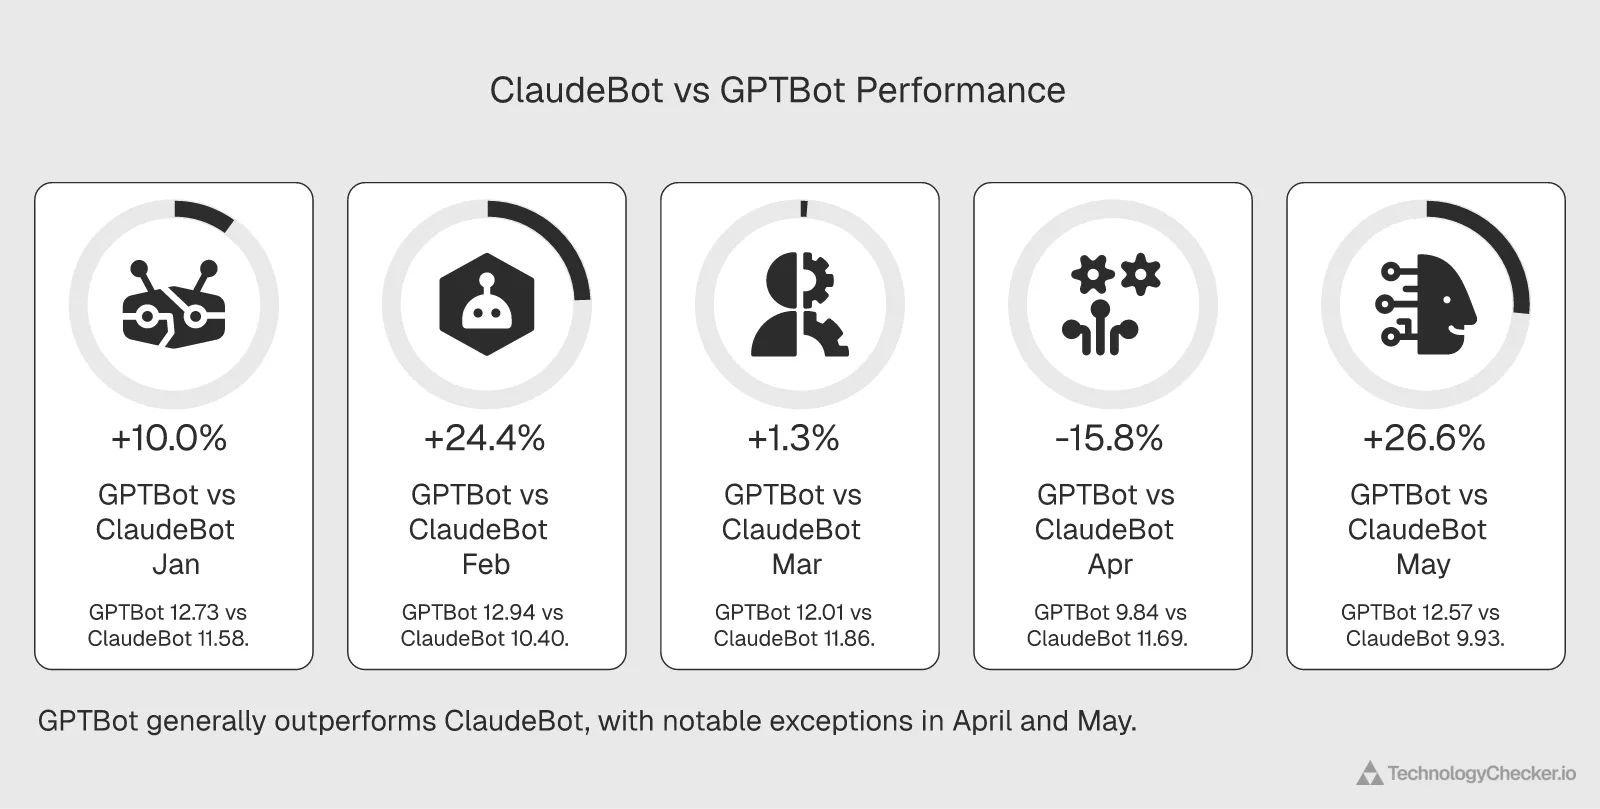
I pulled this dataset month by month for 2026 so far, refreshed on June 1, 2026, re-verified on July 3, 2026 with the full month of June added, and refreshed again on August 1, 2026 with July added. The ChatGPT-side post on this same data set is here: ChatGPT statistics for 2026. Claude tells the inverse story.
| Month (2026) | ClaudeBot share | GPTBot share | Δ (Claude – GPT) | ClaudeBot rank | Notes |
|---|---|---|---|---|---|
| January | 11.58% | 12.73% | −1.15 pt | #3 | ClaudeBot trails GPTBot in the opening month |
| February | 10.40% | 12.94% | −2.54 pt | #4 | Widest 2026 gap; Meta-ExternalAgent takes #2 from Googlebot |
| March | 11.86% | 12.01% | −0.15 pt | #4 | Near-parity |
| April | 11.69% | 9.84% | +1.85 pt | #3 | ClaudeBot beats GPTBot for the first time in 2026 |
| May | 9.73% | 11.48% | −1.75 pt | #5 | GPTBot reclaims the lead; Bytespider passes ClaudeBot; Claude-SearchBot debuts at 2.22% |
| June | 19.77% | 9.40% | +10.37 pt | #2 | ClaudeBot reverses hard, nearly doubles, and vaults to #2 overall behind Googlebot; Claude-SearchBot rises to 3.27% |
| July | 16.28% | 9.74% | +6.54 pt | #2 | The surge peaks: ClaudeBot gives back 3.48 points but keeps #2 and a 1.7x lead over GPTBot; Claude-SearchBot 3.54% |
July 2026 row added on the August 1, 2026 refresh. Source: Cloudflare Radar ai/bots/summary/user_agent (normalization PERCENTAGE), full-month July 2026.
Newest row first, July 2026. (The four movements described after this paragraph cover January through June and are preserved as originally published.) June was the top, not a waypoint. ClaudeBot fell 3.48 points to 16.28% while GPTBot ticked up to 9.74%, cutting the gap from 10.37 points to 6.54. Rank didn't change, so the headline holds: ClaudeBot is the #2 AI crawler on Cloudflare's network and it still pulls about 1.7x GPTBot's volume. What changed is the slope. I split July in half to check whether one week was doing the work, and it wasn't: ClaudeBot ran 18.05% over July 1-15 and 14.65% over July 16-31, so the decline is spread across the month and still going at the end of it. The trailing seven days to August 1 read 14.04%, below the full-month figure again.
Four movements matter most. The April flip: ClaudeBot pulled 1.85 points ahead of GPTBot, the first time in any 2026 month. May reversed it, and Bytespider edged past ClaudeBot too, dropping it to #5. Claude-SearchBot appearing in raw user-agent telemetry at 2.22% means Anthropic's second crawler is now showing up in publisher logs alongside ClaudeBot for the first time. Then June overturned May completely: ClaudeBot nearly doubled to 19.77%, passed every crawler except Googlebot to reach #2 overall, and opened a 10.37-point gap over GPTBot, the widest ClaudeBot lead of the year.
My read: Anthropic ran a heavy training burst in April, likely tied to Claude Opus 4.7 (shipped April 16). OpenAI's May ramp-up reversed it. Then June flipped it back and then some, as ClaudeBot didn't just recover but nearly doubled and passed everything except Googlebot. May's "lead lost" turned out to be a one-month dip, not a trend; from the ChatGPT side, June reversed the very headline the chatgpt-statistics post led with in May.
Claude statistics 2026: key highlights table
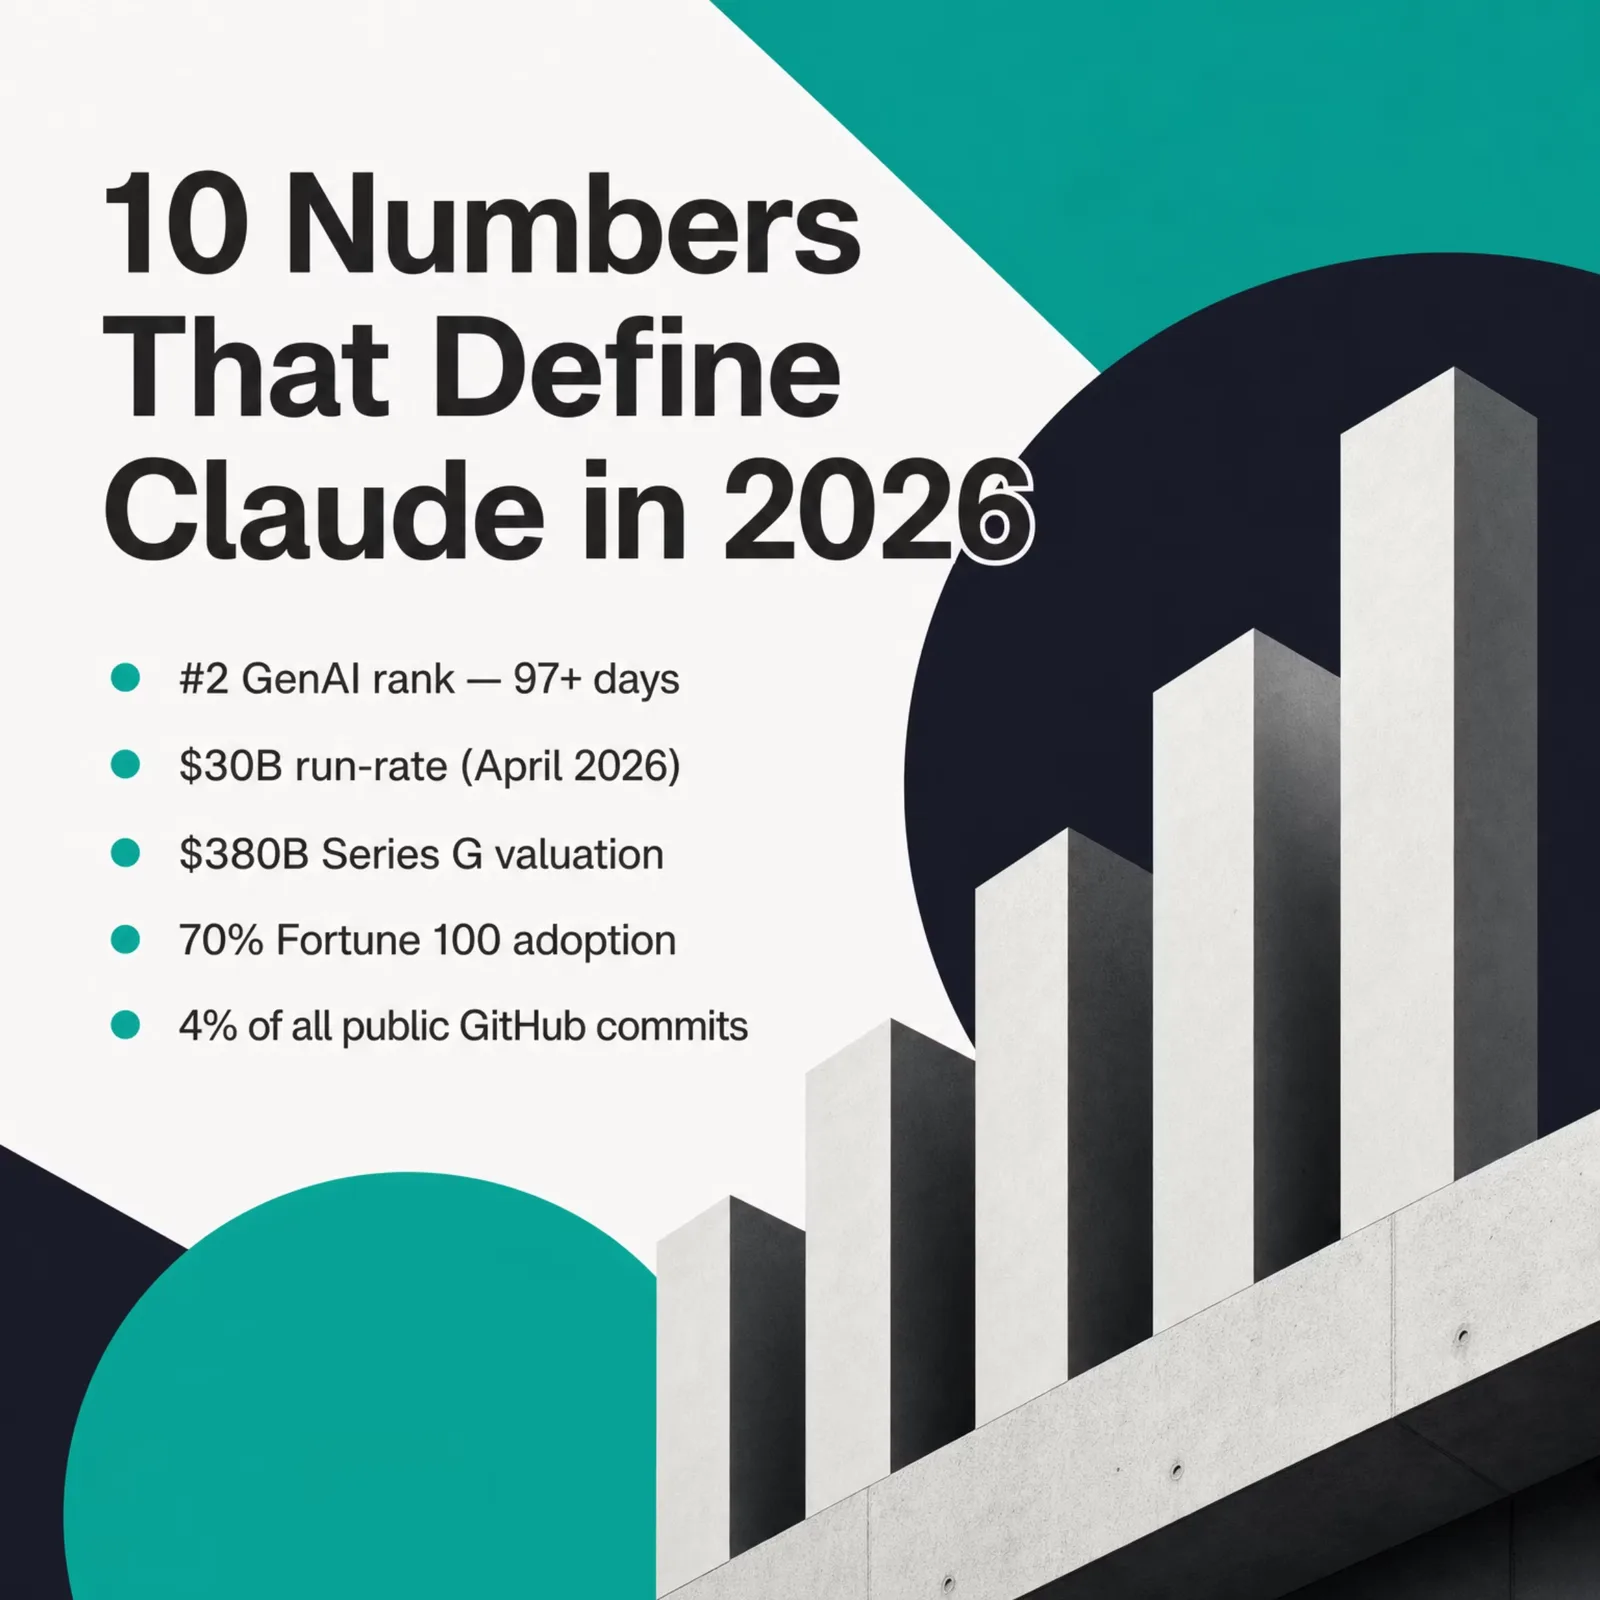
These are the numbers I keep going back to when sales or product teams ask what Claude's 2026 position actually looks like. Rows 1 to 10 are the July 3, 2026 set, preserved as published; rows 11 to 13 are the August 1, 2026 additions and carry the current figures. I cross-referenced each against Cloudflare Radar (crawl and ranking), Anthropic's news index (releases and revenue), SaaStr / VentureBeat (ARR), and Anthropic's Economic Index reports (adoption).
| # | Statistic | Value | As of | Source |
|---|---|---|---|---|
| 1 | Generative AI ranking | #2 every day for 129+ days | July 3, 2026 | Cloudflare Radar |
| 2 | Annualized revenue (run-rate) | $30 billion | April 2026 | VentureBeat |
| 3 | Annualized revenue (ARR, exit-2025 trajectory) | $14 billion | February 2026 | SaaStr |
| 4 | Series G valuation | $380 billion | February 2026 | DemandSage |
| 5 | Fortune 100 adoption | 70% | Early 2026 | The AI Corner |
| 6 | Claude Code annualized revenue | $2.5 billion run-rate (9 months) | February 2026 | SerpSculpt |
| 7 | Claude Code GitHub commit share | 4% of all public commits | Early 2026 | SemiAnalysis |
| 8 | ClaudeBot June 2026 share (AI bot traffic) | 19.77% (#2) | June 2026 | Cloudflare Radar |
| 9 | ClaudeBot 2025 peak / trough | 14.81% / 5.60% (2.64x volatility) | 2025 | Cloudflare Radar |
| 10 | Major model releases shipped in 2025 | 5 (Sonnet 3.7, Sonnet 4, Opus 4, Sonnet 4.5, Haiku 4.5, Opus 4.5) | Full-year 2025 | Anthropic news |
| 11 | ClaudeBot July 2026 share (AI bot traffic) | 16.28% (#2), down 3.48 pt from June | July 2026 | Cloudflare Radar |
| 12 | Generative AI ranking, re-verified daily | #2 for 191 consecutive days (Jan 22 – Aug 1) | August 1, 2026 | Cloudflare Radar |
| 13 | Anthropic crawl-to-referral ratio | 1,917:1, from 3,386:1 in June | July 2026 | Cloudflare Radar |
If you're evaluating Claude for enterprise pilots in 2026, these are the baseline numbers. Two rows (the 129-day streak and the monthly ClaudeBot/GPTBot data) come from a dataset competitors don't pull on the same cadence. That's the spine of this post. Row 1's "129+ days" is the floor we could prove in July; row 12 is what a full daily sweep found on August 1, and it supersedes the floor without contradicting it.
Anthropic revenue and financial performance

Headline trajectory: $1B annualized at end-2024, $14B by February 2026, $30B run-rate by April 2026. Chart below for the month-by-month shape. For the macro context, see our AI market size statistics 2026 — Anthropic's growth fits inside a $1.67T total addressable market forecast by 2031.
Anthropic ARR Growth 2024-2026: $1B to $30B Run-Rate in 16 Months (30x)
Anthropic's annualized revenue grew from $1 billion at the end of 2024 to a reported $30 billion-plus annualized run-rate by April 2026 — a 30x expansion in 16 months. The trajectory crossed $9 billion by year-end 2025 and $14 billion by February 2026 when the company closed its $30 billion Series G at a $380 billion valuation. The full-year 2025 step (1x to 9x) was the steepest, driven by Claude Code (which hit $2.5B run-rate in nine months) and enterprise expansion to 70 percent of the Fortune 100.
Source: fatjoe.com, the-ai-corner.com, demandsage.com · End-2024 to April 2026
| Reporting milestone | Annualized revenue (USD billions) |
|---|---|
| End of 2024 | $1B |
| End of 2025 | $9B |
| Feb 2026 | $14B |
| Apr 2026 (run-rate) | $30B |
- $1B → $14B in 14 months is a 14x jump — among the fastest ARR ramps in SaaS history
- End-2025 ARR ($9B) was 9x the end-2024 figure, the steepest calendar-year leap
- $30B April 2026 run-rate puts Anthropic ahead of its own $15B guidance for full-year 2026
- Enterprise customers spending over $100K annually grew approximately 7x year-on-year through 2025
Revenue growth timeline
| Period | Annualized run-rate | Year-over-year growth |
|---|---|---|
| End 2024 | $1 billion | Baseline |
| End 2025 | $9 billion | 9x |
| February 2026 | $14 billion | 14x in 14 months |
| April 2026 | $30 billion | 30x from end-2024 |
The 14x climb in 14 months gets the repeats. The April $30B run-rate, reported by VentureBeat, is what reframes the story. AI Business Weekly reports Anthropic's enterprise revenue surpassed OpenAI's by mid-2025, with 29% enterprise market share in the same window.
The Series G context

The Series G closed February 2026 at a $380B post-money valuation, with $30B in fresh primary capital, per DemandSage. The largest single funding round in private-tech history at the time. The capital is being deployed against Anthropic's training-compute curve, which SemiAnalysis describes as "on track to add as much power as OpenAI in the next three years."
Where the revenue comes from
Anthropic reported 300,000+ paying business customers and 1,000+ accounts spending more than $1M/year by early 2026, per FatJoe's compilation citing Anthropic disclosures. The AI Corner reports enterprise customers spending over $100,000 annually grew 7x year on year, and paid subscribers more than doubled between October 2025 and early 2026.
Claude Code accounts for $2.5B of the $14B February figure, hitting the $1B annualized mark in six months and $2.5B in nine, per SerpSculpt, echoed by getpanto.ai. The highest revenue ramp for a single developer product since GitHub Copilot's launch.
ARR vs run-rate: a framing note
"ARR" and "run-rate" are reported interchangeably by Anthropic and the press, but they aren't identical. ARR is contracted recurring revenue. Run-rate is the latest month annualized. The $30B April 2026 figure from VentureBeat is the latter. I treat them as broadly comparable below, but flag it here so you can discount accordingly.
For broader context on the GenAI cohort, our Q1 2026 AI adoption telemetry compares Anthropic's curve against the rest of the market.
Claude model releases: the cadence that shipped 2025 and powers 2026

The 2025 release lineage
Anthropic shipped five major Claude releases in 2025. February brought Claude 3.7 Sonnet with the extended-thinking hybrid reasoning mode. May was the version-4 jump: Sonnet 4 and Opus 4 launched together on May 22, 2025. Then Sonnet 4.5 on September 29, Haiku 4.5 on October 15, and Opus 4.5 on November 24, a capstone that refreshed all three tiers within a single quarter for the first time in the family's history.
Claude Model Release Cadence 2024-2026: Anthropic Shipped 5 Major Models in 2025
Anthropic shipped 5 major Claude model releases in calendar 2025 — a 67 percent increase over 2024's 3 release events. The 2025 cadence (one release every ~73 days) was nearly twice the pace of 2024 (one every ~140 days). 2026 (partial, through May 18) already shows 3 release events at a sustained 2025-equivalent tempo.
Source: Anthropic news releases · 2024-2026 (partial)
| Year | Number of Claude model release events |
|---|---|
| 2024 | 3 |
| 2025 | 5 |
| 2026 (Jan-May) | 3 |
- Anthropic's 2025 release cadence was 1.67x faster than 2024 (5 vs 3 events)
- Average days between releases dropped from ~140 in 2024 to ~73 in 2025
- Q4 2025 alone shipped 3 releases (Sonnet 4.5, Haiku 4.5, Opus 4.5) — the first quarter all three model tiers were refreshed simultaneously
- 2026 partial-year pace through May (3 releases in 4.5 months) already matches 2025's tempo
The release cadence flip: 140 days to 75 days
2024 averaged about 140 days between releases (three: Claude 3 family in March, 3.5 Sonnet in June, the October upgrade that brought 3.5 Haiku and computer use). 2025 averaged about 75 days. Almost twice as fast. Faster shipping correlates directly with the crawler-traffic and revenue inflections later in the year. Each new model drives a fresh round of training crawls and enterprise eval runs, plus the migration projects that follow once procurement signs off.
What's already shipped in 2026
Three releases in the first four and a half months: Opus 4.6 on February 5, Sonnet 4.6 on February 17 (twelve days later), Opus 4.7 on April 16. Anthropic is on a similar 75-day pace as 2025. Opus 4.7 is what most enterprise pilots I've talked to are currently running against.
| Release date | Model | Tier | Notable |
|---|---|---|---|
| 2024-03-04 | Claude 3 (Opus, Sonnet, Haiku) | Family launch | Three-tier structure debuts, vision capabilities |
| 2024-06-20 | Claude 3.5 Sonnet | Sonnet | Outperformed the larger Opus 3 on benchmarks |
| 2024-10-22 | Claude 3.5 Sonnet upgrade + 3.5 Haiku | Sonnet + Haiku | Computer use public beta |
| 2025-02-24 | Claude 3.7 Sonnet | Sonnet | Hybrid reasoning / extended thinking mode |
| 2025-05-22 | Claude Sonnet 4 + Opus 4 | Sonnet + Opus | Major version 4 launch |
| 2025-09-29 | Claude Sonnet 4.5 | Sonnet | Powers agentic coding workflows |
| 2025-10-15 | Claude Haiku 4.5 | Haiku | Fast, low-cost tier refresh |
| 2025-11-24 | Claude Opus 4.5 | Opus | End-of-2025 capstone |
| 2026-02-05 | Claude Opus 4.6 | Opus | First 2026 release |
| 2026-02-17 | Claude Sonnet 4.6 | Sonnet | Twelve days after Opus 4.6 |
| 2026-04-16 | Claude Opus 4.7 | Opus | Stronger agents, vision, multi-step tasks |
Anthropic's own Claude Sonnet 4.5 announcement and broader news index carry the canonical release notes (see methodology for source links).
What Cloudflare Radar reveals about ClaudeBot in 2026
I pulled the full 52-week ClaudeBot timeseries via get_ai_data on June 1, 2026, normalized as share of AI bot requests on Cloudflare's network, then re-pulled monthly aggregates for 2026 specifically (June added on the July 3, 2026 refresh). The story is the April win, the May reversal, and the June comeback that undid it. July, added on the August 1, 2026 refresh, adds a fourth beat: the comeback had a ceiling.
AI bot crawl share — 2026 month-by-month
The monthly aggregate is the cleanest cut of the data. Every full month of 2026 through July:
| Month (2026) | ClaudeBot | GPTBot | Googlebot | Meta-ExternalAgent | Bytespider | ClaudeBot rank |
|---|---|---|---|---|---|---|
| January | 11.58% | 12.73% | 38.21% | 11.07% | 3.55% | #3 |
| February | 10.40% | 12.94% | 35.94% | 14.27% | 3.28% | #4 |
| March | 11.86% | 12.01% | 31.66% | 16.38% | 3.58% | #4 |
| April | 11.69% | 9.84% | 30.28% | 14.91% | 5.73% | #3 |
| May | 9.73% | 11.48% | 27.26% | 13.23% | 10.25% | #5 |
| June | 19.77% | 9.40% | 25.18% | 10.20% | 7.65% | #2 |
| July | 16.28% | 9.74% | 24.52% | 12.65% | 5.14% | #2 |
Source: Cloudflare Radar ai/bots/summary/user_agent (normalization PERCENTAGE), calendar-month windows. July 2026 row pulled 2026-08-01.
Two side stories worth flagging. Meta-ExternalAgent quietly took the #2 AI-bot slot from Googlebot in February; Googlebot's share fell from 38.21% in January to 27.26% in May. And Bytespider nearly tripled in the same window (3.55% to 10.25%), passing ClaudeBot to become the #4 AI crawler. That mirrors the chatgpt-statistics finding of Bytespider's surge. By June both side stories had turned: Googlebot slid further to 25.18%, ClaudeBot reclaimed #2 (from Meta-ExternalAgent), and Bytespider fell back to 7.65% as ClaudeBot passed it again.
July 2026 update to both side stories. Googlebot kept sliding, to 24.52%, its lowest month of the year. Meta-ExternalAgent went the other way and climbed to 12.65%, taking third back from GPTBot. Bytespider fell again, to 5.14%. ClaudeBot held #2 through all of it even while its own share dropped, which is the part that matters for the ranking claim this post is built on.
Like for like: July 2025 against July 2026. A one-month sample against a quarter isn't a trend, so here is the comparison that is actually clean. Same calendar month, one year apart.
| User agent | July 2025 | July 2026 | Δ |
|---|---|---|---|
| Googlebot | 42.69% | 24.52% | −18.17 pt |
| ClaudeBot | 11.23% | 16.28% | +5.05 pt |
| Meta-ExternalAgent | 8.44% | 12.65% | +4.20 pt |
| GPTBot | 13.15% | 9.74% | −3.41 pt |
| Bingbot | 10.30% | 8.92% | −1.38 pt |
Source: Cloudflare Radar ai/bots/summary/user_agent (normalization PERCENTAGE), full-month July 2025 and full-month July 2026. Both windows pulled 2026-08-01.
Read the ClaudeBot and GPTBot rows together. In July 2025 GPTBot led by 1.93 points. In July 2026 ClaudeBot leads by 6.54. That's an 8.47-point swing in the gap over twelve months, and it's the strongest Anthropic-side number in this refresh. It also survives the July give-back: even after shedding 3.48 points from the June peak, ClaudeBot's July share sits 45% above where it was a year earlier. Googlebot is the other half of it. Google lost 18 points of AI-bot share in a year, and most of what it gave up went to Anthropic and Meta rather than to OpenAI.
ClaudeBot crawl share by country (June 2026 refresh)
The month-by-month numbers above are worldwide. When I re-ran the same bots/summary/user_agent dimension on June 12, 2026 and filtered it by country (trailing 28 days, May 15 – June 12), two things stood out. First, ClaudeBot's global share had rebounded to 13.65%, well above its 9.73% full-month-May trough — the early-June recovery I said I'd watch for. Second, ClaudeBot's footprint is wildly uneven by market: it's the #2 crawler in the United States at 15.65%, but only the #8 crawler in India at 1.67%, a roughly 9x spread.
| Market | ClaudeBot | Claude-SearchBot | Combined Anthropic | ClaudeBot rank | Lead crawler (for scale) |
|---|---|---|---|---|---|
| United States | 15.65% | 3.26% | 18.91% | #2 | Googlebot 29.35% |
| Global | 13.65% | 2.83% | 16.48% | #2 | Googlebot 26.65% |
| United Kingdom | 8.79% | <2%* | 8.79%+ | #5 | Googlebot 38.31% |
| India | 1.67% | <2%* | 1.67%+ | #8 | Googlebot 44.09% |
Share of AI-bot HTTP requests on Cloudflare's network, trailing 28 days to June 12, 2026 (get_ai_data → bots/summary/user_agent, location-filtered). *Below that market's top-10 cutoff, folded into Cloudflare's "other" bucket.
Two reads. Claude-SearchBot, the navigational crawler, is climbing fast — 2.83% globally and 3.26% in the US, up from its 2.22% May debut — so the search-referral signal I flag below is strengthening month over month. And the US-vs-India gap mirrors the country-vertical split later in this post: Anthropic crawls hardest where the high-value commerce and tech web lives (the US), and barely registers in India, where Googlebot (44%) and ChatGPT-User (20%) dominate the AI-crawl mix instead.
Update (full-month June 2026): the recovery ran well past this trailing-28-day snapshot. ClaudeBot's worldwide share closed June at 19.77% (see the month-by-month table above), so the 13.65% reading on June 12 was an early, understated glimpse of the full comeback rather than its ceiling. The per-market ranks in the table stay as that June-12 snapshot; I didn't re-pull each country, but the worldwide surge makes it very unlikely ClaudeBot's US #2 position slipped. Claude-SearchBot kept climbing on the same curve, from 2.83% globally on June 12 to 3.27% across the full month.
The April crawl lead Anthropic lost in May
Two sentences. ClaudeBot beat GPTBot in April 2026 (11.69% vs 9.84%, +1.85 points). May reversed it (9.73% vs 11.48%, −1.75 points). A 3.6-point swing in a single month, on a dataset where the typical month-to-month delta is under 1 point.
What does it mean for training data freshness? Crawl share is the leading indicator of which model will have the most up-to-date training corpus six months out. If Anthropic's May trough holds, Claude's late-2026 release (whatever follows Opus 4.7) will be trained on a thinner June-July web slice than GPT-5. The chatgpt-statistics post covers this same moment from OpenAI's side, where it reads as a clean win. From Anthropic's side, it's the question that hangs over Opus 4.7's successor.
I'm cautious about over-reading any single month. But I want to see whether the May trough is a one-time pull-back or the start of a sustained second-place quarter for ClaudeBot. The next update to this post will answer that.
August 2026 update: the June surge peaked
This is the newest layer in this post. The June update it grades sits directly below, preserved as originally published. (Newest as of 1 August 2026. The Q3 2026 analysis at the top of this post is now the newest layer.)
In the full month of July 2026, ClaudeBot fell to 16.28% of AI-bot traffic from June's 19.77%. That's a 3.48-point drop and the largest single-month decline ClaudeBot has posted in 2026. GPTBot barely moved, to 9.74%. The ranking survived and the lead survived. The direction of travel did not.
Grading the June call: half right. June was a genuine reversal of the May trough, and the section below reads that correctly. What it also said was that the surge was "holding and even firming into July," on the strength of trailing 7-day and 28-day windows that both read above 20% on July 2. Those windows were measuring the tail of June, not the start of July. The full calendar month says the peak was June. That's the correction, and it's the reason this post keeps calendar months as its spine instead of trailing windows.
Three things July does say, ordered by how much weight I'd put on them.
First, ClaudeBot is still the #2 AI crawler and still outcrawls GPTBot by 6.54 points, about 1.7x. Adding Claude-SearchBot (3.54%, up from 3.27% in June) puts Anthropic's two crawlers at 19.82% combined against Googlebot's 24.52%. In June that combined figure was 23.04% and sat roughly two points behind Google. In July the gap widened to 4.70 points.
Second, the decline is spread across the month rather than parked on one bad week. July 1-15 reads 18.05%. July 16-31 reads 14.65%. The trailing seven days to August 1 read 14.04%. Three cuts, same direction, and the last one is below the full-month figure, so it was still easing when the month closed.
Third, at operator level, which counts every Anthropic user agent rather than ClaudeBot alone, Anthropic is #3 at 10.97% behind Google (27.05%) and Meta (14.60%), running about 1.7x OpenAI's 6.54%. June's ordering was the same, with Anthropic at 12.69%. Anthropic lost volume, not position.
What I won't do is call one month down the start of a decline. One month down after one month up is how this series behaves, and the ClaudeBot-versus-GPTBot lead has changed shape three times in four months. The number worth planning against is the year-over-year one, and it isn't ambiguous: ClaudeBot 11.23% to 16.28%, GPTBot 13.15% to 9.74%.
Source: Cloudflare Radar ai/bots/summary/user_agent (normalization PERCENTAGE), full-month July 2026, cross-checked against the two July half-months and the trailing 7-day window. Operator figures from bots/summary/bot_operator. Pulled 2026-08-01.
June 2026 update: the May trough didn't hold
The next update is here, and it answers the question cleanly: the May dip was a one-time pull-back, not the start of a second-place quarter. In the full month of June 2026, ClaudeBot didn't just recover its April level, it nearly doubled to 19.77% of AI-bot traffic while GPTBot slipped to 9.40%. That swing vaulted ClaudeBot past Meta-ExternalAgent, GPTBot, and Bytespider to the #2 AI crawler overall, behind only Googlebot (25.18%). Add Claude-SearchBot's 3.27% and Anthropic's two crawlers reach 23.04% combined, within about two points of Googlebot at the very top of the table.
Three things stand out. First, this is not a one-day artifact: the trailing-28-day window (Jun 4 to Jul 2) reads ClaudeBot 20.53%, and the trailing-7-day window (Jun 25 to Jul 2) reads 20.43%, both above the full-month figure, so the surge is holding and even firming into July. ⚠️ Superseded by the August update above; preserved as originally published. Full-month July came in at 16.28%, so those trailing windows were reading June's tail rather than July's start. Second, at the operator level the May "neck-and-neck with OpenAI" framing is gone: Anthropic's 23.04% combined now runs roughly 2.4x GPTBot's 9.40% and trails only Google. Third, the training-freshness worry from the section above inverts.
Here is the inversion in plain terms. The section above worried that a sustained ClaudeBot trough would leave Claude's next model training on a thinner June-July web slice than GPT-5. June says the opposite happened: Anthropic crawled roughly 2.1x GPTBot's volume, so on this reading the training-freshness edge tilts toward Claude, not away from it. The chatgpt-statistics post covers the same reversal from OpenAI's side, where June undid the May headline; our AI crawler statistics report tracks the broader crawl-purpose and operator trends behind it. I'd still price the volatility, not the current leader: the lead has changed hands in back-to-back months, and a single quarter of dominance is not a permanent order.
Source: Cloudflare Radar ai/bots/summary/user_agent, full-month June 2026, cross-checked against the trailing 7-day and 28-day windows. Pulled 2026-07-03.
The 2025 ClaudeBot trajectory: a 2.64x volatility ratio
ClaudeBot Share of AI Bot Traffic 2025: From 8.5% to 12.5% Peak, with a 6% Trough in November
ClaudeBot's share of all AI bot traffic on Cloudflare's global network across calendar 2025. Monthly averages computed from weekly Cloudflare Radar data. The series shows a summer surge (peaking at 12.46% in July), a deep autumn decline (6.95% in November — the lowest since pre-Claude-3.5), and a Q4 recovery back to 11.73% by December as the Opus 4.5 release drove fresh crawling activity.
Source: Cloudflare Radar · May-December 2025
| Month (2025) | Share of AI bot traffic on Cloudflare network (percent) |
|---|---|
| May 2025 | 8.49% |
| Jun 2025 | 10.41% |
| Jul 2025 | 12.46% |
| Aug 2025 | 11.35% |
| Sep 2025 | 7.78% |
| Oct 2025 | 7.51% |
| Nov 2025 | 6.95% |
| Dec 2025 | 11.73% |
- ClaudeBot peaked at 12.46% of all AI bot traffic in July 2025 — its highest monthly share to date
- November 2025 trough of 6.95% was a 44% drop from the July peak in just 4 months
- December 2025 recovery to 11.73% coincided with the Claude Opus 4.5 release on November 24, 2025
- ClaudeBot was the only major AI crawler with a 2.6x volatility ratio in 2025 (peak/trough)
Three numbers carry the 2025 story:
- Peak: 14.81% share the week of 2025-07-21. Summer 2025 was ClaudeBot's most aggressive crawling window of the year.
- Trough: 5.60% share the week of 2025-11-24. That's a 62% drop from the July peak in 18 weeks.
- Recovery: 13.77% share by the week of 2025-12-29. Almost a complete bounce to peak levels before the calendar flipped.
That peak-to-trough-to-recovery shape produces a 2.64x volatility ratio across 2025, roughly double the swing GPTBot showed in the same period. The November dip overlaps with the Cloudflare service degradation incident on 2025-11-18 (11:48–14:42 UTC, per Cloudflare's status page), so the very lowest readings should carry a small caveat. The surrounding weeks confirm the broader dip is real, not an instrumentation artifact.
By the week of 2025-12-29, ClaudeBot held the #2 spot on Cloudflare's AI bot user-agent leaderboard at 13.77%, behind only Googlebot (37.81%) and ahead of GPTBot (12.47%). That's the year-end ranking that flipped during 2026.
What AI crawlers actually do: the 2026 crawl-purpose shift
Looking at Cloudflare's crawl_purpose breakdown across the full month of May 2026:
| Crawl purpose | Full-month May 2026 | 52w aggregate (Jun 2025 – Jun 2026) | Δ |
|---|---|---|---|
| Training | 51.80% | 40.90% | +10.90 pt |
| Mixed-purpose | 35.71% | 49.06% | −13.35 pt |
| Search | 9.33% | 7.56% | +1.77 pt |
| User action | 2.58% | 2.04% | +0.54 pt |
| Undeclared | 0.59% | 0.43% | +0.16 pt |
Training-only crawls are now the dominant single mode, having overtaken mixed-purpose during 2026. That's the most consequential shift in the crawl-purpose data this year. AI operators are increasingly willing to declare training intent in their user agents, which matters for publishers thinking about robots.txt policy. The combined training + mixed share sits at 87.51%, consistent with our robots.txt AI crawler patterns report from earlier in 2026 (89.4% in Q1). By full-month June 2026, training eased to 47.25% and mixed-purpose rose to 39.03% as the late-June training peak rolled off; our AI crawler statistics report tracks that shift across the full year.
July 2026 update. Training eased again, to 44.54%, with mixed-purpose at 39.99% and search up to 11.57%. The year-over-year cut is the larger movement: in July 2025 the mix ran mixed-purpose 54.61% and training 35.74%, so the two have swapped places over twelve months. Crawl purpose is the AI crawler statistics report's beat rather than this post's, so that's where the full breakdown lives. Source: Cloudflare Radar ai/bots/summary/crawl_purpose (normalization PERCENTAGE), full-month July 2025 and full-month July 2026.
⚠️ Superseded 1 October 2026: Cloudflare has since relabelled its crawl-purpose history, moving volume from Search into Training. Re-pulled on 1 October 2026, May 2026 reads Training 50.07%, Mixed 42.88%, Search 3.96%; June reads 52.66% / 39.03% / 4.98%; July reads 50.78% / 39.80% / 5.54%; Q3 2026 reads 47.62% / 38.86% / 8.26%. The figures above are preserved as originally published. Our AI crawler statistics report carries the revised series.
ClaudeBot vs Claude-SearchBot: Anthropic's two crawlers
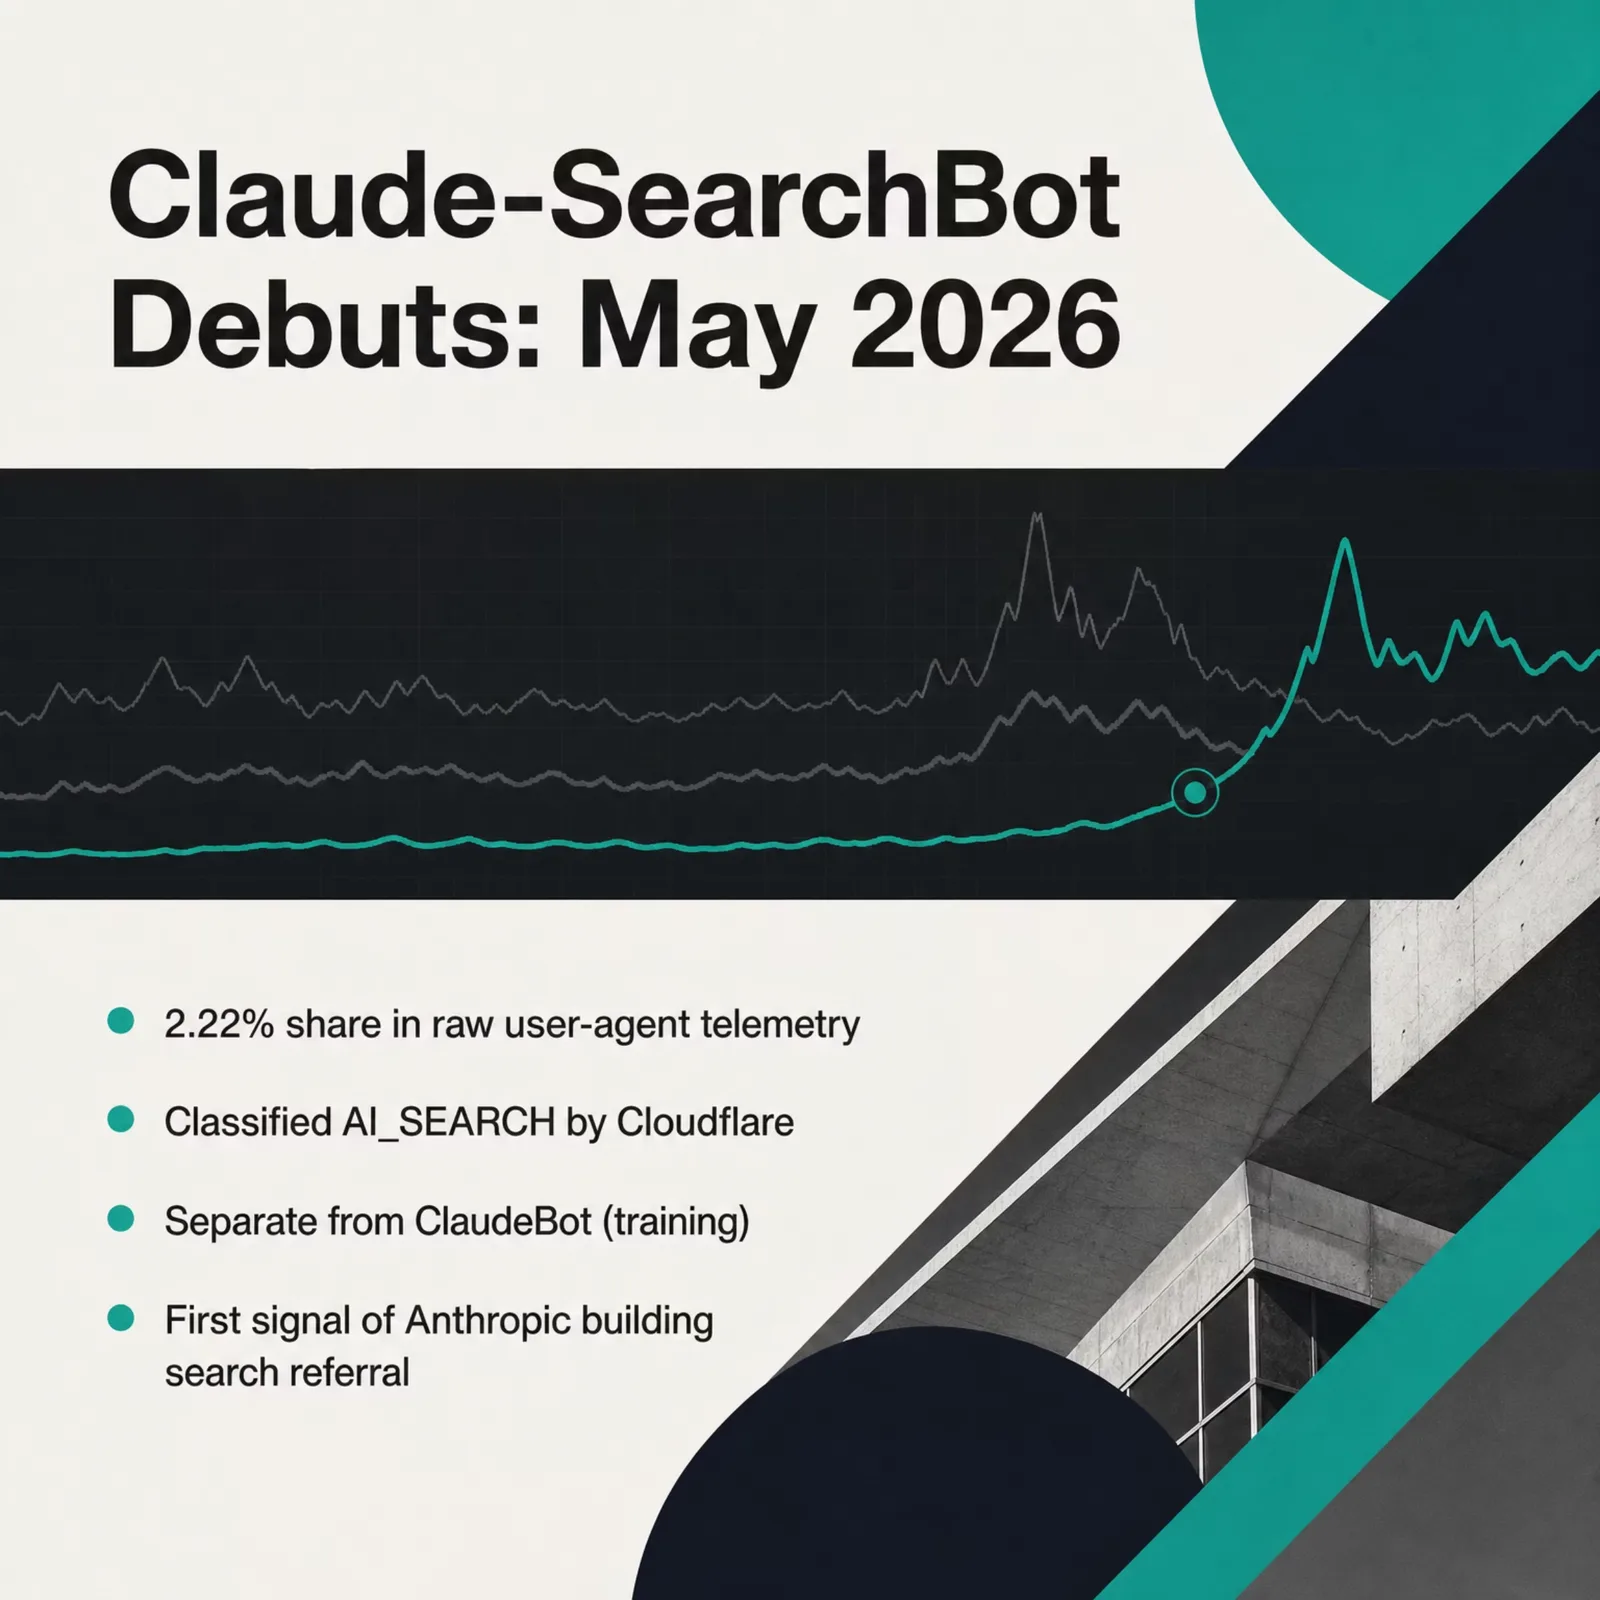
A classification footnote that matters more in 2026 than it did in 2025. Anthropic operates two distinct crawlers.
ClaudeBot is the training-purpose user agent that drives the chart above. It isn't in Cloudflare's curated AI_CRAWLER bot directory (32 verified bots as of May 2026) and appears in raw user-agent telemetry only.
Claude-SearchBot is the navigational crawler that improves search results inside Claude. It's classified AI_SEARCH in Cloudflare's directory. In May 2026 it appeared in raw user-agent telemetry for the first time at 2.22% share, a brand-new line item for publishers watching bot logs, and it climbed to 3.27% by full-month June 2026.
This training-vs-search split mirrors OpenAI's GPTBot vs OAI-SearchBot architecture. If you're working on bot allow/deny rules, treat them separately. Blocking ClaudeBot doesn't stop Claude-SearchBot, and the two have different referral-traffic behavior.
Claude vs ChatGPT vs Gemini vs Perplexity vs DeepSeek: the generative AI position, verified through July 2026
Generative AI service rankings (June 1, 2026)
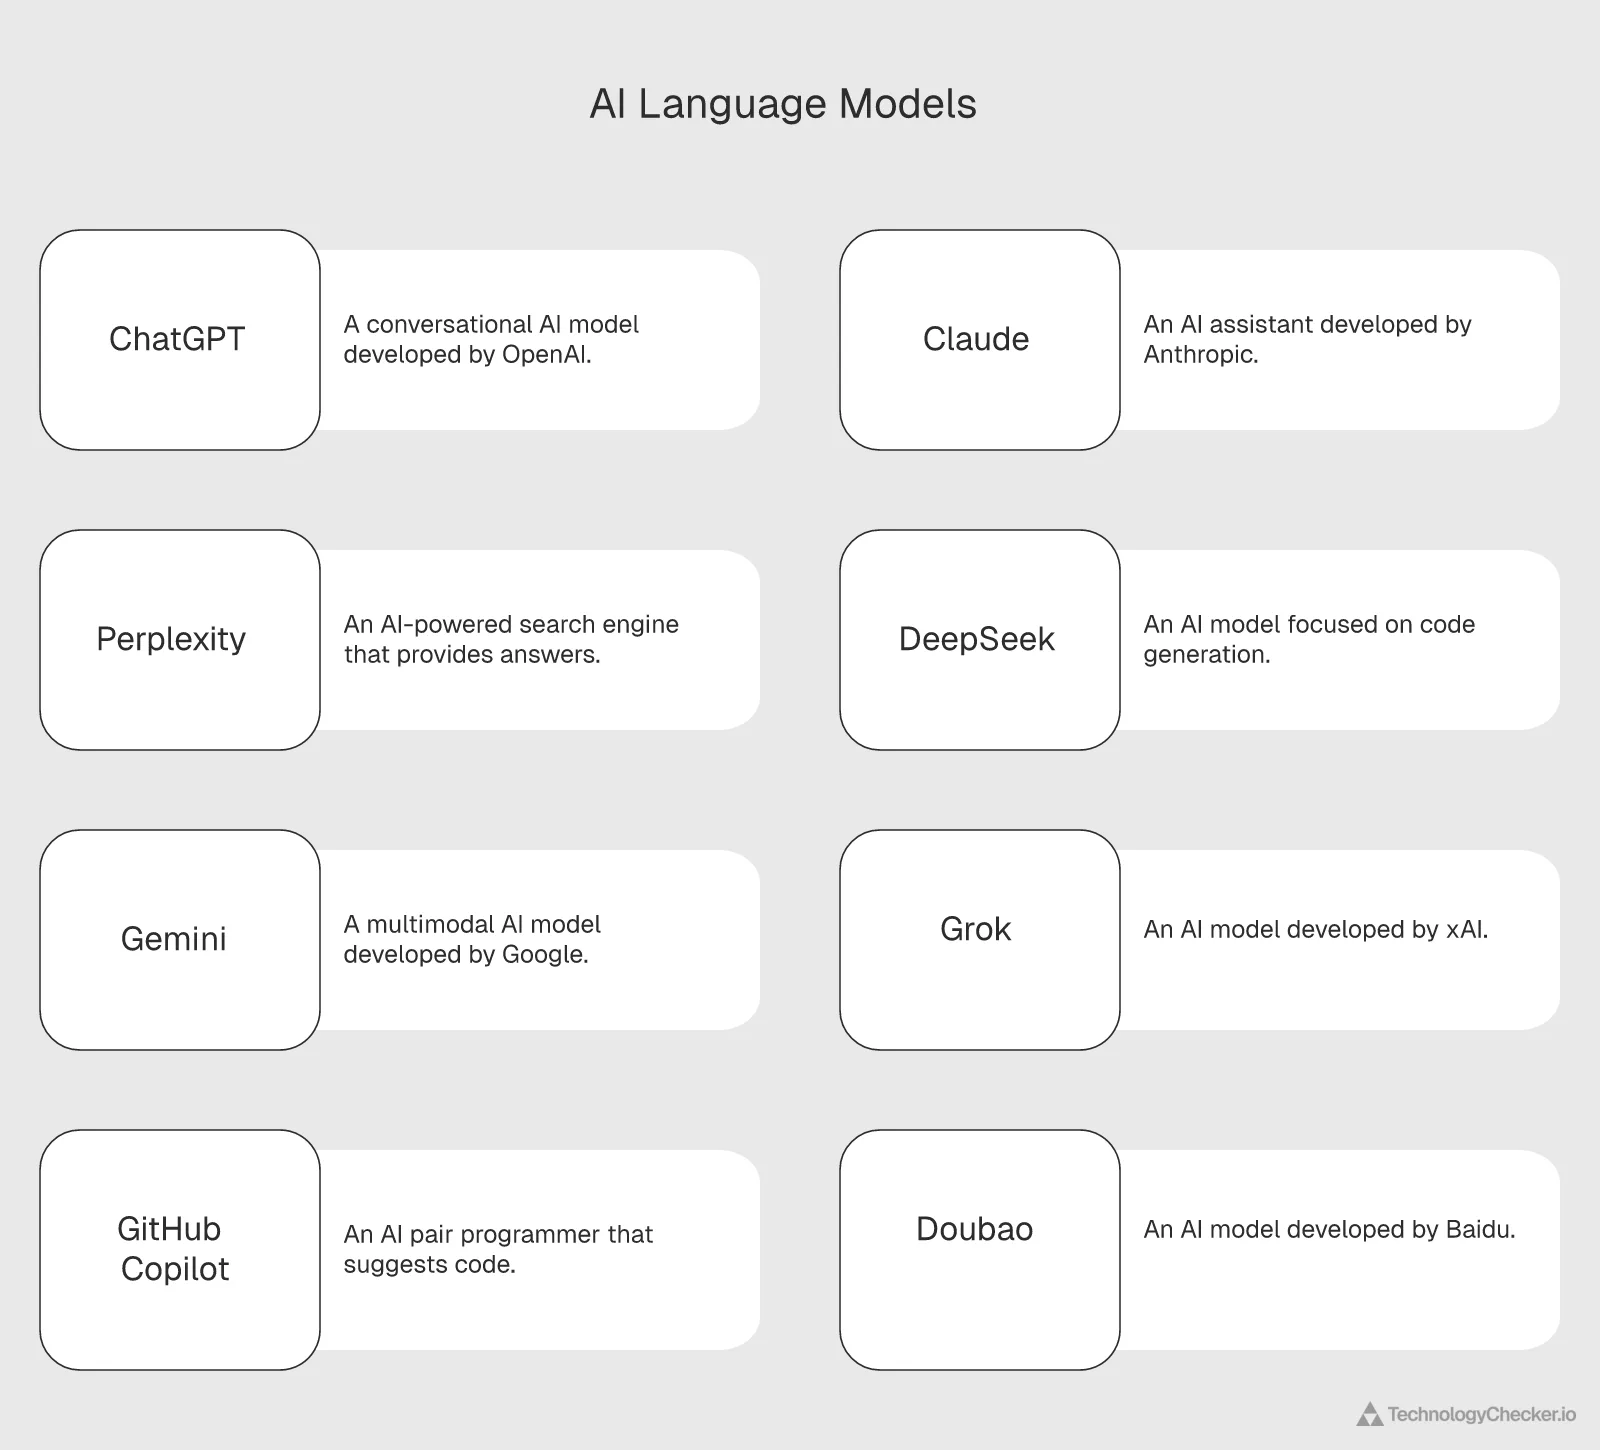
This is the most defensible Claude-specific finding in the entire post. Claude has held #2 in Cloudflare Radar's Generative AI service category for at least 129 days, from February 24 to July 3, 2026. ChatGPT has held #1 for the same 129 days. Perplexity has held #3. The top three positions have not moved, and I re-verified them on July 3, 2026.
August 1, 2026 verification, and a longer streak than we'd reported. I swept the daily ranking snapshot for every day in July. Claude was #2 on 31 of 31 days. Then I swept backwards to find where the run actually begins, and it begins on January 22, 2026, the day Claude passed Gemini for second place. It hasn't broken since. That makes 191 consecutive days at #2 through August 1, 2026. The "at least 129 days" figure this post has carried since May was a floor rather than the full run, because I'd only checked back as far as February 24.
One correction while I was in there. The paragraph above says Perplexity has held #3 across the same window. July doesn't support that. Perplexity was #3 on 27 of the 31 July days, and Google Gemini took #3 on the other four (July 1, 14, 15 and 31). The July 31 snapshot on its own reads ChatGPT #1, Claude #2, Gemini #3, Perplexity #4, which is exactly why I checked all 31 days instead of trusting one date. Ranks 1 and 2 are stable. Rank 3 isn't, and I shouldn't have implied it was. ⚠️ The "Perplexity has held #3" claim above is superseded in that respect; preserved as originally published.
Source: Cloudflare Radar ranking/internet_services/top?serviceCategory=Generative%20AI, daily snapshots pulled 2026-08-01 for every date from 2026-01-01 to 2026-08-01.
| Rank | Service | Operator | Notable |
|---|---|---|---|
| 1 | ChatGPT | OpenAI | #1 every day for 129+ days |
| 2 | Claude | Anthropic | #2 every day for 129+ days |
| 3 | Perplexity | Perplexity | #3 every day for 129+ days |
| 4 | Google Gemini | Reclaimed #4 from DeepSeek in late May | |
| 5 | DeepSeek | DeepSeek | Slipped to #5 behind Gemini |
| 6 | Character.AI | Character.AI | Up to #6 |
| 7 | GitHub Copilot | Microsoft | Stable |
| 8 | Grok / xAI | xAI | Slipped to #8 |
| 9 | Suno AI | Suno | AI music platform |
| 10 | Doubao | ByteDance | Held the top 10 into June |
Cloudflare's Internet Services Ranking is a top-200 services tracker built on 1.1.1.1 DNS traffic, not a category-share calculator. Being #2 means absolute traffic-rank #2 across the entire Generative AI category for 129 days straight. If you build on Claude, this is the slide in your pitch deck. (The table above is the June 1, 2026 snapshot; on the July 3 re-verification the top three were unchanged, while ranks 4 through 10 shuffle more.)
The crawl-to-referral problem: Anthropic's 13,528:1 ratio
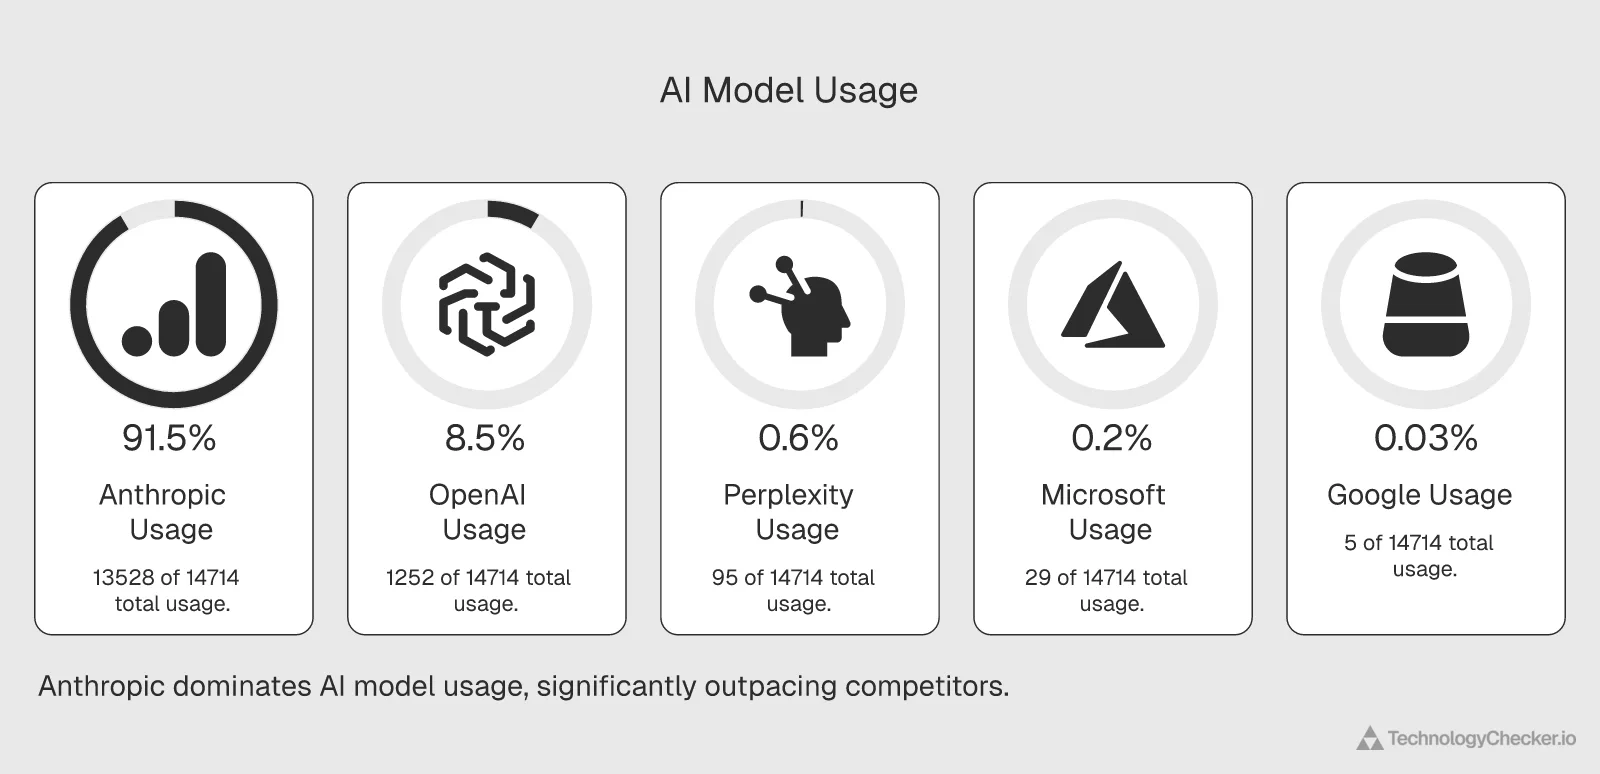
This is where the data gets uncomfortable. Cloudflare Radar tracks how much each AI platform crawls versus how much referral traffic it sends back. As of the April 13-20, 2026 measurement window:
| Platform | Crawl-to-referral ratio | What it means |
|---|---|---|
| DuckDuckGo | 1.5:1 | Sends traffic back frequently |
| 5:1 | Established search model | |
| Microsoft | 29:1 | Moderate return |
| Mistral | 53:1 | Low return |
| Perplexity | 95:1 | Modest return |
| OpenAI | 1,252:1 | Very low return |
| Anthropic | 13,528:1 | Lowest return by far |
Anthropic crawls 13,528 pages for every single referral it sends back. OpenAI's 1,252:1 ratio is bad. Anthropic's is roughly 10x worse. Perplexity's 95:1 looks healthy by comparison and is the highest crawl-to-referral conversion among the AI-first platforms.
Update (full-month June 2026): the ratio has kept improving. On a fresh full-month June pull, Anthropic's crawl-to-referral ratio fell to 3,385:1, down from 13,528:1 in the April window (and roughly 5,143:1 across the full second quarter, per our robots.txt report and bot traffic statistics). It is still the lowest return of any major operator in the same June window (Google 5:1, OpenAI 647:1), so the publisher problem stands, but the direction, alongside Claude-SearchBot's climb from 2.22% to 3.27%, is the first hard evidence Anthropic is starting to give some traffic back. Source: Cloudflare Radar bots/crawlers/summary/crawl_refer_ratio, full-month June 2026.
Update (full-month July 2026). The ratio kept falling, and fast. Anthropic came in at 1,917:1 in July, down from 3,386:1 in June and 5,143:1 across Q2 2026. The like-for-like year-over-year figure is the one worth quoting: July 2025 read 38,744:1, so Anthropic now returns roughly 20 times more traffic per page crawled than it did twelve months ago. Splitting the month shows the improvement running right through it, 2,328:1 over July 1-15 and 1,510:1 over July 16-31.
Two honesty notes on this table, because the June version of this section overstated one of them. Anthropic is no longer the highest number in Cloudflare's July list: Mistral reads 29,612:1 for the month. That figure isn't comparable. Mistral's referral count collapses to zero over July 16-31, so the endpoint returns infinity for that half and the full-month number is a near-empty denominator rather than a behavior. Among operators sending referrals at any real scale, Anthropic is still the weakest return, at about 7.6x OpenAI's 251:1 and 400x Google's 5:1. The second note is a units one: Cloudflare returns normalization: RATIO here, not a percentage, so "1,917:1" means 1,917 pages crawled per referral sent, and lower is better.
Source: Cloudflare Radar bots/crawlers/summary/crawl_refer_ratio (normalization RATIO), full-month July 2026, full-month July 2025, full-month June 2026 and Q2 2026, plus the two July half-months. Pulled 2026-08-01.
For publishers, this is a clear-cut policy question. ClaudeBot blocking will likely accelerate through 2026 unless Anthropic ships a search product that returns traffic at a meaningful rate. Claude-SearchBot's 2.22% May debut, up to 3.27% by June, is the first signal Anthropic is building toward that, though the volume is still small next to the training-purpose ClaudeBot. Our robots.txt AI crawler patterns report has the bot-by-bot blocking trends if you're working on your own crawl policy.
Head-to-head: Claude vs ChatGPT for developers
Based on benchmark data, the Pragmatic Engineer's February 2026 survey of 15,000 developers, and forum adoption signals, here's where Claude stacks against ChatGPT for technical use cases as of May 2026.
| Dimension | Claude (Sonnet 4.6 / Opus 4.7) | ChatGPT (GPT-5.5 / o3) |
|---|---|---|
| Code generation | Sonnet 4.6 matched Opus 4.5 on coding for the first time, top of SWE-bench | Strong across languages, GPT-5.5 closed most of the gap |
| Reasoning (math/logic) | Competitive on extended-thinking tasks | o3 excels (replaced o1, 87% cheaper) |
| Writing quality | More natural, preferred by writers in long-form | Good, more formulaic in long-form |
| Context window | 1M tokens GA since March 13, 2026 (Opus 4.6, Sonnet 4.6, Opus 4.7 at standard pricing) | 1M tokens in GPT-5.5 API since April 23, 2026 (400K in Codex) |
| Vision | Opus 4.7: 3x resolution jump to 2,576px / 3.75 megapixels (April 16, 2026) | GPT-5.5 vision improved at launch, no public MP figure |
| API pricing | Haiku 4.5 $1/$5 per 1M tokens, Sonnet 4.6 $3/$15, Opus 4.7 $5/$25 | o3 $2/M input (87% cheaper than o1), GPT-5.5 priced higher per token than Sonnet 4.6 |
| Most-loved AI coding tool rating | 46% (Pragmatic Engineer, Feb 2026) | Lower in the same survey |
| Cloudflare GenAI rank (129 days) | #2 every day | #1 every day |
| Web crawl footprint (June 2026) | 19.77% ClaudeBot + 3.27% Claude-SearchBot (#2 overall) | 9.40% GPTBot + OAI-SearchBot (sub-top-10) |
| Web crawl footprint (July 2026) | 16.28% ClaudeBot + 3.54% Claude-SearchBot (#2 overall) | 9.74% GPTBot + OAI-SearchBot (sub-top-10) |
| Fortune 100 adoption | 70% | 93% (per Christian & Timbers, ChatGPT side) |
| Enterprise win rate (head-to-head) | ~70% per SaaStr | ~30% per SaaStr |
The 200K-vs-128K context window gap that defined the 2024-2025 comparison closed in March-April 2026. Both vendors now ship a 1M-token GA tier. Anthropic moved Sonnet 4.6 and Opus 4.6 to a 1M context at standard pricing on March 13, 2026, retiring the earlier beta tier. OpenAI followed with the GPT-5.5 launch on April 23, 2026, which ships at 1,050,000 tokens in the API and 400K in Codex. With context parity, the comparison shifted to three other axes: Sonnet 4.6 matching Opus 4.5 on coding benchmarks for the first time, Opus 4.7's 3x image-resolution jump on the vision side, and o3 cutting OpenAI's reasoning-model pricing 87% versus o1.
The Claude advantages now cluster on code quality at the Sonnet tier, enterprise win rate, and vision resolution. ChatGPT's advantages cluster on user-base scale, the o3 price-performance curve, and ecosystem breadth (Codex, Operator, custom GPTs).
The dual-platform reality
According to AI Business Weekly, 79% of OpenAI users also pay for Anthropic. Enterprises aren't picking one AI vendor in 2026; they're running ChatGPT and Claude side by side. Claude users spend 34.7 minutes per daily session, the highest engagement of any AI platform, and Anthropic reportedly wins ~70% of head-to-head enterprise deals against OpenAI per SaaStr.
If you're integrating with one AI platform, ChatGPT offers the largest addressable audience. Claude's enterprise win rate, coding quality at the Sonnet tier, and the 1M context window now matched by GPT-5.5 mean the comparison isn't decided on raw capacity any more, it's decided on tone, vision resolution, and price-per-token. That's why dual-platform support is the default in B2B SaaS as of mid-2026. For deeper competitor profiles, see our ChatGPT technology profile and Perplexity AI entries in the AI chatbots and assistants category.
Claude API and developer adoption benchmarks in 2025-2026

Developer adoption is where Claude pulled away in 2025 and held the lead through Q2 2026.
Claude Code: $2.5B run-rate in 9 months
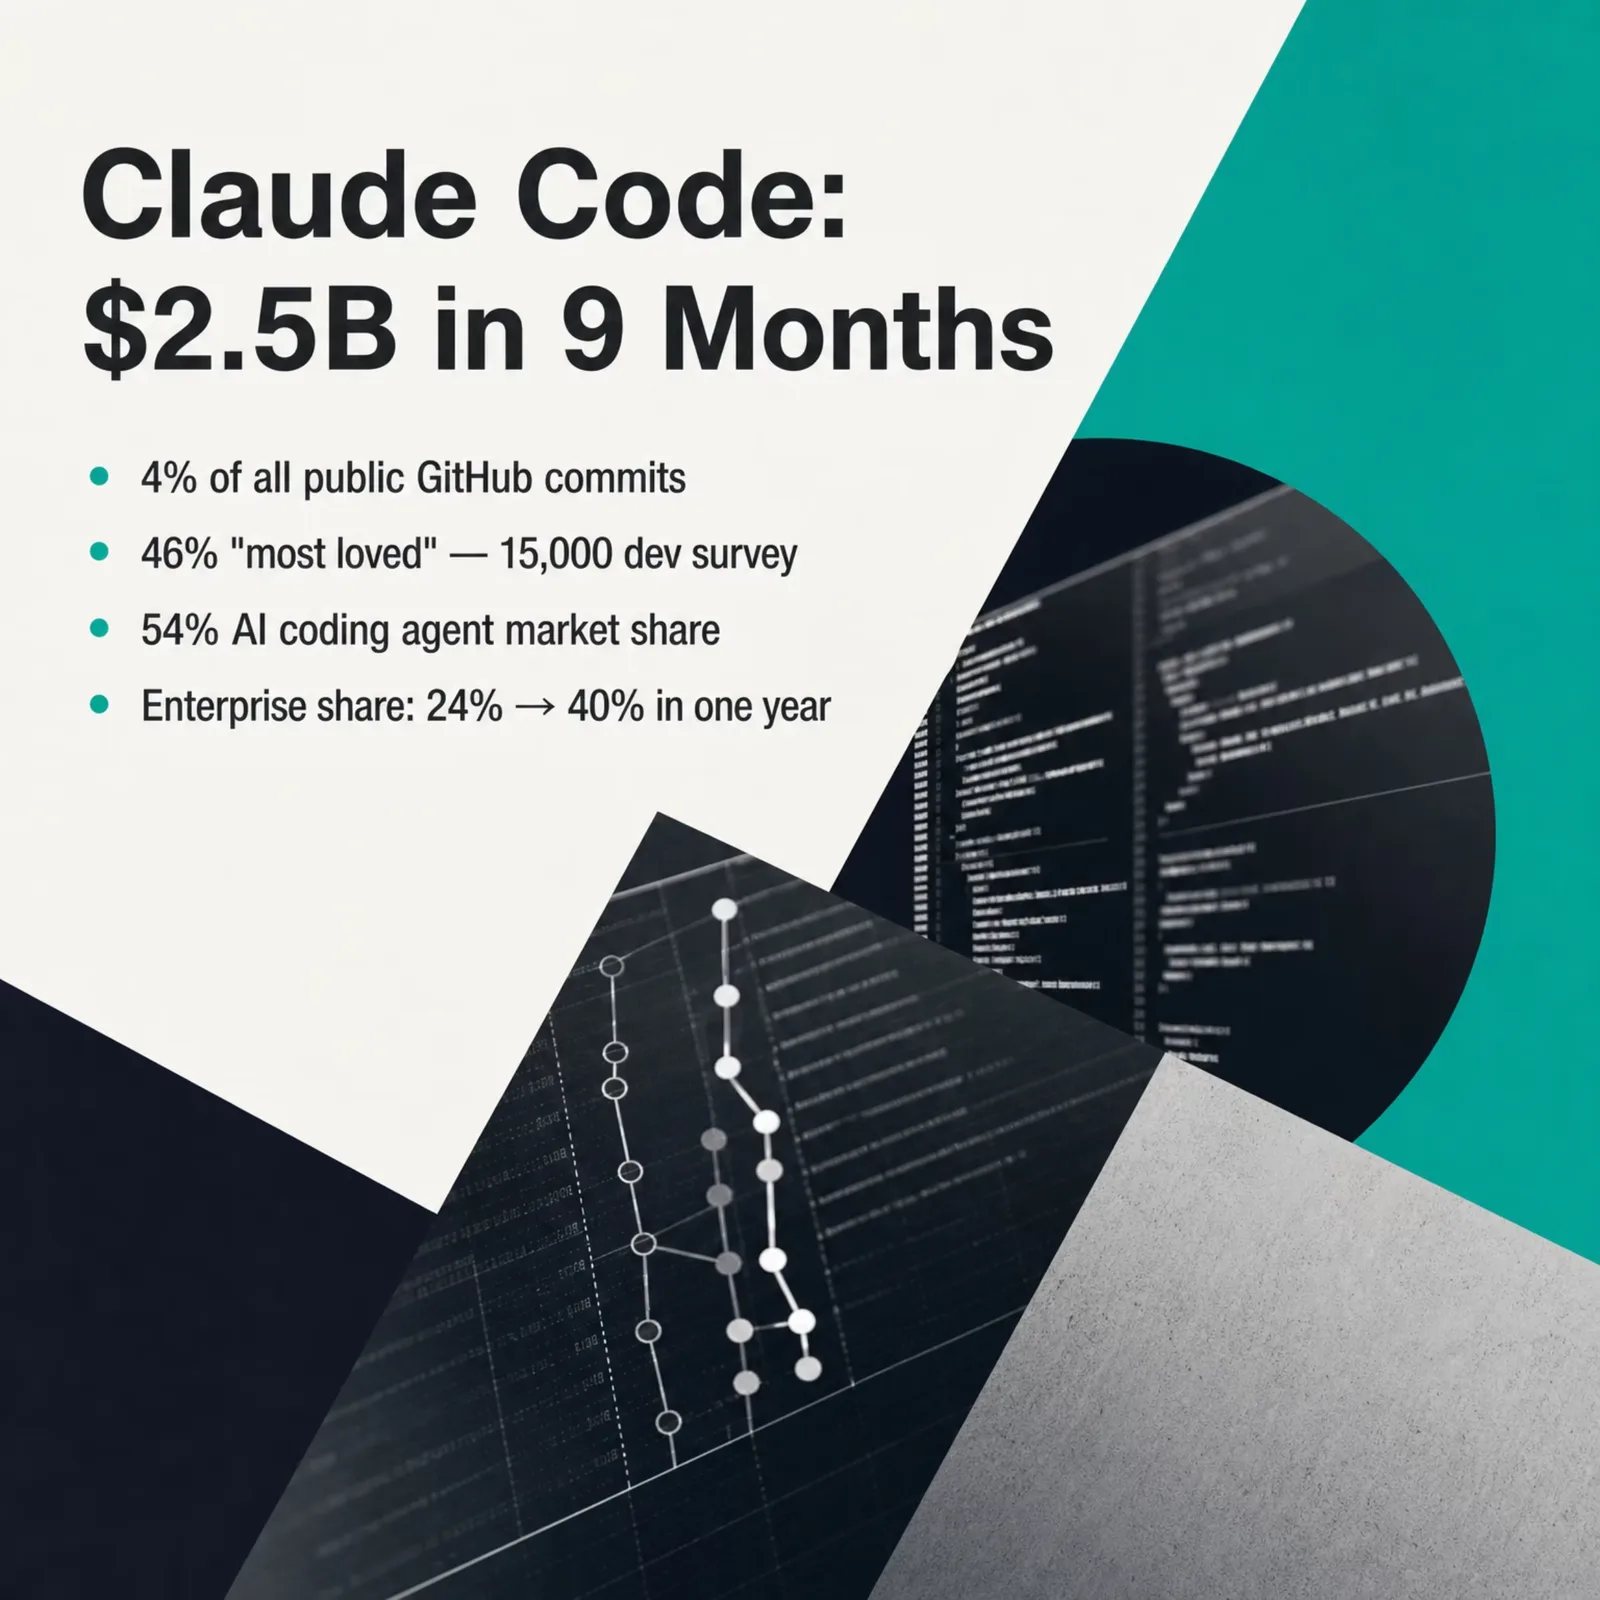
Claude Code reached $1B in annualized revenue in six months. It hit $2.5B in nine, per SerpSculpt, echoed by getpanto.ai and corroborated by Anthropic's enterprise updates. Claude Code accounts for $2.5B of the $14B February total. The highest revenue ramp for a single developer product since GitHub Copilot's launch.
Most-loved developer tool of 2026 (46% Pragmatic Engineer rating)
Claude Code hit a 46% "most loved" rating in the Pragmatic Engineer survey of 15,000 developers in February 2026, per getpanto.ai. That made it the most-used AI coding tool in the panel, beating GitHub Copilot, Cursor, and JetBrains AI Assistant.
The 54% AI coding agent market share
Anthropic's AI coding agent market share sits at 54% as of early 2026, per a Medium analysis. Enterprise share rose from 24% to 40% in a single year. The proof point that matters most for an SEO/GEO practitioner like me: 4% of all public GitHub commits are now authored by Claude Code, per SemiAnalysis, with a forward projection that the share will pass 20% by end of 2026. Even if the 20% projection is aggressive, the current 4% is already verified. AI is a measurable contributor to global software output. Not a sidekick.
Context window parity: both vendors now ship 1M GA
The old 200K-vs-128K story is over. Anthropic moved Sonnet 4.6 and Opus 4.6 to a 1-million-token context at standard pricing on March 13, 2026, retiring the earlier 1M beta and removing the long-context premium. Opus 4.7 launched on April 16, 2026 inherited the same 1M GA. OpenAI followed with GPT-5.5 on April 23, 2026, shipping at 1,050,000 tokens in the API and 400,000 in Codex.
So context capacity is no longer the wedge B2B SaaS teams cite when picking Claude. What matters now: tone quality on long support transcripts, vision resolution (Opus 4.7's 3.75-megapixel jump), Sonnet 4.6 matching Opus 4.5 on coding benchmarks, and price-per-token at the Sonnet tier ($3 input / $15 output per 1M). The comparison shifted from raw window size to what each model does with the window.
A few more developer-adoption data points:
- 70% of Fortune 100 companies use Claude, with named deployments at Cognizant (350,000 staff) and Accenture (30,000 trained), per The AI Corner.
- Claude has 18.9 million monthly active users worldwide, per Backlinko.
- Claude's mobile app reached 2.9 million monthly active users by early 2026.
- 11M+ daily users on Claude.ai by early 2026, per The AI Corner.
For broader context on where coding agents fit in the GenAI stack, see our AI content generation category page.
Where Claude is used: 2025-2026 geographic and vertical patterns
Geographic concentration
The U.S. and India together account for 33.13% of Claude's total user base, per Backlinko citing Anthropic's Economic Index data. The top 20 countries together account for 48% of all per-capita usage, up from 45% in the prior reporting cycle per Anthropic's March 2026 Economic Index.
Per-capita usage is consolidating, not dispersing. Early-adopter geographies are deepening usage faster than new countries are catching up. If you're building a Claude-powered product, your strongest signal will keep coming from the U.S., India, the U.K., Singapore, and Israel in the near term.
Vertical adoption is concentrated in coding
The Anthropic Economic Index notes 49% of jobs have seen at least a quarter of their tasks performed using Claude. Most of that volume sits inside software engineering, data analysis, and technical writing. Per Anthropic's January 2026 Economic Index, of the 3,000+ unique work tasks identified in Claude.ai conversations, the top 10 accounted for 24% of sampled traffic in November 2025, dropping to 19% in February 2026 as the task mix diversified.
The diversification trend is real, just slower than the headline numbers suggest. Coding-adjacent tasks still dominate.
Which website verticals do AI crawlers hit in each country?
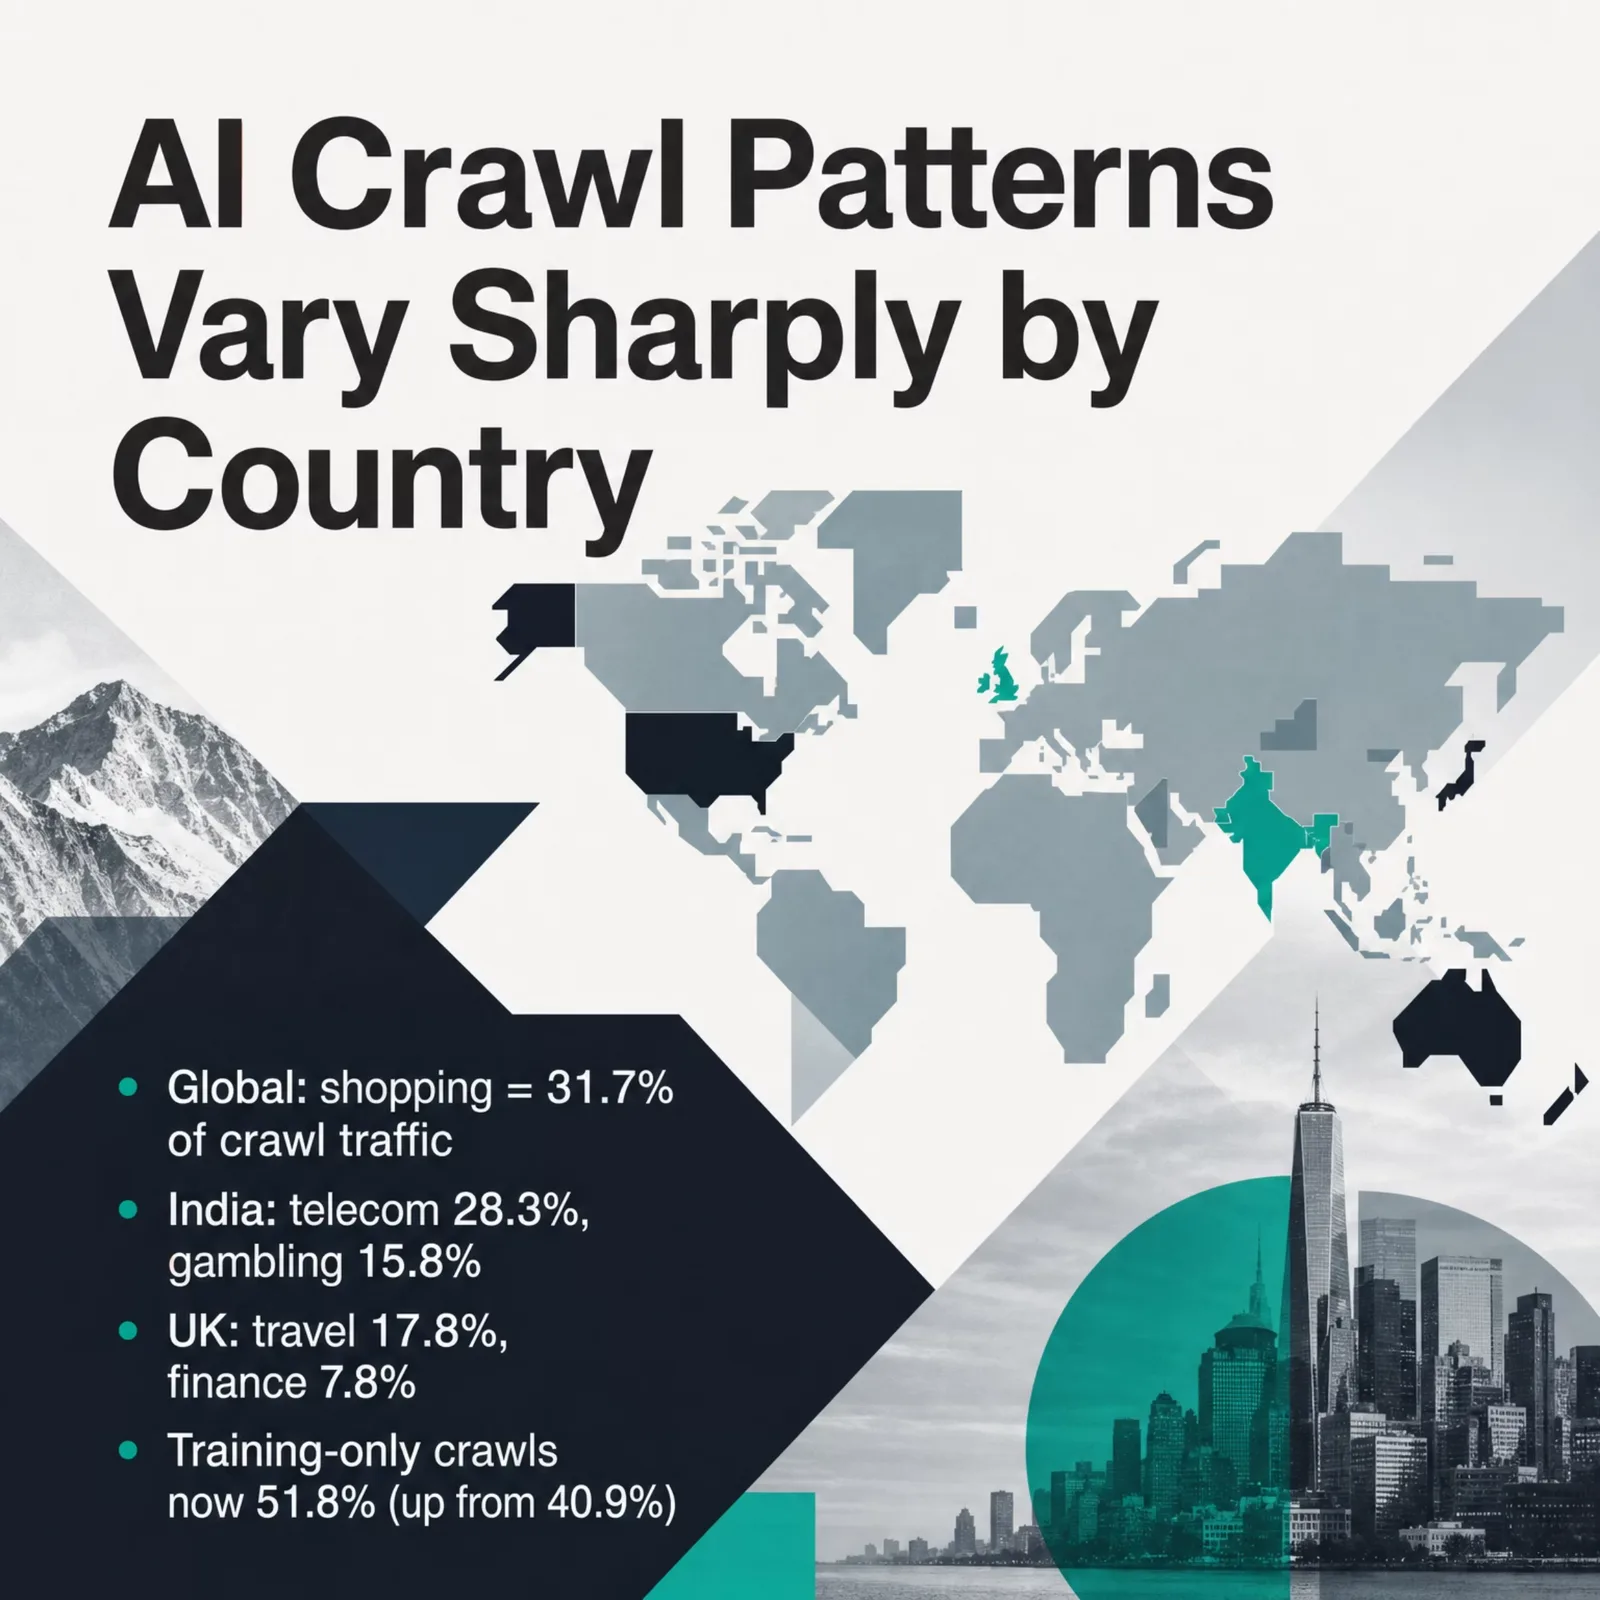
The Economic Index numbers above are the usage side: what Claude users do. Cloudflare Radar gives the other half, the ingestion side: which website verticals AI crawlers actually pull from, and in which country those sites sit. This is where ClaudeBot and every other AI crawler source their training and search data, broken out by the destination market. I pulled bots/summary/vertical with a location filter for the U.S., India, and the U.K. (three of Claude's top user geographies) across the full month of May 2026. The country profiles diverge hard.
Globally, shopping and general-merchandise sites absorbed 31.7% of all AI crawler traffic in May 2026, but just 9.6% in India, where internet and telecom sites (28.3%) and gambling sites (15.8%) dominated the crawl mix instead. Source: Cloudflare Radar, full-month May 2026.
| Website vertical | Global | US | India | UK |
|---|---|---|---|---|
| Shopping & General Merchandise | 31.7% | 29.2% | 9.6% | 28.2% |
| Internet & Telecom | 17.0% | 17.8% | 28.3% | 21.2% |
| Computer & Electronics | 14.7% | 14.8% | 8.7% | 10.3% |
| News, Media & Publications | 9.3% | 10.1% | 5.1% | 3.9% |
| Travel & Tourism | 4.0% | 3.9% | 3.9% | 17.8% |
| Finance | 2.8% | 2.8% | 3.2% | 7.8% |
| Gambling | 2.3% | —* | 15.8% | 1.9% |
| Sports & Fitness | —* | —* | 12.4% | —* |
*Outside that market's top-10 verticals (folded into Cloudflare's "other" bucket), so below roughly 2%. Shares are each country's AI-crawler requests by destination-site vertical, not Claude-specific traffic.
Three reads. The U.S. mirrors the global mix almost exactly, shopping-led, then internet/telecom and computer/electronics. India looks nothing like it: telecom and internet properties take 28.3% of AI crawl requests, real-money gambling another 15.8%, and sports and fitness 12.4%, a profile shaped by India's mobile-first, cricket-heavy, gaming-heavy web. The U.K. skews to travel and tourism (17.8%, more than 4x the global share) and finance (7.8%, nearly 3x), reflecting its booking-engine and fintech density.
For a team building on Claude, the practical link is crawl access. How fresh and deep Claude's knowledge is about a vertical in a given market tracks loosely with how much AI crawlers are allowed to fetch there. A U.K. travel brand sits in the single most-crawled vertical in its market. An Indian fintech competes for crawl budget against a wall of gambling and telecom traffic. And if your robots.txt blocks ClaudeBot, you drop out of that country-vertical slice entirely, a tradeoff worth weighing against the 13,528:1 crawl-to-referral ratio below.
Mobile vs web split
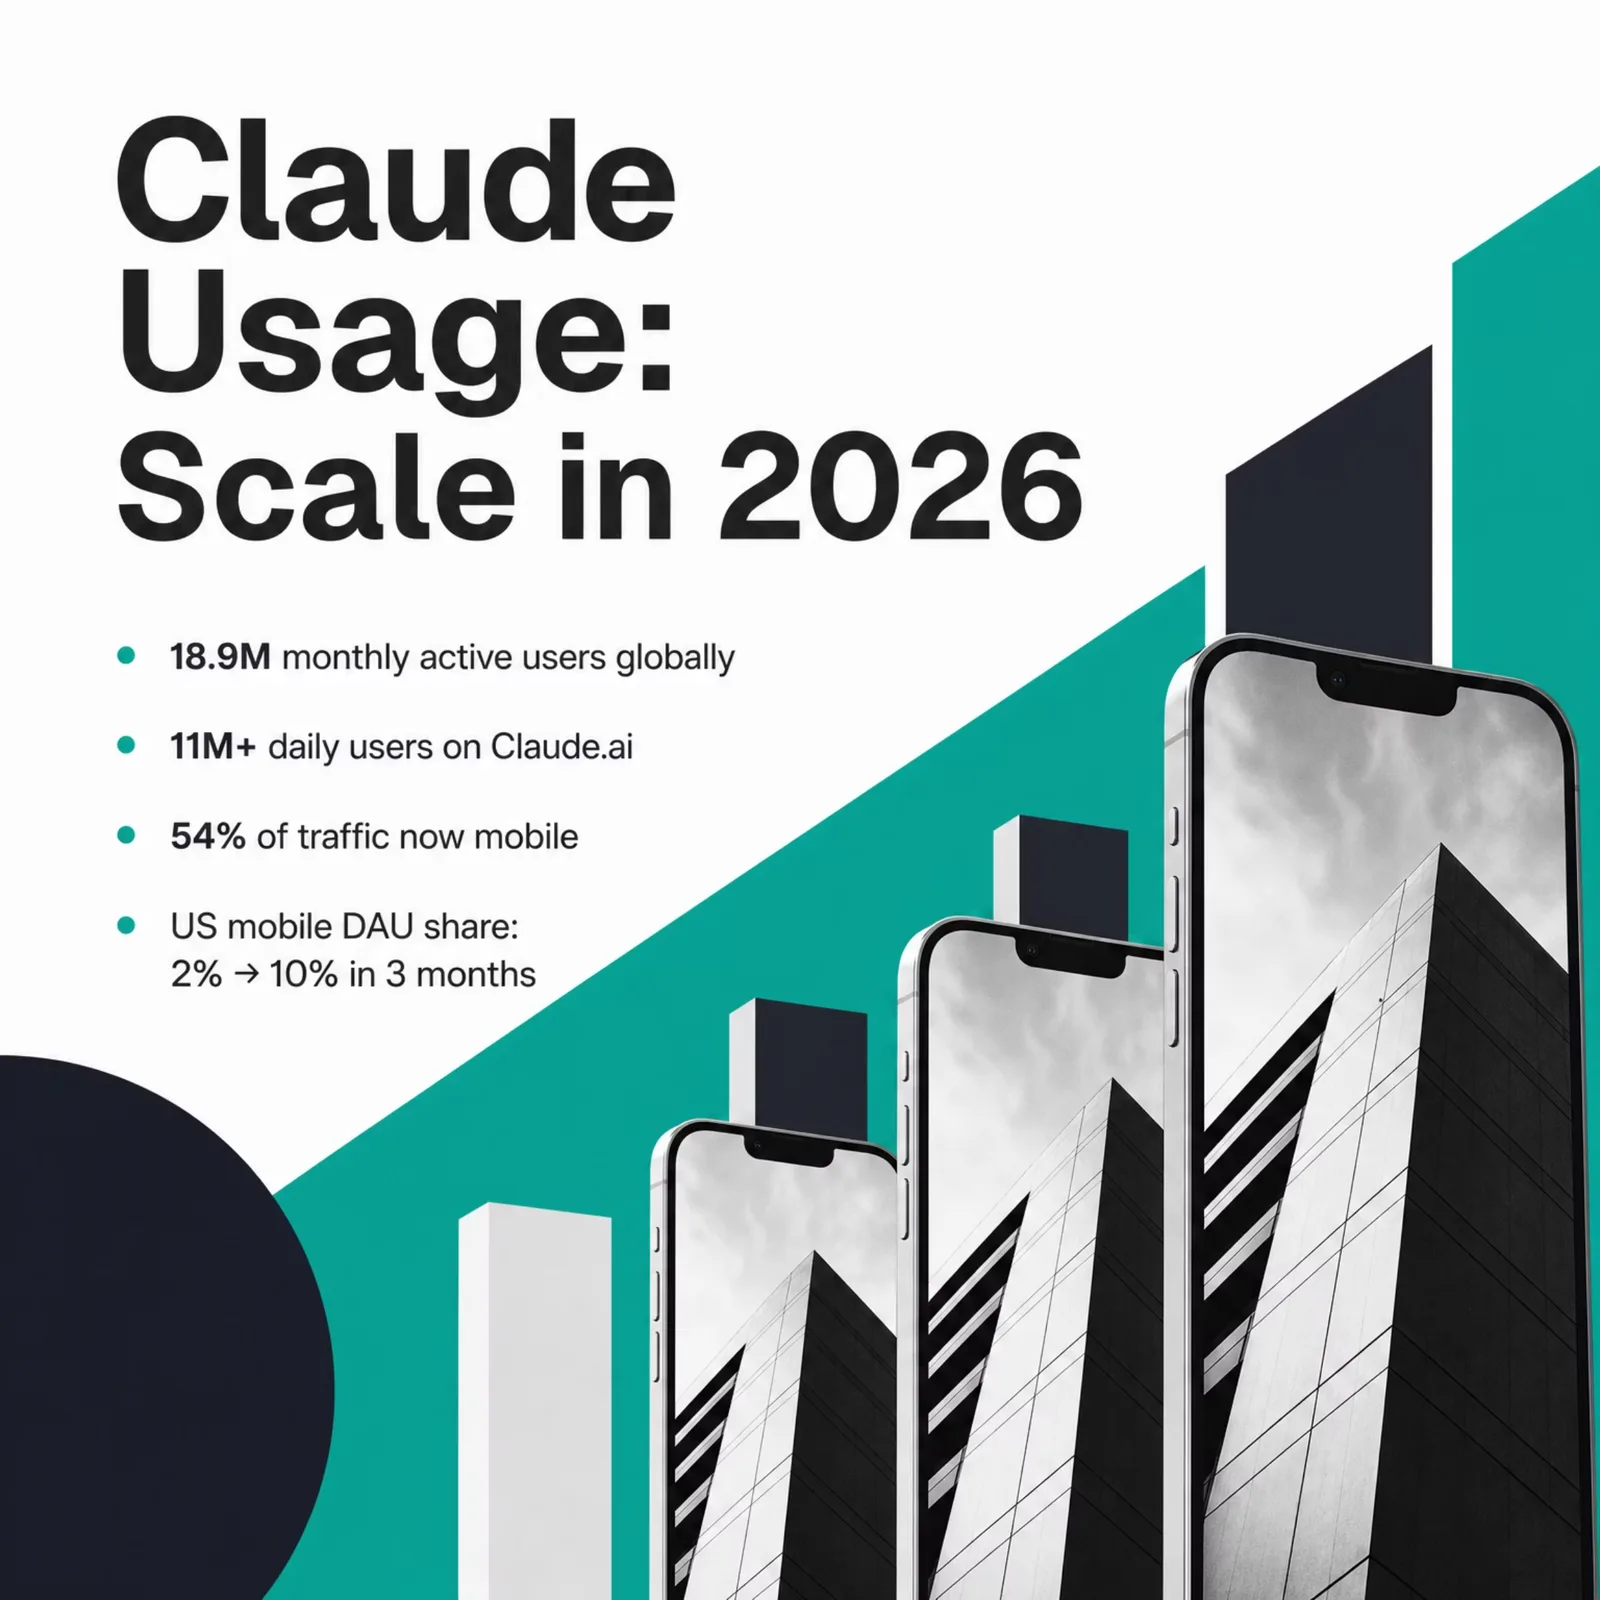
Claude's mobile traffic accounted for 54% of total usage by early 2026, per marketingltb.com, a flip from web-heavy usage in 2024. Mobile DAU climbed to 11.3 million by early 2026, a 183% jump from the start of the year, per The AI Corner. FatJoe reports Claude jumped from under 2% of U.S. mobile chatbot DAU share in December 2025 to 10% in March 2026, a 167% month-on-month surge Apptopia called "a step function, not a trend line."
I had to double-check the 183% figure when I first saw it. Most B2B AI tools stay web-heavy for years.
That 54% is Claude's own app traffic. To see the device landscape Claude's users actually sit in, I pulled Cloudflare Radar's device-type split for Claude's top user geographies on June 12, 2026 (trailing 28 days). This is the share of all HTTP requests by device in each market — the general-web baseline, not Claude-specific telemetry — but it explains why Claude's mobile share climbs fastest in mobile-first countries.
| Market | Desktop | Mobile | Skew |
|---|---|---|---|
| United States | 70.8% | 29.2% | Desktop-dominant |
| Global | 59.9% | 40.1% | Desktop-led |
| United Kingdom | 56.7% | 43.2% | Balanced |
| India | 40.0% | 60.0% | Mobile-majority |
Share of HTTP requests by device, trailing 28 days to June 12, 2026 (get_http_data → summary/device_type, location-filtered). The device mix covers all web traffic in each market — a proxy for the surface Claude's users browse on, since Cloudflare doesn't break device out per service.
The contrast is the story: the US web is 71% desktop, but India's is 60% mobile. Claude's reported 54% mobile share already sits above the US desktop-heavy baseline, which tracks with its fastest DAU growth coming from mobile-first markets. A team building on Claude in India should design for a mobile-majority surface; one targeting US enterprise can still assume desktop-first.
Enterprise adoption pattern
70% of Fortune 100 companies use Claude. Named large deployments include Cognizant (350,000 staff) and Accenture (30,000 trained). Enterprise customers spending over $100,000 annually grew 7x year on year. Anthropic's enterprise market share rose from 24% to 40% in a single year. These aren't pilots anymore.
Key takeaways for AI leaders in 2026

Five patterns from the May to September 2026 data matter most for your 2026 planning. Point 5 is the newest, and it grades points 3 and 4.
1. The May crawl dip was a one-month blip, and June inverted it in Anthropic's favor. ClaudeBot beat GPTBot in April (11.69% vs 9.84%), lost the lead in May (9.73% vs 11.48%), then nearly doubled to 19.77% in June while GPTBot slipped to 9.40%, making ClaudeBot the #2 AI crawler overall behind Googlebot. Crawl share is a leading indicator of training-corpus freshness, and on the June reading the freshness edge tilts toward Claude, not away from it. The volatility is the real lesson: price the swing, not any single month's leader. ⚠️ Partly superseded by point 4 below; preserved as originally published. July gave back 3.48 of those points.
2. The 129-day #2 GenAI streak is the most defensible Claude-specific data point of 2026. Claude has held #2 in Cloudflare's Generative AI service ranking for at least 129 days. It comes from the same daily DNS-traffic dataset that ranks the entire web's top 200 services, not from a survey or a panel. If you build on Claude and need to justify the decision to a board or a buyer, this is the data point that holds up under scrutiny.
3. The crawl-to-referral ratio is a publisher problem with a closing window. Anthropic crawls thousands of pages for every referral it sends back: 13,528:1 in April, improving to 3,385:1 by full-month June, still the worst of any major operator (Google 5:1, OpenAI 647:1). Claude-SearchBot climbed from 2.22% (May) to 3.27% (June), the first hard signal Anthropic is building toward a publisher-friendly search product, so the window is closing but hasn't shut. Expect publisher blocking pressure to persist through 2026 unless the referral trend accelerates. If you run a content site, treat ClaudeBot and Claude-SearchBot as separate decisions. ⚠️ Updated by point 4 below; preserved as originally published. July reads 1,917:1, and Mistral rather than Anthropic is nominally the highest number in the July table.
4. July 2026: the surge peaked, the year-over-year win held. ClaudeBot eased from 19.77% in June to 16.28% in July, its steepest monthly drop of the year, and it still finished #2 with about 1.7x GPTBot's volume (9.74%). Against the same month a year earlier the picture is unambiguous: in July 2025 ClaudeBot ran 11.23% and sat behind GPTBot's 13.15%. The crawl-to-referral ratio improved again to 1,917:1, from 38,744:1 in July 2025, though Anthropic still returns the least traffic of the operators with real referral volume. The #2 GenAI rank is now 191 unbroken days. Plan against the year-over-year numbers. The monthly ones will keep swinging. Source: Cloudflare Radar, full-month July 2026 and full-month July 2025, pulled 2026-08-01.
5. Q3 2026: the referral side moved, and it moved unevenly. Claude held #2 in generative AI on all 92 days of the quarter (252 in a row). ClaudeBot finished Q3 at 13.23% of AI-bot traffic, up 2.97 points on Q3 2025 and 1.6x GPTBot. Anthropic's crawl-to-referral ratio improved to 988:1, which means it is no longer the weakest return among major operators (Perplexity read 1,083:1). But by destination vertical the ratio runs from 25:1 on computer and electronics sites to 13,766:1 on news sites, so a publisher's blocking decision depends on its vertical more than on the headline figure. Source: Cloudflare Radar, Q3 2026 and Q3 2025, pulled 2026-10-01.
For sales and GTM teams: understanding which technologies your prospects use, and how they integrate AI tools, gives you a real competitive edge. At TechnologyChecker we track adoption signals across 40,000+ technologies on 29.9M active domains (50M in our broader detection database). If you want to see which companies in your target market are actively adopting Claude or competing AI tools, the companies that use ChatGPT list is where to start: it identifies prospects whose tech stack signals readiness for your product.
Methodology and data sources
I first refreshed these statistics on June 1, 2026 (full month of May), added country and device cuts on June 12, re-verified the Cloudflare Radar figures on July 3, 2026 (full month of June), and refreshed again on August 1, 2026 (full month of July, plus a day-by-day sweep of the Generative AI ranking back to January 1, 2026). Two of the data sources are first-party (Cloudflare Radar and our own TechnologyChecker.io 29.9M active-domain detection index) ⚠️ [corrected 1 October 2026: Cloudflare Radar is a third-party public dataset, and our detection index has no Anthropic signature, so it contributes nothing to this post]; everything else was triangulated against at least two independent sources before inclusion. The Cloudflare numbers in this post are not raw pulls — I curated specific dimensions, normalized the data, and built the month-by-month, 129-day rank, and crawler-reversal frames myself. Cloudflare provides the API; the insights are mine.
Cloudflare Radar (first-party, curated, June 1, 2026): get_ai_data with bots/timeseries_groups/user_agent for the 52-week ClaudeBot timeseries, bots/summary/user_agent queried month-by-month across Jan–May 2026 to build the delta table, bots/summary/crawl_purpose for the training/search breakdown, and bots/summary/vertical filtered by location for the country-by-vertical crawl mix. get_internet_services_ranking with serviceCategory=Generative AI for the June 1 ranking. get_internet_services_timeseries for the daily series that powered the 129-day rank-stability finding. The monthly aggregates, the 2.64x volatility ratio, the April/May reversal, and the 129-day streak are not pre-computed by Cloudflare — they're the result of querying the right dimensions and interpreting the patterns. On June 12, 2026 I added two location-filtered cuts: bots/summary/user_agent by country for the ClaudeBot crawl-share-by-market table, and summary/device_type by country (via get_http_data) for the desktop/mobile split. The device mix is general web traffic per market, not Claude-specific — Cloudflare doesn't break device out per service — so I've labeled it as a landscape proxy rather than Claude telemetry.
Cloudflare Radar (August 1, 2026 refresh, July data): four calendar windows were pulled for every dimension in this update, so no comparison mixes window types: full-month July 2026, full-month June 2026, Q2 2026, and full-month July 2025. Endpoints: ai/bots/summary/user_agent (normalization PERCENTAGE) for the crawler shares and the year-over-year table, split again across July 1-15 and July 16-31 as a second read on the monthly decline; bots/summary/bot_operator for the operator-level ranking; bots/crawlers/summary/crawl_refer_ratio (normalization RATIO, not a percentage) for the crawl-to-referral figures; ai/bots/summary/crawl_purpose for the training/mixed split; and ranking/internet_services/top?serviceCategory=Generative%20AI pulled as an individual daily snapshot for every date from 2026-01-01 to 2026-08-01 to establish the streak length rather than infer it from two endpoints. I checked meta.normalization on each endpoint before computing anything, and I verified both surprising July numbers a second way before publishing them. Where July contradicts something an earlier version of this post asserted, the earlier text is preserved and annotated rather than deleted.
TechnologyChecker.io 29.9M active-domain index (first-party): I cross-referenced Cloudflare's bot-traffic data against Claude integration signals detected across our live 29.9M active-domain index — the live subset of a 50M-domain detection database (29.9M active + 10.1M dead + the remainder transitional), refreshed monthly. The detection patterns include Anthropic SDK references in client-side JavaScript, outbound API calls to api.anthropic.com, "Built with Claude" attribution markers, and DNS verification patterns surfaced in HTML and meta tags. This is the layer that lets us validate whether crawler-share movements correspond to real deployment growth on the open web, not just training-pipeline activity inside Anthropic. It's also how we separated genuine Claude adoption from passive references on third-party sites.
⚠️ Correction, 1 October 2026: the paragraph above is preserved as originally published, but it is wrong. TechnologyChecker has no Anthropic detection signature in its current crawl, so none of the cross-references it describes were made, and no figure in this post rests on them. Every number here comes from Cloudflare Radar or the cited third-party sources.
Cloudflare Radar (October 1, 2026 refresh, Q3 2026 data): calendar months January to September 2026 plus September 2025, and calendar quarters Q3 2025, Q2 2026 and Q3 2026, all pulled on 1 October 2026. Endpoints: ai/bots/summary/user_agent (with limitPerGroup=25 to reach Claude-SearchBot and Claude-User below the default top ten), bots/summary/bot_operator, bots/crawlers/summary/crawl_refer_ratio (normalization RATIO), bots/crawlers/summary/referer (limitPerGroup=30 for claude.ai), bots/crawlers/summary/crawl_refer_ratio filtered by vertical (validated: an invalid vertical returns error 2001; vertical names containing commas are double-encoded), and ranking/internet_services/top?serviceCategory=Generative%20AI as an individual daily snapshot for every date from 1 to 30 September 2026. The September ClaudeBot figure was cross-checked against a daily timeseries pull (11.95% daily mean against 12.00% monthly). September 2026 is provisional because Cloudflare refreshed it the day this edition was pulled.
Revenue and funding: SaaStr ($14B February ARR), VentureBeat ($30B April run-rate), DemandSage ($380B Series G), AI Business Weekly (enterprise revenue surpassing OpenAI).
Model release dates: Anthropic's news index cross-referenced with per-model pages including the Sonnet 4.5 announcement.
Adoption: SemiAnalysis (4% GitHub commit share), SerpSculpt and getpanto.ai (Claude Code revenue), The AI Corner (Fortune 100, 7x enterprise growth), Backlinko (geographic data).
Limitations and what to keep in mind:
- Cloudflare Radar coverage. Cloudflare's network sits in front of at least 20% of the entire web — 330 cities in 125+ countries, 81M+ HTTP requests per second, and a 1.1.1.1 DNS resolver that handles 67M+ queries per second. That's the largest publicly observable cross-section of internet traffic outside hyperscaler clouds, which is why the AI-bot share and Generative AI ranking signals are reliable directionally. It still doesn't capture 100% of global web traffic, especially the parts behind walled gardens (CDN-free origins, dark-pool enterprise traffic, China's domestic CDNs), so treat the numbers as best-available rather than complete.
Last updated: October 1, 2026 (data through September 30; September provisional). Claude held #2 in generative AI on all 92 days of Q3 2026, 252 unbroken days through September 30. ClaudeBot finished Q3 at 13.23% of AI-bot traffic (up 2.97 points on Q3 2025), and Anthropic's crawl-to-referral ratio improved to 988:1, passing Perplexity's 1,083:1. Cloudflare's crawl-purpose history and several early-2026 user-agent months were revised and are re-based in the tables at the top. Next planned update: early January 2027 (Q4 2026 edition).
Previous update, September 3, 2026 (data through August 31). August unwound the June surge completely: ClaudeBot fell to 11.88% of AI-bot traffic, within 0.04 points of its August 2025 level, and its lead over GPTBot narrowed to 1.4x. Anthropic's crawl-to-referral ratio halved to 926:1 and claude.ai entered Cloudflare's top-ten referrer table at 0.30%. A day-by-day sweep of all 31 August days extended the verified #2 streak to 222 unbroken days. One revision: Cloudflare now returns 16.54% for ClaudeBot's July share against the 16.28% published on 1 August. Product, revenue and funding figures are unchanged historical snapshots. Next planned update: early October 2026. ✅ Published 1 October 2026 (Q3 2026 edition, above).
Previous update, August 1, 2026 (data through July 31). July put a ceiling on the June surge: ClaudeBot eased to 16.28% of AI-bot traffic while holding #2 and a 1.7x lead over GPTBot (9.74%), and Anthropic's crawl-to-referral ratio improved again to 1,917:1 from 38,744:1 a year earlier. A day-by-day sweep of the Generative AI ranking extended the verified #2 streak to 191 unbroken days, back to January 22, 2026, and turned up one correction: rank 3 alternates between Perplexity and Gemini, so only ranks 1 and 2 are genuinely stable. Product, revenue and funding figures are unchanged historical snapshots. Next planned update: early October 2026. ⚠️ The early-September update was published on 3 September 2026 and covers August data; it is now in the update history at the end of this post.
Previous update, July 3, 2026. The June crawl data reversed May's dip: ClaudeBot nearly doubled to 19.77% and became the #2 AI crawler overall, and the crawl-to-referral ratio improved to 3,385:1. The 129-day #2 GenAI streak was re-verified. Product, revenue, and funding figures are unchanged historical snapshots. Next planned update: early August 2026.
Frequently asked questions about Claude statistics
How did ClaudeBot do in Q3 2026?
ClaudeBot carried 13.23% of AI-bot traffic on Cloudflare's network in Q3 2026, up 2.97 points from 10.26% in Q3 2025 and level with Meta-ExternalAgent (13.28%) behind Googlebot (23.80%). It crawled about 1.6x GPTBot's volume (8.05%). Within the quarter it fell from 16.54% in July to 11.88% in August and held at 12.00% in September (provisional). Source: Cloudflare Radar ai/bots/summary/user_agent, Q3 2026 and Q3 2025, pulled 2026-10-01.
Did ClaudeBot keep growing after June 2026?
No. ClaudeBot eased from 19.77% of AI-bot traffic in June 2026 to 16.28% in July (16.54% on Cloudflare's revised series), a 3.48-point drop and its steepest monthly decline of the year. It then fell to 11.88% in August and held at 12.00% in September 2026. It stayed the #2 AI crawler behind Googlebot (24.52%) and still outcrawled GPTBot (9.74%) by 6.54 points. Source: Cloudflare Radar ai/bots/summary/user_agent, full-month July 2026.
How does ClaudeBot in July 2026 compare with July 2025?
It flipped the order. In July 2025 ClaudeBot ran 11.23% against GPTBot's 13.15%. In July 2026 it runs 16.28% against 9.74%, an 8.47-point swing in the gap over twelve months. Googlebot fell from 42.69% to 24.52% across the same window. Source: Cloudflare Radar ai/bots/summary/user_agent, full-month July 2025 and July 2026.
How much traffic does Anthropic send back for what it crawls?
In Q3 2026 Anthropic crawled 988 pages per referral sent, from 5,143:1 in Q2 2026 and 36,551:1 in Q3 2025. September alone read 555:1 (provisional). For the first time it is not the weakest return among major operators: Perplexity read 1,083:1 for the quarter, while OpenAI read 309:1 and Google 4.9:1. The ratio varies enormously by the kind of site crawled, from 25:1 on computer and electronics sites to 13,766:1 on news sites. Source: Cloudflare Radar bots/crawlers/summary/crawl_refer_ratio (normalization RATIO), Q3 2026, pulled 2026-10-01.
Why did ClaudeBot's share drop in May 2026?
ClaudeBot's monthly share fell from 11.69% in April 2026 to 9.73% in May, while GPTBot rose from 9.84% to 11.48%. The most likely explanation: OpenAI ramped up a training crawl burst in early May, possibly tied to GPT-5 training prep, while Anthropic's April surge (likely tied to Claude Opus 4.7's April 16 release) tapered off. The reversal narrowed over the month — GPTBot faded in the back half of May — so the full-month gap (1.75 points) is smaller than the mid-month reading suggested. June data confirmed it was a one-month reversal: ClaudeBot nearly doubled to 19.77% in June, retook the lead over GPTBot (9.40%), and rose to the #2 AI crawler overall behind Googlebot.
Did ClaudeBot recover after its May 2026 dip?
Yes, decisively. In full-month June 2026, ClaudeBot nearly doubled to 19.77% of AI-bot traffic (from 9.73% in May), retook the lead over GPTBot (9.40%), and became the #2 AI crawler overall behind only Googlebot (25.18%). Combined with Claude-SearchBot (3.27%), Anthropic's crawlers reached 23.04%, within about two points of Google. The trailing 7-day and 28-day windows read around 20.4% on July 2, so it wasn't a one-day blip. It didn't hold at that level, though. Full-month July came in at 16.28%, still #2 but 3.48 points off the June peak. Source: Cloudflare Radar ai/bots/summary/user_agent, full-month June 2026 and full-month July 2026.
Is Claude really #2 in generative AI?
Yes, by absolute traffic rank on Cloudflare Radar's Internet Services Ranking. Claude has held #2 in the Generative AI service category for 252 consecutive days (January 22 to September 30, 2026), behind only ChatGPT, verified against every daily snapshot. Rank 3 alternated between Perplexity and Gemini through most of September, so only the top two are genuinely stable. This is 1.1.1.1 DNS traffic, a top-200 services tracker, not a category-share calculator. Other methodologies (Similarweb web-traffic share, Apptopia mobile DAU) can rank the AI players differently because they measure different surfaces. Source: Cloudflare Radar ranking/internet_services/top, daily snapshots pulled 2026-09-03 and 2026-10-01.
How many Anthropic crawlers exist? ClaudeBot vs Claude-SearchBot
Anthropic operates two distinct crawlers. ClaudeBot is the training-purpose user agent that drove 11.69% of AI bot traffic in April 2026; it isn't in Cloudflare's curated AI_CRAWLER bot directory and appears in raw user-agent telemetry only. Claude-SearchBot is the navigational crawler that improves search results inside Claude, classified AI_SEARCH in Cloudflare's directory. Claude-SearchBot appeared in raw telemetry for the first time in May 2026 at 2.22% share, and reached 3.54% by full-month July 2026. Across Q3 2026 it averaged 3.30%, slipping to 2.72% in September. A third agent, Claude-User, fetches a page when a person asks Claude about it; it carried 0.38% of AI-bot traffic in Q3 2026. If you're writing robots.txt rules, treat them separately.
How many people use Claude Code?
Claude Code authors 4% of all public GitHub commits as of early 2026, per SemiAnalysis. Combined with $2.5B in annualized revenue inside nine months and the 46% "most loved" rating from the Pragmatic Engineer's 15,000-developer survey, Claude Code is the most-used AI coding tool by both revenue and adoption. SemiAnalysis projects the commit share will reach 20%+ by end of 2026.
How many paid subscribers does Claude have?
Paid subscribers at Anthropic more than doubled between October 2025 and early 2026, per The AI Corner. Anthropic doesn't break out an exact count publicly. The closest public number is 300,000+ business customers with 1,000+ accounts spending over $1M/year as of early 2026, per FatJoe.
What is Claude's revenue in 2026?
Anthropic hit a $14B annualized revenue run-rate in February 2026, then reported a $30B run-rate by April 2026, an 80x climb from the start of 2025. Anthropic's official 2026 revenue guidance is $15B (issued before the $30B April run-rate was reported), implying significant guidance upside if the April trajectory holds.
What are Claude AI usage statistics by country in 2026?
The U.S. and India together account for 33.13% of Claude's total user base, per Backlinko's compilation of Anthropic Economic Index data. The top 20 countries combine for 48% of per-capita usage, up from 45% in the prior reporting cycle.
How does ClaudeBot compare to GPTBot on web crawler traffic in 2026?
ClaudeBot ended 2025 in the #2 slot on Cloudflare Radar's AI bot user-agent ranking at 13.77%, ahead of GPTBot at 12.47%. In 2026 the lead changed hands monthly: ClaudeBot trailed GPTBot in January, February, and March, took the lead in April (11.69% vs 9.84%), lost it back in May (9.73% vs 11.48%), then reversed decisively in June, nearly doubling to 19.77% while GPTBot fell to 9.40%, the widest ClaudeBot lead of the year and enough to rank it #2 among all AI crawlers behind Googlebot. July then handed part of that back: ClaudeBot 16.28%, GPTBot 9.74%, a 6.54-point lead and still #2. Across Q3 2026 ClaudeBot read 13.23% against GPTBot's 8.05%, about 1.6x. ClaudeBot's 2025 volatility ratio (peak/trough = 2.64x) was roughly double GPTBot's in the same period.
Why did ClaudeBot crawler traffic dip in November 2025?
ClaudeBot share fell to 5.60% the week of 2025-11-24, the lowest reading since May 2024. The dip overlaps with a Cloudflare service degradation incident on 2025-11-18, but the surrounding weeks confirm the dip is broader than that single-day anomaly. The most likely explanations: publisher blocking changes in robots.txt and a temporary reallocation of Anthropic's crawl budget around the Opus 4.5 release window. Share recovered to 13.77% within five weeks.
Update history
Q3 2026 edition. Claude held #2 in generative AI on all 92 days of the quarter (252 days in a row through 30 September). ClaudeBot carried 13.23% of AI-bot traffic, tied with Meta-ExternalAgent for second behind Googlebot. Anthropic's crawl-to-referral ratio improved to 988:1, and Perplexity (1,083:1) passed it as the weakest return among major operators. Added a Q3 analysis, a full 2026 month-by-month table, a by-vertical referral table and an answer to how much traffic Claude sends back. Re-based early-2026 months Cloudflare has revised. Corrected two method claims that described an Anthropic detection layer we do not have. Next planned update: early January 2027 (Q4 2026 edition).
Updated September 3, 2026 (data through August 31). This is the update promised for early September.
ClaudeBot gave back the whole June surge and then some. It fell from 16.54% of AI-bot traffic in July to 11.88% in August — which puts it within 0.04 points of where it sat in August 2025 (11.92%). A full year of dramatic monthly swings has netted out to almost exactly nothing. It is still ahead of GPTBot, but the multiple is down from 1.7x to 1.4x, because GPTBot fell too.
The more interesting number moved the other way. Anthropic's crawl-to-referral ratio halved, from 1,917:1 to 926:1, and claude.ai appeared in Cloudflare's top-ten referrer table for the first time at 0.30% of crawler-observed referrals. Anthropic crawled less and referred more in the same month. That is the shape of a company shifting weight from training to answering, and it shows up in the population-level data too: AI crawling declared for Search rose from 11.56% to 16.45% while Training fell from 44.76% to 40.15%.
The #2 Generative AI rank is now unbroken for 222 days. I swept all 31 days of August individually: 31 of 31 at #2.
August 2026: the surge fully unwound, but the referral side improved
| Metric | Aug 2025 | Jul 2026 | Aug 2026 | MoM | YoY |
|---|---|---|---|---|---|
| ClaudeBot share of AI-bot traffic | 11.92% | 16.54% | 11.88% | −4.66 pt | −0.04 pt |
| GPTBot share | 12.25% | 9.73% | 8.34% | −1.39 pt | −3.92 pt |
| ClaudeBot as a multiple of GPTBot | 0.97x | 1.70x | 1.42x | down | up |
| Claude-SearchBot share | — | 3.54% | 3.69% | +0.15 pt | — |
| Anthropic share of all bot traffic | below 1.76% | 10.97% | 8.47% | −2.50 pt | large gain |
| Anthropic crawl-to-referral ratio | 38,744:1 | 1,917:1 | 926:1 | halved | 42x better |
| claude.ai referral share | not in top 10 | not in top 10 | 0.30% | entered | entered |
| Generative AI rank | — | #2 | #2 | 222 days | unbroken |
Source: Cloudflare Radar — radar/ai/bots/summary/user_agent, radar/bots/summary/bot_operator, radar/bots/crawlers/summary/{crawl_refer_ratio,referer}, radar/ranking/internet_services/top, calendar-month windows, pulled 2026-09-03. The crawl-to-referral ratio is RATIO normalized and unbounded. Anthropic did not appear in the August 2025 bot-operator top ten, whose tenth entry was 1.76%, so its share that month was below that figure rather than a measured value.
A year of swings that netted to zero
This post has reported ClaudeBot at 11.69% (April), 9.73% (May), 19.77% (June), 16.54% (July) and now 11.88% (August). Against 11.92% in August 2025. Every one of those monthly moves was real and several were reported here as turning points. The twelve-month change is 0.04 points.
That is worth sitting with before citing any single month of crawler share as a trend, including this one. The stable facts about Anthropic's crawler over the year are that it went from behind GPTBot to ahead of it, and that its crawl-to-referral ratio improved 42-fold. Its share of AI-bot traffic is not one of the stable facts.
ranking/internet_services/top with serviceCategory=Generative AI, checking rank 2 on every individual date from 22 January to 31 August 2026, not an inference from monthly snapshots. Rank 3 alternates between Perplexity and Gemini — Perplexity held it in August, Gemini in July — so only ranks 1 and 2 are stable enough to cite. There is no first-party layer in this post: our crawler has no Anthropic detection signature, so we have nothing honest to add from our own data and are not going to invent a proxy for it.Updated August 1, 2026 (data through July 31). July says the June surge peaked. ClaudeBot eased from 19.77% of AI-bot traffic in June to 16.28% in July, a 3.48-point drop in one month. It is still the #2 AI crawler behind Googlebot, and it still outcrawls GPTBot (9.74%) by 6.54 points. But the June edition of this post read that surge as a comeback that was still climbing, and it wasn't. What did hold is the year-over-year picture: twelve months ago ClaudeBot trailed GPTBot 11.23% to 13.15%, and today it leads by 6.54 points. The #2 Generative AI rank is now unbroken for 191 days. One naming note, stated once: the "(August 2026 Update)" stamp says when I refreshed the post. The data covers full-month July 2026.
Key findings, newest first. The August 2026 update (July data) sits above the July 2026 update (June data):
- ClaudeBot eased to 16.28% of AI-bot traffic in full-month July 2026, down 3.48 points from June's 19.77% peak. It held #2 behind Googlebot (24.52%), ahead of Meta-ExternalAgent (12.65%) and GPTBot (9.74%). Splitting the month confirms the direction rather than a single bad day: 18.05% across July 1-15, 14.65% across July 16-31. Source: Cloudflare Radar
ai/bots/summary/user_agent, full-month July 2026.- Like for like against July 2025, ClaudeBot flipped the crawl order. A year ago it trailed GPTBot 11.23% to 13.15%. In July 2026 it leads 16.28% to 9.74%, an 8.47-point swing in the gap and roughly 1.7x GPTBot's volume. Source: Cloudflare Radar
ai/bots/summary/user_agent, full-month July 2025 vs full-month July 2026.- Claude has held #2 in Cloudflare's Generative AI ranking for 191 consecutive days (January 22 to August 1, 2026). I checked every day of July on its own: 31 of 31 at #2. The run starts well before the "at least 129 days" floor published in the July edition. Source: Cloudflare Radar
ranking/internet_services/top, daily snapshots.- Anthropic's crawl-to-referral ratio fell to 1,917:1 in July, from 3,386:1 in June and 38,744:1 in July 2025, a 20x improvement across the year. OpenAI reads 251:1 and Google 5:1, so Anthropic still returns the least traffic of the operators that send referrals at scale. Source: Cloudflare Radar
bots/crawlers/summary/crawl_refer_ratio(normalization RATIO), full-month July 2026.- At operator level Anthropic is #3 at 10.97% in July, behind Google (27.05%) and Meta (14.60%), and about 1.7x OpenAI (6.54%). Anthropic does not appear in Cloudflare's July 2025 operator table at all; the lowest named operator that month was Huawei at 1.80%. Source: Cloudflare Radar
bots/summary/bot_operator.Below this line: the July 2026 update bullets (June data), preserved as originally published.
- As of full-month June 2026, ClaudeBot reversed its May trough and nearly doubled to 19.77% of AI-bot traffic, retaking the lead over GPTBot (9.40%) and rising to the #2 AI crawler overall, behind only Googlebot (25.18%). With Claude-SearchBot (3.27%), Anthropic's two crawlers reach 23.04% combined, within about two points of Googlebot at the top of the table. Source: Cloudflare Radar
ai/bots/summary/user_agent, full-month June 2026.- Claude has held #2 in Cloudflare's Generative AI service ranking for at least 129 days (Feb 24 – July 3, 2026), behind only ChatGPT and ahead of Perplexity. Source: Cloudflare Radar
get_internet_services_timeseries.- ClaudeBot 11.69%, GPTBot 9.84% in April 2026 monthly AI bot share — the first month in 2026 ClaudeBot finished ahead. Source: Cloudflare Radar
bots/summary/user_agent.- May 2026 (full month) flipped it back: GPTBot 11.48%, ClaudeBot 9.73% — a 1.75-point reversal, and Bytespider passed ClaudeBot as well (both reversed in June, see the lead finding above).
- Claude-SearchBot appears in raw user-agent telemetry for the first time in May 2026 at 2.22% share (3.27% by full-month June) — Anthropic's separate AI_SEARCH crawler is now visible to publishers.
- $14B annualized revenue in February 2026, $30B run-rate by April — a 14x jump from $1B at end-2024, then another doubling in two months. SaaStr / VentureBeat.
- $380B Series G valuation (February 2026) — the largest single funding round in private-tech history at the time. DemandSage.
- Claude Code authors 4% of all public GitHub commits as of early 2026, on a $2.5B annualized revenue run-rate inside nine months. SemiAnalysis.
- Crawl purpose shifted to training-dominant: 51.80% of AI bot requests were training-only in full-month May 2026, up from 40.90% in the 52-week aggregate; by full-month June this eased to 47.25% as mixed-purpose crawls rose to 39.03%.
- AI crawl mix varies sharply by country: shopping sites take 31.7% of AI crawler traffic globally and 28.2% in the U.K., but only 9.6% in India, where internet/telecom (28.3%) and gambling (15.8%) lead instead. Source: Cloudflare Radar
bots/summary/verticalby location, May 2026.- Curated, not just gathered: every Cloudflare number in this post was queried, normalized, and cross-referenced against Claude integration patterns detected across our 29.9M active-domain index at TechnologyChecker.io (Anthropic SDK references, embedded chat widgets, "Built with Claude" markers in HTML and meta). The insights are interpretation, not raw API output.
⚠️ Correction, 1 October 2026: TechnologyChecker has no Anthropic detection signature, so the cross-reference this bullet describes could not have been made. The Cloudflare figures above stand; the method claim does not. Preserved as originally published.
Claude has held #2 in the Cloudflare Radar Generative AI category for at least 129 days (Feb 24 – July 3, 2026), behind only ChatGPT. The crawler story just swung Anthropic's way too: ClaudeBot beat GPTBot in April 2026 (11.69% vs 9.84%), lost the lead across the full month of May (9.73% vs 11.48%), then reversed hard in June, nearly doubling to 19.77% and vaulting to the #2 AI crawler overall behind Googlebot, while GPTBot slipped to 9.40%.
About the author: Emre Elbeyoglu is the Growth & AI Advisor at TechnologyChecker with 15 years in SEO, GEO, and growth marketing. He co-founded Popupsmart (600+ clients), LiveChatAI (featured in WIRED), and Flatart, and has run growth programs for Investing.com, Rakuten, and EuroDNS. His work focuses on reverse-engineering how AI ranking systems decide what to surface — the same lens he applied to this Claude statistics pull, first on June 1 and refreshed with country and device breakdowns on June 12, 2026. Connect on LinkedIn or X, or read his full author profile.

Growth & AI Advisor
15+ years of experience
Emre is a growth marketer, maker, and entrepreneur.
- Computer Technology & Information Systems, Bilkent University
- Co-founder & Growth Lead, Popupsmart (2019-2026)
- Co-founder, LiveChatAI (since 2023)
Never miss our research