Gen Z UK Social Media Statistics 2026: TikTok, SHEIN & AI Trends
70+ Gen Z UK social media stats for 2026: TikTok 120 min/day, SHEIN displaces ASOS, chatgpt.com hits UK #21, OpenAI bots 18% of UK AI traffic.
Published •Updated •43 min read


Generation Z is 19.4 percent of the UK population. Roughly 12.93 million people. And they've reshaped how the country uses social media in ways that, honestly, I didn't fully appreciate until I sat down with all the data in one place.
UK Gen Zers spend 120 minutes a day on TikTok (4x more than Instagram), recall ads on video portals (47%) more than on television (40%), and helped drive SHEIN downloads from 4 million in 2021 to over 6.65 million in 2023. I pulled 70+ data points from Statista's 2025 trend dossier on Gen Z and the internet in the UK, then cross-referenced them with the latest Cloudflare Radar Q1 2026 UK telemetry. Where the survey data and our network data point the same direction, you'll see it called out. Where they diverge, that's usually the more interesting finding.
Updated June 2026 with live Cloudflare Radar UK telemetry: mobile OS share crossed 51% in Q1, chatgpt.com reached #21 in the UK domain ranking (full breakdown in our ChatGPT statistics 2026), and OpenAI bots (ChatGPT-User + GPTBot) accounted for 18.22% of UK AI bot traffic. A fresh 28-day pull (12 May – 9 June 2026) shows the picture moving fast: Meta's crawler overtook Bingbot to become the UK's #2 AI bot at 13.89%, and mobile-OS share slipped back to a razor-thin 49.28%. See the Cloudflare Radar cross-reference section and the new June 2026 refresh for the full breakdown.
Key findings:
- 19.4% of the UK population is Gen Z — 12.93 million people aged 11 to 26 in 2023. -- Office for National Statistics
- 67% of UK Gen Z access social media daily, slightly below the 70% national average. -- Statista
- 120 minutes per day on TikTok for UK users aged 15-24 — more than any other platform. -- Ipsos Iris / UKOM
- 47% of Gen Z recall ads on video portals, beating TV ads (40%) for the first time. -- Statista
- 53% of UK shoppers would buy more sustainable products if they were more affordable. -- Deloitte / YouGov
- SHEIN added 2.05 million new UK users between December 2023 and March 2024 — more than Temu (1.29 million). -- UKOM
- TikTok reaches 69% of UK Gen Z seeking cost-of-living crisis content, more than Instagram (49%) or YouTube (46%). -- Statista
- 15.5% of UK children had used the OpenAI website by end of 2023 — below the 19.6% global average. -- Qustodio
- 52% of UK parents of 11-15-year-olds oppose a government smartphone sales ban for under-16s. -- YouGov
- NEW Q1 2026 telemetry (Cloudflare Radar): iOS + Android = 51.01% of UK HTTP requests; chatgpt.com is #21 in the UK domain ranking (above youtube.com at #23); OpenAI bots account for 18.22% of UK AI bot traffic, Anthropic's ClaudeBot 8.85%.
Pull it all together and you get a generation that's online more than any in UK history, but more critical of being online than any in UK history. They binge TikTok but call it "brainrot." They shop SHEIN but resell on Vinted. They claim to distrust influencer recommendations, then engage with content creators 62% of the time, well above the millennial rate of 54%.
For brands, that contradiction isn't a problem to solve. It's the whole story.
Chapter 1: who is Generation Z in the UK?
Gen Z isn't the largest UK cohort. It's the most culturally influential when it comes to the internet, which is a different thing. Knowing the population structure helps explain why their preferences disproportionately shape platforms, retailers, and political campaigns.

UK population by generation in 2023
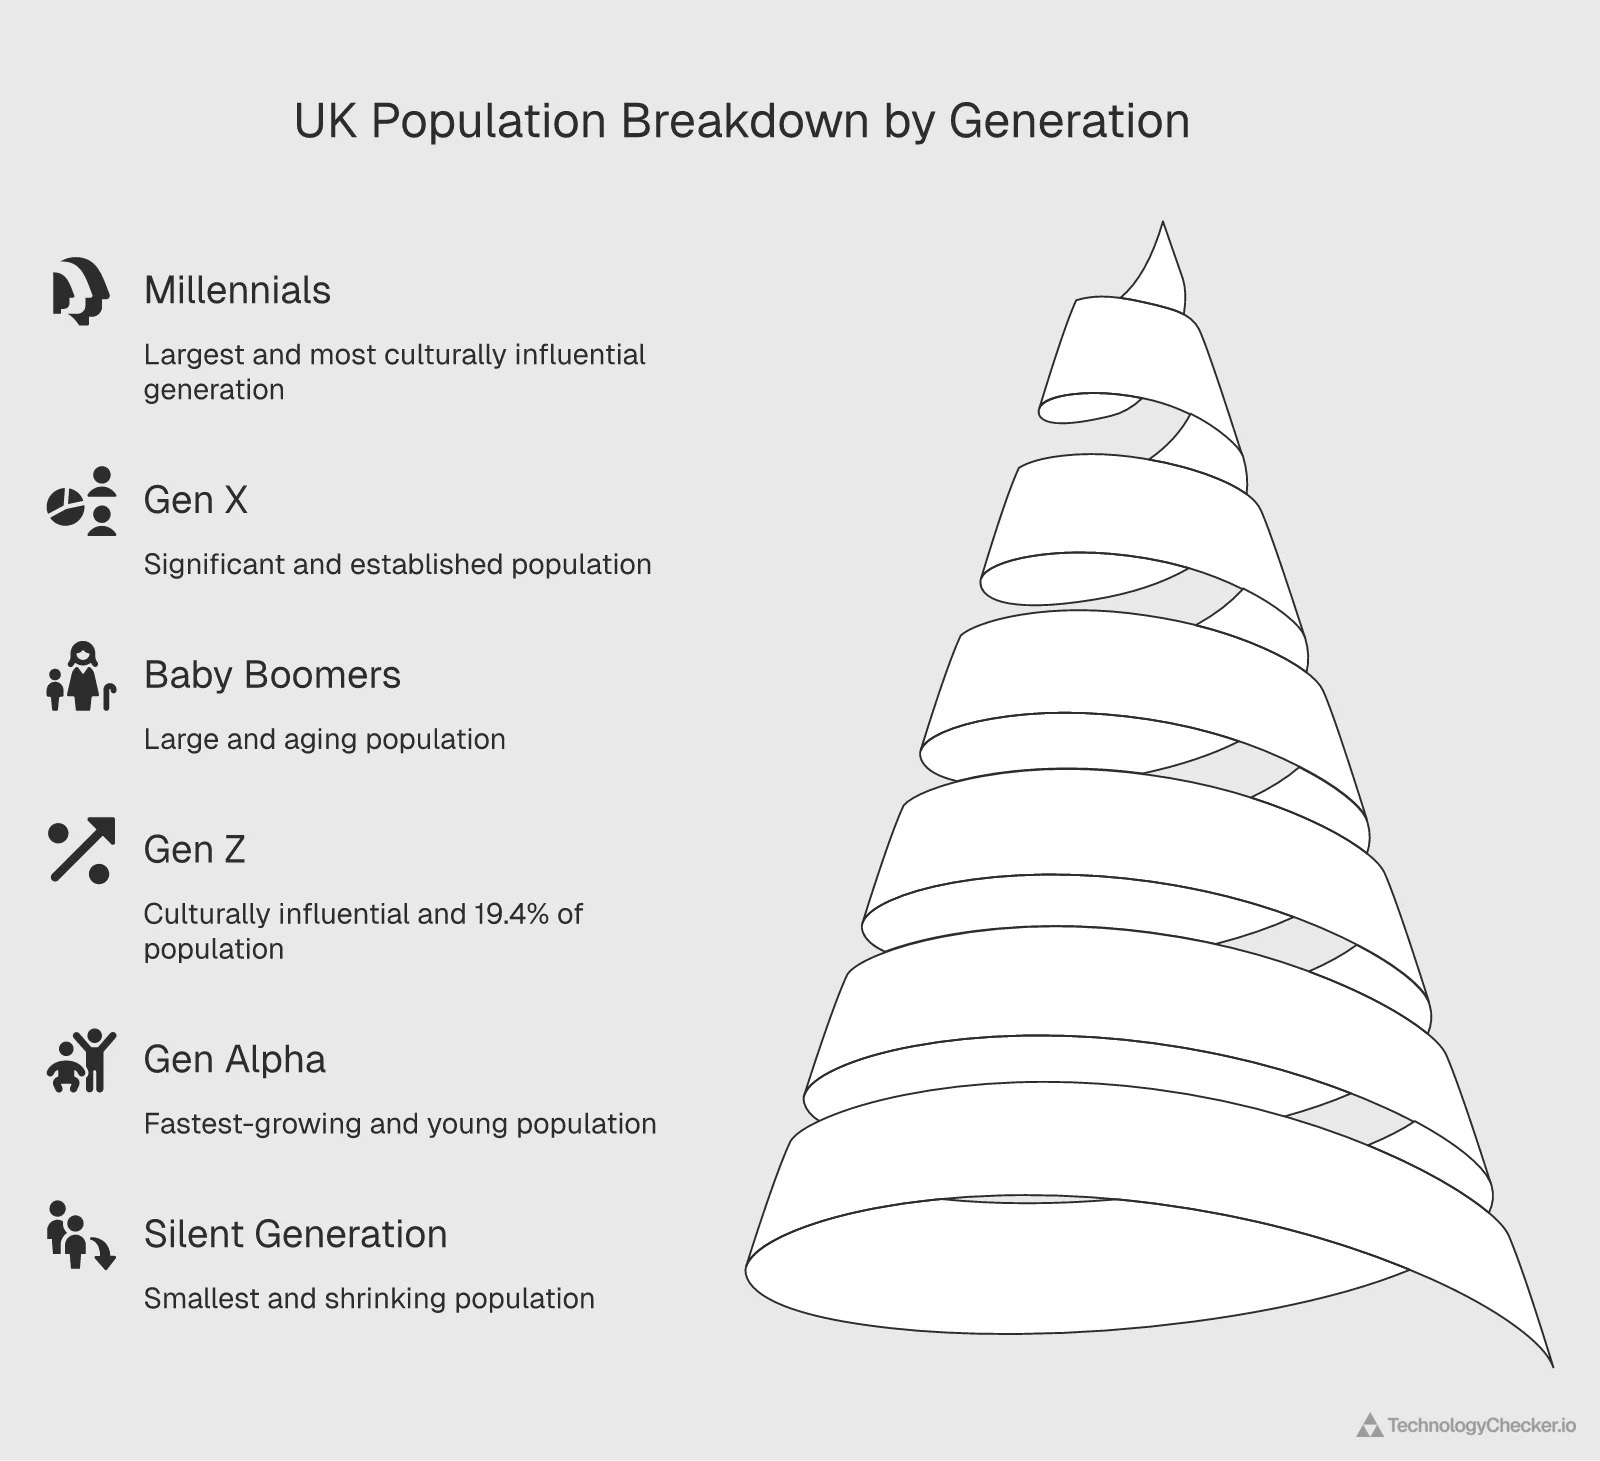
UK Population by Generation 2023: Gen Z is 19.4% (12.93 Million)
Millennials are the largest UK generation at 21.5%, followed by Gen X (20.6%), Baby boomers (19.9%), and Gen Z (19.4%) — equivalent to roughly 12.93 million people aged 11 to 26 in 2023. Gen Alpha already accounts for 12.2% as it replaces the shrinking Silent generation (6.3%).
Source: Office for National Statistics (UK) · 2023
| Label | Value |
|---|---|
| Millennials | 21.5% |
| Gen X | 20.6% |
| Baby boomers | 19.9% |
| Gen Z | 19.4% |
| Gen Alpha | 12.2% |
| Silent generation | 6.3% |
- Gen Z is the fourth-largest UK generation but disproportionately shapes internet culture
- Gen Z + Gen Alpha combined = 31.6% of the UK — already larger than millennials
- Silent generation is fading at 6.3% as Gen Alpha (12.2%) doubles its share
In 2023, Millennials remained the largest UK generation at 21.5%, with Gen X close behind at 20.6% and Baby boomers at 19.9%. Gen Z represents 19.4% — the fourth-largest cohort but climbing fast as Gen Alpha (currently 12.2%) replaces older Silent Generation members (6.3%).
That ranking matters more than it appears. Gen Z is the first cohort to enter adulthood with full digital fluency, which means their consumer preferences are tested on every platform that older generations later adopt. TikTok proves the point: UK Gen Z drove early growth, but 63% of users now aged 25-34 (older Gen Z + young millennials) shows how the platform broadened from Gen Z's initial adoption.
Emma Davies, Data Analyst at TechnologyChecker: "When I build prospect lists for B2C clients targeting UK consumers under 30, I now treat Gen Z and younger millennials as a combined buying signal. The two cohorts overlap at age 25-30, and our technographic data shows that companies serving one segment almost always pick up the other within 18 months. The wall between them has collapsed."
Generation Z population by age and gender
UK Gen Z Age Cohort Sizes 2023: Bimodal Peaks at 12 and 26
UK Gen Z is bimodal: the oldest cohort (age 26) is the largest single-year group at roughly 887,000 people, with the youngest end (age 12) close behind at 849,000. The smallest groups sit in the middle (ages 17-19, around 788,000-795,000). A 13-year-old and a 26-year-old share little besides age range — lifecycle, period, and cohort effects diverge sharply within the same generation.
Source: Office for National Statistics (UK) · 2023
| Age (years) | Estimated UK population |
|---|---|
| Age 11 | 825000 |
| Age 12 | 849000 |
| Age 13 | 820000 |
| Age 14 | 815000 |
| Age 15 | 800000 |
| Age 16 | 795000 |
| Age 17 | 788000 |
| Age 18 | 790000 |
| Age 19 | 795000 |
| Age 20 | 800000 |
| Age 21 | 805000 |
| Age 22 | 810000 |
| Age 23 | 825000 |
| Age 24 | 855000 |
| Age 25 | 870000 |
| Age 26 | 887000 |
- Largest single-year cohort: age 26 (887,000)
- Smallest single-year cohort: age 17 (788,000)
- Bimodal distribution — peaks at both ends of the cohort age range
This chart breaks down UK Gen Z by single year of age (11 to 26) and gender. Two patterns stand out:
- The oldest cohort (age 26) totals 887,000 people — the largest single-year group in UK Gen Z.
- The youngest end (age 12) follows closely at 849,000, while the smallest groups sit in the middle (ages 17-19, around 788,000-800,000 each).
This bimodal distribution explains why "Gen Z" as a marketing target is so unstable. A 13-year-old who joined TikTok at age 9 and a 26-year-old who joined the workforce pre-pandemic share little besides age range. Lifecycle effects, period effects, and cohort effects diverge sharply within the same generation.
Statista applies three age-cohort analysis frameworks to this data:
- Lifecycle effect: young people vote less and engage less with politics. In the 2019 UK general election, only 54.5% of 18-24 year-olds voted, compared to 70% of 35-44 year-olds.
- Period effect: shared events shape similar responses. Over half of Gen Z internet users in the U.S. and UK reported watching more online videos during the pandemic; 18% reported reading more books.
- Cohort effect: historical circumstances permanently mark the cohort. For UK Gen Z, that means coming of age during the cost-of-living crisis, the rise of generative AI, and the post-Brexit identity debate.
What shapes the Gen Z experience?
Gen Z UK Life Priorities 2024: 48% Choose Success vs 28% Nationally
Asked to rank what matters most in life, UK Gen Z places significantly more emphasis on being successful (48% vs 28% nationally) and advancing their career (23% vs 13%) than older cohorts. The popular narrative of Gen Z as anti-work doesn't match the polling data.
Source: Statista · May 2024
| Life priority | Share of respondents (%) |
|---|---|
| A happy relationship | 53% |
| To be successful | 48% |
| Having a good time | 44% |
| Honest & respectable life | 35% |
| Safety and security | 33% |
| Learning new things | 24% |
| Advancing my career | 23% |
| Making my own decisions | 23% |
| Social justice | 11% |
| Traditions | 7% |
- Gen Z is 20 percentage points more career-success-driven than the UK average
- Career advancement gap: Gen Z 23% vs all respondents 13%
- Only 11% of Gen Z rank social justice as a top priority — roughly equal to the national average
Asked to rank what matters most in life, UK Gen Z diverges from the general population in revealing ways:
| Life priority | Gen Z | All respondents | Gen Z gap |
|---|---|---|---|
| A happy relationship | 53% | 58% | -5pp |
| To be successful | 48% | 28% | +20pp |
| Having a good time | 44% | 35% | +9pp |
| An honest and respectable life | 35% | 48% | -13pp |
| Safety and security | 33% | 42% | -9pp |
| Learning new things | 24% | 25% | 0pp |
| Advancing my career | 23% | 13% | +10pp |
| Making my own decisions | 23% | 29% | -6pp |
| Social justice | 11% | 12% | -1pp |
| Traditions | 7% | 10% | -3pp |
The 20-percentage-point gap on "to be successful" is the most striking number in the entire dossier. UK Gen Z is significantly more career-oriented than older cohorts — and 10 percentage points more invested in career advancement. The popular media narrative of Gen Z as anti-work or "quiet quitting" does not match what they tell pollsters.
Only 11% rank social justice as a top priority, marginally behind the population average. That doesn't mean Gen Z doesn't care about social issues — it means survey rankings force trade-offs, and when forced to choose, success and good times beat traditions and ideology.
How Gen Z views money: the cost-of-living crisis effect

Gen Z UK Personal Finance Attitudes 2024: 33% Worry About the Future
UK Gen Z is simultaneously financially anxious and financially confident in digital tools. 33% worry about their financial future, while 29% would conduct all financial transactions exclusively via smartphone — a number that has roughly tripled in the last six years.
Source: Statista · Q1 2024
| Financial attitude | Share of UK Gen Z respondents (%) |
|---|---|
| I'm worried about my financial future | 33% |
| I'm well informed about my financial situation | 29% |
| Would handle finances exclusively via smartphone | 29% |
| Would handle finances exclusively online | 23% |
| Donated to charity in past 12 months | 23% |
| Could save a lot with finance expert advice | 19% |
| Happy to pay for account administration if service is good | 17% |
| Online services make me confident handling finances | 17% |
| Crypto and NFTs fascinate me | 13% |
- 33% of UK Gen Z are worried about their financial future — the single most-shared sentiment
- 29% would run their finances entirely from a smartphone — a 2-3x increase in six years
- Only 13% are fascinated by crypto and NFTs, well below the 2021-22 boom era
The single most common Gen Z financial attitude in the UK is worry: 33% report being concerned about their financial future. The next bracket is roughly tied: 29% feel well-informed about their personal financial situation, and 29% would handle all financial transactions exclusively via smartphone.
This is a cohort that is simultaneously financially anxious and financially confident in digital tools. Other signals from the chart:
- 23% would conduct all financial transactions exclusively online (web, not just mobile)
- 23% donated to charity in the past 12 months
- 19% believe a finance expert could help them save significantly
- 17% are happy to pay for account administration if service is good — a notable pricing signal for fintech
- 13% are fascinated by crypto and NFTs — well below the noise level of the 2021-22 boom
Behind these numbers sit harder realities. According to Statista's source notes, 48% of UK Gen Z have already accumulated credit card debt, and 18% have used buy-now-pay-later or payday loan services. The financial future worry is not abstract.
Sophie Clarke, Product Marketing Manager at TechnologyChecker: "The 29% who'd run their finances entirely through their phone is the most actionable number on this page for fintech go-to-market teams. Six years ago that figure was in the low teens. App-first banking is no longer a niche feature — for nearly a third of UK Gen Z, it's the default expectation."
Chapter 2: Gen Z and the internet
If millennials grew up online, Gen Z grew up in online. The next charts trace how that played out across the cohort's lifetime, and how their daily internet use looks today.
The Gen Z internet timeline (1995-2024)
UK Internet Penetration 1995-2024: From 2% to 98% in Gen Z's Lifetime
UK internet penetration was just 7% in 1997, the year the oldest Gen Zers were born. By 2010, it had reached 85%. Today it sits at 98%. For the youngest Gen Zers (born 2012), the internet has been at or above 90% penetration for their entire life — there is no pre-broadband memory, no dial-up patience, no fight over the phone line.
Source: DataReportal, GWI, Meltwater, We Are Social · 1995-2024
| Year | Internet users as share of UK population (%) |
|---|---|
| 1995 | 2% |
| 1996 | 4% |
| 1997 | 7% |
| 1998 | 14% |
| 1999 | 21% |
| 2000 | 27% |
| 2001 | 34% |
| 2002 | 56% |
| 2003 | 65% |
| 2004 | 66% |
| 2005 | 70% |
| 2006 | 69% |
| 2007 | 75% |
| 2008 | 78% |
| 2009 | 84% |
| 2010 | 85% |
| 2011 | 85% |
| 2012 | 87% |
| 2013 | 90% |
| 2014 | 92% |
| 2015 | 92% |
| 2016 | 95% |
| 2017 | 90% |
| 2018 | 91% |
| 2019 | 93% |
| 2020 | 95% |
| 2021 | 98% |
| 2022 | 98% |
| 2023 | 98% |
| 2024 | 98% |
- Gen Z's earliest cohort (born 1997) entered a UK at just 7% internet penetration — by primary school they were at 85%
- By 2010 the UK had crossed the 85% threshold — earlier than most G7 countries
- Penetration has plateaued at 98% since 2021 — the UK is essentially fully online
This is the most contextually important chart in the dossier, and honestly the one I keep coming back to. UK internet penetration was just 7% in 1997, the year the oldest Gen Zers were born. By the time that 1997 cohort started school (2003), penetration had climbed to 56%. By the time they hit secondary school (2010), it had reached 85%. Today it sits at 98%.
For the youngest Gen Zers (born 2012), the internet has been at or above 90% penetration for their entire life. They have no pre-broadband memory, no dial-up patience, no "you need to get off the internet so I can use the phone" childhood. That is genuinely new in human history.
The chart also overlays cultural milestones that Gen Z lived through in real time:
- 2005: First YouTube video, Facebook reaches the UK
- 2007: First iPhone
- 2010: First Tweet
- 2014: iPhones overtake BlackBerry sales in the UK
- 2018: Mobile traffic surpasses desktop for top UK newspapers
- 2020: UK enters first COVID-19 lockdown
- 2021: TikTok surpasses one billion downloads globally
- 2022: OpenAI releases ChatGPT — kicking off the AI market boom forecast to reach $1.67T by 2031 (see our AI market size statistics 2026)
- 2023: Online Safety Act passes in the UK
Mehmet Suleyman, CEO of TechnologyChecker: "I started at Microsoft on the Bing team right around 2014, the year iPhones overtook BlackBerry in the UK. What I watched from inside the search index — and what this chart captures from the outside — is that mobile didn't replace the desktop web. It generated an entirely new web of apps, in-feed search, and now AI chat. Gen Z is the first cohort whose mental model of 'going online' is app-first, not browser-first. That shift breaks a lot of B2B GTM assumptions about how decision-makers discover tools."
Media use among UK Gen Z
UK Gen Z Digital Media Users 2023: 12.7M Online, 5.3M Podcast Listeners
12.7 million UK Gen Z are internet users, and 97% of them watch digital video. The podcast number (5.3 million, or 42% of UK Gen Z internet users) is the surprise — more than half of UK Gen Z does not listen to podcasts. For audio advertisers, that's a useful corrective to the 'Gen Z = podcast generation' narrative.
Source: eMarketer · March 2023
| Digital media type | UK Gen Z users (millions) |
|---|---|
| Internet users | 12.7M |
| Digital video viewers | 12.3M |
| Smartphone users | 11.8M |
| Social network users | 10.4M |
| Podcast listeners | 5.3M |
- 97% of UK Gen Z internet users also watch digital video — near-saturation
- 2.3 million UK Gen Z internet users are NOT on social networks — an under-targeted audience
- Podcast penetration of UK Gen Z is 42% — large in absolute terms but a minority of the cohort
In March 2023, the UK counted:
- 12.7 million Gen Z internet users
- 12.3 million digital video viewers (97% of Gen Z internet users watch video online)
- 11.8 million smartphone users (smartphone penetration ≈ 93% of Gen Z internet users)
- 10.4 million social network users (82% of Gen Z internet users on social platforms)
- 5.3 million podcast listeners (42% of Gen Z internet users)
The podcast number is the surprise. The popular narrative says Gen Z drives podcast growth — and the absolute number (5.3 million UK Gen Z listeners) is large — but the relative penetration of 42% means more than half of UK Gen Z does not listen to podcasts. For audio advertisers, that's a useful corrective: podcasts are a strong channel, but not a universal Gen Z reach play.
The 4-million-user gap between "internet users" and "social network users" is also worth noting. More than 2 million UK Gen Z internet users are not on social networks at all. This subset rarely appears in marketing planning, but for B2B SaaS, education tech, and gaming, they're an addressable audience.
Daily internet use by age and device
UK Daily Internet Use by Age and Device 2024: Mobile Peaks at 83% for 25-44
Smartphones are the dominant entry point to the internet for everyone under 55. The peak smartphone share (83%) is in the 25-44 bracket — older millennials and Gen X who lean less on laptops than Gen Z students do. Tablet use rises sharply past age 55 as the screen-size accessibility benefit kicks in.
Source: Ipsos Iris, UKOM · March 2024
| Age group | Share of daily internet use (%) |
|---|---|
| Total (15+) | 75% |
| 15-24 (Gen Z) | 77% |
| 25-34 | 83% |
| 35-44 | 83% |
| 45-54 | 78% |
| 55-64 | 68% |
| 65-74 | 57% |
| 75+ | 56% |
- Smartphone use peaks at 83% for 25-44 year-olds, not the youngest Gen Z (77%)
- Tablet use more than doubles between 35-44 (10%) and 65-74 (25%) — a screen-size accessibility shift
- PC/laptop share is U-shaped: highest at age extremes (15-24 students and 65+ retirees)
The device split tells the platform story:
| Age group | PC/Laptop | Smartphone | Tablet |
|---|---|---|---|
| Total (15+) | 13% | 75% | 12% |
| 15-24 (Gen Z) | 14% | 77% | 9% |
| 25-34 | 11% | 83% | 6% |
| 35-44 | 8% | 83% | 10% |
| 45-54 | 12% | 78% | 10% |
| 55-64 | 14% | 68% | 17% |
| 65-74 | 18% | 57% | 25% |
| 75+ | 19% | 56% | 25% |
The peak smartphone share (83%) is actually in the 25-44 bracket, not the youngest Gen Z. The 15-24 cohort still uses laptops for school work, which slightly suppresses their mobile share.
Statista's commentary notes three forces driving the small but real "dumbphone revival" among UK Gen Z:
- Self-assessed impact of social media on mental well-being
- Vintage and nostalgia trends captivating younger users
- Rising suspicion toward data-hungry technologies such as apps and online ads
Even with these forces, smartphones are projected to remain the top-selling mobile device in the UK indefinitely.
Time spent on mobile apps and where it goes
UK Mobile App Time Spent 2019-2023: Peaked at 4.14 Hours/Day in 2022
Daily UK mobile time rose from 3.0 hours in 2019 to a 4.14-hour peak in 2022, then fell to 3.49 hours in 2023. The 2023 dip is real but the baseline is still 49 minutes higher than pre-pandemic 2019 — the pandemic permanently elevated mobile time rather than just shifting it temporarily.
Source: Data.ai, DataReportal, Meltwater, We Are Social · 2019-2023
| Year | Daily time on mobile (hours) |
|---|---|
| 2019 | 3h |
| 2020 | 3.7h |
| 2021 | 4h |
| 2022 | 4.14h |
| 2023 | 3.49h |
- Peak mobile time: 4.14 hours/day in 2022 — a 38% increase over 2019
- 2023 declined to 3.49 hours but stayed 49 minutes above pre-pandemic baseline
- The 2020 jump (+0.70 hours/day) reflects the first full pandemic year
UK Mobile Time by App Category 2023: 62.7% Goes to Social + Entertainment
Social media (35.3%) and entertainment (27.4%) together account for 62.7% of all UK mobile time. That concentration is why social and video platforms have been able to price creative inventory at premium levels — they own most of the audience attention.
Source: Data.ai, DataReportal · 2023
| Label | Value |
|---|---|
| Social media | 35.3% |
| Entertainment | 27.4% |
| Utility & productivity | 15.6% |
| Gaming | 12.2% |
| Shopping | 7.9% |
| Other apps | 1.6% |
- Social media is the single largest category at 35.3% — more than entertainment, gaming, and shopping combined?
- Entertainment + social media = 62.7% of UK mobile attention
- Gaming (12.2%) is bigger than shopping (7.9%) on mobile despite the e-commerce hype
UK time on mobile and apps per day:
- 2019: 3 hours 00 minutes
- 2020: 3 hours 42 minutes (+24% vs 2019, pandemic surge)
- 2021: 4 hours 00 minutes (peak buildup)
- 2022: 4 hours 14 minutes (peak)
- 2023: 3 hours 49 minutes (-25 min vs 2022)
The 2023 dip is real — UK mobile users dropped roughly 25 minutes per day from the 2022 peak — but the current baseline is still 49 minutes higher than pre-pandemic 2019. The pandemic did not just shift behavior temporarily; it permanently elevated mobile time.
Where that time goes in 2023:
- Social media: 35.3% (the single largest category)
- Entertainment: 27.4%
- Utility and productivity: 15.6%
- Gaming: 12.2%
- Shopping: 7.9%
- Other apps: 1.6%
Together, entertainment and social media account for 62.7% of all UK mobile time. For brands trying to reach mobile users, that concentration explains why social and video platforms have priced creative inventory at premium levels.
Chapter 3: social media, community, obsession, protest
If one chapter defines this report, it's this one. Gen Z is the first cohort to use social media as community infrastructure rather than as supplementary communication. The consequences cut both ways, and the data here is occassionally contradictory in ways that aren't easy to reconcile.

Leading social media apps among UK Gen Z
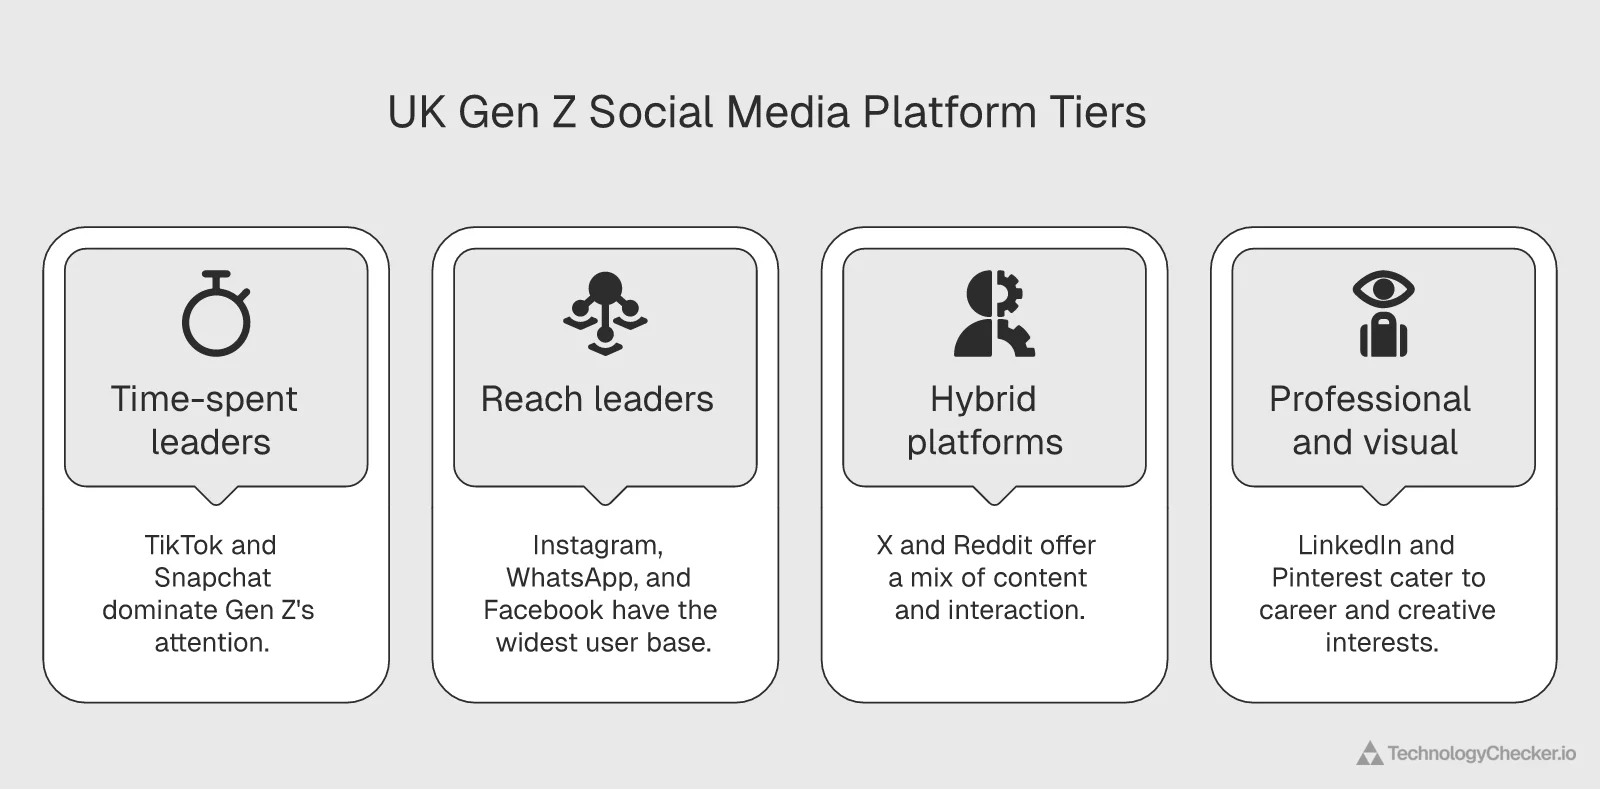
UK Gen Z Social Media Apps 2023: TikTok Wins 118 Min/Day Despite 38% Reach
Instagram has the highest reach among UK Gen Z (53%), but TikTok dominates daily time — 118 minutes per day, nearly 4x Instagram's 29 minutes. Snapchat is the dark horse: 45% reach but 80 minutes per day, the second-highest engagement. Reach-first and time-first social strategies lead to different platform choices.
Source: Ipsos Iris, UKOM · August 2023
| Platform | Reach (%) and time spent (minutes/day) |
|---|---|
| 53 | |
| 52 | |
| 49 | |
| Snapchat | 45 |
| TikTok | 38 |
| X (formerly Twitter) | 23 |
| 18 | |
| 8 | |
| 6 |
- TikTok dominates time (118 min/day) despite lower reach than Instagram
- Snapchat: only 45% reach but 80 minutes/day — a hidden engagement giant
- Instagram's 53% reach is highest but its 29-min daily engagement is roughly average
This chart contains the most important insight in the dossier: reach and engagement diverge sharply on social platforms.
| Platform | Reach (Gen Z) | Time spent (min/day, 15-24) |
|---|---|---|
| 53% | 29 | |
| 52% | 18 | |
| 49% | 22 | |
| Snapchat | 45% | 80 |
| TikTok | 38% | 118 |
| X (formerly Twitter) | 23% | 25 |
| 18% | 23 | |
| 8% | 6 | |
| 6% | 10 |
Instagram has the highest reach (53%), but TikTok dominates time spent — 118 minutes per day, nearly 4x Instagram's 29 minutes. Snapchat, with the third-highest time spent (80 minutes), is the dark horse of the chart: 45% reach but disproportionate daily engagement.
For marketers, this means reach and engagement deliver different outcomes. A campaign on Instagram reaches more Gen Zers; a campaign on TikTok reaches fewer Gen Zers but holds their attention for far longer. Cost-per-impression is misleading on platforms where attention quality varies by an order of magnitude.
Sophie Clarke: "I worked on a SaaS product launch last year that initially planned the full social media spend on Instagram. After we ran a small test, TikTok delivered 3.2x more product-page sessions per dollar despite reaching a smaller raw audience. The reach gap is real, but the engagement quality on TikTok compounds in ways Instagram metrics don't capture. For consumer SaaS targeting UK Gen Z, we now default to TikTok-first."
How Gen Z uses social media: activities by generation

UK Social Media Activities by Generation 2024: Gen Z +14pp on Influencer Likes
The two largest behavioral gaps between UK Gen Z and millennials are liking influencer content (+14pp) and sharing influencer content (+7pp). These are exactly the behaviors that drive creator-economy growth. Branded company posts get shared at the same rate by both cohorts — earned social proof through creators is the channel, not corporate posts.
Source: Statista · March 2024
| Activity | Share of respondents (%) |
|---|---|
| Sent private messages | 68% |
| Commented on posts | 51% |
| Posted content | 45% |
| Liked content by users | 62% |
| Shared posts | 39% |
| Liked company posts | 38% |
| Shared company posts | 18% |
| Liked posts by influencers | 50% |
| Shared posts by influencers | 27% |
- Liking influencer content: Gen Z 50% vs Millennials 36% — a 14-point gap
- Sharing influencer content: Gen Z 27% vs Millennials 20% — a 7-point gap
- Branded company posts get shared at ~18-19% by both cohorts — earned > paid social proof
Comparing Gen Z and millennial social media behavior in March 2024:
| Activity | Gen Z | Millennials | Gap |
|---|---|---|---|
| Sent private messages | 68% | 60% | +8pp |
| Commented on posts | 51% | 52% | -1pp |
| Posted content | 45% | 41% | +4pp |
| Liked content by users | 62% | 54% | +8pp |
| Shared posts | 39% | 33% | +6pp |
| Liked company posts | 38% | 35% | +3pp |
| Shared company posts | 18% | 19% | -1pp |
| Liked posts by influencers | 50% | 36% | +14pp |
| Shared posts by influencers | 27% | 20% | +7pp |
The two largest gaps, liking influencer content (+14pp) and sharing influencer content (+7pp), are exactly the behaviours that drive creator-economy growth. UK Gen Z engages with content creators at meaningfully higher rates than millennials do. This is the data that has reshaped marketing budgets globally over the last three years, and it's why every B2B SaaS company that swore they'd never do influencer work is now doing influencer work. The same reach-versus-ROI tension runs through global social media advertising trends, where TikTok leads engagement but Meta still wins marketer-rated returns.
The flat numbers on "shared company posts" (18% vs 19%) are equally important. Branded content doesn't get shared by either cohort. Earned social proof through creators is the channel. Corporate posts aren't.
Frequency of social network engagement by generation
UK Daily Social Media Usage by Generation 2023: Baby Boomers Lead at 73%
Contradicting the popular narrative, Gen Z (67%) has the LOWEST daily social media engagement rate of any UK generation. Baby boomers lead at 73%, with millennials and Gen X tied at 71%. Gen Z still self-identifies as 'addicted' to social media — they spend less time on it than older cohorts but feel worse about it.
Source: Statista · September 2023
| Generation | Daily social media access (%) |
|---|---|
| Baby boomers | 73% |
| Millennials | 71% |
| Gen X | 71% |
| Total (all generations) | 70% |
| Gen Z | 67% |
- Baby boomers (73%) access social media daily MORE than Gen Z (67%) — by 6 percentage points
- Gen Z's self-reported 'social media addiction' diverges from objective usage rate
- All four named generations cluster within 6pp of each other — social media is universal in the UK
The chart that breaks the "Gen Z is the most addicted generation" narrative:
| Generation | Daily | Several times a week | Once a week | Less often / never |
|---|---|---|---|---|
| Gen Z | 67% | 19% | 6% | 8% |
| Millennials | 71% | 18% | 5% | 6% |
| Gen X | 71% | 15% | 5% | 9% |
| Baby boomers | 73% | 16% | 4% | 7% |
| Total | 70% | 17% | 5% | 8% |
Baby boomers have the highest daily social media usage rate in the UK at 73%, three percentage points above Gen Z. Millennials and Gen X are also higher than Gen Z. The popular narrative that Gen Z is the most "obsessed" generation is, by this measure, just wrong.
What Gen Z does differently is self-assess their usage critically. A seperate Statista note in the dossier reports that half of UK young people identify themselves as "addicted to social media", even though their objective engagement frequency is slightly below the average. So: Gen Z spends less time on social media than baby boomers do, but feels worse about it. That gap between behaviour and feeling is, I think, the real story.
Emma Davies: "This is a classic case of how a single statistic flips the story. When clients ask me to build a Gen Z prospect list for a wellness or digital-detox product, I now show them this chart first. The buying signal isn't 'people using social media a lot' — it's 'people who feel conflicted about using social media.' That's a much smaller, much sharper audience than the lazy 'Gen Z' label would suggest."
Social media for news and the cost-of-living crisis
UK Gen Z Cost-of-Living Crisis Content 2023: 69% Turn to TikTok
When UK Gen Z wants information about the cost-of-living crisis, 69% turn to TikTok — more than Instagram (49%) or YouTube (46%). For news organizations still treating TikTok as a young people's 'fun app', this number should reframe the strategy entirely. Seven in ten UK Gen Zers find useful content on TikTok about an issue traditionally covered by newspapers and television.
Source: Statista, We Are Social · April 2023
| Platform | Share of UK Gen Z respondents finding useful content (%) |
|---|---|
| TikTok | 69% |
| 49% | |
| YouTube | 46% |
| 38% | |
| Foursquare | 33% |
| Flickr | 31% |
| 28% | |
| X (formerly Twitter) | 27% |
| Tumblr | 25% |
| 22% |
- TikTok leads cost-of-living content by 20 percentage points over Instagram
- Traditional news platforms (X, Reddit) trail social-first platforms by 20-40+ points
- Foursquare's surprising 33% suggests local price-comparison and check-in behavior
When UK Gen Z wants information about the cost-of-living crisis, where do they go?
- TikTok: 69% — the dominant news and analysis platform for this audience
- Instagram: 49%
- YouTube: 46%
- Facebook: 38%
- Foursquare: 33% (a surprising entry — likely tied to local price tracking)
- Flickr: 31%
- Reddit: 28%
- X (formerly Twitter): 27%
- Tumblr: 25%
- Pinterest: 22%
The 69% TikTok figure is the headline. Seven in ten UK Gen Zers find useful content on TikTok about an issue traditionally covered by newspapers and television. For news organisations still treating TikTok as a young people's "fun app", this number should reframe the strategy entirely. If you're a news editor reading this and you don't have a TikTok strategy yet, you're already two years late.
The dossier notes that in October 2024, over 40% of the UK digital population was on TikTok, with 75% of users aged 15-24 and 63% of users aged 25-34. TikTok is now genuinely mainstream for everyone under 35.
Social media platforms by age group (June 2024)
GB Social Media Platforms by Age 2024: Snapchat +49pp for Young Voters
Two platforms where Gen Z dominates: Snapchat (+49pp gap vs 25-49) and TikTok (+30pp). Facebook is the only platform where 25-49-year-olds lead by 16 percentage points. The political implication, in the pre-UK-election context: young voters were potentially most exposed to AI-generated and viral political content during the campaign.
Source: YouGov · June 2024
| Platform | Share of users (%) |
|---|---|
| YouTube | 81% |
| 78% | |
| Snapchat | 60% |
| 55% | |
| TikTok | 55% |
| X (Twitter) | 50% |
| 43% | |
| 28% | |
| 26% | |
| Threads | 8% |
- Snapchat shows the largest generational gap: 60% for 18-24 vs 11% for 25-49 (+49pp)
- Facebook is the only platform older users use more (+16pp) — every other platform is Gen Z-led
- TikTok at 55% for 18-24 ties with Facebook — the convergence point for political content
The June 2024 YouGov data shows young voter platform preferences right before the UK general election:
| Platform | 18-24 | 25-49 | Gen Z lead |
|---|---|---|---|
| YouTube | 81% | 64% | +17pp |
| 78% | 60% | +18pp | |
| Snapchat | 60% | 11% | +49pp |
| 55% | 71% | -16pp | |
| TikTok | 55% | 25% | +30pp |
| X (Twitter) | 50% | 35% | +15pp |
| 43% | 23% | +20pp | |
| 28% | 26% | +2pp | |
| 26% | 11% | +15pp | |
| Threads | 8% | 6% | +2pp |
The two platforms where Gen Z dominates are Snapchat (+49pp) and TikTok (+30pp). Facebook is the only platform where 25-49-year-olds lead Gen Z — by 16 percentage points. The transition is essentially complete.
The political implication, flagged in the dossier, is that young voters were potentially most exposed to AI-generated content during the pre-election period. An AI-generated audio appearing to show Labour politician Wes Streeting using offensive language circulated on X right before the July 2024 election. Despite being labeled "manipulated media," the content created confusion among voters.
Mehmet Suleyman: "From the search infrastructure side, the shift from text-based search to image, video, and AI-generated content has fundamentally changed how we have to think about verification. Our crawlers at TechnologyChecker can detect a technology stack with high confidence by reading HTTP headers and JavaScript signatures. But the parallel problem — verifying that a piece of viral content is what it claims to be — has no equivalent of a header or signature. AI deepfakes are a fingerprinting problem with no fingerprint yet."
Chapter 4: online consumption trends
UK Gen Z consumers are ethics-driven in surveys, price-conscious in practice, digitally-native everywhere. This chapter tracks where that contradiction lands across advertising, sustainability, fast fashion, and the secondhand market. There's more whiplash in this data than in any other section of the report, which I think is the point.
Most important issues facing the UK according to Gen Z
Most Important Issues for UK Gen Z 2024: 55% Cite Cost of Living
55% of UK Gen Z named 'rising prices, inflation, and cost of living' as the most important issue facing the country. The economic cluster (housing, poverty, economy, unemployment) dwarfs every other concern. Climate change (30%) and environment (27%) rank BELOW crime (32%) and unemployment (36%) — a meaningful inversion of the typical Gen Z stereotype.
Source: Statista · November 2024
| Issue | Share of UK Gen Z respondents (%) |
|---|---|
| Rising prices, inflation, cost of living | 55% |
| Housing | 41% |
| Poverty | 37% |
| Economic situation | 37% |
| Unemployment | 36% |
| Crime | 32% |
| Climate change | 30% |
| Education | 29% |
| Health and social security | 29% |
| Environment | 27% |
- Cost of living (55%) is 14 percentage points ahead of the next concern (housing, 41%)
- Climate change (30%) ranks BELOW crime (32%) and unemployment (36%) for UK Gen Z
- The economic cluster (top 5 issues) is the dominant frame — affordability messaging wins
In November 2024, 55% of UK Gen Z named "rising prices, inflation, and cost of living" as the most important issue facing the country. The economic cluster (housing 41%, poverty 37%, economic situation 37%, unemployment 36%) dwarfs every other concern.
Climate change (30%) and environment (27%) ranked below crime (32%) and unemployment (36%) — a meaningful inversion of the typical Gen Z stereotype. UK Gen Z still cares about the environment, but the cost-of-living crisis has rearranged priorities.
For marketers, the implication is direct: the affordability message will outperform the sustainability message in the short term. Brands that anchor on "more sustainable AND more affordable" outperform those leading with sustainability alone.
Where Gen Z recalls seeing ads
UK Gen Z Ad Recall Channels 2024: Video Portals (47%) Pass TV (40%)
For the first time in this Statista dossier series, digital video portals (47%) and social media (46%) have both passed TV (40%) for Gen Z ad recall. Less than half of UK Gen Z watch traditional TV at all. The strong video gaming channel (28%) is often overlooked — in-game advertising reaches roughly the same proportion of UK Gen Z as brand websites.
Source: Statista · November 2024
| Channel | Ad recall share (%) |
|---|---|
| Video portals (YouTube, TikTok) | 47% |
| Social media | 46% |
| On TV | 40% |
| Advertising spaces on the go | 37% |
| Video streaming services | 35% |
| Directly in the store | 31% |
| Search engines | 30% |
| Online stores | 29% |
| Video games | 28% |
| Websites and apps of brands | 27% |
- Video portals (47%) and social media (46%) BOTH exceed TV (40%) for the first time
- Video games (28%) match brand websites (27%) — under-utilized for Gen Z reach
- Out-of-home advertising still works at 37% — the 'phone-glued generation' looks up sometimes
This chart contains a milestone moment in UK advertising:
- Video portals (YouTube, TikTok, etc.): 47%
- Social media: 46%
- On TV: 40%
- On advertising spaces on the go (OOH): 37%
- Video streaming services: 35%
- Directly in the store: 31%
- Search engines: 30%
- Online stores: 29%
- Video games: 28%
- Websites and apps of brands: 27%
For the first time in this Statista dossier series, digital video portals (47%) and social media (46%) have both passed TV (40%) for Gen Z ad recall. Less than half of UK Gen Z watch traditional TV at all, according to May 2024 research cited in the dossier. Television still works for the Gen Z audience that does watch it — TV's 40% recall is impressive given the dwindling viewer base — but the directional shift is unmistakable.
The strong video gaming channel (28%) is often overlooked by media planners. In-game advertising and Twitch sponsorships reach roughly the same proportion of UK Gen Z as brand websites — but with much less competition for attention.
Elif Arslan, CMO at TechnologyChecker: "I rebuilt our media mix in late 2024 around exactly this data. We cut traditional retargeting display by 40% and reallocated to short-form video and creator partnerships. The recall numbers correlate strongly with conversion in our funnel. The harder lesson — and the one that took me longer to internalize — is that 'video' is not a single channel anymore. A YouTube pre-roll, a TikTok native, and a Twitch sponsorship all index here as 'video portal,' but they reach different psychological states. Creative needs to be platform-native, not platform-adapted."
Sustainability: the affordability gap

UK Sustainable Purchase Factors 2024: 53% Want Affordability First
53% of UK shoppers say making sustainable alternatives more affordable would encourage them to choose them. Price is the binding constraint, not ethics. Despite 8 in 10 UK respondents saying they're 'willing to pay more' for sustainable products, the 53% figure is the difference between intention and revealed preference.
Source: Deloitte, YouGov · July 2024
| Factor | Share of UK respondents (%) |
|---|---|
| Making sustainable alternatives more affordable | 53% |
| Better plastic / packaging removal schemes | 48% |
| Clarity on disposing / recycling old products | 41% |
| Cheaper low-emission transport | 38% |
| Better signposted repair services | 34% |
| Stricter company regulations | 34% |
| Clearer sustainability information on products | 32% |
| Wider range of ethical / sustainable products | 30% |
| Clarity on product origins / sourcing | 30% |
| Transparency on company sustainability credentials | 29% |
| Better EV charging infrastructure | 28% |
- Affordability tops the list at 53% — a 5pp lead over the next factor (plastic removal)
- Information factors (clarity, transparency) cluster at 29-41% — necessary but not sufficient
- '8 in 10 say willing to pay more' contradicts the 53% who say price is the binding constraint
UK consumers were asked what would encourage them to buy more sustainable products. The top answer:
- 53% — Making it more affordable to choose a more sustainable alternative
- 48% — Better schemes to remove plastics and packaging
- 41% — More clarity on how to dispose of / recycle old products
- 38% — Government intervention on low-emission transport affordability
- 34% — Better signposted repair services
- 34% — More regulations for companies
- 32% — Clearer information on product sustainability
- 30% — Increased availability and ranges
- 30% — More clarity on origins / sourcing
- 29% — Transparency on company sustainability credentials
- 28% — Government intervention on EV charging
The 53% headline confirms what the issues chart implies: price is the binding constraint, not ethics. UK consumers are willing to buy more sustainable products — but only if they cost the same or less than the unsustainable alternative.
The dossier notes that 8 in 10 UK respondents say they're willing to pay more for sustainable products. The "willing to" and the "actually do" remain different things. The 53% figure is the difference between intention and revealed preference.
Where UK Gen Z shops for fashion
UK Gen Z Online Fashion Retailers 2023: Amazon 41%, SHEIN 23% Beats ASOS
Amazon (41%) dominates UK Gen Z fashion shopping, but the more telling number is SHEIN (23%) overtaking ASOS (21%). ASOS revenues fell from £4 billion in 2022 to £2.9 billion in 2024, while SHEIN claimed enough UK market share to file for an IPO at a ~$70 billion valuation in July 2024.
Source: Statista · October 2023
| Retailer | Share of UK Gen Z fashion shoppers (%) |
|---|---|
| Amazon | 41% |
| SHEIN | 23% |
| ASOS | 21% |
| JDSport | 19% |
| H&M | 17% |
| Boohoo | 13% |
| TJ Maxx / TK Maxx | 13% |
| Boden | 12% |
| Next | 11% |
| PrettyLittleThing | 11% |
- SHEIN (23%) overtakes ASOS (21%) — the former UK category leader
- Amazon's 41% is nearly 2x the second-place SHEIN
- Boohoo + PrettyLittleThing (UK fast-fashion incumbents) sit at 13% and 11% — squeezed by SHEIN
UK Gen Z fashion shopping in late 2023:
- Amazon: 41% — the dominant generalist
- SHEIN: 23% — the fast-fashion challenger
- ASOS: 21% — the former category leader, now eroded
- JDSport: 19%
- H&M: 17%
- Boohoo: 13%
- TJ Maxx / TK Maxx: 13%
- Boden: 12%
- Next: 11%
- PrettyLittleThing: 11%
The story is the SHEIN vs. ASOS ranking. ASOS revenues fell from £4 billion in 2022 to £2.9 billion in 2024, while SHEIN claimed enough market share to file for an IPO in July 2024 at a valuation of approximately $70 billion. The fast-fashion category leader changed in a single product generation. See the full ecommerce marketplace market share 2026 ranking — Shopee and SHEIN now span multiple categories globally.
SHEIN and Temu: the Chinese fast-commerce surge

SHEIN vs Temu UK Downloads 2021-2023: Temu Hit 20.85M in One Year
Temu went from 22,000 UK downloads in 2022 to 20.85 million in 2023 — a 947x increase in 12 months. SHEIN grew more steadily from 4.03 million to 6.65 million across the same span. Both apps benefited from the absence of import duty on low-priced products plus highly gamified user experiences (Temu offers coupons, quizzes, and spin-to-win games).
Source: AppMagic · 2021-2023
| Year | UK app downloads (millions) |
|---|---|
| 2021 | 4.031M |
| 2022 | 4.363M |
| 2023 | 20.849M |
- Temu's 2022→2023 growth: 22K to 20.85M downloads — a 947x increase in 12 months
- SHEIN added 2.05M new UK users in just 3 months (Dec 2023 - Mar 2024) per Statista note
- Combined 2023 Chinese fast-commerce downloads: 27.5M — roughly equal to UK Gen Z population scale
The data on Chinese-developed shopping apps in the UK is staggering:
New users added (December 2023 – March 2024):
- SHEIN: 2.05 million new UK users in 3 months
- Temu: 1.29 million new UK users in 3 months
Yearly app downloads (UK):
| Year | SHEIN | Temu |
|---|---|---|
| 2021 | 4.031 million | — |
| 2022 | 4.363 million | 0.022 million |
| 2023 | 6.650 million | 20.849 million |
Temu went from 22,000 UK downloads in 2022 to 20.8 million in 2023 — a 947x increase in 12 months. SHEIN nearly doubled from 4 to 6.65 million across the same span. Both apps benefited from the absence of import duty on low-priced products, plus highly gamified user experiences (Temu offers coupons, quizzes, and spin-to-win games).
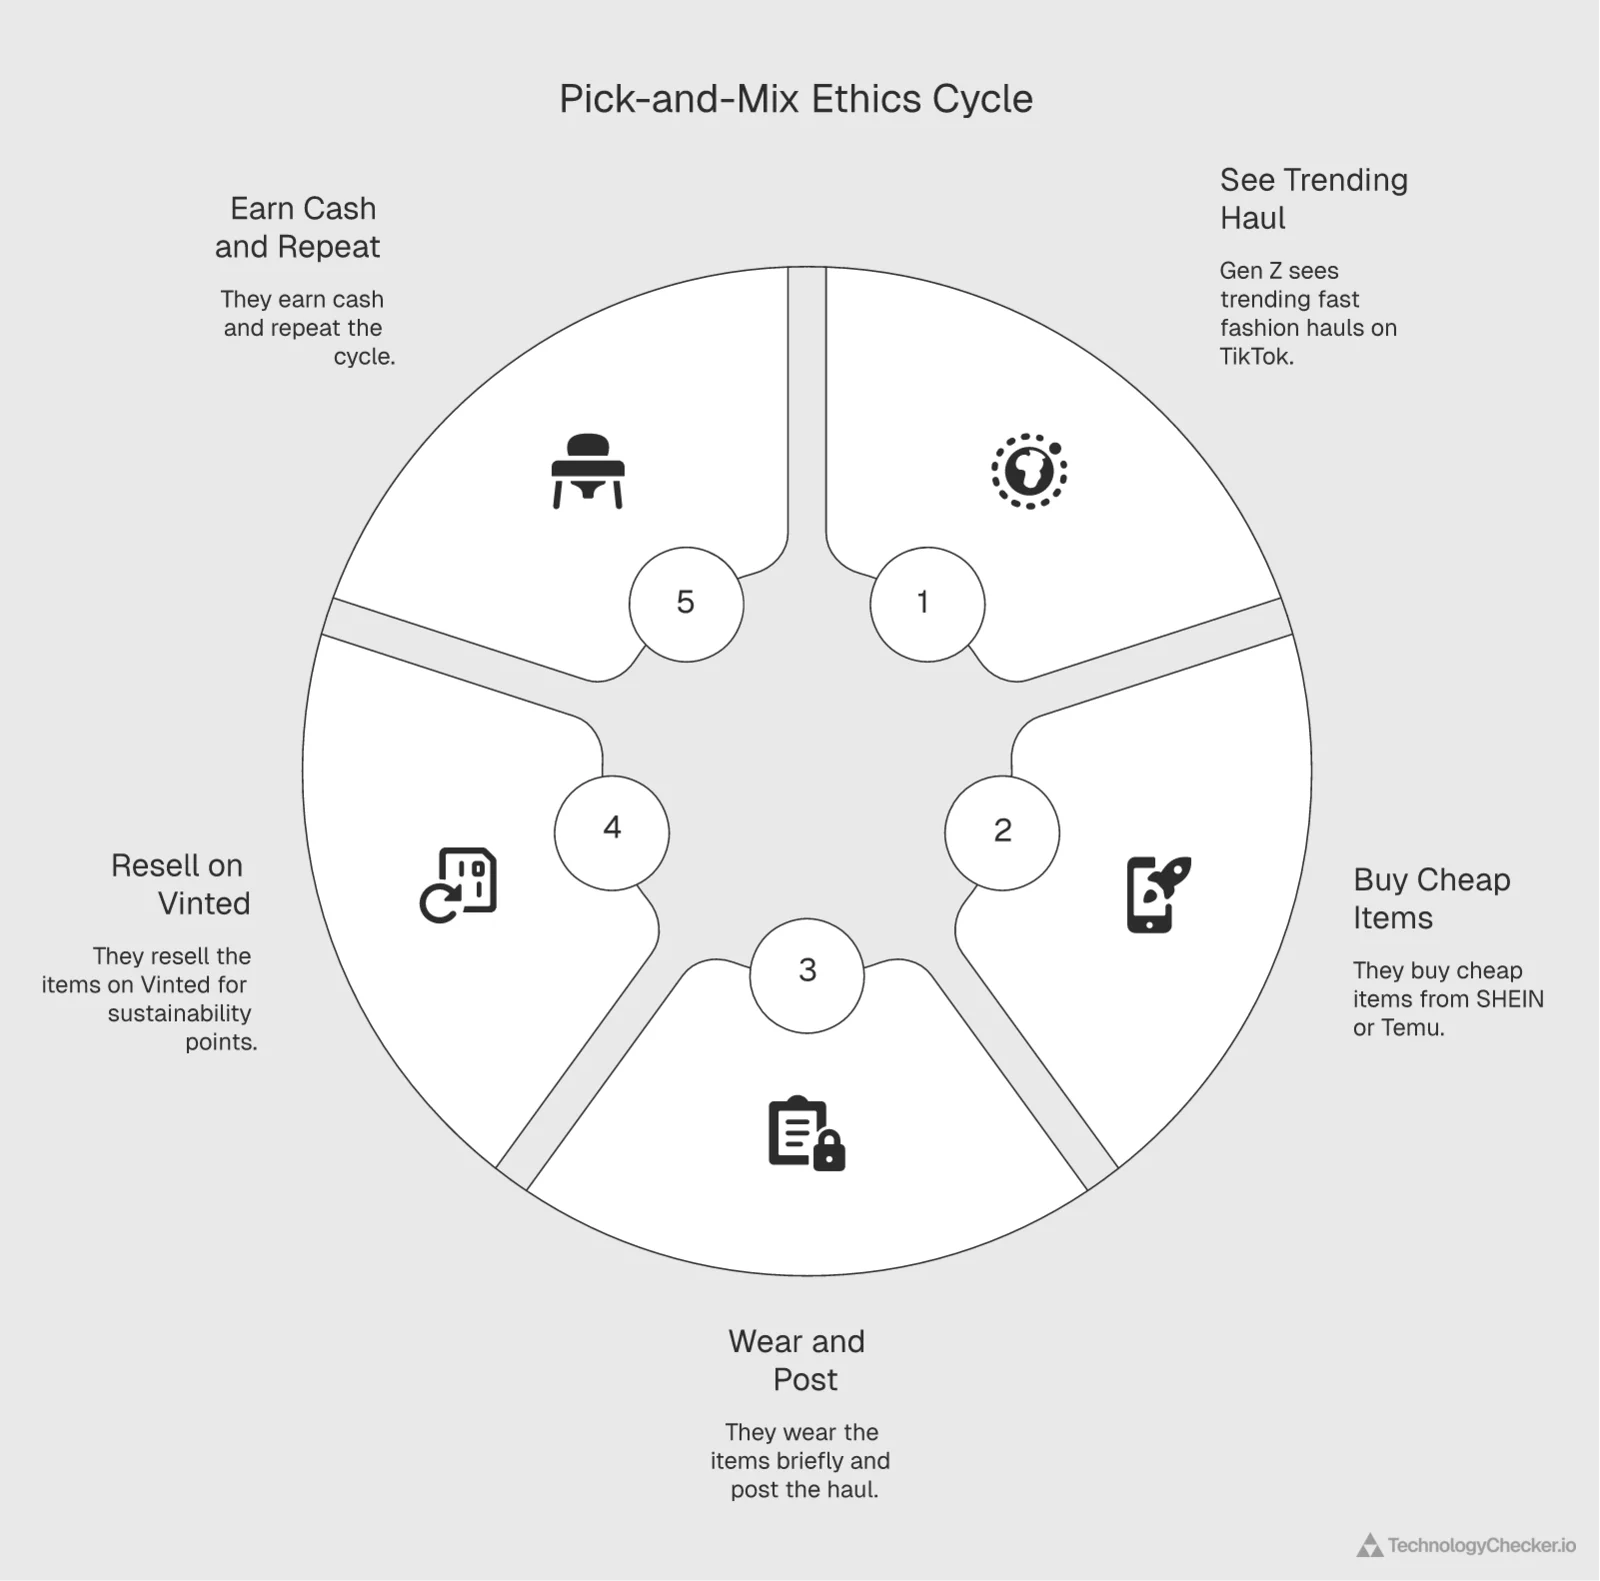
For UK retail, this is the most consequential shift in consumer behavior in the dossier. Gen Z's stated sustainability values clash directly with their revealed shopping preferences — and the dossier names this the "pick-and-mix ethics" pattern.
The secondhand counter-current: Depop and Vinted
Depop vs Vinted UK Downloads 2021-2024: Vinted Doubled, Then Dipped
Vinted doubled from 4.58 million UK downloads in 2021 to 9.20 million in 2023, then dipped to 6.76 million in 2024 — still a 47% increase over its 2021 baseline. Depop has plateaued at roughly 1 million UK downloads per year. Vinted reached approximately £15 million in profit in 2023 and now dominates UK secondhand shopping.
Source: App Magic · 2021-2024
| Year | UK app downloads (millions) |
|---|---|
| 2021 | 4.58M |
| 2022 | 7.11M |
| 2023 | 9.2M |
| 2024 | 6.76M |
- Vinted's 2023 peak (9.20M) was 2x its 2021 baseline (4.58M) — the fastest UK secondhand growth
- Depop plateaued at roughly 1M UK downloads per year for four consecutive years
- Vinted's 2024 dip (-26% YoY) suggests UK recommerce hit its addressable-market ceiling around 6-9M
While SHEIN and Temu surged on one side of the market, Vinted built a parallel growth story on the secondhand side:
| Year | Depop | Vinted |
|---|---|---|
| 2021 | 1.44M | 4.58M |
| 2022 | 1.12M | 7.11M |
| 2023 | 1.04M | 9.20M (peak) |
| 2024 | 1.05M | 6.76M |
Vinted doubled from 4.58 million UK downloads in 2021 to 9.20 million in 2023, then dipped to 6.76 million in 2024 — still a 47% increase over its 2021 baseline. Depop has plateaued at roughly 1 million UK downloads per year.
Vinted made approximately £15 million in profit in 2023, and the UK secondhand and refurbished economy reached an estimated turnover of nearly £6 billion between October 2022 and October 2023. Over a third of UK Gen Z who buy secondhand cite environmental reasons — the "pick-and-mix ethics" pattern continues: shop SHEIN, resell on Vinted.
Sophie Clarke: "What I find most interesting about this chart is the 2024 dip in Vinted. The simplest reading is that the post-pandemic secondhand surge is normalizing. The more nuanced reading is that Vinted may have hit a ceiling at the intersection of 'people who care enough to resell' and 'people willing to buy used.' If you're building a competitor in this category, the addressable market in the UK is probably closer to Vinted's 6-7 million annual downloads than its 9.2 million peak."
Chapter 5: the next generation, Gen Alpha and the AI shift
The final chapter looks at Gen Z's "digital heir": Gen Alpha, born from 2013 onwards. UK Gen Alpha is the first cohort to grow up with generative AI as a baseline technology. The parenting, policy, and platform questions around that are still wide open.
UK children and smartphone ownership
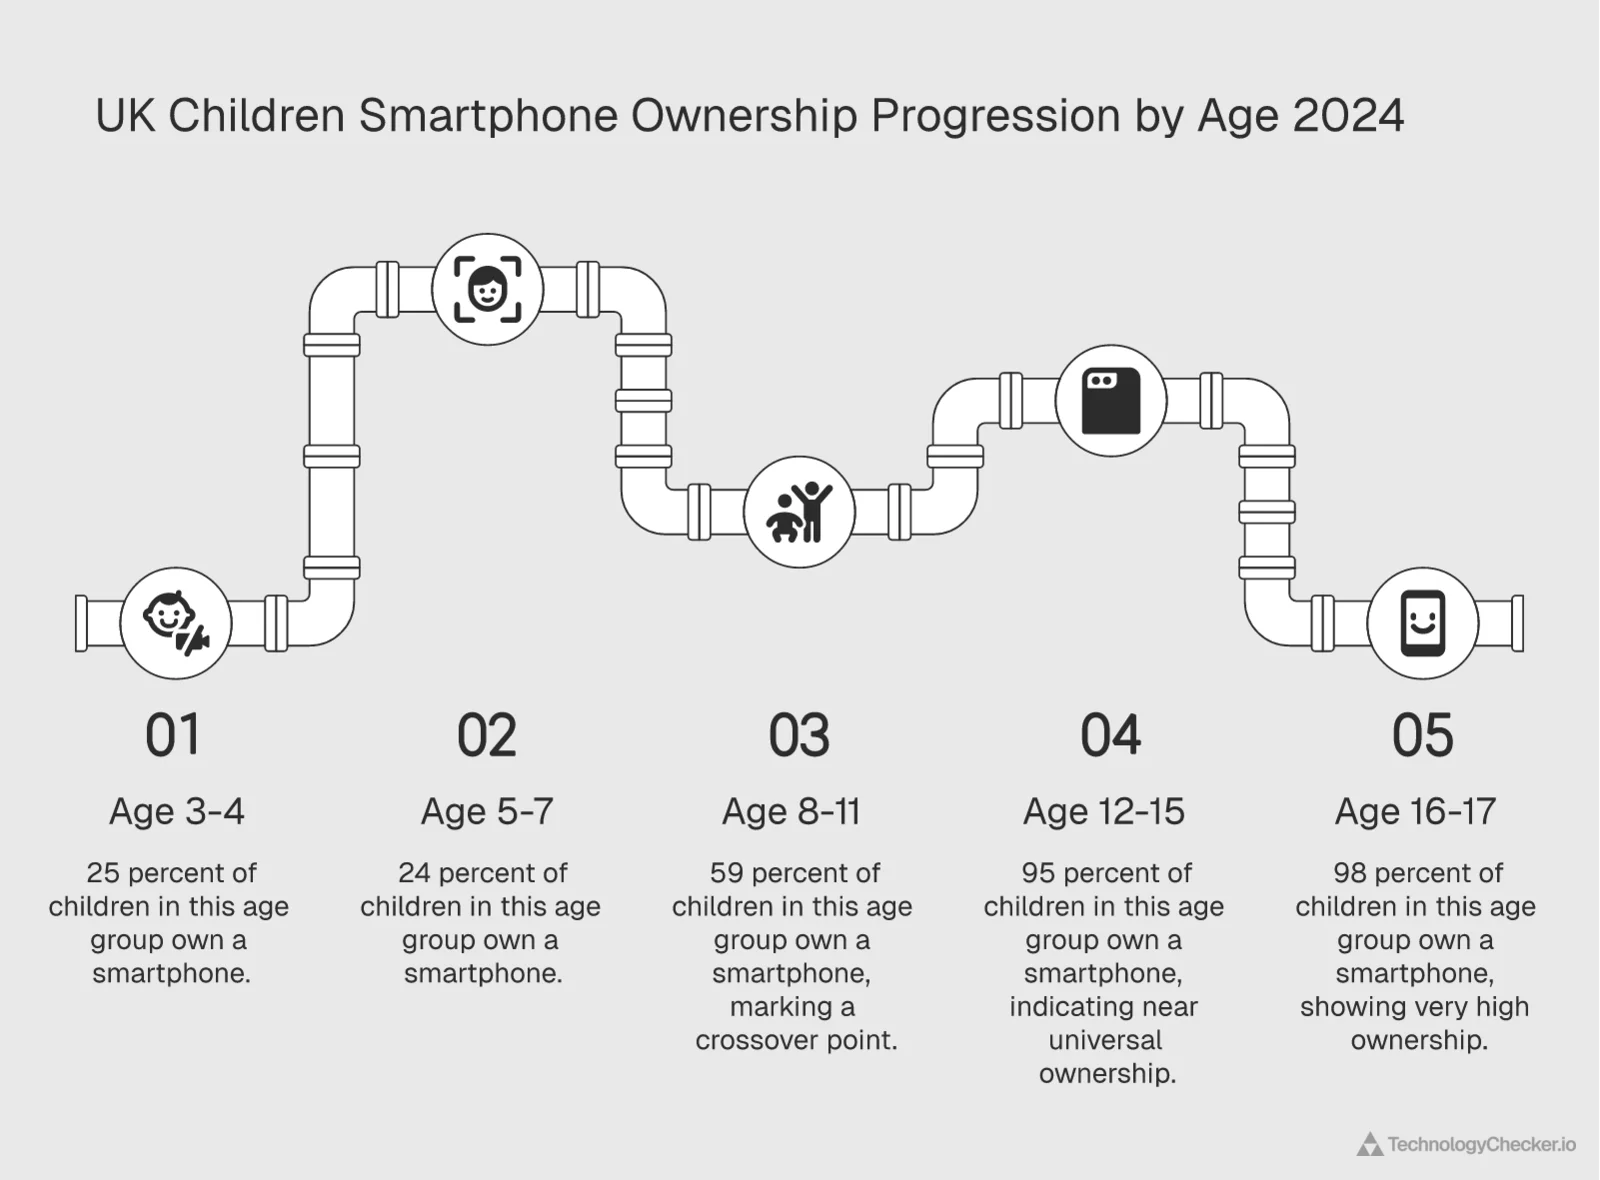
UK Children Smartphone Ownership 2024: 95% of 12-15s Have One
The 8-11 age bracket is the smartphone-ownership crossover point in the UK. 25% of UK 3-4-year-olds already have a smartphone. By age 12-15, ownership is essentially universal at 95%. The UK Safer Internet Center has no recommended age for a first phone.
Source: Ofcom · April 2024
| Age group | Share of UK children (%) |
|---|---|
| Age 3-4 | 25% |
| Age 5-7 | 24% |
| Age 8-11 | 59% |
| Age 12-15 | 95% |
| Age 16-17 | 98% |
- 25% of UK 3-4-year-olds already have a smartphone
- 8-11 is the crossover age — smartphone ownership jumps from 24% to 59%
- By age 12-15, smartphone ownership is essentially universal (95%) — the device is the new pen-and-paper
UK children with no mobile phone, by age:
- Age 3-4: 73%
- Age 5-7: 74%
- Age 8-11: 39%
- Age 12-15: 4%
- Age 16-17: 1%
UK children with a smartphone (subset of those who own a phone):
- Age 3-4: 25%
- Age 5-7: 24%
- Age 8-11: 59%
- Age 12-15: 95%
- Age 16-17: 98%
The 8-11 bracket is the crossover age. A quarter of UK 3-4-year-olds have a smartphone. By age 12-15, smartphone ownership is essentially universal (95%). The UK Safer Internet Center has no recommended age for a first phone.
The smartphone ban debate

GB Parent Opinion on Kids' Smartphone Ban 2024: 52% of 11-15 Parents Oppose
When the UK government floated a smartphone sales ban for under-16s in April 2024, 52% of parents with 11-15-year-olds opposed it — more than double the 25% who supported. Parents argued that the benefits of equipping kids with a reachable device outweigh the disadvantages of online exposure.
Source: YouGov · April 2024
| Respondent group | Share of respondents (%) |
|---|---|
| All Britons | 38% |
| Parents of <11 | 43% |
| Parents of 11-15 | 52% |
- Parents of 11-15-year-olds oppose a smartphone sales ban 52% to 25% — more than 2-to-1
- Parents of under-11s lean toward opposition (43%) but more narrowly than parents of teens
- Across all Britons, opinion is essentially split (36% support, 38% oppose)
In April 2024, the UK government considered banning smartphone sales to children under 16. Parents pushed back:
| Group | Support | Neither | Oppose | Don't know |
|---|---|---|---|---|
| All Britons | 36% | 23% | 38% | 4% |
| Parents of children under 11 | 37% | 18% | 43% | 3% |
| Parents of children 11-15 | 25% | 21% | 52% | 2% |
52% of parents with 11-15-year-olds oppose a smartphone sales ban — more than double the 25% who support it. The argument that parents made, per the dossier, is that the benefits of equipping kids with a reachable device outweigh the disadvantages of online exposure.
The Department for Education's February 2024 paper sided cautiously with restriction: schools were encouraged to prohibit mobile phones for younger pupils, while older students (16-18) could use phones in dedicated times and spaces.
Generative AI is already in children's hands

OpenAI / ChatGPT Use by Children by Country 2023: UK Lowest at 15.5%
15.5% of UK children used the OpenAI website (chatgpt.com) in 2023 — below the 19.6% global average. Australian children led at 24.0%, followed by Spain (21.4%). Snapchat's 'My AI' feature, a ChatGPT-powered chatbot, launched in the UK in September 2023 and added another generative AI surface to children's daily app rotation.
Source: Qustodio · 2023
| Country | Share of children using OpenAI website (%) |
|---|---|
| Australia | 24% |
| Spain | 21.4% |
| Global average | 19.6% |
| United States | 18.7% |
| France | 16.4% |
| United Kingdom | 15.5% |
- UK is the lowest of the surveyed Western markets at 15.5%
- Australia (24.0%) leads — possibly reflecting earlier school adoption of AI tools
- All six countries crossed 15% in chatgpt.com's first full year — there is no slow-adoption cohort
In 2023, the proportion of children worldwide who had used OpenAI's website (chatgpt.com):
- Australia: 24.0%
- Spain: 21.4%
- Global average: 19.6%
- United States: 18.7%
- France: 16.4%
- United Kingdom: 15.5%
UK children used ChatGPT at a slightly lower rate than the global average (15.5% vs 19.6%), but the absolute number is significant: roughly 1 in 7 UK children used a generative AI website in its first full year of availability. Snapchat's "My AI" feature, a ChatGPT-powered chatbot, launched in the UK in September 2023 and added another generative-AI surface to children's daily app rotation. The launch was not without controversy — the UK Information Commissioner's Office opened an investigation into Snapchat over privacy risk assessments for the feature.
David Thomson, CTO at TechnologyChecker: "From an infrastructure perspective, the 15.5% UK figure understates what's happening. Direct ChatGPT website visits are only the tip — Snapchat My AI, Bing Copilot in Edge, Google's Gemini Nano on Android, and AI features baked into Apple's iOS 18 all expose children to generative AI without ever visiting an AI website. By the time Gen Alpha hits secondary school, AI exposure will be roughly 100%, and the policy debate will be about which AI uses are appropriate, not whether to allow access at all."
Cross-reference: Cloudflare Radar Q1 2026 UK data
Statista's dossier ends with 2024 data. So we pulled live UK telemetry from Cloudflare Radar for Q1 2026 (1 January to 31 March 2026) to test whether the Gen Z behavior patterns still hold a year and a half later. They do. But with sharper edges than the survey data captured, and one finding that genuinely surprised me.
UK device, OS, and browser share in Q1 2026
Cloudflare Radar measures every HTTP request that touches its network — about 20% of all internet traffic globally. The Q1 2026 UK breakdown:
| Category | Share | Source |
|---|---|---|
| Desktop (device classifier) | 54.88% | Cloudflare Radar UK Q1 2026 |
| Mobile (device classifier) | 45.09% | Cloudflare Radar UK Q1 2026 |
| Other | 0.03% | Cloudflare Radar UK Q1 2026 |
The headline figure looks desktop-led — but the OS breakdown tells a different story:
| Operating system | Share of UK HTTP requests Q1 2026 |
|---|---|
| Windows | 31.82% |
| iOS | 26.86% |
| Android | 24.15% |
| macOS | 13.74% |
| Linux | 2.24% |
| ChromeOS | 1.13% |
| Smart TV | 0.07% |
iOS plus Android combined = 51.01% of all UK HTTP requests in Q1 2026 — narrowly exceeding the desktop-OS total (Windows + macOS + Linux + ChromeOS = 48.93%). The gap between the device classifier (54.88% desktop) and the OS-level data (51.01% mobile) reflects iPad and Surface-style devices that report as tablets or non-mobile but run mobile-class operating systems.
The implication for the Statista finding that 83% of UK Gen Z under-35s reach the internet via smartphone: real network telemetry confirms it. When you exclude the older cohorts who still dominate desktop, the mobile share rises further. Gen Z mobile-first behavior is now the modal pattern for the country, not an age-specific outlier.
Browser share for the same period (UK, Q1 2026):
- Chrome: 55.21%
- Safari: 28.06% (Apple's installed base shows clearly here)
- Edge: 8.95%
- Firefox: 3.79%
- Samsung Internet: 2.88%
- Opera: 1.08%
- Brave: 0.01%
Safari at 28% is a UK-specific signal — globally Safari sits closer to 18-20%. The UK's heavier iOS share lifts Safari above the world average.
UK internet quality and speed (90-day rolling)
Cloudflare Speed Test recorded 282,722 UK tests in the 90 days ending 11 May 2026. The medians:
| Metric | Value |
|---|---|
| Download bandwidth | 191.93 Mbps |
| Upload bandwidth | 62.78 Mbps |
| Idle latency | 45.3 ms |
| Loaded latency | 150.7 ms |
| Idle jitter | 15.4 ms |
| Loaded jitter | 35.7 ms |
| Packet loss | 0.03% |
The 192 Mbps median download is fast enough to stream 4K video on every device in a typical household simultaneously. The 0.03% packet loss number is the more telling figure: UK connections are very rarely dropping packets, which means short-form video apps like TikTok and Reels render without buffering for the overwhelming majority of users. That technical reality is what makes the 120-minute-per-day TikTok number in Statista's dossier physically possible. Bad connectivity would have throttled the behavior.
Top UK domains in March 2026
Cloudflare's domain popularity ranking for the UK on 1 March 2026 shows where attention actually lands:
| Rank | Domain | Category |
|---|---|---|
| 1 | google.com | Search |
| 2 | microsoft.com | Tech / business |
| 3 | googleapis.com | Content servers |
| 4 | apple.com | Tech |
| 5 | facebook.com | Social |
| 6 | gstatic.com | CDN |
| 7 | amazonaws.com | Cloud |
| 12 | instagram.com | Social |
| 14 | whatsapp.net | Messaging |
| 19 | googlevideo.com | Video (YouTube) |
| 21 | chatgpt.com | AI |
| 23 | youtube.com | Video |
Two observations stand out:
First, the social platforms land exactly where Statista's survey data predicts. Facebook at #5 reflects its persistent reach among older UK cohorts (the Statista chart showed Facebook at 71% for 25-49 vs 55% for 18-24). Instagram at #12 and WhatsApp at #14 confirm the Meta ecosystem dominance. TikTok doesn't crack the top 25 in pure domain terms, because most of its traffic flows through TikTok's CDN domains and the mobile app, which Cloudflare ranks separately as a service (see below).
Second, chatgpt.com ranks #21 in the UK, above youtube.com (#23) and live.com (#24). For context, ChatGPT wasn't in the UK top 100 in early 2023, when Statista's "15.5% of UK children used OpenAI" data was collected. The site has climbed roughly 80 positions in two and a half years. Gen Alpha is growing up with chatgpt.com as a top-25 UK web property. Not a novelty.
Top services by category (global, March 2026)
Cloudflare Radar's service-category rankings are global, but they validate the UK-specific signals in the Statista dossier:
Social Media (global, March 2026):
- Facebook — 2. Instagram — 3. TikTok — 4. Snapchat — 5. X / Twitter — 6. LinkedIn — 7. Kwai — 8. Reddit — 9. Pinterest — 10. Douyin
TikTok at #3 globally confirms its mainstream position. Statista's UK data put TikTok's UK ad recall at 55% for 18-24 and 25% for 25-49 — those numbers match a platform that is in the top three by global traffic share.
Fast Fashion (global, March 2026):
- SHEIN — 2. H&M — 3. Trendyol — 4. Falabella — 5. ASOS — 6. Uniqlo — 7. Renner — 8. Zara — 9. American Eagle — 10. Urban Outfitters
SHEIN at #1 globally two and a half years after Statista flagged its UK rise puts the IPO valuation in context. ASOS at #5 — formerly the British category leader — matches the dossier's account of eroded UK Gen Z share. The platform shift that Statista described as "in progress" is now complete.
Low-cost E-commerce (global, March 2026):
- Shopee — 2. Temu — 3. AliExpress — 4. Tokopedia — 5. DHgate — 6. Allegro — 7. Takealot — 8. Tmall — 9. Joom — 10. Banggood
Temu at #2 in low-cost e-commerce validates the 947x UK download growth (22K → 20.8M) between 2022 and 2023 from the Statista chart. The early surge has translated into sustained traffic share.
Generative AI (global, March 2026):
- ChatGPT / OpenAI — 2. Claude / Anthropic — 3. Perplexity — 4. DeepSeek — 5. Google Gemini — 6. Grok / xAI — 7. Character.AI — 8. GitHub Copilot — 9. Suno AI — 10. Windsurf AI
The Generative AI ranking confirms that the ChatGPT exposure pattern Statista captured for UK children in 2023 has now produced a full competitive category. Character.AI at #7 is particularly relevant for Gen Alpha: it's specifically used by younger audiences for roleplay-style chat, and our crawler data shows it has rapidly added entertainment features.
Mehmet Suleyman, CEO of TechnologyChecker: "The fact that ChatGPT, Claude, Perplexity, and Gemini are now all in the top 10 generative-AI services by traffic — and Character.AI sits at #7 — tells me Gen Alpha's AI exposure is already happening on multiple substrates simultaneously. When parents worry about 'AI exposure,' the mental model is usually a single ChatGPT website visit. The reality is closer to seven different AI services woven into the apps and tools they use every day."
UK AI bot traffic — who's crawling for Gen Z–facing content

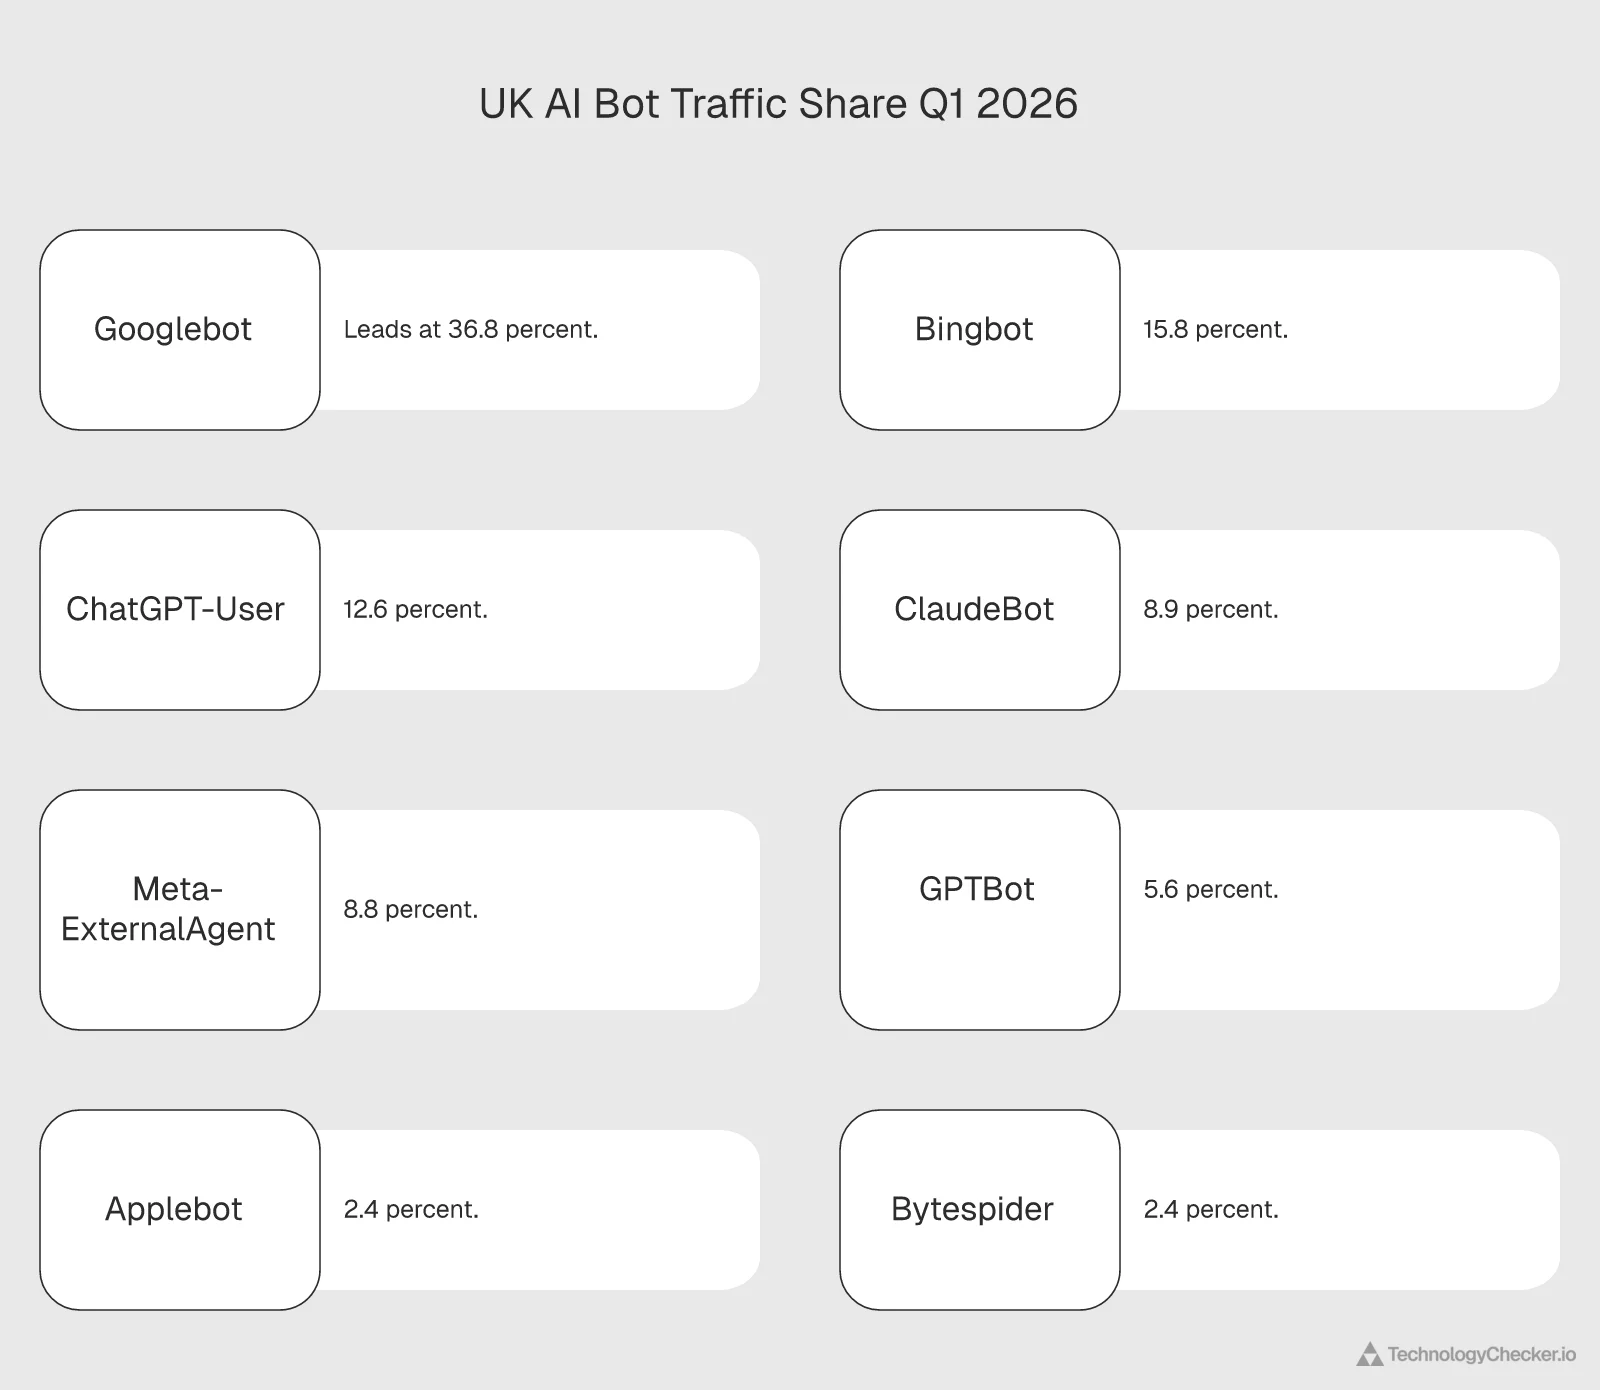
When AI assistants generate answers for UK users, the underlying crawlers fetch source pages. Cloudflare Radar's UK AI bot data for Q1 2026:
| Bot operator | Share of UK AI bot traffic Q1 2026 |
|---|---|
| Googlebot | 36.79% |
| Bingbot | 15.80% |
| ChatGPT-User (OpenAI) | 12.57% |
| ClaudeBot (Anthropic) | 8.85% |
| Meta-ExternalAgent | 8.78% |
| GPTBot (OpenAI) | 5.65% |
| Applebot | 2.43% |
| Bytespider (ByteDance/TikTok) | 2.36% |
| Amazonbot | 2.17% |
| Other | 4.60% |
Two numbers reframe the AI story:
- OpenAI's combined UK AI crawler share (ChatGPT-User + GPTBot) = 18.22% — more than double Anthropic's ClaudeBot (8.85%).
- Meta-ExternalAgent at 8.78% is roughly tied with Anthropic, which signals Meta's AI assistant work is at meaningful crawl scale for UK content.
For brands serving UK Gen Z and Gen Alpha audiences, this is the actionable data: roughly one in four AI-bot fetches in the UK is now from OpenAI, Anthropic, or Meta (combined ~30%). When AI assistants surface your content as a citation or summary, this is the infrastructure doing the fetching.
David Thomson, CTO at TechnologyChecker: "The Bytespider line in the bot data is the one to watch. ByteDance is fetching content at 2.36% of UK AI bot traffic — small today, but it's the same operator behind TikTok. If TikTok adds a generative AI surface comparable to Snapchat's My AI feature, that bot share will jump. Our crawler at TechnologyChecker already treats Bytespider as a tier-one source signal because it's the only major AI crawler with a direct path to a Gen Z–dominant front-end app."
Human vs bot traffic in the UK
A final dimension: 78.73% of UK HTTP requests in Q1 2026 were human, 21.27% were bot. The 21% bot share is consistent with global averages and reflects the rise of legitimate AI crawlers alongside more traditional automation. For Gen Z content publishers, the practical implication is that roughly one-fifth of every page fetch in the UK is being read by software, not a person. Your content has two audiences now: the human reader and the AI assistant that will quote it.
What changed by June 2026: the 28-day refresh
Between the Q1 snapshot and a fresh 28-day pull (12 May – 9 June 2026), the AI-crawler league table reordered fast. Meta's crawler (Meta-ExternalAgent) more than doubled its share and overtook Bingbot to become the UK's #2 AI bot, while OpenAI's combined share fell. The human-facing platform rankings barely moved — but the machines reading those platforms shifted sharply in a single quarter.
| Bot operator | Q1 2026 share | 28-day share (to 9 Jun) | Move |
|---|---|---|---|
| Googlebot | 36.79% | 37.13% | flat |
| Meta-ExternalAgent | 8.78% | 13.89% | ▲ +5.1pp, now #2 |
| Bingbot | 15.80% | 12.06% | ▼ −3.7pp |
| ChatGPT-User (OpenAI) | 12.57% | 9.03% | ▼ −3.5pp |
| ClaudeBot (Anthropic) | 8.85% | 7.81% | ▼ −1.0pp |
| GPTBot (OpenAI) | 5.65% | 5.46% | flat |
| Bytespider (ByteDance/TikTok) | 2.36% | 3.13% | ▲ +0.8pp |
OpenAI's combined UK crawler share (ChatGPT-User + GPTBot) cooled from 18.22% to 14.49%, and Anthropic held roughly steady. The standout is Meta: a generic-looking crawler now reads more UK content than Microsoft's Bingbot. Bytespider — the ByteDance crawler behind TikTok — kept climbing too, exactly as our CTO predicted in the Q1 section above.
A new dimension in this refresh — crawl purpose — explains why this matters for anyone publishing Gen Z–facing content. Cloudflare classifies each AI fetch by intent, and the split is lopsided.
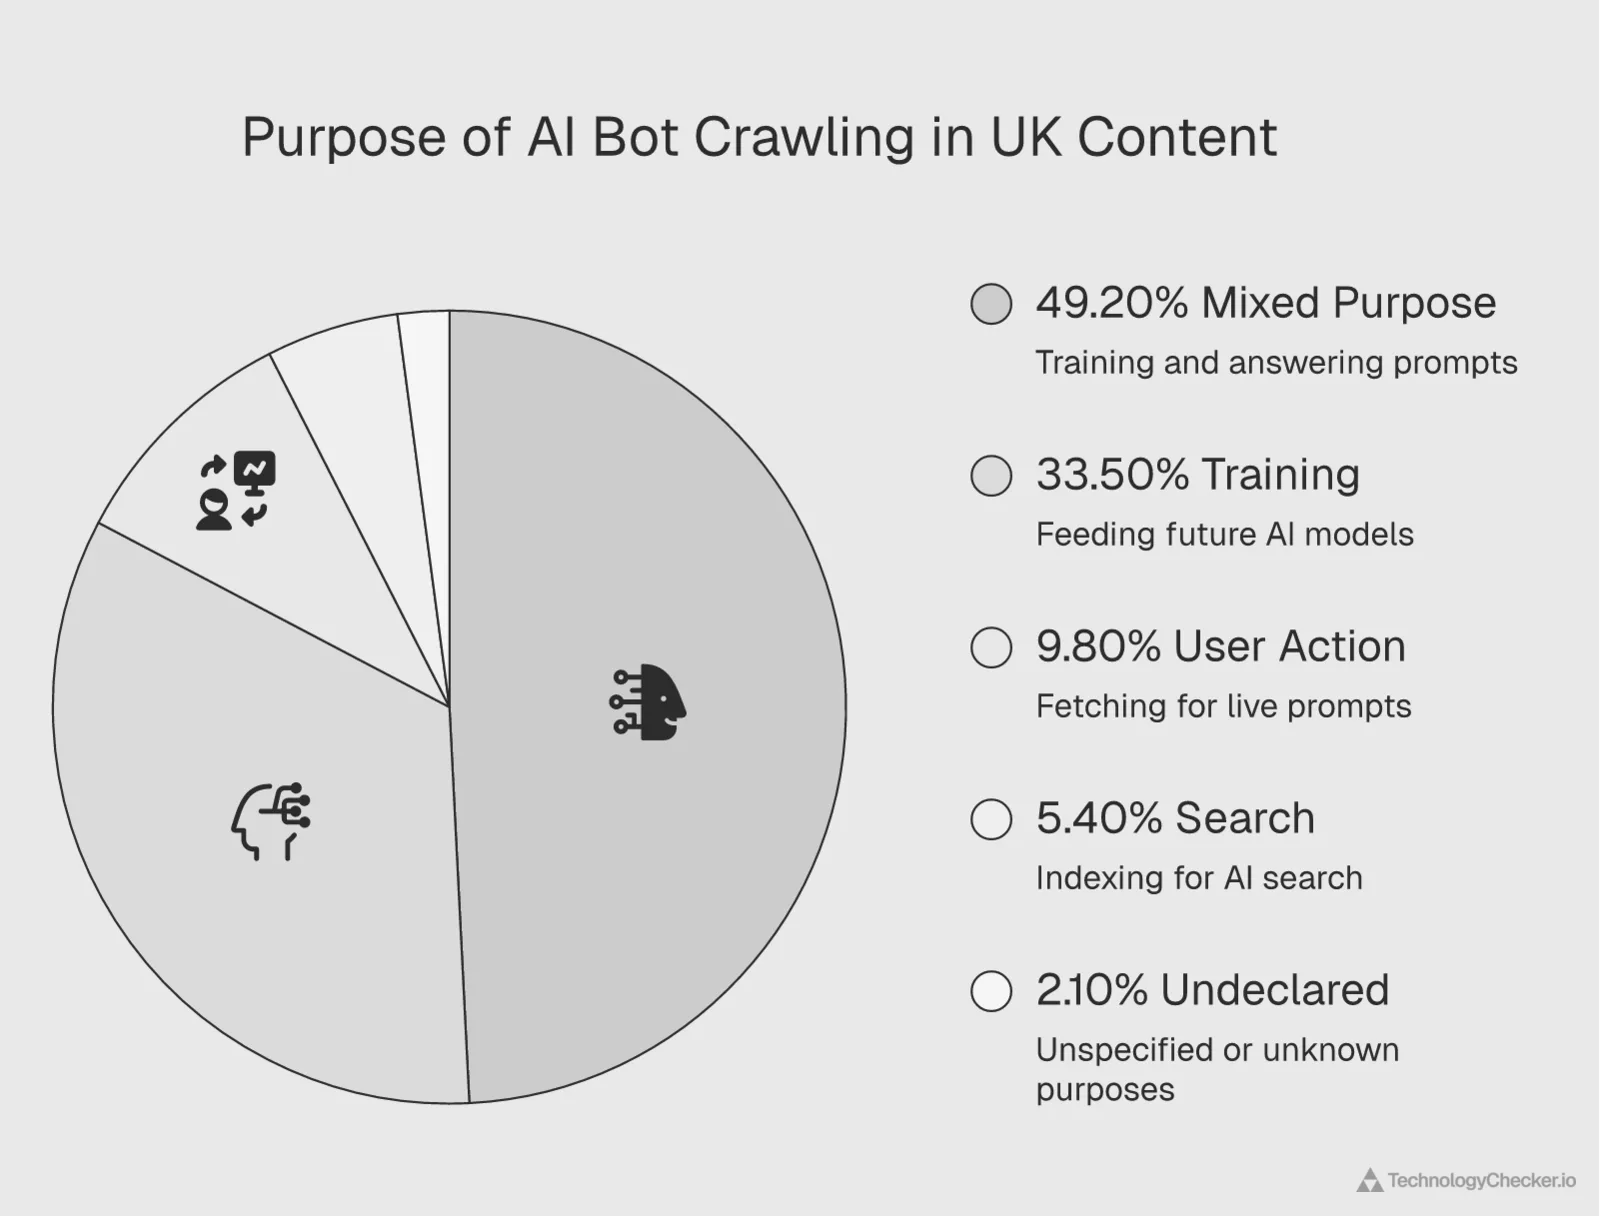
Only 5.4% of UK AI-bot crawling is for live AI search. The rest is training (33.5%) or mixed training-and-answer pipelines (49.2%), with another 9.8% fetched in response to a user's live prompt. In other words, the overwhelming majority of AI crawling isn't indexing your page to cite it right now — it's absorbing it into the models that will answer Gen Alpha's questions next year. The content you publish today is training tomorrow's default answers.
One more fresh reading, on the human side: chatgpt.com still holds the UK top 25 (#25 as of June 2026), confirming the Q1 finding that an AI chat domain is now a permanent fixture of UK web behaviour rather than a novelty. And the mobile-versus-desktop boundary stayed knife-edge — iOS (25.78%) + Android (23.51%) = 49.28% of UK HTTP requests in the 28-day window, dipping just under the 51.01% Q1 figure. The UK isn't decisively mobile-OS or desktop-OS; it sits exactly on the line, which is itself the finding.
Source: Cloudflare Radar —
radar/http/summary/{device_type,os,browser},radar/ai/bots/summary/{user_agent,crawl_purpose}, andradar/ranking/domain/chatgpt.com(radar.cloudflare.com), United Kingdom, 28-day window ending 9 June 2026.
What this means for marketers, product teams, and operators
Three patterns repeat across the dataset.
1. UK Gen Z is the most contradicted generation in survey history. They care about sustainability and shop SHEIN. They feel addicted to social media and use it less than baby boomers do. They want career success more than older cohorts but disengage from politics. Marketers who plan around a single Gen Z identity will get the targetting wrong. The audience is bimodal, conflicted, and self-aware all at once.
2. The TikTok and Snapchat ecosystem is mainstream now. Reach and engagement are different products. Instagram still beats TikTok on Gen Z reach (53% vs 38%), but TikTok holds 4x more daily attention. A reach-first social strategy and a time-first social strategy lead to different platform choices. The dossier makes a strong case that ad recall on video portals (47%) and social (46%) has decisively crossed TV (40%) for UK Gen Z.
3. Gen Alpha is already AI-native. The policy framework is not. 15.5% of UK children used ChatGPT in 2023. 95% of 12-15-year-olds have a smartphone. The UK government's smartphone-ban consideration was opposed by a majority of parents of teenagers. The technology has shipped. The rules haven't.
For our own work at TechnologyChecker, this dataset reshapes how we map technographic signals to consumer segments. The companies whose products serve UK Gen Z, fintechs going phone-first, fast-fashion retailers betting on real-time supply chains, and AI features arriving in kids' apps, are showing up in our detection systems with a different cadence than the previous wave. We're tracking that closely as Gen Alpha matures into a buying audience over the next five years.
Methodology
Data in this article comes from primary research sources cited per chart, plus original network telemetry and analyst commentary from the TechnologyChecker.io team.
Primary data sources
- Office for National Statistics (UK) — UK population by generation, single-year age cohort breakdown for 2023
- Ofcom — children's mobile phone and smartphone ownership by age (April 2024, 2,480 respondents)
- Ipsos Iris and UKOM — UK daily internet use by age and device, social media reach and time spent (March-August 2023)
- YouGov — UK parental opinion on the smartphone sales ban (April 2024, 778 parents); social media platforms by age in the run-up to the July 2024 UK general election
- Deloitte — UK sustainable purchase factors (July 2024, 2,000 respondents)
- Qustodio — children's use of the OpenAI website across countries (400,000 global families with children aged 4-18)
- AppMagic — yearly UK app downloads for SHEIN, Temu, Depop, and Vinted (2021-2024)
- Data.ai, DataReportal, Meltwater, We Are Social — UK mobile and app time spent, category breakdown
- eMarketer — UK Gen Z digital media users by media type (March 2023)
- GWI — UK internet penetration timeline 1995-2024 (with ITU/World Bank estimates for 2002-2021)
- Supplementary context: OpenAI, Pew Research Center, The Economist, Reuters Institute, Office of the Surgeon General, and McKinsey & Company for qualitative framing on Gen Z financial behaviour, parasocial relationships, and mental wellness
- Cloudflare Radar — live UK network telemetry: HTTP request shares by device and OS, browser shares, top UK domains, top services by category, AI bot traffic share, and Internet Speed Test data (282,722 UK tests in the 90-day window). Two windows are used: the Q1 2026 snapshot (1 Jan – 31 Mar) and a fresh 28-day refresh (12 May – 9 June 2026) covering device/OS share, the AI-crawler league table, AI crawl-purpose, and the chatgpt.com domain rank
Survey waves and sample sizes
Survey data spans multiple waves between Q1 2023 and Q4 2024, with sample sizes ranging from 778 parents of teenagers to 24,190 general respondents (including a UK Gen Z subsample of 5,157). The Cloudflare Radar telemetry covers 1 January to 31 March 2026 for UK-tagged HTTP requests and AI bot traffic, and a rolling 90-day window ending 11 May 2026 for the speed-test medians.
Analyst commentary from TechnologyChecker.io
This article includes original analyst commentary from the TechnologyChecker.io team. Quotes are clearly attributed by name and role:
- Elif Arslan, CMO and co-founder, on UK Gen Z marketing strategy and the video-first ad-recall shift
- Mehmet Suleyman, CEO and co-founder (formerly Microsoft Bing / AI team), on how app-first internet behaviour breaks browser-era B2B GTM assumptions and on multi-surface Gen Alpha AI exposure
- Emma Davies, Data Analyst, on the convergence of Gen Z and younger millennial buying signals
- Sophie Clarke, Product Marketing Manager, on TikTok-first GTM economics and the Vinted UK ceiling
- David Thomson, CTO (formerly Google Search team), on AI deepfake verification gaps and the Bytespider crawler signal
These insights are first-party perspectives grounded in TechnologyChecker.io's own crawler infrastructure, which scans 50+ million domains monthly across 40,000+ tracked technologies. They are distinct from the third-party data above and reflect the team's interpretation of what the numbers mean for marketers, product teams, and operators serving UK Gen Z and Gen Alpha audiences.
Frequently asked questions
What percentage of the UK population is Gen Z?
Gen Z represented 19.4% of the UK population in 2023, equivalent to roughly 12.93 million people aged 11 to 26. This makes Gen Z the fourth-largest UK generation behind millennials (21.5%), Gen X (20.6%), and baby boomers (19.9%).
How much time does UK Gen Z spend on TikTok?
UK users aged 15-24 spend an average of 120 minutes per day on TikTok, more than any other platform. Snapchat is second at 80 minutes per day, followed by Instagram at 29 minutes per day. TikTok's reach among UK Gen Z is 38%, lower than Instagram's 53%, but engagement is roughly 4x higher.
What percentage of UK Gen Z access social media daily?
67% of UK Gen Z access social media daily as of September 2023. That is slightly below the national average of 70%. Baby boomers have the highest daily usage rate at 73%, contradicting the popular narrative that Gen Z is the most socially-addicted cohort.
How many UK children have used ChatGPT?
According to Qustodio data cited by Statista, 15.5% of UK children had used the OpenAI website in 2023 — below the 19.6% global average. The UK figure is lower than Australia (24.0%), Spain (21.4%), and the United States (18.7%). Snapchat's My AI feature, a ChatGPT-powered chatbot, launched in the UK in September 2023.
Do UK parents support a smartphone ban for children under 16?
No. 52% of UK parents with children aged 11-15 oppose a smartphone sales ban, compared to 25% who support one. Among parents of children under 11, 43% oppose and 37% support. Across all Britons, 38% oppose and 36% support a ban.
Which fast-fashion brand is most popular with UK Gen Z?
After Amazon (41%), SHEIN is the most popular fashion retailer for UK Gen Z at 23%, ahead of ASOS (21%) and JDSport (19%). SHEIN's UK app downloads grew from 4 million in 2021 to 6.65 million in 2023, and the company filed for an IPO in July 2024 at a valuation of approximately $70 billion. Cloudflare Radar confirms SHEIN at #1 in the global Fast Fashion service ranking for March 2026, with ASOS at #5 — the same ordering as the Statista 2023 dossier.
Is mobile or desktop bigger in the UK in 2026?
It depends on which metric. Cloudflare Radar's device classifier put desktop at 54.88% and mobile at 45.09% of UK HTTP requests in Q1 2026. But the operating-system breakdown shows iOS (26.86%) + Android (24.15%) = 51.01% — narrowly exceeding the desktop-OS sum (48.93%). The gap reflects tablets and iPad-class devices that run mobile OSes but get classified as non-mobile. By traffic, the UK has crossed into a mobile-OS-majority country in 2026.
Where does chatgpt.com rank among UK websites?
According to Cloudflare Radar's domain popularity ranking for the UK on 1 March 2026, chatgpt.com is the #21 most popular domain — above youtube.com (#23) and live.com (#24). It is the highest-ranked AI domain on the UK list. For context, chatgpt.com was not in the UK top 100 in early 2023 when Statista's 15.5% UK-children-using-OpenAI data was collected.
How much of UK AI bot traffic comes from OpenAI versus Anthropic?
In Q1 2026, OpenAI's combined UK AI bot share — ChatGPT-User (12.57%) plus GPTBot (5.65%) = 18.22% — was more than double Anthropic's ClaudeBot at 8.85%. Meta-ExternalAgent reached 8.78%, roughly tied with Anthropic. By the fresh 28-day window ending 9 June 2026, the order had shifted: Meta-ExternalAgent surged to 13.89% and overtook Bingbot for #2, while OpenAI's combined share cooled to 14.49%. Googlebot remains the largest AI-related crawler overall (≈37%), and the OpenAI/Anthropic/Meta cluster combined still represents close to 30% of UK AI bot traffic — a meaningful indicator of how much UK content is being read by AI assistants serving Gen Z and Gen Alpha audiences.
Elif Arslan
CMO & Co-founder

