The Technology Lookup Software Industry: 2025–2026 Statistics & Insights (from my know-how)
The latest 2025–2026 insights, statistics, and trends in the technology lookup software industry from BuiltWith and Wappalyzer to SimilarTech and Technologychecker.io. Includes March 2026 web technology market share data, detection methods deep-dive, and how technographics drive smarter B2B sales, marketing, and growth strategies.
Published •Updated •44 min read

If you sell to businesses, what your prospects run under the hood matters. I've spent the better part of a decade working with technographic data—buying, testing, and integrating every major tool in this space—and the market has changed dramatically even in the last 12 months. In this post I unpack the technographics / technology-lookup market (think BuiltWith, Wappalyzer, SimilarTech, Datanyze, Demandbase), share fresh stats, and show how I actually use these tools for sales, marketing, and research.
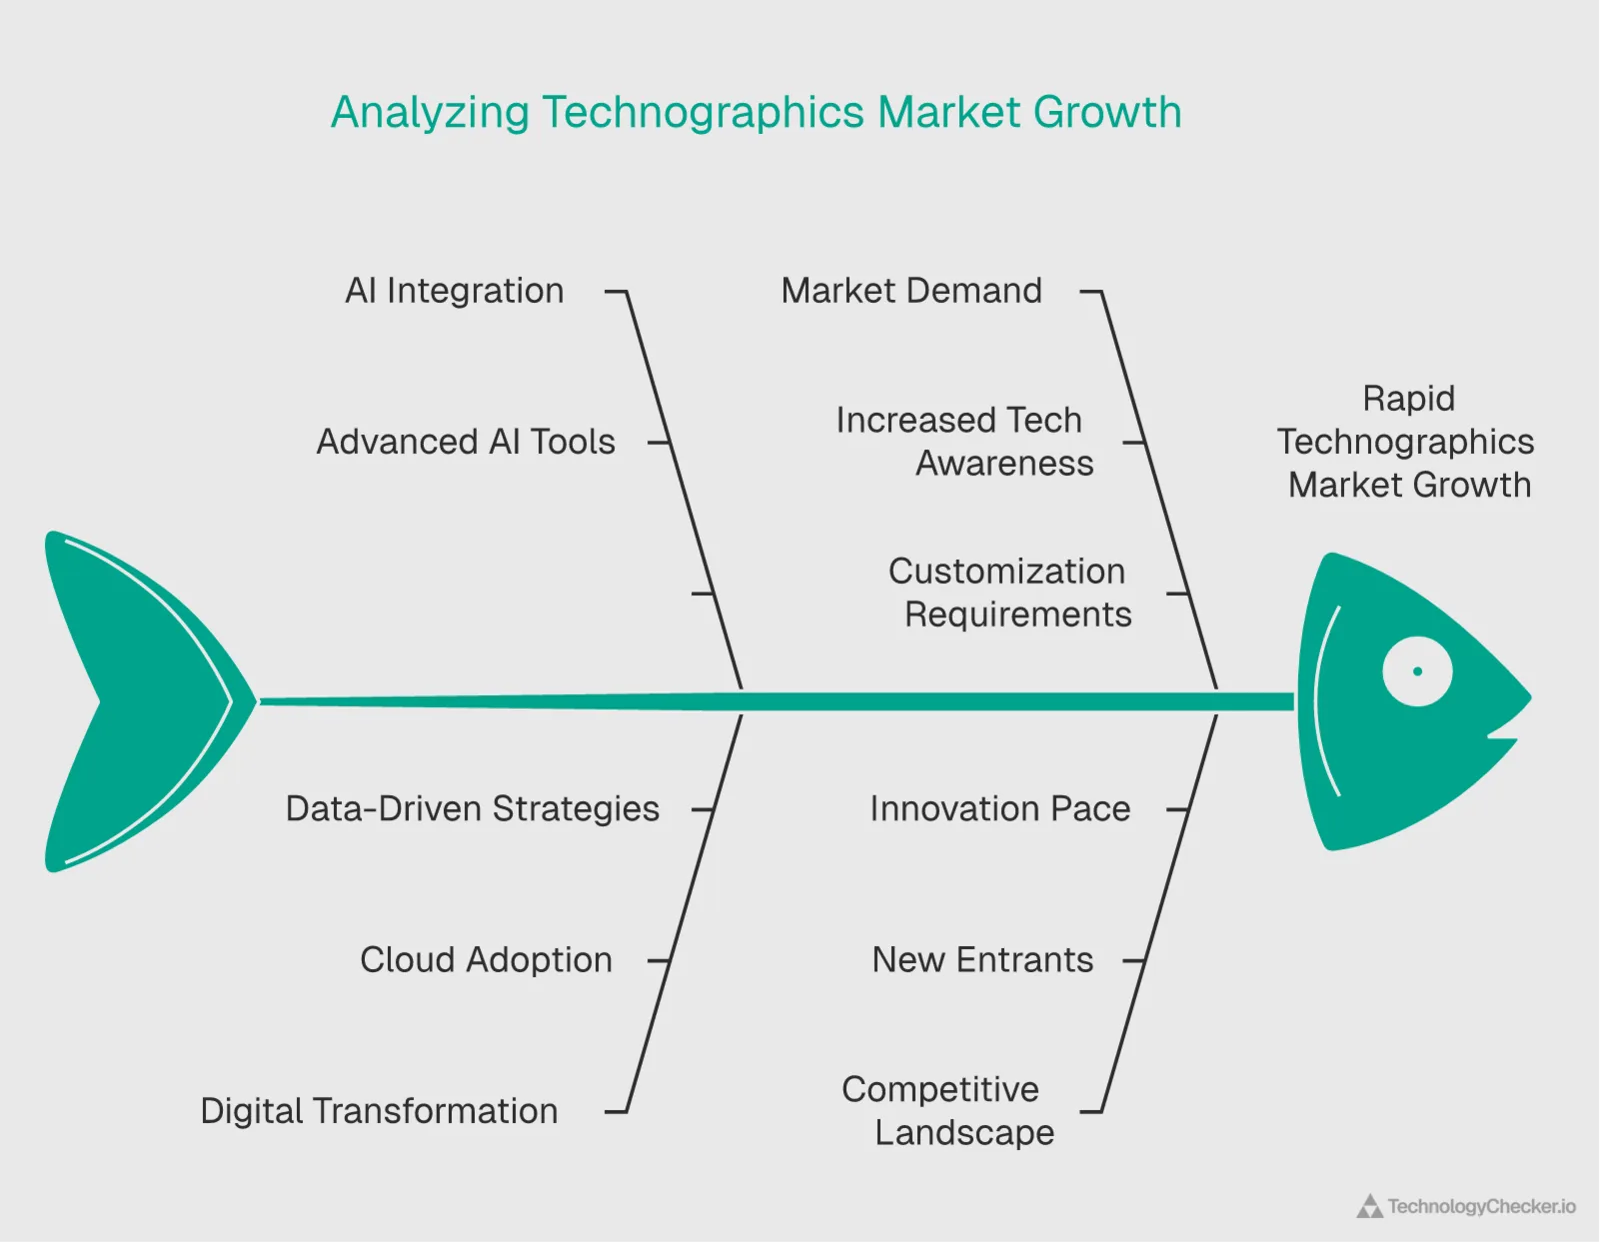
The technology lookup software industry has emerged as a critical enabler for modern B2B sales, marketing, and competitive intelligence. As businesses increasingly rely on technographic data to identify prospects, understand competitors, and optimize their go-to-market strategies, this niche yet powerful segment is experiencing robust growth—from approximately $367 million in 2020 to $1.17 billion in 2025—alongside broader software industry trends.
Here's the thing none of the BuiltWith-vs-Wappalyzer comparison posts will tell you: the most valuable signal in technographic data isn't who uses a technology—it's who used to. Our own crawl of 29.6M domains tracks not just live detections but abandonment, and across the 284 technologies we profile in depth the average tool has been removed from more domains than it currently runs on. New Relic shows 1.74M domains that dropped it against just 167K that still run it. That churn layer—structurally invisible to the browser-extension tools most of this industry is built on—is where the displacement pipeline actually lives. I unpack it with hard numbers in the "What our own crawl shows" section below.
What I mean by "technology lookup"

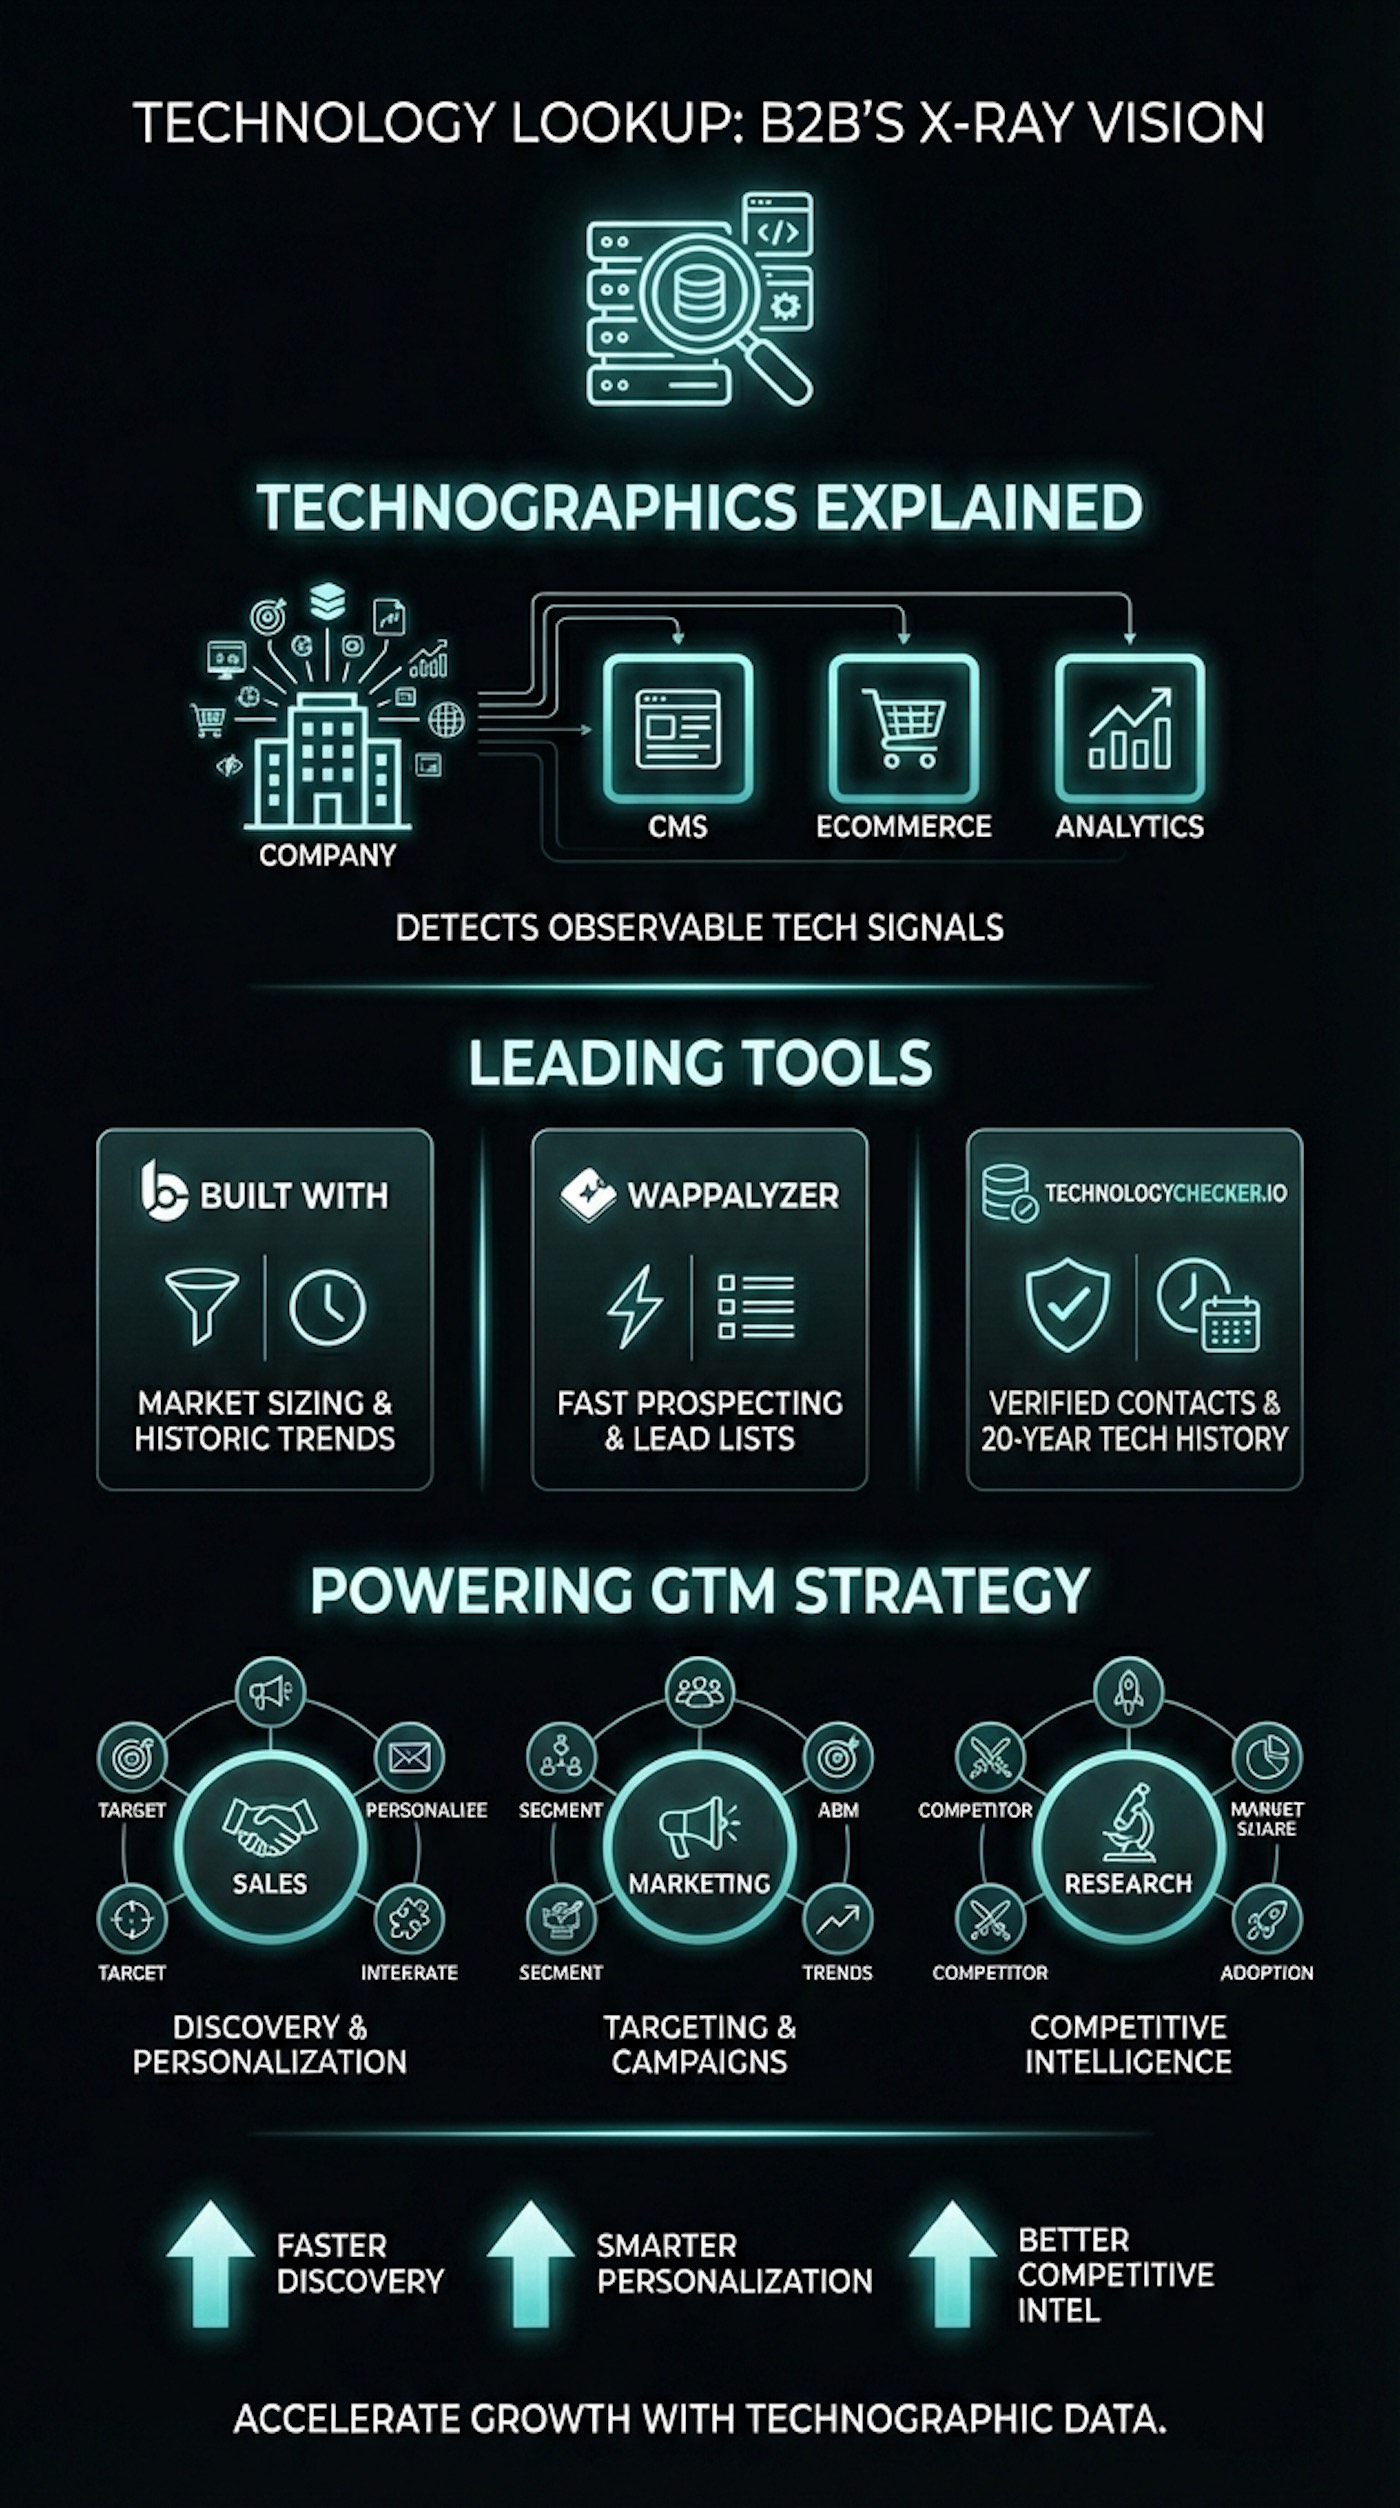
Technographics are the observable technologies a company uses—CMS, ecommerce platform, analytics, pixels, cloud, etc. Tools in this space detect those signals at scale and make them searchable, exportable, and (ideally) actionable. They work by analyzing HTML source code, JavaScript libraries, HTTP headers, DNS records, and behavioral patterns to build a comprehensive profile of a website's technology stack.
The scope is massive. HG Insights calls this dataset "Technology Installs" and quantifies it across 9M+ companies and 120M+ installs. Demandbase tracks 82M+ domains and 18K+ technologies by blending AI with human intelligence. SalesIntel monitors 16,500+ products across 22M companies, claiming 225M+ data points with 90%+ accuracy. These numbers give you a sense of how deep the coverage goes—and why the average enterprise now uses 100+ software applications, making technographic profiling not just useful but essential.
The technographics market by the numbers
Before diving into tools, here's the market context I use to frame budgeting conversations with leadership:
| Period | Market size (USD) | CAGR | Source context |
|---|---|---|---|
| 2020–2025 | $367M → $1.17B | 26.1% | Technographics-specific segment |
| 2020–2025 (alt. projection) | $2.5B → $6.8B | 21.2% | Broader technology intelligence market |
| 2023–2028 (forecast) | — | 12.5% | Post-maturity steady growth |
These figures sit within the global software market, which reached USD 823.92 billion in 2025 and is projected to expand to USD 2,248.33 billion by 2034 at 11.8% CAGR. Global IT spending is forecasted at USD 6.15 trillion in 2026 (10.8% growth), with Forrester pegging it at USD 5.6 trillion (7.8% growth).
The takeaway: this niche is growing 2–3× faster than the broader software market, fueled by AI integration and the digital transformation wave.
Adoption stats that surprised me
I track these metrics because they help me justify tooling spend in budget reviews:
| Metric | Value |
|---|---|
| Businesses using technographics in decision-making | >80% |
| B2B marketers calling it essential for marketing strategies | 90% |
| B2B marketers using technographics for personalization | 75% |
| B2B marketers using it for targeting and opportunities | 66% |
| Higher conversion rates in technographic-driven campaigns | 28% |
| Companies more likely to exceed revenue goals with technographics | 50% |
| B2B sales influenced by technographics by 2026 | >80% |
| Shorter sales cycles when using technographic data | 27% |
| Companies planning to adopt more digital platforms | 86% |
| Average software applications per enterprise | 100+ |
The one that changed my budgeting approach: companies using technographic data are 50% more likely to exceed revenue goals. That's not a marginal improvement—it's the difference between a tool that's "nice to have" and one that pays for itself.
Web technology market share (March 2026)
Before I share tool-specific stats, here's the landscape those tools are detecting. These March 2026 market share figures help me contextualize what "technology detection" actually means in practice:
Web Servers:
| Server | Market share |
|---|---|
| Nginx | 32.8% |
| Cloudflare Server | 26.6% |
| Apache | 24.1% |
| LiteSpeed | 15.0% |
The server landscape has shifted dramatically. In 2010, Apache commanded 71.5% and Nginx sat at just 3.9%. By April 2017, Apache had dropped to ~50% while Nginx reached 33.3%. Today, Cloudflare Server has surged to second place at 26.6%, reflecting the CDN-first architecture trend. Performance advantages, HTTP/2 support, and superior concurrent-connection handling drove the Nginx rise; Cloudflare's growth signals how many sites now route through edge networks—which, incidentally, makes technology detection harder.
Content Management Systems:
| CMS | All websites | CMS market share |
|---|---|---|
| WordPress | 42.6% | 59.9% |
| Shopify | 5.1% | 7.2% |
| Squarespace | 2.5% | 3.5% |
| Joomla | 1.3% | 1.8% |
| Drupal | 0.7% | 1.0% |
WordPress at nearly 60% CMS market share is why every technology lookup tool starts with CMS detection. But Shopify's rise to 5.1% of all websites (powering 6,913,044 live stores) makes ecommerce-stack detection equally critical for B2B prospecting. Our Shopify market analytics breaks down companies using Shopify, their adoption patterns, and migration trends in detail.
JavaScript Libraries:
| Library | All websites | Among monitored libraries |
|---|---|---|
| jQuery | 70.5% | 88.6% |
| React | 6.2% | 7.8% |
| Vue.js | 0.7% | 0.9% |
| Angular | 0.2% | 0.3% |
jQuery's dominance at 88.6% among monitored JS libraries is a reminder: most of the web still runs "legacy" stacks. But the progressive migration toward React (7.8% and growing) signals the component-based architecture shift that modern detection tools must keep up with—especially since React apps often render client-side, making server-based detection harder.
Traffic & Analytics Tools:
| Tool | All websites | Among analytics users |
|---|---|---|
| Google Analytics | 44.0% | 78.7% |
| Meta Pixel | 9.1% | 16.3% |
| WordPress Jetpack | 3.9% | 6.9% |
| Yandex.Metrica | 3.7% | 6.6% |
| Microsoft Clarity | 3.6% | 6.5% |
Google Analytics at 78.7% among analytics users is the most commonly detected technology signal. Microsoft Clarity's rapid rise to 6.5% is worth watching—it's a strong "recently adopted tool" signal for sales teams. The profile of companies using Microsoft Clarity skews heavily toward mid-market e-commerce sites running WordPress and Shopify.
What our own crawl shows (the churn layer nobody publishes)
The market-share tables above are the consensus—W3Techs, BuiltWith, and Grokipedia broadly agree on them, which is exactly why they're commodity data you can get anywhere. What you can't get from those sources is the other half of every technology's story: abandonment.
We track 29.6M domains across 284 technologies in 66 categories—see our full category-by-category breakdown—and for every one we store not just current detections but a previouslyUsedCount: domains where we fingerprinted the technology in an earlier crawl and a later crawl came back clean. That single field reframes the whole "competitive displacement" play, because it turns out churn isn't the exception. It's the norm.
Technologies our crawl shows bleeding the most domains
| Technology | Live domains | Previously detected | Churn rate | Category |
|---|---|---|---|---|
| Mailgun | 2,238 | 115,364 | 98.1% | Email Marketing |
| SendGrid | 2,068 | 99,735 | 98.0% | Email Marketing |
| Mixpanel | 19,474 | 305,448 | 94.0% | Web Analytics |
| New Relic | 167,893 | 1,742,207 | 91.2% | Real User Monitoring |
| AngularJS | 158,783 | 873,756 | 84.6% | JavaScript Frameworks |
| Stripe | 243,317 | 869,193 | 78.1% | Payment Processing |
| Drupal | 91,286 | 251,588 | 73.4% | CMS |
| HubSpot | 121,300 | 289,752 | 70.5% | Marketing Automation |
A few of these need context. A deprecated framework like AngularJS bleeding 84.6% is expected—but New Relic at 91.2% churn is still the category leader in Real User Monitoring. It holds a 52% live market share and shows the heaviest absolute abandonment we track: 1.74M domains gone. That's not a dying product—it's a product with a massive, continuously-churning installed base. For anyone selling an observability alternative, that 1.74M is the addressable market, and it's invisible to every tool that only reports live detections.
Even the category kings churn
The more surprising finding: the giants leak too. Our crawl shows Nginx with 4.64M live domains against 8.18M that previously ran it—a 63.8% churn rate for the number-one web server on the planet. Google Analytics sits at 54%, largely the Universal Analytics → GA4 shift we documented in our GA4 migration analysis. Even WordPress and React—the category kings of CMS and JavaScript frameworks—each show roughly 42% churn against their installed base.
The takeaway for go-to-market teams: "company X uses technology Y" is a weak signal on its own. "Company X removed technology Y last quarter" is the strong one—and it's the half of the dataset that browser-extension-based tools structurally cannot see, because they only inspect what's live in the DOM right now. We go deeper on this pattern in our Shopify migration analysis and why SaaS companies switch CRMs.
Methodology note: Churn rate here =
previouslyUsedCount ÷ (customerCount + previouslyUsedCount), computed from our crawl as of May 2026. "Previously detected" means we fingerprinted the technology on a domain in an earlier crawl and a later crawl came back clean. It does not distinguish a deliberate migration from a site rebuild that simply re-fingerprints differently—we treat it as a candidate displacement signal, not a confirmed one. These figures cover the 284 technologies we profile with full company-level data, a subset of our total detection coverage.
Snapshot stats I keep handy
- BuiltWith pricing & scope signals. BuiltWith's paid plans start at $295/mo (Basic), then $495/mo (Pro) and $995/mo (Team); it also advertises continuous indexing ("tens of thousands of websites every minute"), which is the kind of crawl cadence you want for go-to-market use cases. Coverage: 673M+ websites and 112,075+ web technologies.
- Wappalyzer coverage & free tier. Wappalyzer tracks 7,400 web technologies across 106 categories and offers 50 free lookups per month, with paid plans unlocking bulk lookups, lists, and API. Data is updated daily—crucial for fresh lead lists.
- SimilarTech pricing reality check. Public listings peg SimilarTech (a Similarweb company) from ~$200/mo (Basic) to $490/mo (Ultimate), with enterprise on request. (Your quote may vary.)
- Demandbase scale. Tracks 82M+ domains and 18K+ technologies, blending AI and human intelligence for custom insights like revenue potential and IT spending predictions.
- SalesIntel depth. Monitors 16,500+ products across 22M companies with 225M+ data points and claims 90%+ accuracy—one of the few vendors to publish an accuracy figure.
- Technologychecker.io: This is the platform I helped build, so I'll be transparent about my bias—but the differentiators are real: 40,000+ technology signatures across 50M+ domains (10× the coverage of most competitors), full-stack detection that catches backend tools like n8n and standalone platforms like Airtable that browser-extension-based tools miss entirely, real-time alerts when prospects switch tools, verified decision-maker contacts included with every profile, and 20-year historical intelligence for churn prediction and buying window detection. It's built for sales teams, not developers.
Where I get "voice of the customer": I scan G2 and Trustpilot for quick sentiment and recurring themes. You'll see those patterns below with links to the live review pages.
What buyers actually say (my distilled takeaways)
- Value: Users praise these tools for fast lead discovery and personalization. Typical notes: "find targeting prospects easily," "filter leads by stack," "monitor competitors' tech changes." (See recent G2 reviews for BuiltWith and Wappalyzer.)
- Ease of use: Wappalyzer consistently gets high ease-of-use marks; the browser extension + lists/API workflow reduces friction for sales and growth teams. Demandbase users highlight the AI-powered custom insights, though the learning curve is steeper.
- Pain points: Across vendors, the two recurring knocks are price at higher tiers and occasional stale/missed detections (the nature of web crawling). Top providers claim up to 90% accuracy, but custom or headless stacks still cause detection gaps. Trustpilot for BuiltWith shows a mix of strong experiences and a few frustrated outliers—useful context when you budget and set expectations.
- ROI signals in reviews: Multiple G2 reviewers cite shorter research time and higher-quality prospect lists as the primary value drivers—aligning with the 27% shorter sales cycle stat I referenced above.
How I map the competitive landscape (expanded compare)
| Product | Entry price | Free tier | Coverage | What it's great at (in my hands) |
|---|---|---|---|---|
| BuiltWith | $295/mo+ | Yes (single lookups) | 673M+ websites, 112K+ techs | Deep filters, historic trends, large crawl footprint; I use it for market sizing & CSV exports. |
| Wappalyzer | Plans vary | 50 free lookups/mo | 7,400 techs, 106 categories | Fast prospecting, lead lists + change alerts + API; handy for SDR workflows. Updated daily. |
| Demandbase | Enterprise | Demo required | 82M+ domains, 18K+ techs | AI-enhanced insights, revenue potential predictions, IT spending estimates; best for enterprise ABM. |
| SalesIntel | Plans vary | Trial | 22M companies, 16.5K+ products | 225M+ data points, 90%+ accuracy; strong when you need breadth + verified contacts. |
| HG Insights | Enterprise | Demo required | 9M+ companies, 120M+ installs | Enterprise-scale technographic data; great for market sizing and TAM analysis. |
| SimilarTech | ~$200–$490/mo | Trial | Market share data | Sales-focused with traffic context (Similarweb ecosystem); adoption rates and trend analysis. |
| Datanyze | Plans vary | 90-day free trial (10 credits/mo) | Contact + tech profiling | Combines technographics with contact-level insights for direct sales engagement. |
| Enricher.io | ~$200–$490/mo | Trial | Tech + traffic context | Tech filters + site traffic context; good when I need "tech + visits + geo" in one pass. |
| TechnologyChecker.io | $89 | Trial tiers vary | 40K+ techs, 50M+ domains, 20-year history | Full-stack detection (frontend + backend + standalone); real-time churn & adoption alerts; verified C-level contacts; bulk enrichment up to 100K domains. Built for sales workflows. See TechnologyChecker data methodology. |
My favorite plays (with links you can click and replicate)

The data says technographic-driven campaigns see 28% higher conversion rates and 27% shorter sales cycles. Here's how I turn those stats into pipeline:
-
Integration-led ABM lists (minutes, not days).
- Pull a list of companies using your best-performing integration (e.g., Shopify + Klaviyo) with Wappalyzer Lead lists, filter by location/industry, then export to your CRM.
- If I need historical adoption to size the market or to show growth to leadership, I jump to BuiltWith Trends.
- For enterprise accounts, I cross-reference with Demandbase to add revenue potential and IT spending predictions to the profile.
-
Competitive displacement campaigns.
- This is the play I keep coming back to: 60% of B2B software purchases are replacements, not net-new. I identify accounts running a competitor's product, filter for signs they've outgrown it (e.g., adding workaround tools, slow adoption of new modules), and time outreach near likely renewal windows.
- BuiltWith's historical data is invaluable here—I can see when a technology was first detected and estimate contract timelines.
-
Competitive takeaways for AEs in prep.
- Before a call, I run a quick lookup to see a prospect's analytics, forms, and chat stack; this lets me tailor discovery questions and integration stories. (Wappalyzer's extension is the fastest path.)
- For a 30-second "is this a big site?" sniff test, I like that SimilarTech sits inside Similarweb's ecosystem, so traffic estimates are at hand.
-
Change-trigger outreach.
- I set website change alerts on target accounts. When a prospect adds (or rips out) a tech I integrate with, I trigger a relevant email/call sequence the same day. This alone has generated some of my highest-converting outbound sequences.
-
Market sizing and TAM analysis.
- When leadership asks "how big is our addressable market?", I pull BuiltWith Trends data and cross-reference with HG Insights. For example, I can show not just how many companies use a given technology but how fast adoption is growing—which makes the TAM story much more compelling to investors and board members.
The numbers that steer my buying decision
- Coverage & recrawl cadence matter more than slick UI. BuiltWith explicitly markets high-frequency indexing, and that shows up in fresher lists—crucial for deliverability and reply rates. Wappalyzer updates daily. If a provider can't tell you their crawl frequency, that's a red flag.
- Accuracy benchmarks are table stakes. Top providers claim 90%+ accuracy, but always test against your must-detect tech list. Custom-built solutions, headless CMS architectures, and API-first apps still trip up most detection engines.
- Data shape needs to match your workflow: if you live in enrichment/automation, an API & bulk lookup is non-negotiable (Wappalyzer/BuiltWith both offer this). If you need intent + contacts, Demandbase or Datanyze might be the better fit.
- Total cost to value: don't just look at sticker price; measure meetings set per $1k in data spend. Public price anchors: BuiltWith $295–$995/mo, SimilarTech ~$200–$490/mo, Wappalyzer has a generous free tier + paid options for lists/API.
- Review reality check: skim the newest G2 reviews for the exact modules you'll use (lists, alerts, exports). It's the fastest way to see live pros/cons from peers.
Ideal Customer Profiles (ICPs) I see adopting these tools fastest
- Mid-market SaaS & dev-tools vendors running ABM, where "uses X" is a strong fit signal. (Start with Wappalyzer lists; move to BuiltWith for TAM sizing.) 48% of B2B marketers report ABM is more effective when enriched with technographic data.
- Enterprise sales orgs that need technographics + contacts/intent in one pane (Demandbase/Datanyze/SalesIntel). These teams see the biggest impact from the 27% shorter sales cycles stat.
- Market intel & product marketing teams who care about adoption trends and market share slices over time (BuiltWith Trends / Similarweb context / HG Insights). 75% of B2B marketers use technographic data for campaign personalization.
- Competitive intelligence teams tracking tech migrations—especially relevant given that 60% of B2B software purchases are replacements, making displacement campaigns a primary revenue driver.
A quick word on free alternatives
If you're just getting your feet wet, Enricher.io is a solid free tool that spots CMS/plugins/themes and even lets you follow sites (neat for dev/design and lightweight prospecting). It's not a list-building tool, but it's great for spot checks. WhatRuns offers a completely free browser extension, and Snov.io has a free technology checker for basic needs.
Buyer's checklist (what I verify before I swipe the card)
- Your must-detect tech list (10–20 core apps): run a sample across tools and compare hits/misses. Top vendors claim 90%+ accuracy—verify it for your stack.
- Recrawl freshness on your named accounts (anything stale >30–60 days will hurt ROI).
- Export & API limits (rows/day, endpoints) against your workflow.
- Change alerts and CRM integrations for actual adoption (not just pretty dashboards).
- Pricing math tied to meetings created, not seats. Use public price anchors to pressure-test quotes.
- Privacy and compliance posture: ensure the vendor is GDPR/CCPA compliant, especially if you operate in regulated industries like healthcare or finance.
Market Overview: The Digital Intelligence Revolution
Industry Context
The global software market reached USD 823.92 billion in 2025 and is projected to expand to USD 2,248.33 billion by 2034, growing at a CAGR of 11.8%. Within this expansive landscape, technology lookup and profiling tools represent a specialized but increasingly vital segment.
Total software revenue is expected to grow more than 10% annually through 2029, including approximately 12% in 2025, driven by three key tailwinds:
- Switching costs that drive high customer retention
- High upfront investments securing sticky revenue streams
- Continuous innovation maintaining attractive growth trajectories
Global IT spending further underscores the opportunity: Gartner projects USD 6.15 trillion in 2026 (10.8% growth from 2025), while Forrester estimates USD 5.6 trillion (7.8% growth). Either way, the direction is clear: more software, more complexity, more need for technographic intelligence. We pressure-tested 39 analyst forecasts against our own crawl in Technology Trends 2026 — only a handful held up against the field data.
The broader sales intelligence market reached $4.13 billion in 2025 and is projected to exceed $11.41 billion by 2035 at 10.7% CAGR. Within this, the account intelligence platform segment is growing from $2.1 billion to $4.8 billion by 2029 (18.2% CAGR), driven by rising demand for technographic insights. Technographics sits at the intersection of both markets—and is the fastest-growing subsegment within either.
The Rise of Technographic Intelligence
Technology lookup software—also known as technographic profiling tools—enables businesses to identify the technology stack powering any website. This capability has transformed from a niche developer tool into an essential sales and marketing asset. The numbers back this up: over 80% of businesses now incorporate technographics into their decision-making, and 90% view it as essential for marketing strategies.
The technographics market itself grew from approximately $367 million in 2020 to $1.17 billion in 2025 (26.1% CAGR), with alternative projections suggesting the broader technology intelligence category reached up to $6.8 billion by 2025 (21.2% CAGR). Post-2025 growth is forecasted at around 12.5% CAGR through 2028, driven by AI integration and expanding enterprise adoption.
Key players in the space include:
- Wappalyzer (founded ~2007-2008) — 7,400 technologies, 106 categories
- BuiltWith (founded 2007) — 673M+ websites, 112,075+ technologies
- Demandbase — 82M+ domains, 18K+ technologies
- HG Insights — 9M+ companies, 120M+ installs
- SalesIntel — 22M companies, 16,500+ products, 225M+ data points
- Datanyze — technographics + contact insights
- SimilarTech (Similarweb subsidiary) — market share and adoption data
- Klazify, Enricher.io, TechDataPark, Cognism
- Technologychecker.io — 40K+ technologies, 50M+ domains, full-stack detection, real-time alerts + verified contacts
For a detailed comparison of these tools with pricing data and real user reviews, see our BuiltWith alternatives comparison.
2025–2026 Technology Trends Driving the Industry
1. AI-Powered Detection and Analysis

The AI wave is no longer theoretical—it's reshaping every layer of the software industry, including technology detection. The numbers I'm tracking:
- Companies spent $37 billion on generative AI in 2025, up from $11.5 billion in 2024—a 3.2× year-over-year increase. McKinsey's 2025 survey shows 92% of firms plan to increase AI budgets within the next three years.
- 78% of organizations now use AI in at least one business function—up from 55% just a year prior.
- 84% of developers use AI tools in 2026, and 41% of all code written in 2025 was AI-generated. GitHub Copilot alone has 20 million cumulative users and a 46% code completion rate, with 90% adoption among Fortune 100 companies.
- The AI coding tools market reached $7.37 billion in 2025 and is projected to hit $30.1 billion by 2032 (27.1% CAGR).
This AI revolution extends directly to technology detection tools, which now leverage machine learning for:
- Enhanced accuracy in identifying technologies (AI-driven platforms boost conversions by 20%+)
- Real-time classification of website stacks at scale
- Predictive analytics for technology adoption trends
- Automated anomaly detection for technology changes
- Natural language queries for technographic data (emerging in platforms like Demandbase)
- Agentic AI workflows — in 2026, AI is moving toward agentic systems that can independently execute tasks, orchestrate cloud resources, and monitor system behavior, which will enable autonomous competitive monitoring and prospecting workflows
2. Cloud-Native Infrastructure and SaaS Explosion
Gartner estimates that 95% of new digital workloads will be deployed on cloud-native platforms by 2025. The global cloud computing market reached approximately $912 billion in 2025 and is projected to hit $2.65 trillion by 2031 (20.65% CAGR). Meanwhile, the B2B SaaS market was valued at $390 billion in 2025 and is estimated to reach $1,578 billion by 2031 at 26.24% CAGR.
What this means for technographic tools: organizations now use an average of 106 SaaS applications each—up from estimates of 100+ just a year prior—and 95% of organizations will adopt AI-powered SaaS by 2025. The sheer volume of detectable technologies is expanding faster than ever:
- Need to detect containerized and microservices architectures
- Tracking of multi-cloud and hybrid cloud deployments
- Identification of serverless and edge computing implementations
- Expanding the detectable surface area as 86% of companies plan to adopt more digital platforms
- Growing complexity drives demand for automated tech stack profiling—manual research at this scale is simply impossible
3. Edge Computing and Distributed Systems
IDC notes that companies will invest approximately $261 billion in edge technology by 2025 to reduce latency and maintain data locality. Technology profiling tools must now account for:
- Distributed application architectures
- Edge-native technologies
- IoT platform integrations
- Real-time data processing solutions
4. B2B Sales Intelligence Convergence
The most important trend I've observed: technographics is converging with intent data, firmographics, and contact intelligence into unified go-to-market platforms. Over 80% of B2B sales may be influenced by technographics by 2026, and the winners will be providers who combine all these signals. This is why we're seeing acquisitions (SimilarTech by Similarweb) and platform expansions (Demandbase adding technographic layers to its ABM suite).
Market Statistics & Growth Metrics
Website and Technology Landscape
There are approximately 1.09 billion websites worldwide as of 2025, with 193.5 million of them active. This massive digital footprint creates an enormous addressable market for technology lookup services.
Content Management Systems Market Share (2025):
- Wix: 31.05% market share
- Squarespace: 18.92%
- Shopify: 13.34%
Traffic Patterns: Mobile devices drive 54.67% of website traffic, and users abandon sites that load slower than 3 seconds, making technology stack optimization critical for business success.
Technographics Market Growth
| Period | Market size (USD) | CAGR | Context |
|---|---|---|---|
| 2020–2025 | $367M → $1.17B | 26.1% | Core technographics segment |
| 2020–2025 (alt.) | $2.5B → $6.8B | 21.2% | Broader technology intelligence |
| 2023–2028 | Forecasted | 12.5% | AI-driven steady growth |
| Sales intelligence 2025–2035 | $4.13B → $11.41B | 10.7% | Broader sales intel market |
| Account intelligence 2025–2029 | $2.1B → $4.8B | 18.2% | ABM/account platforms |
| B2B SaaS 2025–2031 | $390B → $1,578B | 26.24% | Addressable market for tech profiling |
| Cloud computing 2025–2031 | $912B → $2,650B | 20.65% | Infrastructure driving complexity |
| Software market 2025–2034 | $824B → $2,248B | 11.8% | Parent market context |
| AI coding tools 2025–2032 | $7.37B → $30.1B | 27.1% | AI accelerating detection |
| Gen AI spend 2024–2025 | $11.5B → $37B | 3.2× YoY | Enterprise AI investment |
| Global IT spend 2026 | $6.15T (Gartner) / $5.6T (Forrester) | 10.8% / 7.8% | Total IT market |
Provider Coverage Comparison
| Provider | Websites/Companies tracked | Technologies | Accuracy | Key differentiator |
|---|---|---|---|---|
| BuiltWith | 673M+ websites | 112,075+ | High | Historical trends, deep filters |
| Wappalyzer | Daily-updated index | 7,400 (106 categories) | High | Ease of use, lead lists, API |
| Demandbase | 82M+ domains | 18K+ | AI-enhanced | Revenue potential, IT spend predictions |
| SalesIntel | 22M companies | 16,500+ products | 90%+ | 225M+ data points, verified contacts |
| HG Insights | 9M+ companies | 120M+ installs | Enterprise-grade | Market sizing, TAM analysis |
| TechnologyChecker | 50M+ domains | 40,000+ | 95%+ (multi-signal) | Full-stack + real-time alerts + verified contacts |
| TechDataPark | Millions of companies | Broad | ~90% | Affordable enterprise data |
Related Market Segments
Static Code Analysis Tools Market
The global Static Code Analysis and Detection Tool market size was valued at USD 909 million in 2024 and is projected to grow from USD 970 million in 2025 to USD 1,446 million by 2031, exhibiting a CAGR of 6.9%.
This adjacent market demonstrates the growing appetite for automated technology intelligence and code-level insights.
Application Monitoring Tools Market
The application metrics and monitoring tools market is worth USD 12.88 billion in 2025 and will reach USD 37.78 billion by 2035, with a projected CAGR of 11.3%.
Key growth drivers:
- Cloud-native applications adoption
- AI-based observability solutions
- Real-time performance monitoring demand
- Microservices and DevOps proliferation
Additional Industry Context
Enterprise AI Adoption: 78% of organizations use AI in at least one business function, and 90% of enterprises plan to increase AI investment in 2026. Companies spent $37 billion on generative AI in 2025—a 3.2× increase from 2024—with 92% planning further budget increases.
AI-Generated Code Revolution: 41% of all code written in 2025 was AI-generated, with 84% of developers using AI tools. GitHub Copilot reached 20 million users with 90% Fortune 100 adoption. The AI coding tools market hit $7.37B in 2025 and is projected to reach $30.1B by 2032. This has direct implications for technology detection—as AI generates more code, the fingerprints and patterns tools must identify are evolving rapidly.
SaaS Application Sprawl: Organizations now use an average of 106 SaaS applications each, creating exponentially more technology signals for profiling tools to detect. 95% of organizations will adopt AI-powered SaaS, adding another detection category. B2B SaaS churn sits at an average of 3.5% in 2025—making churn prediction via technographics a high-value use case. Our CRM switching patterns analysis reveals that 73% of SaaS companies change CRMs within 3 years, a pattern that technographic intelligence can predict early.
Low-code/No-code Platform Growth: Gartner estimates that by 2025, 65% of all application development activity will occur on low-code/no-code platforms. Low-code technologies are expected to power 75% of new apps by 2026. These platforms create new detection challenges—and opportunities—for technographic tools.
Cloud Computing Market: The global cloud computing market reached approximately $912 billion in 2025 and is projected to reach $2.65 trillion by 2031 (20.65% CAGR). SaaS captures 55% of cloud revenue, and North America holds a 41% market share.
Blockchain Market Expansion: The blockchain market is projected to reach $163 billion by 2027, expanding beyond cryptocurrency into supply chain management, healthcare, and digital identity.
Developer Workforce: The number of software developers worldwide is expected to reach 30 million in 2025, up from around 27.7 million in 2023. CIOs plan to increase software spending by 3.9% in 2026, with the software development market potentially growing at 20% annually to reach $61 billion by 2029.
Remote Work: As of 2024, over 70% of developers worked remotely at least part-time, with 35% working fully remote, driving demand for cloud-based development environments and collaboration tools.
Competitive Landscape Analysis
Wappalyzer vs. BuiltWith: The Industry Leaders
Both companies share common origins—both are Australian-based and founded around the same time (2007-2008)—but have evolved distinct positioning:
Wappalyzer Strengths:
- Consistent customer feedback confirms that Wappalyzer is the most accurate technology profiler, with data updated daily
- Superior on-page user experience
- More affordable mid-tier pricing with included API credits
- Strong lead generation capabilities with list building and change alerts
- Intuitive browser extensions for instant detection
BuiltWith Strengths:
- BuiltWith excels at category depth and historical trends, offering market-share data and deep filters
- Comprehensive database of 673+ million websites and 112,075+ web technologies
- Historical technology adoption tracking—invaluable for competitive displacement analysis
- Advanced segmentation by country, traffic, and vertical
- Extensive integrations (Salesforce, Zoho, Microsoft Dynamics 365, Slack, Marketo)
Enterprise-Scale Providers
Demandbase:
- Tracks 82M+ domains and 18K+ technologies with AI-enhanced intelligence
- Goes beyond detection to provide revenue potential estimates and IT spending predictions
- Strong ABM integration—pairs technographics with intent signals and firmographic data
- Enterprise pricing with demo-based onboarding
HG Insights:
- Covers 9M+ companies and 120M+ technology installs
- Enterprise-grade data focused on market sizing and total addressable market (TAM) analysis
- Used heavily by investors and analysts for due diligence and market validation
SalesIntel:
- Monitors 16,500+ products across 22M companies with 225M+ data points
- Claims 90%+ data accuracy—one of the few vendors to publish accuracy benchmarks
- Strong human-verified contact data alongside technographic profiling
Emerging Players
Datanyze:
- Extends beyond tech profiling by adding contact-level insights, enabling sales teams to directly engage with decision-makers
- Free 90-day trial with 10 credits per month
- Strong sales enablement focus
SimilarTech:
- Sales-centric positioning within the Similarweb ecosystem
- Provides market share data, adoption rates, and trends
- Enterprise pricing starting at $299/month
- Unique advantage: traffic estimates alongside technology data
Technologychecker.io (full disclosure: this is our platform)
TechnologyChecker was purpose-built for B2B sales teams—not as a developer browser extension. The core differentiators that set it apart in my experience:
- 40,000+ technology signatures across 50M+ domains — 10× the coverage of tools like Wappalyzer, covering frontend, backend, and standalone platforms
- Full-stack detection: catches backend tools (n8n, databases, APIs, server frameworks) and standalone SaaS platforms (Airtable, Notion, Zapier, Make) that browser-extension-based tools miss entirely. When a prospect adopts n8n + Airtable, that signals they're building custom ops workflows—a high-intent buying signal that frontend-only tools can't see
- 20-year historical data + real-time monitoring: predict churn based on historical switching patterns, identify buying windows, and get alerts the moment prospects make tech stack changes
- Real-time churn & adoption alerts: instant notifications when target accounts adopt competitor tools, drop a technology, or show migration signals—delivered via email, Slack, webhooks, or CRM task creation
- Verified decision-maker contacts included: every technology profile includes deliverability-confirmed emails matched to decision-makers by role and department—no separate prospecting tool needed
- Enterprise-grade platform: bulk enrichment up to 100K domains, RESTful API, native CRM automation (Salesforce, HubSpot, Pipedrive), custom scoring models, and SOC 2 / GDPR / CCPA compliance
The combination of deep detection + real-time alerts + verified contacts in one platform is what makes it a revenue intelligence tool rather than just a tech lookup utility.
WhatRuns:
- Free browser extension for Firefox with ~400,000 users
- Real-time technology identification with notification system for tracking technology changes on target sites
- Daily updates adding 50–100 new detections
- Good lightweight option for quick spot-checks when you don't need list-building or API access
WhatCMS.org:
- CMS-focused detection specializing in identifying 1,540+ content management systems
- Useful for niche CMS identification where broader tools sometimes miss specialized platforms
- API available for integration into existing workflows
Additional notable providers: Cognism (EMEA-strong contact + tech data), TechDataPark (~90% accuracy, enterprise-focused), Klazify (API-first classification), Leadzen.ai (AI-powered profiling), Netcraft (infrastructure and security details), WPScan (WordPress-specific detection and vulnerability assessment).
Use Cases and Applications
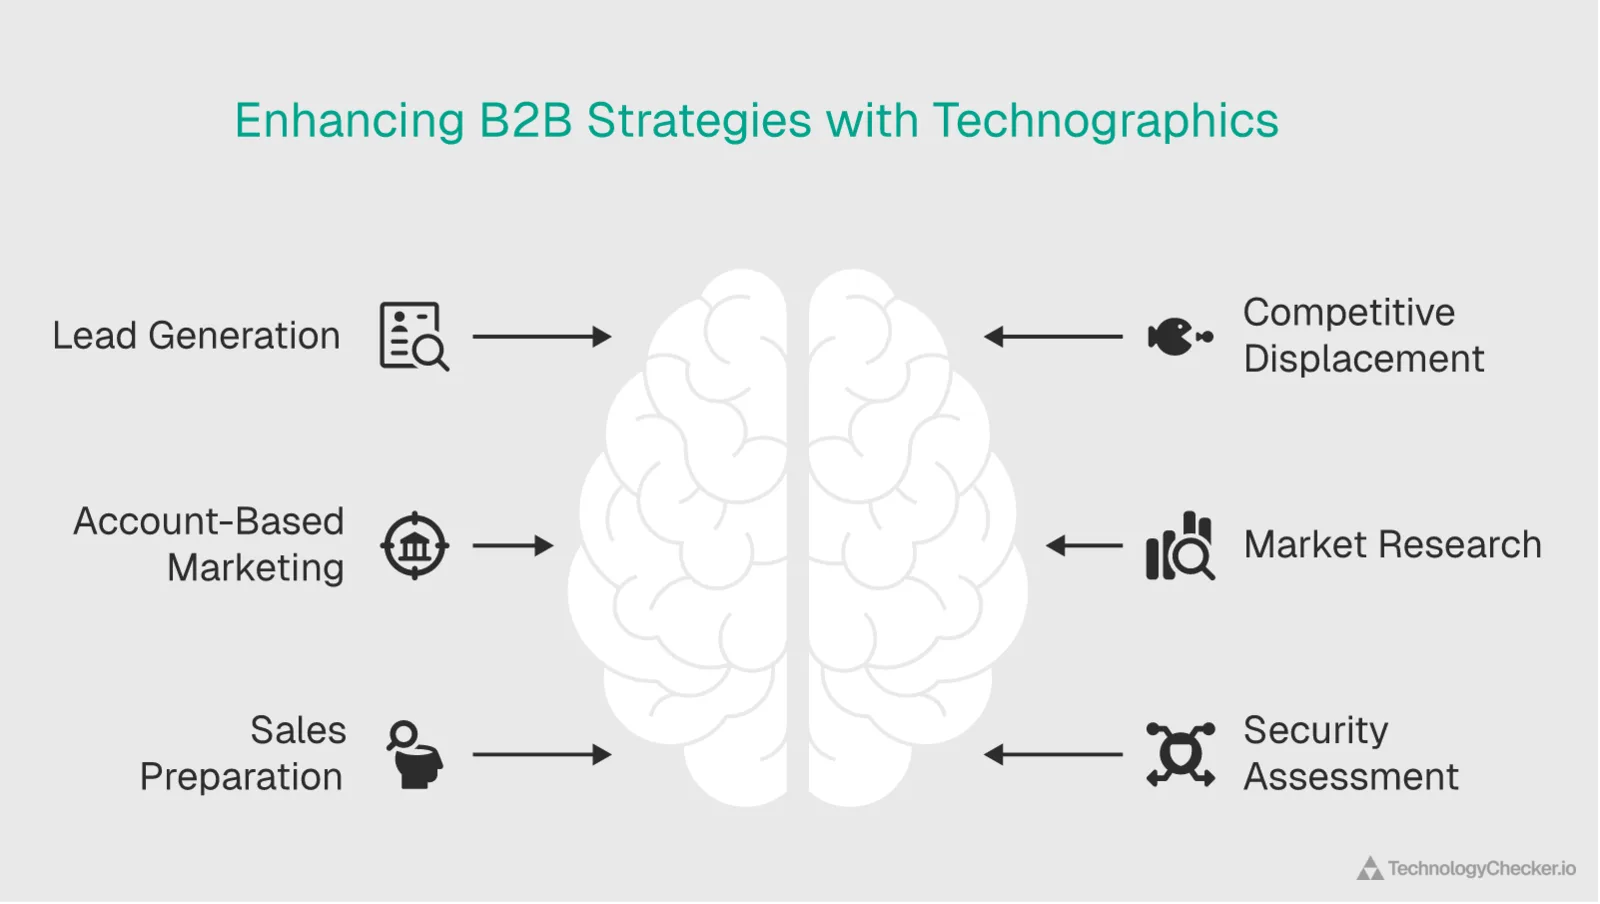
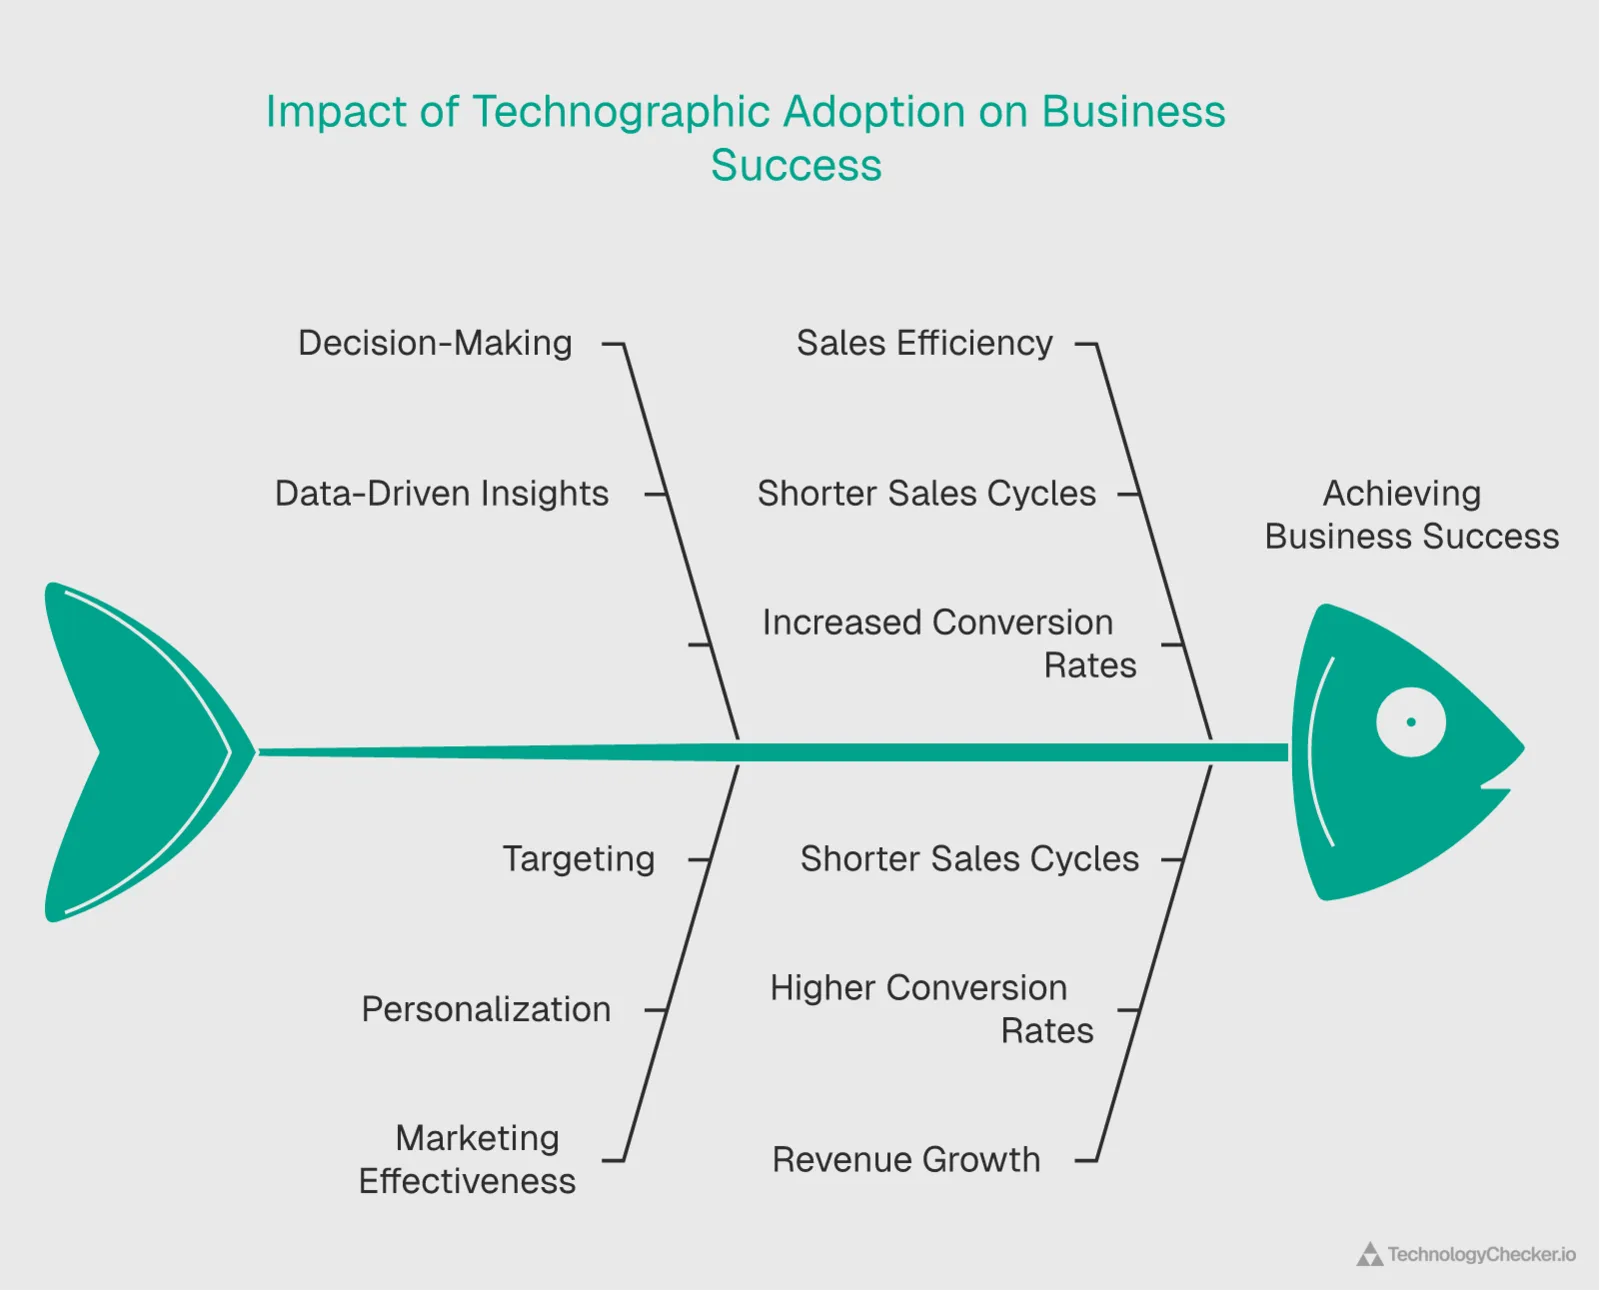
Research consistently shows that companies using technographic data are 50% more likely to exceed revenue goals, see 28% higher conversion rates in targeted campaigns, and experience 27% shorter sales cycles. Here's where that ROI materializes:
1. Lead Generation and Sales Prospecting
Technology lookup tools have become essential for technographic prospecting:
- Identify companies using specific technologies (e.g., all businesses using Salesforce + companies using Stripe)
- Build targeted lead lists based on technology adoption
- Prioritize prospects based on technology maturity and spending signals
- Enable personalized outreach based on known technology stack
Example: A SaaS company selling to e-commerce retailers can identify all Shopify stores using Klaviyo for email marketing, creating highly targeted prospect lists based on companies using Klaviyo we analyzed. 66% of B2B marketers already use this approach for targeting.
Full-stack example: With TechnologyChecker.io, I can go deeper—detecting when prospects adopt backend tools like n8n or standalone platforms like Airtable (signals they're building custom ops workflows). A frontend-only tool would just show "they use React." TechnologyChecker shows "they just adopted n8n + Airtable—here's the VP of Ops' verified email." That context is the difference between a cold email and a warm, relevant outreach.
2. Competitive Displacement
This is the highest-ROI play in my experience. 60% of B2B software purchases are replacements, not greenfield deals. Our own crawl backs the scale of that opportunity from the opposite direction: as the churn table earlier in this post shows, most technologies we track have been removed from more domains than they currently run on—New Relic alone has 1.74M lapsed domains sitting as an addressable list. Technology profiling enables sellers to:
- Identify accounts running a competitor's product and approaching likely renewal windows
- Spot signals of tech stack dissatisfaction (adding workaround tools, slow feature adoption)
- Monitor competitor technology changes in real-time with alerts
- Track market share trends by technology category for competitive takeout campaigns
Tools with full-stack detection (like TechnologyChecker) have an edge here: they can detect backend and infrastructure changes—like switching from a legacy database to a modern stack—that signal active evaluation windows. Combined with 20-year historical data, you can predict when similar companies typically make replacement decisions and time outreach accordingly.
3. Market Research and Analysis
- Measure technology adoption rates across industries
- Identify emerging technology trends before they hit mainstream
- Analyze regional technology preferences
- Benchmark against industry standards
- Size total addressable markets using historical trend data
4. Account-Based Marketing (ABM)
48% of B2B marketers report ABM is more effective when enriched with technographic data. Key applications:
- Enrich CRM data with technographic information
- Personalize marketing messages based on known tech stack (75% of B2B marketers use technographics for personalization)
- Identify technology migration opportunities—our marketing automation market share analysis shows how platform adoption maps to ABM targeting opportunities across 30M domains
- Score leads based on technology compatibility
5. Sales Preparation and Forecasting
- Tailor discovery questions and pitches based on a prospect's known stack (analytics, forms, chat, payments)
- Predict technology needs based on adoption patterns—99% of purchase decisions tie to digital transformation initiatives
- Cross-reference technographic data with intent signals for timing accuracy
6. Security Vulnerability Assessment
A growing use case I don't see discussed enough: technology detection for security posture analysis. The same data that powers sales prospecting can reveal vulnerabilities:
- Map detected technologies to CVE databases to identify sites running software with known vulnerabilities
- Detect outdated or end-of-support versions (e.g., PHP 7.x, jQuery 1.x) that signal security risk
- Support penetration testing reconnaissance and third-party risk assessment
- Tools like WapPassiveScan integrate Wappalyzer's API with CVE lookups for automated vulnerability screening
- OWASP ZAP integration enables automated security assessment based on detected stacks
For security teams, this use case has obvious direct value. For sales teams, it's also a powerful conversation starter: "I noticed your site is running [outdated technology]. Here's how our solution addresses that risk."
Technical Architecture and Detection Methods
How Technology Detection Works
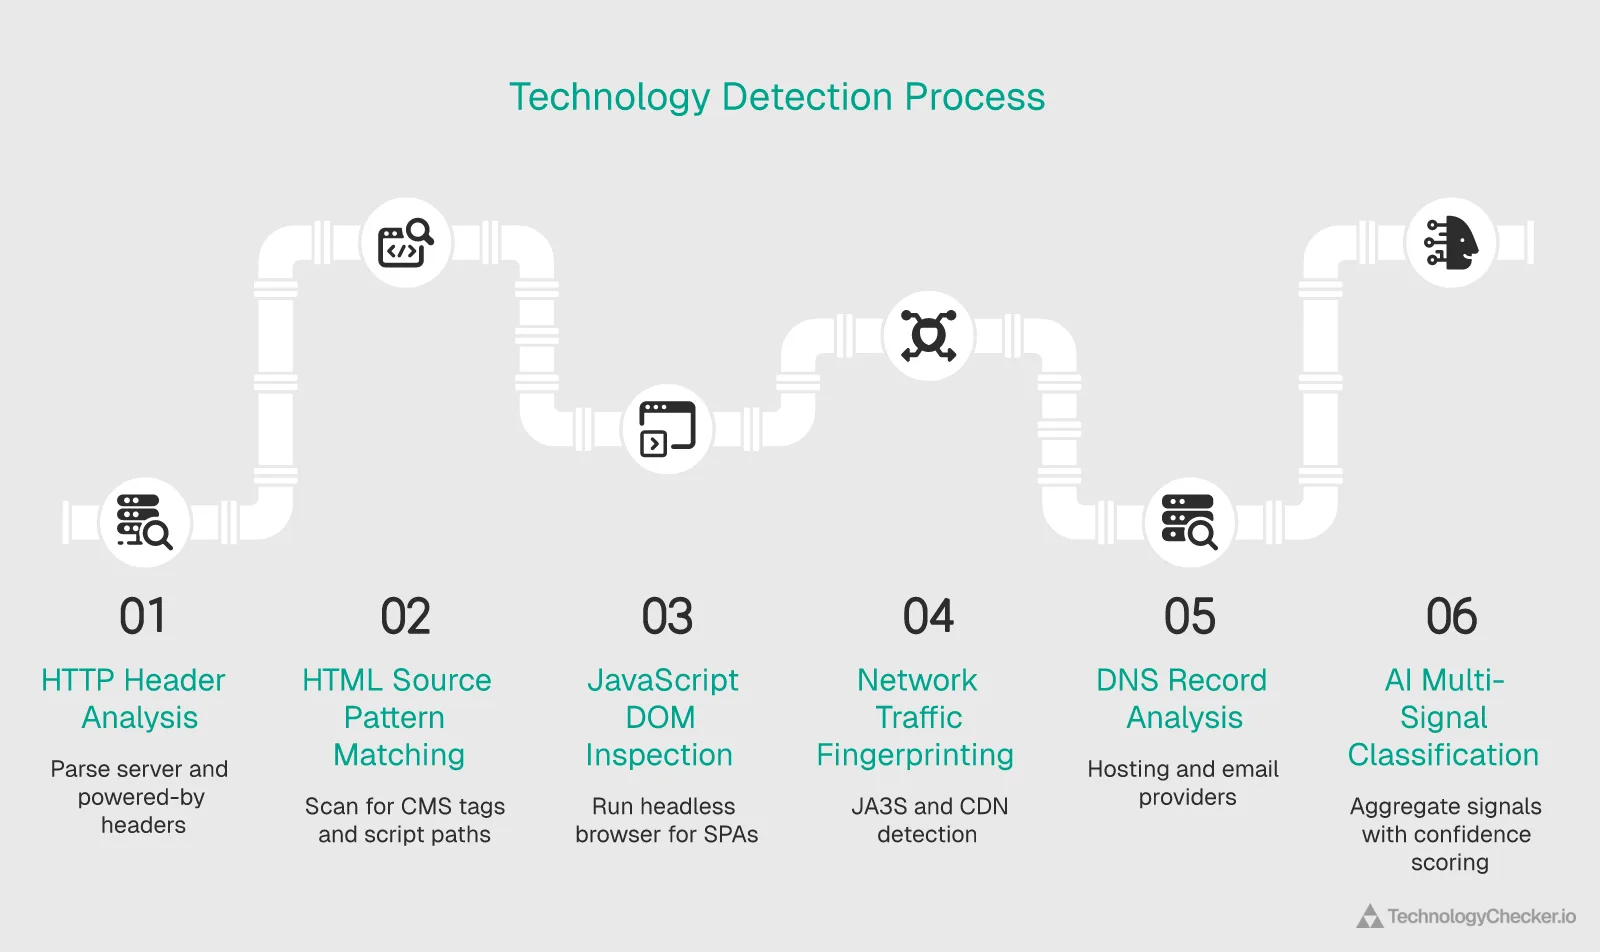
Website technology finders work by analyzing several layers of a website. The detection process has evolved from simple HTML inspection in the 1990s to sophisticated multi-signal analysis:
1. HTTP Response Header Analysis — The first and fastest signal. Tools parse headers like Server (e.g., "nginx/1.18.0"), X-Powered-By (e.g., "PHP/8.1.2"), cache headers, and Via headers revealing proxies/CDNs. Limitation: Security-conscious sites suppress these headers using ServerTokens and expose_php directives.
2. HTML Source & Script Pattern Matching — Regex-based scanning for telltale patterns: meta generator tags revealing CMS platforms, script src attributes pointing to known libraries (jQuery, React, Vue.js), CDN-specific domains and file paths, and CSS class names distinctive to specific frameworks (e.g., "wp-content" for WordPress). Limitation: Code minification and obfuscation reduce pattern reliability.
3. JavaScript Execution & DOM Inspection — Pages are loaded in browser-like environments (headless browsers) to inspect global variables (window.React, window.Vue), runtime DOM modifications, and post-render content. This is critical for detecting single-page applications (SPAs) where technologies only reveal themselves after JavaScript execution. Browser extensions like Wappalyzer use this approach in real time.
4. Network Traffic & Resource Fingerprinting — Advanced methods include JA3S fingerprinting (creating unique fingerprints from TLS Server Hello messages), resource URL analysis for CDN identification, and timing/ordering patterns of asset loads. Challenge: Privacy-preserving browsers and TLS extension randomization are complicating this approach.
5. DNS Record Analysis — DNS queries uncover hosting providers (AWS, Azure, GCP), CDN configurations (Cloudflare, Fastly), email providers (Google Workspace, Microsoft 365), and security services.
6. Combined Multi-Signal & AI Classification — Modern platforms aggregate signals across all methods above, applying confidence scoring (low to high certainty percentages) and machine learning to improve detection of obfuscated or custom implementations. AI-driven platforms already boost detection accuracy by 20%+ compared to single-method approaches.
Detection Capabilities
Modern technology lookup tools can identify:
- Content Management Systems (WordPress, Drupal, Joomla)
- E-commerce platforms (Shopify, Magento, WooCommerce)
- Analytics tools (Google Analytics, Mixpanel, Hotjar)
- Marketing automation platforms (HubSpot, Marketo, Pardot)
- Payment processors (companies using Stripe, companies using PayPal, Square)
- CDNs and hosting providers (Cloudflare, AWS, Azure)
- JavaScript frameworks (React, Vue.js, Angular)
- Development tools and libraries
- Security solutions (SSL certificates, WAFs)
- Advertising and tracking pixels
- AI/ML tools and chatbot platforms (emerging category)
Data Freshness and Accuracy
Wappalyzer's data is updated daily, ensuring only actively visited websites are included in technology lookups and lead lists. This real-time approach contrasts with some competitors who rely on periodic crawls, potentially resulting in outdated information.
Top providers achieve up to 90% accuracy on standard technology stacks, though challenges remain with:
- Headless CMS and API-first architectures
- Custom-built or heavily modified solutions
- Server-side technologies that leave fewer client-side footprints
Where Aggregate Statistics Come From
If you've ever wondered where the market share numbers I cited earlier actually originate, here are the primary data sources the industry relies on:
- BuiltWith — The largest dataset at 673M+ websites, with weekly trend reports dating back to January 1985. Crawls the internet similarly to search engines.
- W3Techs — Daily updated surveys of millions of websites, widely cited for CMS and web server market share data.
- HTTP Archive — Monthly crawl of approximately 17 million websites, providing raw data for researchers and analysts.
- Web Almanac — Aggregates HTTP Archive data into annual trend reports, offering deeper analysis of technology adoption patterns.
These sources use slightly different methodologies (exclusion of low-content pages, standardized crawl parameters, detection via publicly accessible signals), so numbers can vary between them. When I cite market share figures, I typically cross-reference at least two sources to confirm trends.
Integration Ecosystem
CRM and Sales Tools Integration
Technology lookup tools integrate with modern sales stacks:
- Salesforce: Automatic enrichment of lead and account records
- HubSpot: Technology stack data in contact properties
- Pipedrive: Technographic insights in deal records
- Zoho CRM: Technology profiling within workflows
- Microsoft Dynamics 365: Enterprise-grade technographic enrichment
Marketing Automation Platforms
- Zapier: No-code workflows connecting technographic data to 5,000+ apps
- Segment: Customer data platform integration
- Marketo: Webhook-based enrichment
- Braze: B2B lead management and profiling
Browser Extensions
Both major platforms offer Chrome extensions for on-the-go technology detection:
- Wappalyzer stands out for on-page UX and lead lists, while BuiltWith adds historical and market-share context that helps with planning
- Instant technology stack reveal while browsing
- One-click company and contact information access
- Real-time competitive intelligence gathering
Industry Challenges and Considerations
1. Data Privacy and Compliance
As data security and privacy have evolved into major issues in the software industry, with rising cyber threats and data breaches, technology lookup providers must:
- Ensure GDPR and CCPA compliance—especially critical for providers selling into EU markets
- Protect personally identifiable information (PII)
- Maintain ethical data collection practices
- Provide transparency in data sourcing
- Navigate evolving regulations as technographic data increasingly intersects with personal data
2. Detection Accuracy
Core challenges include:
- False positives from residual code snippets, generic patterns, or overly broad regex matching — a site may show traces of a technology it no longer actively uses
- False negatives from dynamic content (SPAs), backend-only technologies, emerging tools without established fingerprints, and heavily customized implementations
- Detecting headless CMS and API-first architectures (growing rapidly with the Jamstack movement) — decoupled frontends obscure the origin CMS entirely
- Identifying custom-built solutions that don't leave standard fingerprints
- Tracking proprietary technology stacks
- Keeping pace with emerging technologies—the average enterprise now uses 100+ applications, and the count is rising
Detection evasion is real. Security-conscious organizations actively minimize their technology footprint using techniques like:
- Removing or altering HTTP headers (ServerTokens, expose_php settings)
- JavaScript minification and obfuscation that eliminates library signatures
- Renaming standard library filenames to non-standard paths
- Custom builds that strip identifiable footprints
- CDN routing and header rewriting that mask origin servers
- Static site generators that produce files with no dynamic processing signatures
This is why the best tools use combined multi-signal approaches with confidence scoring — a single detection method is never enough.
3. Data Freshness vs. Scale
Balancing comprehensive coverage with real-time accuracy remains an ongoing challenge:
- Daily crawling of billions of websites requires massive infrastructure
- Manual verification needed for complex enterprise stacks (SalesIntel's human-verified approach addresses this)
- Trade-offs between depth and breadth of coverage
- AI is helping close the freshness gap, but the infrastructure investment is significant
4. Technology Evolution & Modern Architecture Challenges
Technology lookup tools must continuously adapt to:
- Serverless and edge computing architectures
- Quantum computing early adopters
- WebAssembly and new runtime environments
- AI-native application architectures
- Privacy-first tooling that minimizes detectable footprints
The Jamstack/headless/edge challenge deserves special attention. Modern web architecture is actively working against traditional detection methods:
- Jamstack & Headless CMS: Decoupled frontend/backend means the origin CMS (Contentful, Strapi, Sanity) is invisible from the client side. The frontend might be a generic React or Next.js app with zero CMS fingerprints.
- Static site generators (Hugo, Eleventy, Astro): Pre-built HTML files served via CDN eliminate per-request processing signatures entirely.
- Edge computing & serverless (Cloudflare Workers, AWS Lambda@Edge, Vercel Edge Functions): Distributed execution at the edge masks origin server characteristics and traditional hosting footprints.
- Dynamic client-side rendering: SPAs and frameworks like React/Vue load the actual application after the initial HTML response, meaning server-side crawlers see an empty shell.
The industry is adapting with JavaScript execution environments for detection, API endpoint monitoring, full page rendering to capture post-processing technologies, and browser-like DOM inspection. But these methods are significantly more expensive to run at scale than simple header/HTML scanning—which is why tools that invest in multi-signal detection (like BuiltWith's massive crawl infrastructure or TechnologyChecker's full-stack approach) have a structural advantage.
Pricing Models and Market Segments
Freemium Strategies
Many providers offer free tiers to drive adoption:
- Wappalyzer: 50 free lookups per month for casual users
- WhatRuns: Completely free browser extension
- Snov.io: Free technology checker for basic needs
- Enricher.io: Free spot-check tool with follow functionality
Mid-Market Solutions
Typical pricing ranges from $99-$499/month:
- Limited technology lookups per month
- Basic list building capabilities
- Standard API access
- Email support
Enterprise Offerings
Starting at $299-$2,000+/month:
- Unlimited technology lookups
- Advanced filtering and segmentation
- Custom API rate limits
- Dedicated account management
- Historical data access
- White-label options
- AI-powered insights and predictions (Demandbase, HG Insights)
Future Outlook: 2025–2030

Emerging Trends
1. AI-Powered and Agentic Technographic Intelligence
AI is widely applicable, with use cases in every industry and business function, and it is scaling rapidly across the business landscape. With companies spending $37 billion on generative AI in 2025 and 92% planning budget increases, the investment is real. Future technology lookup tools will leverage AI for:
- Predictive technology adoption modeling based on historical patterns across millions of domains
- Automated technology recommendation engines ("companies like yours typically adopt X next")
- Natural language queries for technographic data ("show me all Shopify stores in Germany that added Klaviyo this quarter")
- Sentiment analysis on technology choices (combining review data with adoption signals)
- Real-time classification improvements (AI-driven platforms already boost conversions by 20%+)
- Agentic AI workflows — in 2026, AI is evolving toward autonomous agents capable of independently monitoring competitor stacks, generating prospect lists, and triggering outreach sequences without human intervention. This is the next frontier for technographic platforms.
2. Platform Consolidation
The market is moving toward consolidation, with larger sales intelligence platforms acquiring technographic capabilities. SimilarTech's acquisition by Similarweb is a bellwether. I expect 2–3 major acquisitions in the next 18 months as ABM, intent, and technographic data merge into unified GTM platforms.
3. Quantum Computing Detection
By 2025, quantum computing is expected to produce revenue of $2 billion, making it an indispensable fixture within top software development technology trends. Technology profiling tools will need capabilities to:
- Identify quantum computing implementations
- Track quantum-classical hybrid systems
- Monitor quantum-ready frameworks
4. Sustainability Metrics
63% of FinOps teams already manage AI/GPU spend; the new ISO/IEC 21031 standard puts Software Carbon Intensity (SCI) on every CFO's radar. Next-generation technology lookup tools may include:
- Carbon footprint assessment of technology stacks
- Green hosting provider identification
- Energy efficiency ratings for detected technologies
- Sustainability compliance tracking
5. Security and Compliance Intelligence
Integration with security posture analysis is accelerating:
- Vulnerability detection in identified technologies
- Compliance framework compatibility
- Security certificate monitoring
- Third-party risk assessment
6. Backend & Non-Web Technology Detection
One of the most significant emerging frontiers: detection is expanding beyond web-facing technologies to include CRMs, ERPs, AI/ML products, and internal SaaS tools that leave no client-side footprint. This requires entirely new signal sources—API endpoint monitoring, email header analysis, job posting parsing, and integration marketplace data. It also includes verification of active integrations vs. residual code — distinguishing between a technology that's actively in use and one whose code remnants are simply still on the page. Platforms that can bridge this gap between "what's on the website" and "what the company actually runs internally" will unlock the highest-value prospecting use cases.
Strategic Recommendations for Businesses
For Sales Teams
- Implement technographic prospecting to identify ideal customer profiles based on technology usage—companies doing this are 50% more likely to exceed revenue goals
- Prioritize competitive displacement campaigns—60% of B2B software purchases are replacements; use technographic data to time outreach near renewal windows
- Personalize outreach using insights from known technology stacks—this drives 28% higher conversion rates
- Prioritize accounts showing signs of technology migration or expansion
For Marketing Teams
- Segment audiences by technology adoption for targeted campaigns—66% of B2B marketers already do this
- Create technology-specific content addressing pain points of specific stacks
- Optimize ABM strategies with technographic enrichment—48% of marketers report higher ABM effectiveness with technographic data
- Track market trends to inform product positioning and messaging
For Product Teams
- Identify integration opportunities based on common technology combinations
- Monitor competitive feature sets through technology stack analysis
- Validate market demand for new features by tracking technology adoption
- Prioritize compatibility with popular technology stacks
For Investors and Analysts
- Assess market positioning through technology adoption metrics
- Validate growth narratives with real-time technology usage data
- Conduct due diligence on technology dependencies and partnerships
- Track innovation through emerging technology adoption patterns
- Size markets using historical technographic trends for TAM analysis
Conclusion
The technology lookup software industry sits at the intersection of several powerful trends: cloud-first computing, rising regulatory requirements, AI proliferation, and increasing cost/carbon consciousness. As precision in understanding tech stacks becomes non-negotiable with mobile devices driving 54.67% of website traffic and users abandoning slow-loading sites, these tools transition from nice-to-have to must-have status.
AI's reach is broader than any recent tech wave, reshaping business strategy, politics, trade, defense, and even social justice. Technology lookup software providers that successfully integrate AI capabilities, maintain data accuracy, and provide actionable intelligence will capture disproportionate value in this evolving landscape.
Key Takeaways
-
Market Growth: The technographics segment grew from ~$367M to ~$1.17B (2020–2025) at 26.1% CAGR—2–3× the broader software market growth rate
-
Essential for GTM: Over 80% of businesses use technographic data in decision-making; 90% view it as essential for marketing
-
Proven ROI: 50% more likely to exceed revenue goals, 28% higher conversions, 27% shorter sales cycles
-
March 2026 landscape: WordPress holds 59.9% CMS market share; Nginx leads web servers at 32.8% (up from 3.9% in 2010); Google Analytics dominates 78.7% of analytics users; jQuery persists on 88.6% of monitored JS sites while React grows at 7.8%. Shopify powers 6.9M+ live stores.
-
AI Integration: $37B spent on gen AI in 2025 (3.2× YoY); 78% of orgs use AI; 84% of developers use AI coding tools; AI-driven platforms boost conversions by 20%+. Agentic AI is the next frontier for autonomous prospecting.
-
Sales Intelligence Boom: The broader sales intelligence market will grow from $4.13B to $11.41B by 2035; account intelligence platforms from $2.1B to $4.8B by 2029. Technographics is the fastest-growing subsegment.
-
SaaS Complexity: Organizations average 106 SaaS apps each; 95% will adopt AI-powered SaaS; B2B SaaS market projected at $1.58T by 2031. More apps = more signals = more demand for tech profiling.
-
Detection is getting harder: Jamstack, headless CMS, edge computing, and static site generators are reducing traditional fingerprints. Multi-signal detection with confidence scoring is becoming table stakes.
-
Consolidation Ahead: The market will see consolidation as larger sales intelligence platforms acquire technographic capabilities
-
Evolution Required: Providers must adapt to cloud-native ($912B market), edge computing, headless architectures, agentic AI, backend/non-web detection, and AI-first application stacks
As businesses continue to digitize and technology stacks grow more complex—with the average enterprise now running 100+ applications and 86% planning to adopt more digital platforms—the demand for sophisticated technology lookup and profiling tools will only intensify. The winners in this space will be those who combine comprehensive coverage, accurate detection, real-time updates, and actionable insights—all while maintaining ethical data practices and regulatory compliance. You can explore 40,000+ tracked technologies on our platform, or learn more about TechnologyChecker and the team behind this research.
Additional Resources
Industry Reports and Sources
- Precedence Research — Software Market Report
- Precedence Research — Cloud Computing Market
- Gartner — IT Spending Forecast 2026
- Forrester — Global Tech Forecast 2025–2030
- McKinsey — The Top Trends in Tech
- Bain Technology Report 2025
- Deloitte — 2026 Software Industry Outlook
- Microsoft — Global AI Adoption in 2025
- Menlo Ventures — State of Generative AI in the Enterprise
- Microsoft — 7 AI Trends to Watch in 2026
- iTransition — Software Development Statistics 2026
- Keyhole Software — 2026 Market Size & Developer Trends
- Research Nester — Sales Intelligence Market 2035
- Mordor Intelligence — B2B SaaS Market
- Landbase — Technographic Coverage Statistics
- Datamaticsbpm — Guide on Technographic Data
- RPTechMedia — The Complete Guide to Technographic Data
- NetCorp — AI-Generated Code Statistics 2026
- Grokipedia — Website Technology Detection (March 2026 market share data)
Aggregate Data Sources
- BuiltWith Trends — 673M+ websites, weekly trend reports dating to 1985
- W3Techs — Daily updated web technology surveys
- HTTP Archive — Monthly crawl of ~17M websites
- Web Almanac — Annual trend reports aggregating HTTP Archive data
Tools to Explore
- Wappalyzer — Lead lists, change alerts, daily updates
- BuiltWith — Historical trends, deep filters, market sizing
- Demandbase — Enterprise ABM + technographics
- HG Insights — TAM analysis, enterprise scale
- SalesIntel — Verified contacts + tech data
- Datanyze — Contact + tech profiling
- SimilarTech — Traffic + adoption trends
- Leadzen.ai — AI-powered profiling
- WhatRuns — Free browser extension, ~400K users
- WhatCMS.org — CMS-focused detection, 1,540+ systems
- Netcraft — Infrastructure and security intelligence
- TechnologyChecker.io — 20-year historical data + verified contacts
Mehmet Suleyman
CEO & Co-founder

