Marketing Technology Statistics: 30 Key MarTech Trends and Data Points for 2026
30 marketing technology statistics — market size, AI adoption, automation, CDP growth — cross-checked against our own detection data on 50M+ domains and live AI-crawler traffic.
Published •Updated •33 min read

The martech market hit $859 billion in 2025. It's heading past $1 trillion by 2026. There are now 15,384 solutions on the market, up from just 150 in 2011. AI agents and autonomous workflows rank as the #1 expected impact area, cited by 27% of marketers. We pulled 30 data points from the latest Statista marketing technology dossier and cross-checked them against what we see across our own crawl data at TechnologyChecker.io, covering market size, platform adoption, AI integration, automation growth, SaaS spending, and CDP expansion.
Key findings:
- The global MarTech market hit $859 billion in 2025 and is projected to reach $1.03 trillion by 2026. — Source: LXA
- 15,384 martech solutions are now available, up from 150 in 2011 — a 100x increase in 14 years. — Source: Chief Martec / MartechTribe
- CRM leads platform deployment at 72%, ahead of digital advertising (61%) and data management platforms (54%). — Source: Clevertouch
- HubSpot dominates marketing automation with 34.72% market share. — Source: Datanyze
- The marketing automation market grew from $7.31 billion (2023) to a projected $21.7 billion by 2032. — Source: Polaris Market Research
- AI agents and autonomous workflows are the #1 expected marketing impact area, cited by 27% of marketers (see our ChatGPT statistics 2026 for the underlying consumer-AI adoption curve). — Source: Marketing AI Institute / SmarterX
- CDP industry revenue reached $2.6 billion with 208 vendors as of June 2025. — Source: CDP Institute
- 82% of marketers want AI to reduce repetitive tasks — the top desired outcome across all AI use cases. — Source: Marketing AI Institute / SmarterX
- In our own crawl, Segment leads the CDP field with 20,459 live domains (Rudderstack 11,723, LiveRamp 5,414) — no single vendor dominates, confirming a fragmented 208-vendor market. — Source: TechnologyChecker.io detection data, July 2025 crawl
- AI "agents" aren't just expected — they're already crawling the web: Googlebot (27.49%), ClaudeBot (13.87%, now the #2 AI bot), Meta-ExternalAgent (12.70%) and GPTBot (10.23%) lead AI bot traffic, yet only 9% of AI crawling is for live search vs 45% for model training. — Source: Cloudflare Radar, Q2 2026
MarTech market overview
This is one of the fastest-growing segments in enterprise tech. Total revenue more than tripled in five years, jumping from $345 billion in 2021 to $859 billion in 2025. We track over 50 million domains monthly at TechnologyChecker.io, and we've watched the martech footprint expand in real time. The vendor count exploded even faster than the revenue line.
Market size and revenue growth
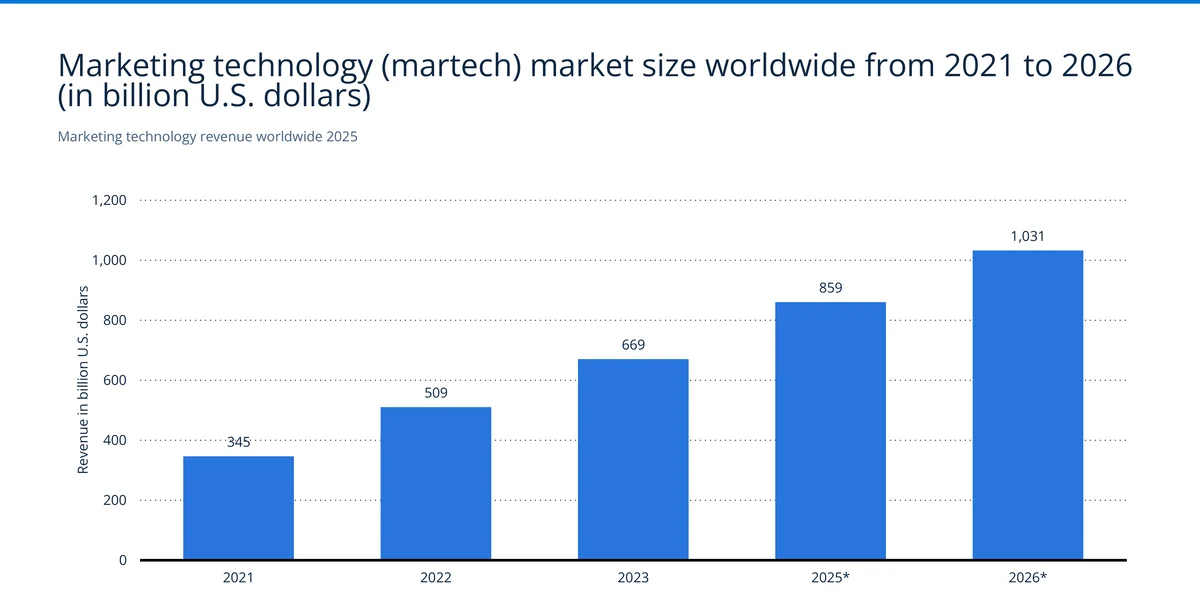
$345 billion in 2021. $509 billion in 2022. $669 billion in 2023. $859 billion in 2025. By 2026, projections put the market at $1.03 trillion, crossing that threshold for the first time. That works out to roughly 25% compound annual growth, driven mostly by enterprise AI adoption and data platform spending. The total addressable AI market sits much higher — see our AI market size statistics 2026 forecast to $1.67T by 2031.
The trillion-dollar number isn't an outlier. Each year has added $150-190 billion in new revenue, and the trajectory hasn't wavered. For context, the entire global advertising market was worth about $1 trillion in 2024. Martech spending is converging with ad spend itself, and the fastest-growing slice of that ad spend is social media advertising, on track to pass $480 billion by 2030.
The explosion in MarTech solutions
The MarTech Explosion: 150 Solutions in 2011 to 15,384 in 2025
The marketing technology landscape grew from just 150 solutions in 2011 to 15,384 in 2025 — a 100x increase in 14 years. Growth accelerated sharply after 2022, with nearly 4,300 new tools added between 2023 and 2025 alone, most of them AI-native point solutions.
Source: Chief Martec / MartechTribe · 2011-2025
| Year | Number of solutions |
|---|---|
| 2011 | 150 |
| 2012 | 350 |
| 2014 | 947 |
| 2015 | 1876 |
| 2016 | 3874 |
| 2017 | 5381 |
| 2018 | 6829 |
| 2019 | 7040 |
| 2020 | 8000 |
| 2022 | 9932 |
| 2023 | 11038 |
| 2024 | 14106 |
| 2025 | 15384 |
- 15,384 martech solutions in 2025, up from 150 in 2011 — a 100x increase
- Nearly 4,300 new tools added in just two years (2023-2025)
- Crossed 5,000 in 2017 and 8,000 by 2020 before the AI-driven surge
150 solutions in 2011. 15,384 in 2025. A 100x increase in 14 years. The growth wasn't linear either. The count crossed 1,876 by 2015, broke 5,000 in 2017, and hit 8,000 by 2020.
What's striking is the 2023-2025 acceleration. Nearly 4,300 new tools appeared in just two years, jumping from 11,038 to 15,384. We've noticed the same thing in our crawl data: most of the new signatures we're detecting are AI-native point solutions, things like content generators, predictive scoring tools, and customer data orchestration platforms that didn't exist 18 months ago.
M&A activity in MarTech
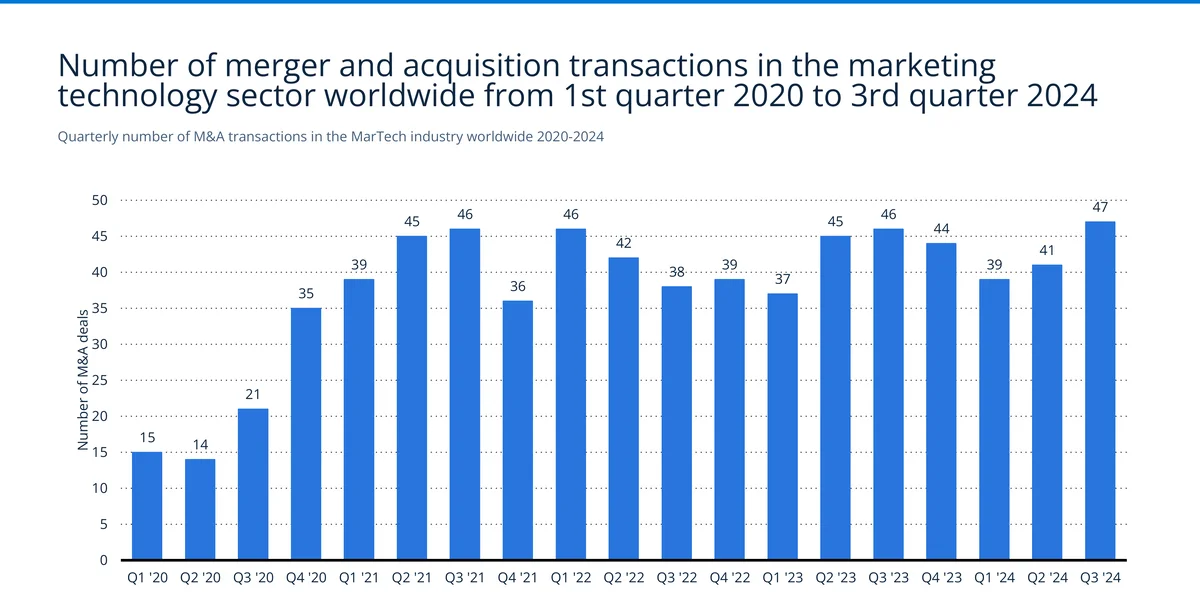
Deal volume cratered in early 2020 (15 deals in Q1, 14 in Q2), but recovered fast. By Q2 2021 it hit 45 deals per quarter and has stayed in the 37-47 range since. Q3 2024 hit 47, the highest in the dataset.
This is a consolidation market now. Salesforce, Adobe, and HubSpot keep acquiring specialized tools to fill suite gaps. Private equity firms are snapping up mid-market martech companies with predictable recurring revenue. We see the effects of these acquisitions in our technology profiles: a tool gets acquired, its tracking pixel gets replaced by the parent company's tag, and within 6-12 months the standalone detection signature fades from our data.
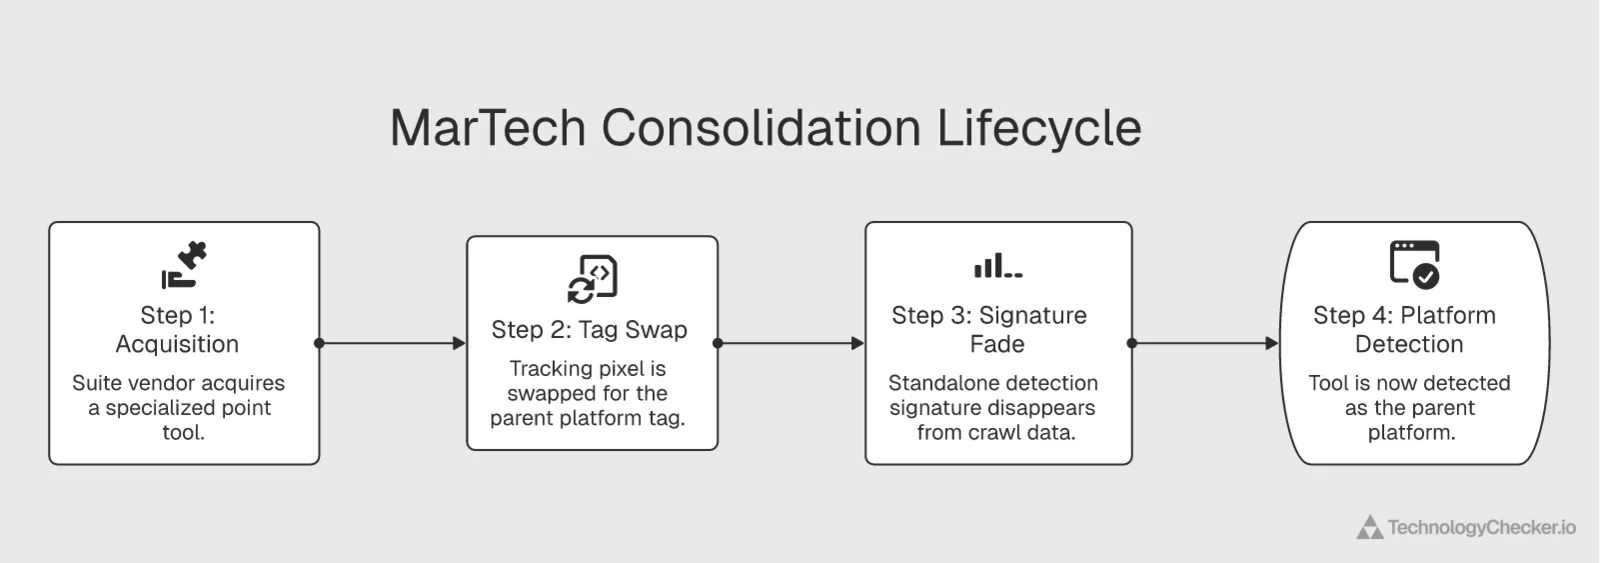
That pixel-swap is why headline M&A counts understate real consolidation. By the time a deal closes, the acquired tool may still appear on the landscape graphic, but in our crawl it has already been absorbed into the buyer's footprint.
Marketing analytics market share
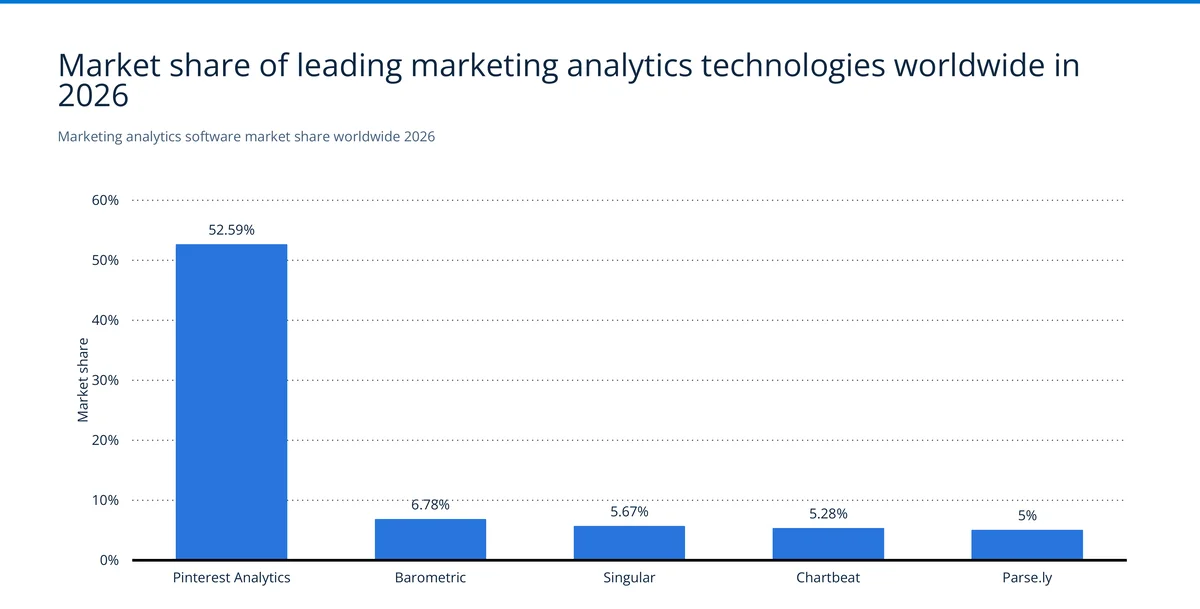
Pinterest Analytics holds 52.59% of this market according to Datanyze. Barometric sits at 6.78%, Singular at 5.67%, Chartbeat at 5.28%, and Parse.ly at 5%.
But this number needs context. Pinterest's "dominance" is an artifact of how market share gets measured here. Every Pinterest business account gets analytics automatically, so it inflates adoption numbers relative to standalone tools that require a separate purchase. The real competition for marketing analytics budgets is happening in the other 47% of the market, where teams are making active buying decisions.
How teams actually use MarTech
Raw market numbers only tell part of the story. This section digs into what practitioners report about their stacks, budgets, and priorities, based on CMO-level and team-level survey data.
Platform deployment by category
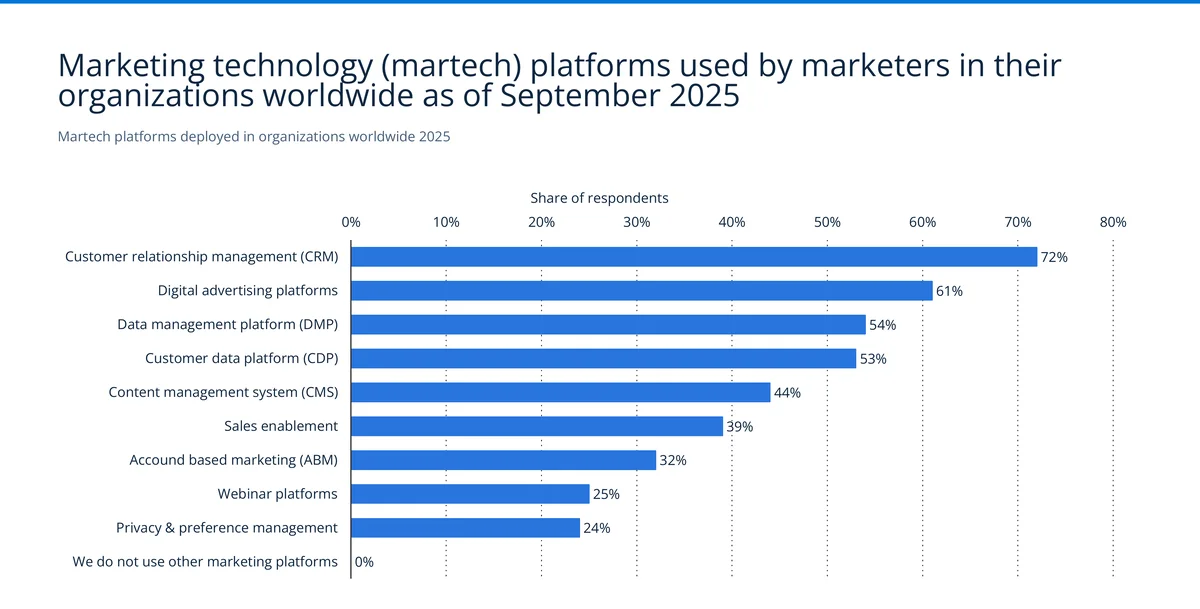
CRM is everywhere. 72% deployment. This confirms what we see in our technology profiles: CRM adoption is near-universal among companies with any marketing stack at all. Digital advertising tools follow at 61%, DMPs at 54%, CDPs at 53%, and CMS at 44%. ABM (32%), webinar tools (25%), and privacy platforms (24%) sit at the lower end.
The 53% CDP adoption rate is the number that jumped out at us. Five years ago, CDPs were an enterprise-only niche. From our detection data, we've watched CDP signatures spread from large enterprise sites to mid-market companies over the past 18 months. The third-party cookie phase-out is clearly accelerating first-party data investment. Sales enablement at 39% also caught our attention, pointing to tighter integration between marketing and sales tech stacks.
One honest caveat from our side of the data: this 72% CRM number is self-reported, and CRMs are mostly backend systems that leave few traces on a public homepage. In our July 2025 crawl, the most-detected web-facing CRM signatures were Salesforce (27,442 active domains), Bitrix24 (17,401), and Zoho CRM (4,415) — a fraction of true deployment, because the bulk of CRM activity happens server-side where our crawler can't see it. Email and CDP tools, which inject client-side tags, are far easier for us to count. It's a useful reminder that survey adoption and web-detectable adoption measure different things.
Marketing budget distribution
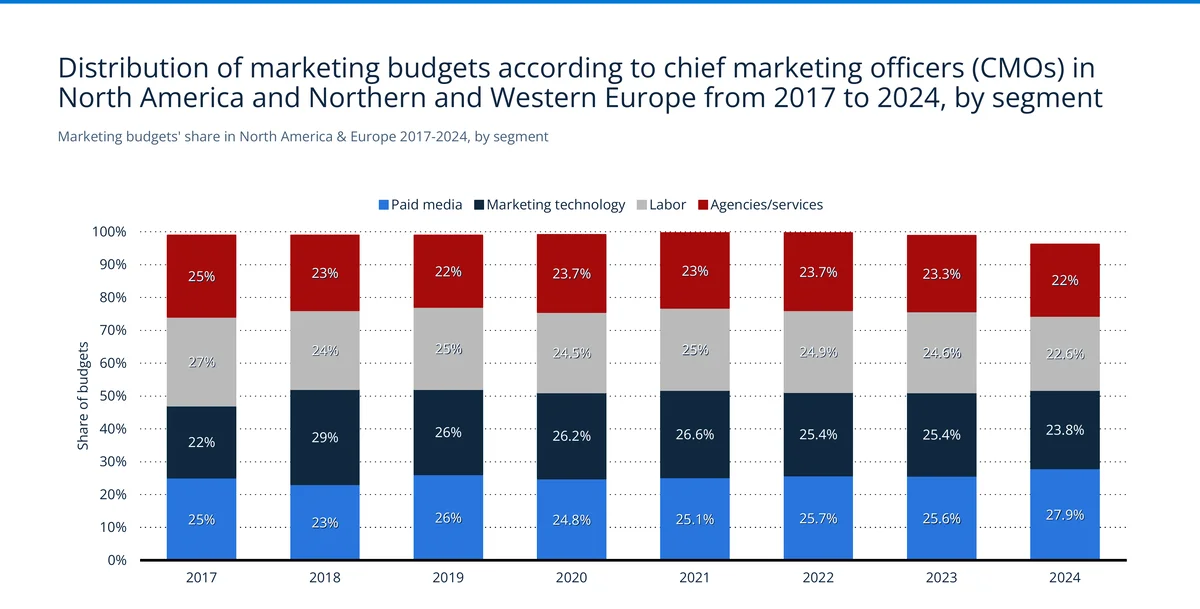
Four buckets in 2024: paid media at 27.9%, martech at 23.8%, labor at 22.6%, agencies at 22%. The martech share crept up from 22% in 2017, while paid media actually dipped for several years before rebounding.
The gap between martech and paid media is narrowing. This makes sense. As advertising becomes more programmatic and platform-driven, the line between "media spend" and "tech spend" keeps blurring. When a company puts nearly a quarter of its marketing budget into technology, they're making a bet on owning their data and automation capabilities rather than renting them.
MarTech responsibilities by seniority
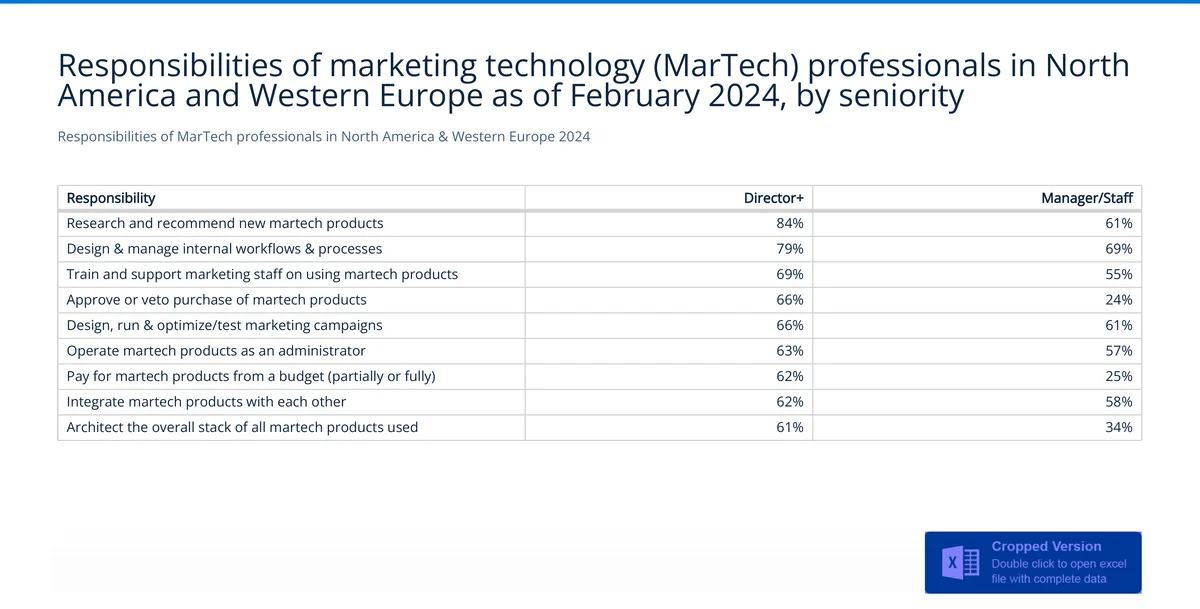
The biggest gap by seniority? Purchasing authority. 66% of director-level professionals can approve or veto technology buys, versus just 24% of managers and staff. That's a 42-point gap.
| Responsibility | Director+ | Manager / Staff |
|---|---|---|
| Research & recommend new tools | 84% | 61% |
| Design workflows & processes | 79% | 69% |
| Train staff on platforms | 69% | 55% |
| Approve / veto purchase decisions | 66% | 24% |
Research duties show a 23-point gap (84% vs. 61%), which means senior leaders hold outsized influence over the discovery phase too. Workflow design is the most evenly split task (79% vs. 69%), suggesting hands-on process work spans all levels.
CMO skills priorities for 2025
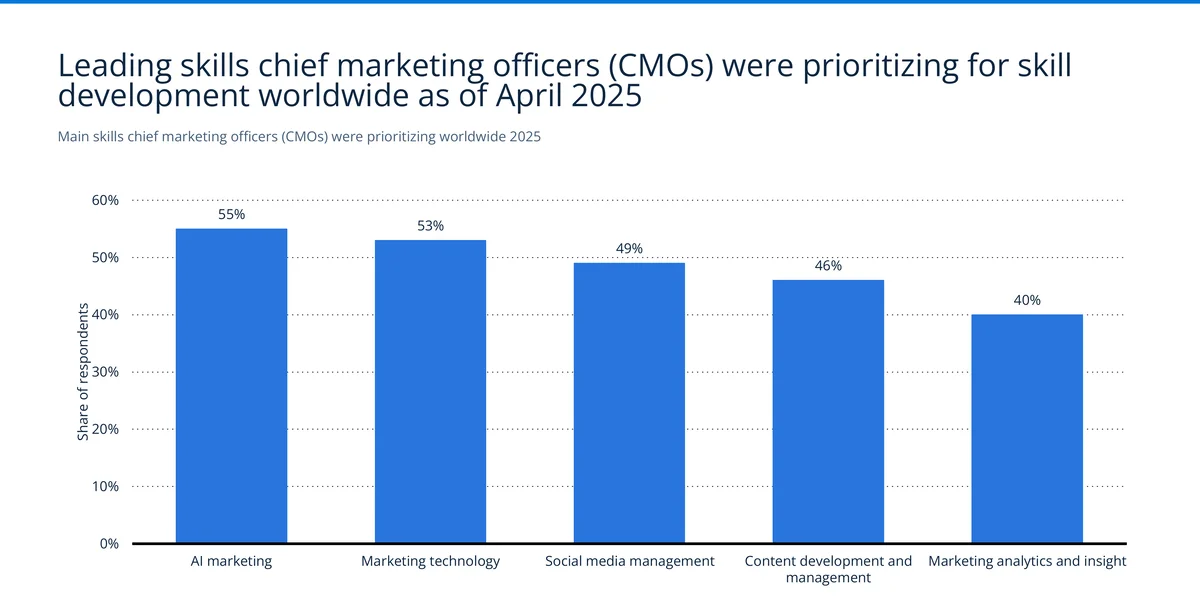
AI marketing tops CMO upskilling priorities at 55%. MarTech expertise is close behind at 53%, then social media management (49%), content skills (46%), and analytics (40%). Social media management at 49% reflects the growing complexity of multi-platform integration — over 31,000 companies using Instagram, for example, feature Instagram on their own websites.
Two years ago, "AI marketing" wouldn't have made this list at all. Now it's #1, ahead of traditional competencies like content and analytics. CMOs aren't just expected to understand AI anymore. They're expected to evaluate tools, roll them out, and govern how their teams use them. That's a different job description than the one most CMOs signed up for.
MarTech perception among stakeholders
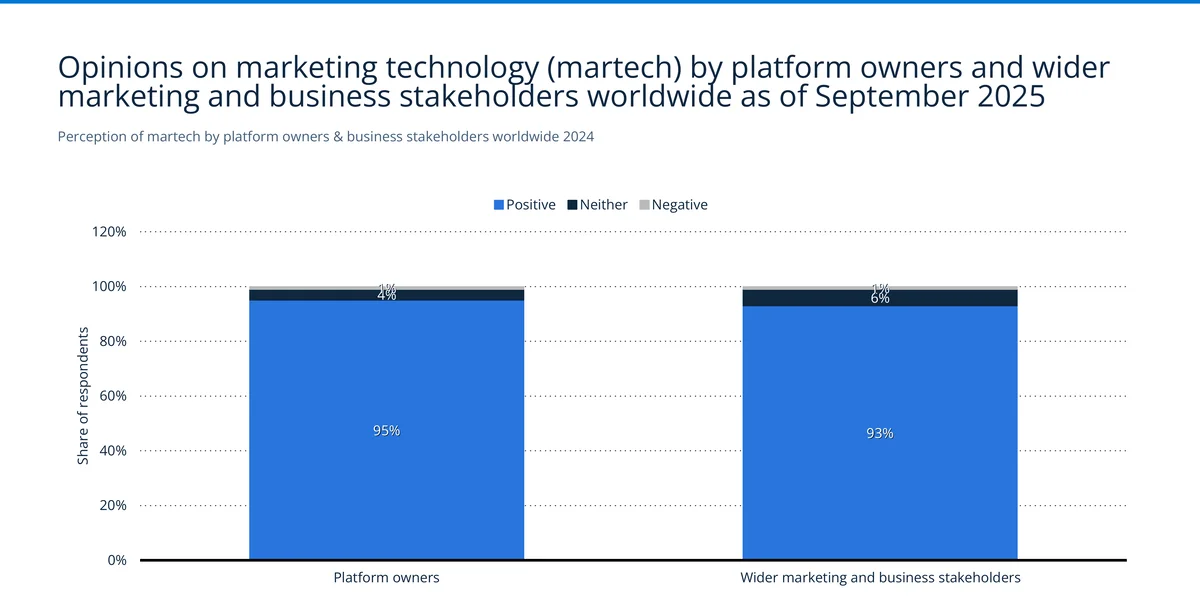
95% of platform owners rate their martech positively. Only 1% are negative. Wider stakeholders, the people who use the tools but don't manage them, come in at 93% positive.
That tiny gap is interesting. It suggests modern martech platforms have gotten good enough at UX that even non-technical users find real value. Negative sentiment is basically a rounding error at 1% for both groups. We don't often see satisfaction numbers this high for enterprise software.
Organizational priorities for MarTech stacks
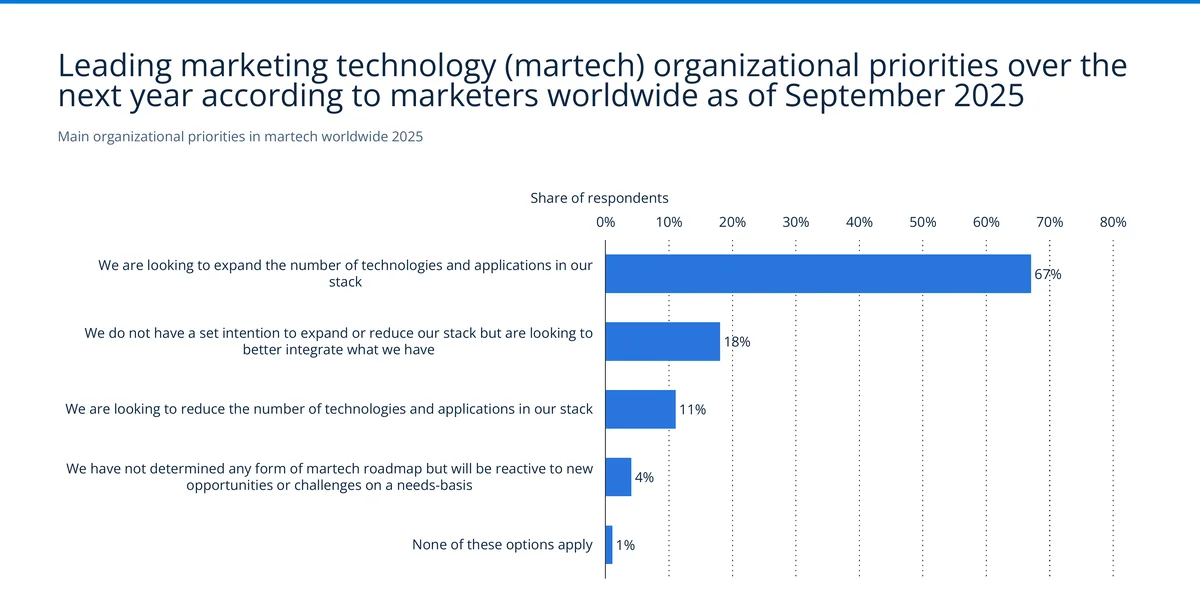
Two-thirds of organizations (67%) want to expand their martech stack. Only 11% plan to reduce it. Integration is second priority at 18%, with 4% taking a reactive approach and 1% having no plans at all.
That 67% expansion number lines up with the vendor growth data we looked at earlier. But the 18% focused on integration tells a different story: tool sprawl creates data silos, and the smarter teams know it. The organizations we see doing best in our data are doing both, adding new tools while investing in CDPs, iPaaS platforms, and composable architectures to keep everything connected.
Top challenges facing CMOs
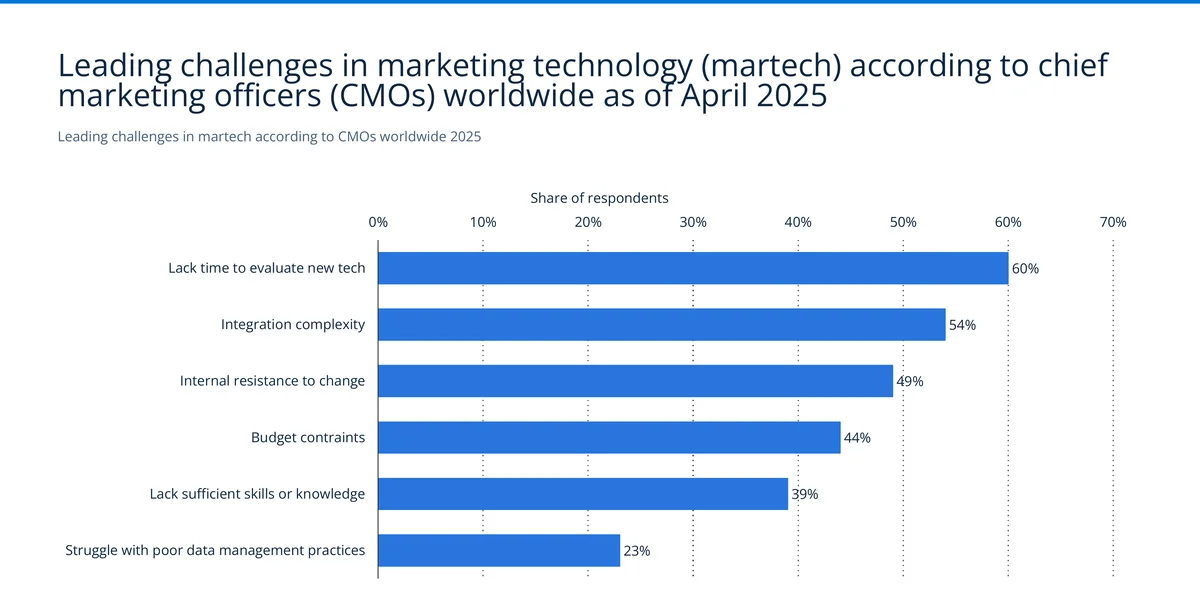
The #1 CMO challenge is simply time. 60% say they can't properly evaluate new technology. Integration complexity comes next at 54%, then internal resistance (49%), budget constraints (44%), skills gaps (39%), and poor data management (23%).
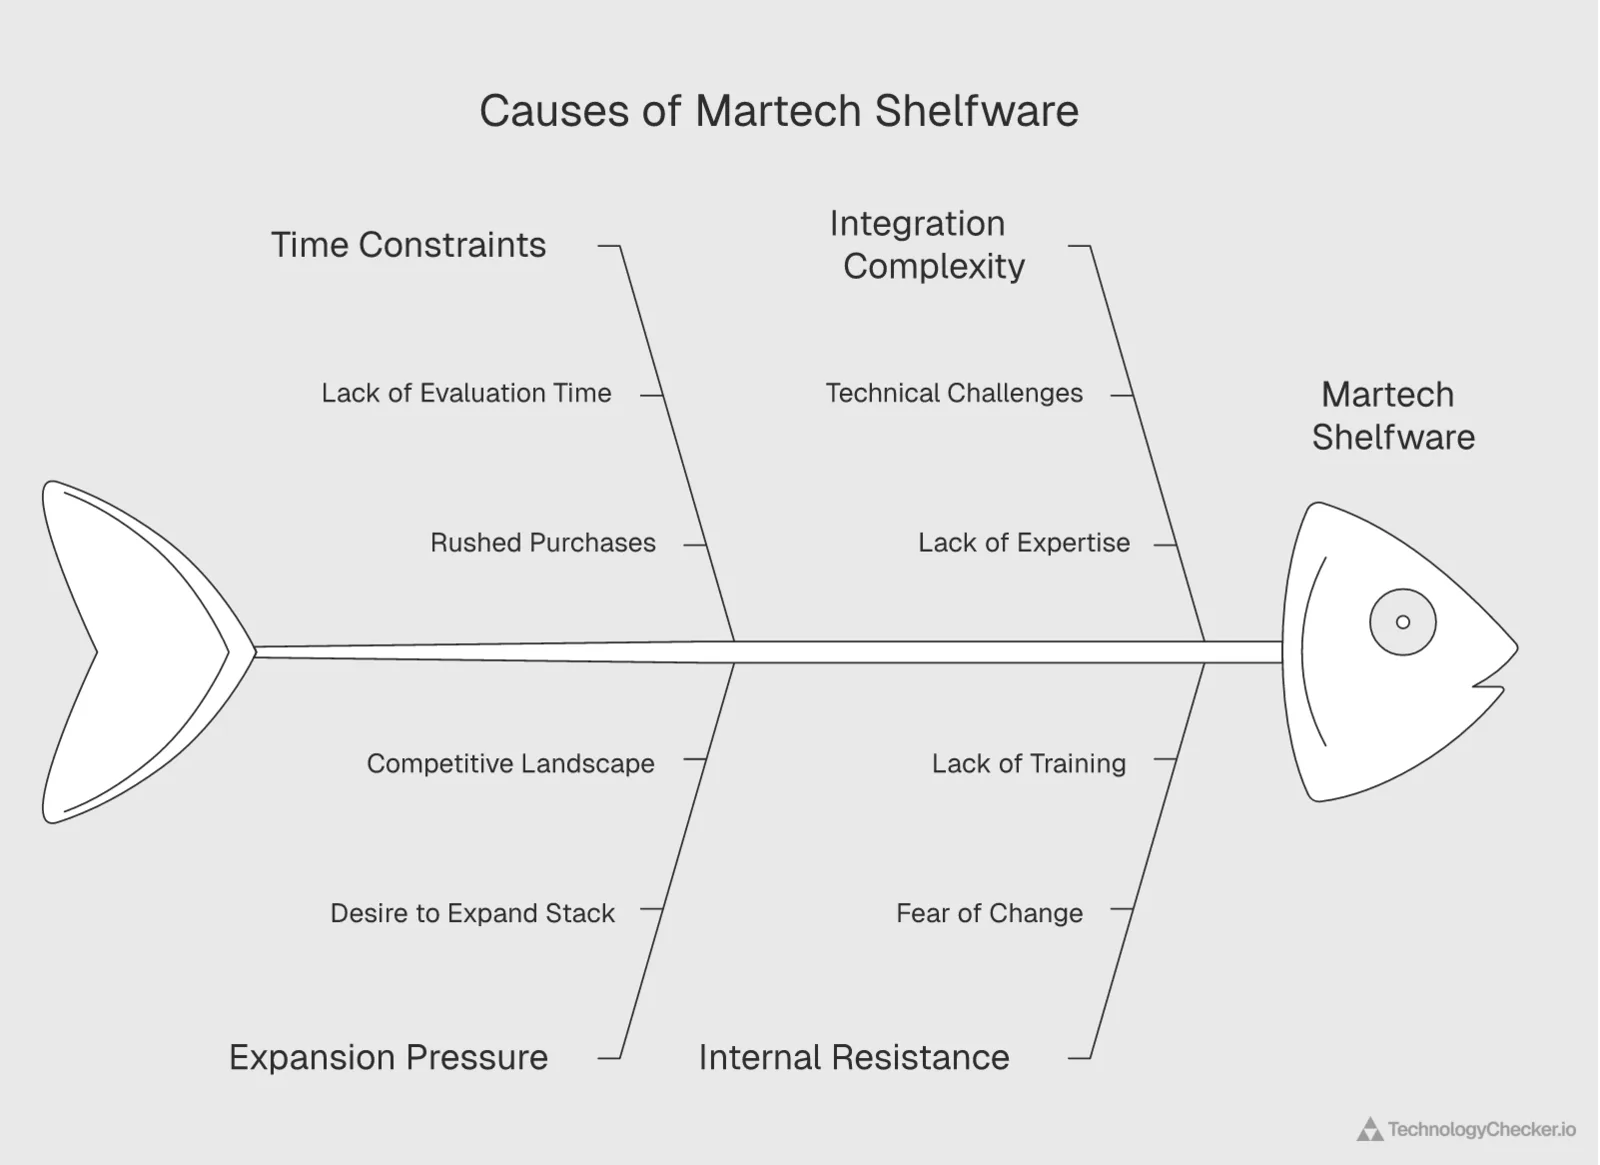
Here's the tension: 67% of organizations want to expand their stack, but 60% of their CMOs don't have time to evaluate what they're buying. That mismatch is exactly why so many martech purchases end up as shelfware. Decisions get rushed, fit is poor, adoption is low. The 54% citing integration pain reinforces why CDPs and composable architectures are gaining traction: they're the connective tissue that holds a sprawling stack together.
Artificial intelligence in marketing technology

AI isn't a feature anymore. It's the operating layer of most martech platforms. The data here shows marketers have moved well past experimentation. They're deploying AI across CRM, advertising, content, and data tools. The question isn't "should we?" anymore. It's "where first?"
Most impactful AI trends in marketing
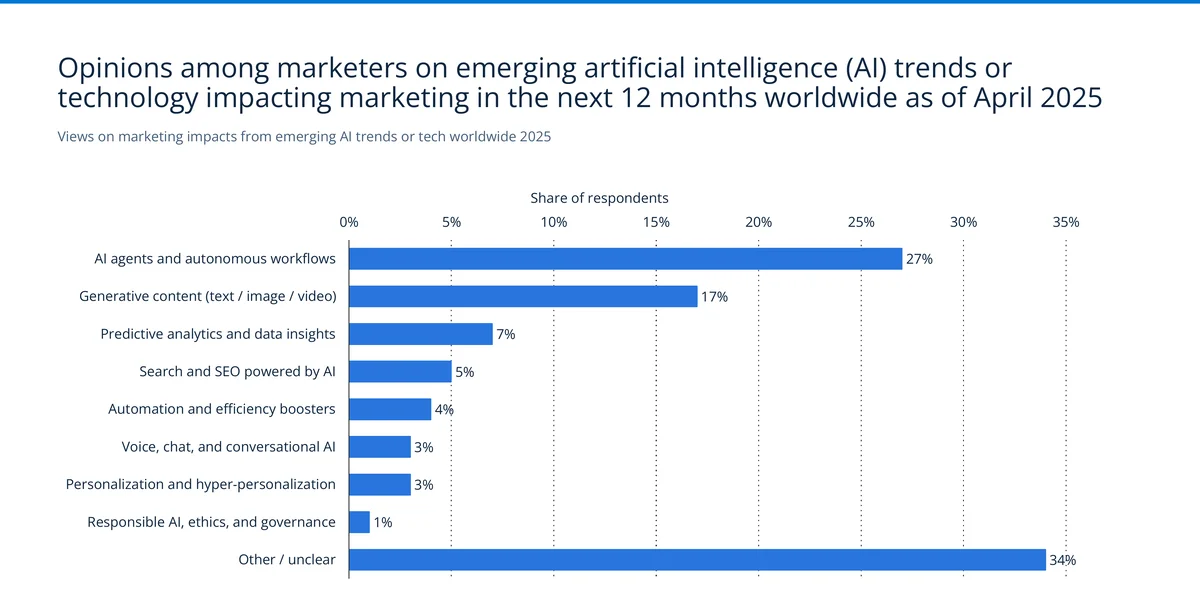
AI agents and autonomous workflows took the top spot at 27%. Generative content came in at 17%, predictive analytics at 7%, AI-driven SEO at 5%, automation boosters at 4%, and voice/chat AI at 3%. A notable 34% said "other/unclear," which tells you how fast this space is moving.
The agent number is the headline. Autonomous workflows barely registered in 2024 surveys. One year later, they're #1. This tracks with what we're seeing across the industry: HubSpot's AI assistants, Salesforce's Agentforce, and standalone agent platforms are putting autonomous marketing workflows into production. We've started detecting new agentic tool signatures in our crawl data that simply didn't exist six months ago.
Marketers say AI agents will reshape their work. The wider web shows those agents are already here at scale. According to Cloudflare Radar (Q2 2026), AI bot traffic is now led by Googlebot (27.49% of AI bot requests), with ClaudeBot (13.87%) newly overtaking Meta-ExternalAgent (12.70%) for the #2 spot, followed by GPTBot (10.23%). But the purpose of that crawling matters for marketers: 44.86% of it is for model training, now nearly tied with the 42.96% flagged mixed-purpose, and just 9.13% is for live AI search. In other words, most of the content these agents read today shapes tomorrow's AI answers — not today's citations. For marketing teams investing in content, that's the difference between feeding a model and getting surfaced in a live answer.
MarTech platforms using AI
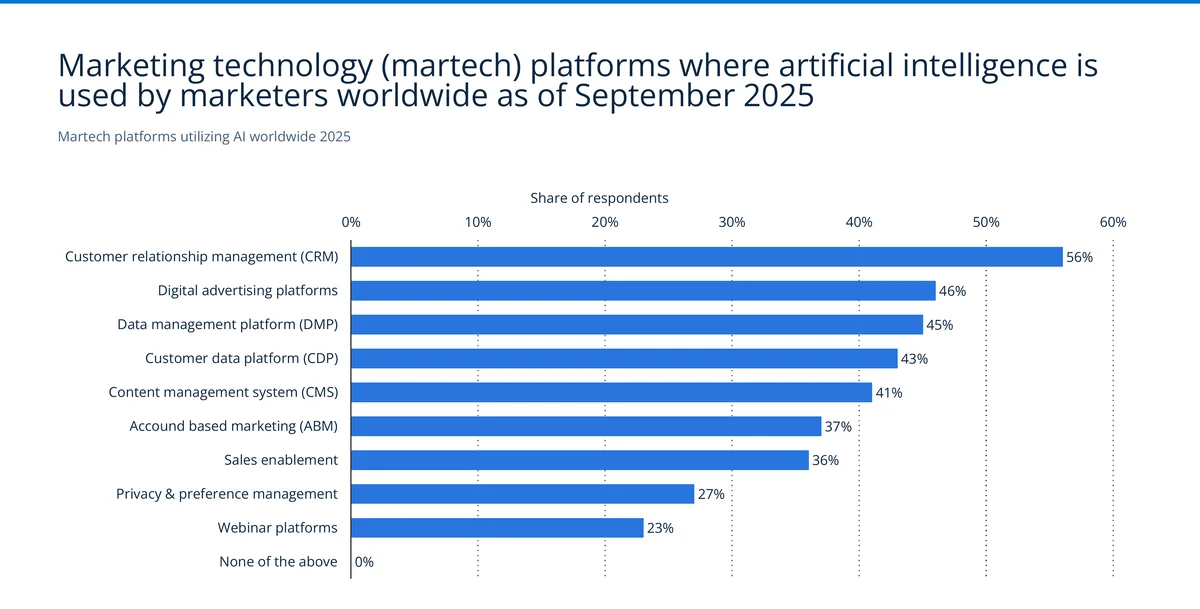
CRM leads AI utilization at 56%. Over half of organizations with a CRM are already using its AI features. Digital advertising follows at 46%, DMPs at 45%, CDPs at 43%. Even privacy tools (27%) and webinar platforms (23%) have AI baked in now.
Here's what caught our eye. Compare these numbers to the deployment data from earlier. CRM is deployed by 72% and uses AI at 56%, so 78% of CRM deployments include AI. For CDPs, it's 53% deployed and 43% AI-enabled, which works out to 81%. CDPs actually lead CRM in AI utilization rate, probably because they were built from the ground up for the kind of data processing that AI handles well.
Confidence in evaluating AI for MarTech
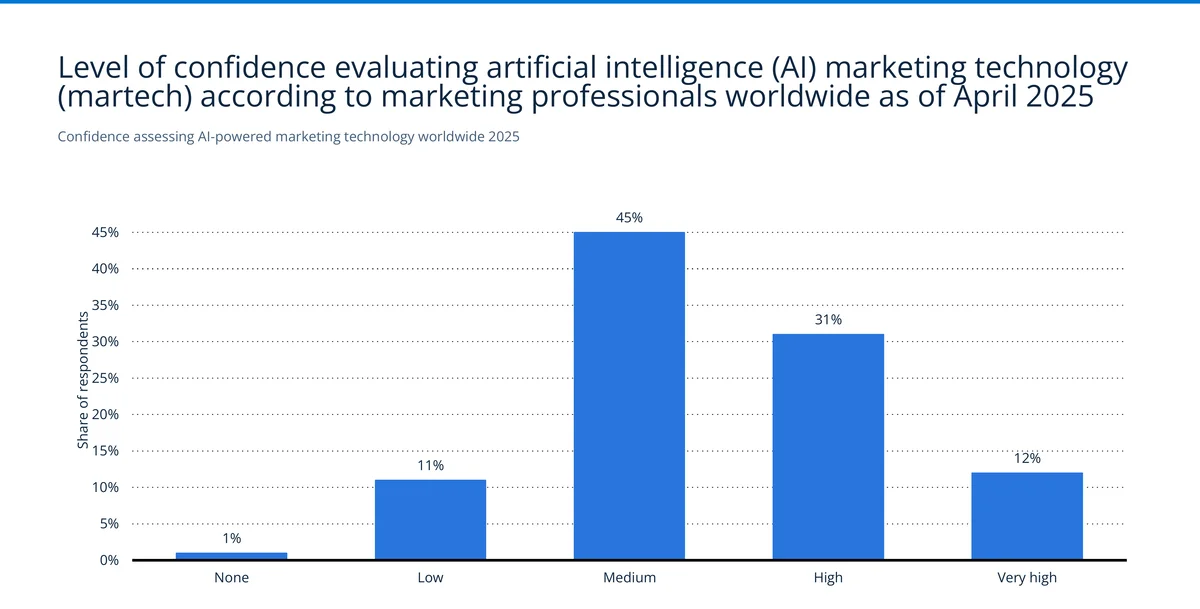
88% of marketers report at least medium confidence evaluating AI tools (45% medium, 31% high, 12% very high). Just 1% say they have zero confidence, and 11% rate themselves low.
The 12% "very high" group likely has dedicated AI or data science people on staff. The more telling segment is that 45% in the middle. These are marketers who get the potential but may struggle to tell real capability from marketing hype. That gap is an opening for platforms that offer transparent benchmarking and hands-on trial environments instead of slick demos.
What marketers want from AI
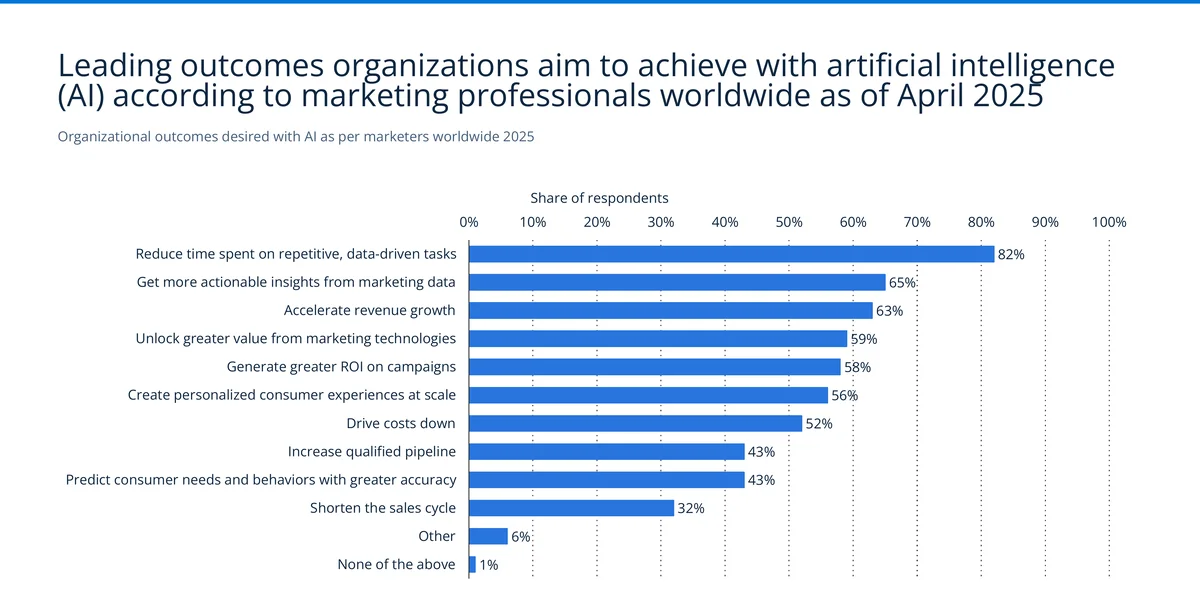
82% want AI to eliminate repetitive tasks. That's the #1 desired outcome by a wide margin. Actionable insights from data (65%), revenue acceleration (63%), better value from existing tech (59%), improved ROI (58%), and personalization at scale (56%) fill the middle. Predicting consumer behavior (43%) and shorter sales cycles (32%) rank lower.
The 82% number tells a blunt story. Marketers are buried in manual work: data entry, report generation, campaign setup, tag management. They don't want AI to replace them. They want it to free them from the tasks they shouldn't be doing manually in the first place. The 65% wanting actionable insights says the same thing from a different angle. Raw data isn't the problem. Turning data into decisions without hours in spreadsheets is.
Marketing automation market
Marketing automation is one of the most mature segments in martech. It has clear leaders, predictable growth, and well-documented use cases. For a deeper look at platform-level adoption based on 50 million crawled domains, including installation counts, growth rates, and migration patterns for 17 individual platforms, see our 2026 Marketing Automation Report.
Market size and growth projections
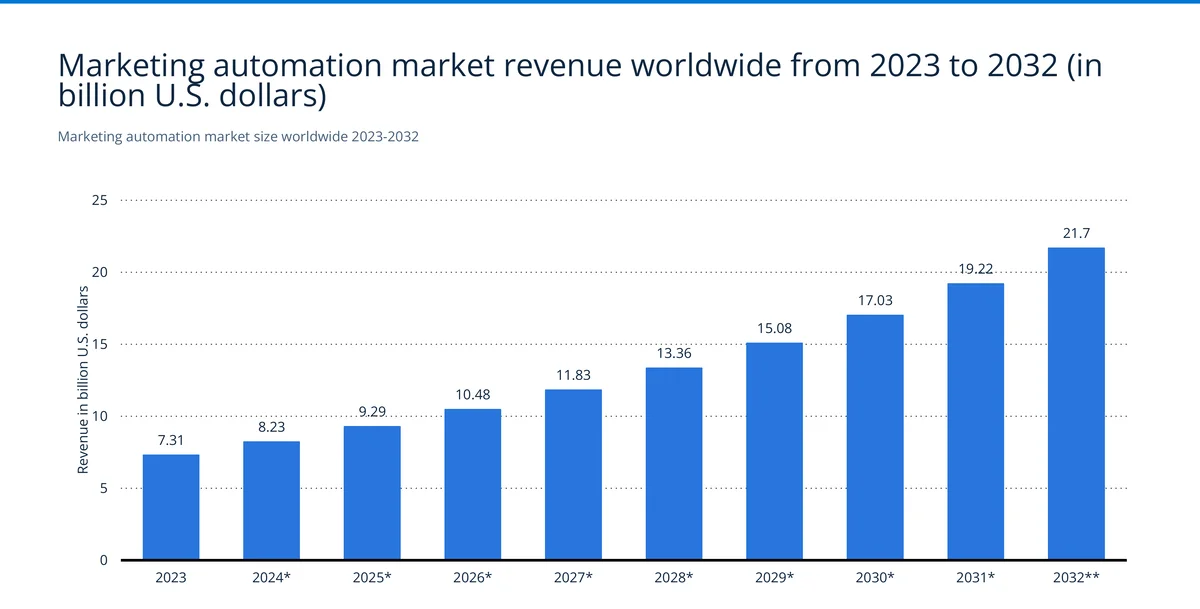
$7.31 billion in 2023. $8.23 billion in 2024. $9.29 billion in 2025. Projected to hit $21.7 billion by 2032. That's a near-tripling over the decade at about 12.8% CAGR.
Unlike the broader martech market with its more volatile swings, marketing automation follows a remarkably straight line. Each year adds $1-2 billion. That predictability reflects maturity: most enterprises already use some form of automation. Growth comes from seat expansion, platform upgrades, and mid-market companies finally buying in rather than big net-new enterprise deals.
Market share by provider
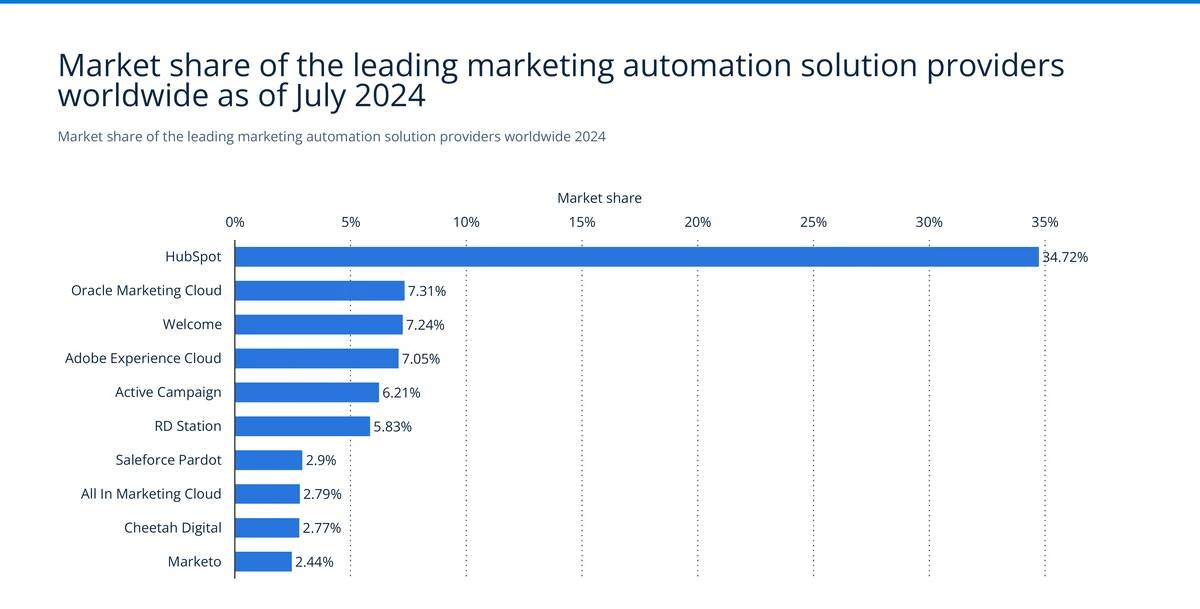
HubSpot owns 34.72% of the market. That's nearly five times its closest competitor. Oracle Marketing Cloud (7.31%), Welcome (7.24%), and Adobe Experience Cloud (7.05%) cluster together far behind. ActiveCampaign holds 6.21%, RD Station 5.83%, and Salesforce Pardot sits at just 2.9%.
HubSpot's lead is remarkable given what it's up against. Oracle, Adobe, and Salesforce all have vastly larger total budgets, yet HubSpot's product-led growth model (free CRM, freemium tiers, massive content engine) keeps winning. Our crawl-based marketing automation report validates this from a different angle: HubSpot ranks third by detected installations (121,300 domains) behind only MailChimp (283,090) and Klaviyo (147,491). The long tail below the top 10 is where most enterprise-specific and vertical automation tools live.
Most automated marketing activities
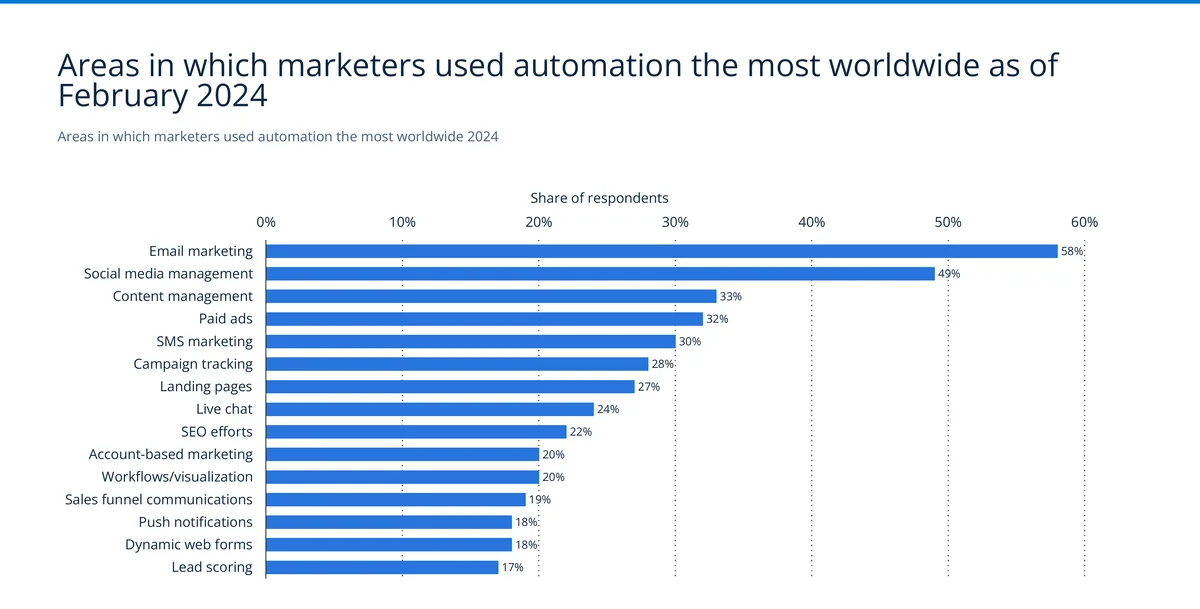
Email is still king of automation at 58%. No surprise there. It was the first channel to be widely automated and it's still the highest-volume channel for most B2B teams. Social media management follows at 49%, then content management (33%), paid ads (32%), SMS (30%), and campaign tracking (28%).
The 22% for SEO automation surprised us. Our data shows it's growing even faster than that in the e-commerce segment specifically, as AI-powered content optimization and programmatic SEO tools go mainstream. SMS automation at 30% is notable too — platforms like OneSignal, used by companies that use OneSignal like Subway and KPMG, are expanding from push notifications into full omnichannel messaging. Landing page automation (27%) and live chat (24%) round out the top ten, both areas where we're seeing rapid new tool adoption in our crawler data.
B2B marketing automation goals
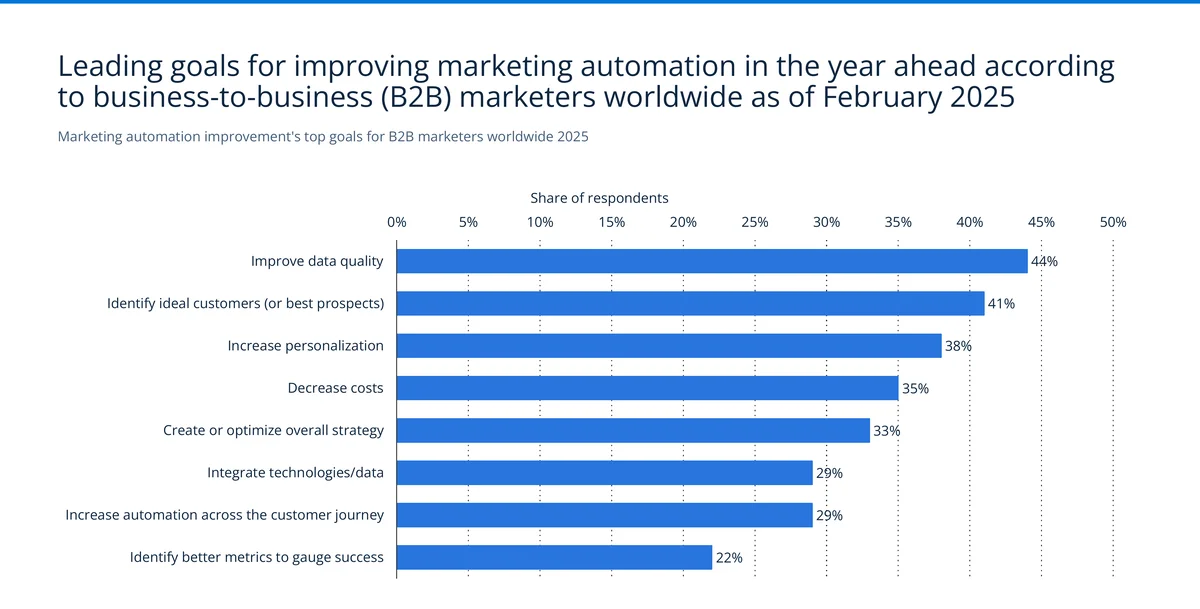
Data quality is the top B2B automation goal at 44%. Identifying ideal customers comes in at 41%, personalization at 38%, cost reduction at 35%, strategy optimization at 33%, and tech/data integration at 29%. Better metrics ranks last at 22%.
Data quality topping this list is a sign of where the market has matured to. Early automation adopters cared about volume: more emails, more campaigns, more leads. Teams that have been running automation for years now know that dirty data is what actually kills performance. Bad contact records, duplicate accounts, stale segments. All of it undermines every automated workflow they run.
B2B marketing automation challenges
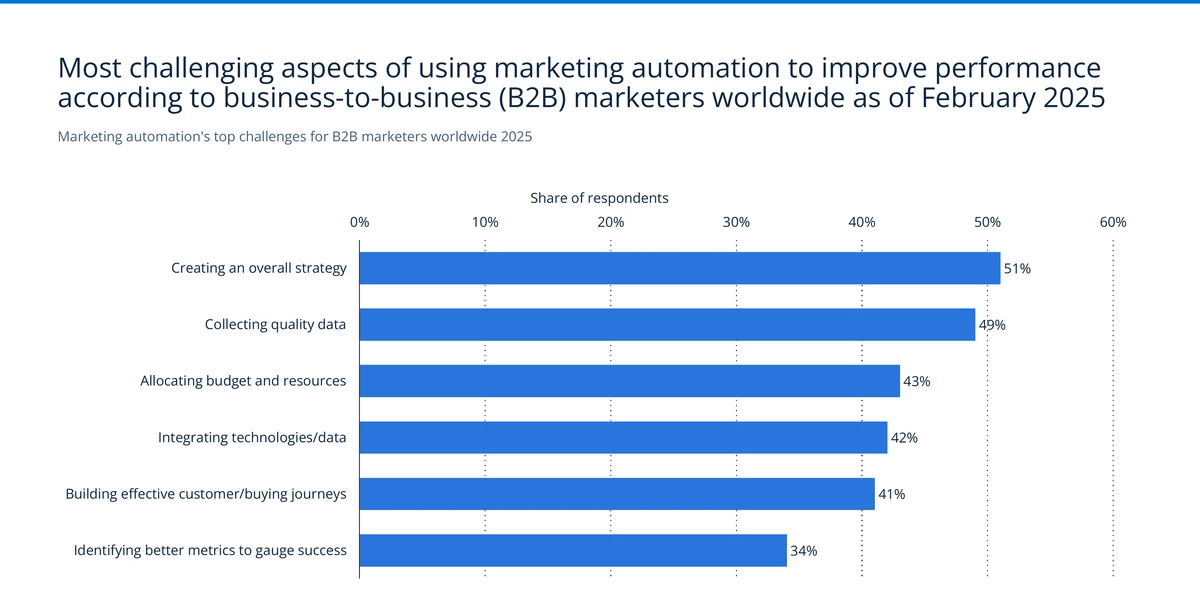
Strategy creation is the #1 challenge at 51%. Collecting quality data is right behind at 49%, then budget allocation (43%), integrating tech and data (42%), and building customer journeys (41%). Identifying the right metrics ranks lowest at 34%.
Over half of B2B marketers are struggling with strategy, not tools. They have the platforms. They don't know how to use them well. This echoes the CMO challenges data from earlier, where 60% cited lack of time to evaluate new tech. When you don't have time to evaluate, you don't have time to build strategy either. The result is powerful automation platforms running mediocre playbooks.
AI effectiveness in B2B marketing automation
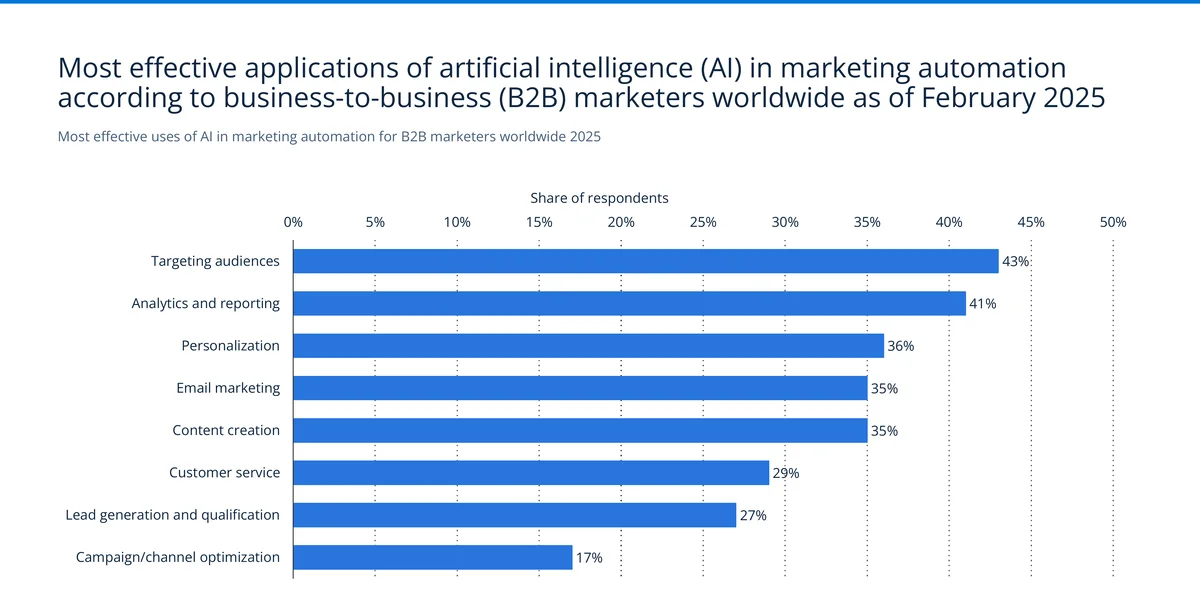
Audience targeting (43%) and analytics/reporting (41%) are where B2B marketers find AI most effective. Personalization (36%), email marketing (35%), and content creation (35%) cluster together in the middle. Lead gen/qualification trails at 27%, and campaign optimization sits at just 17%.
Targeting makes sense as #1. AI is excellent at pattern recognition across large datasets, and figuring out which accounts will convert is exactly that kind of problem. The campaign optimization number at 17% is the surprise. It suggests most platforms haven't delivered on AI-driven campaign management yet. This is likely where agentic AI, the #1 trend marketers cited earlier, will make the biggest dent over the next two years. Our marketing automation report digs into how Salesforce Agentforce and HubSpot Breeze AI are already deploying agents that can plan and run customer journeys without human intervention.
Software as a service (SaaS) industry context
MarTech lives inside the broader SaaS market. Understanding overall SaaS growth, spending, and funding trends shows where marketing technology fits in the bigger enterprise software picture.
Global SaaS revenue by region
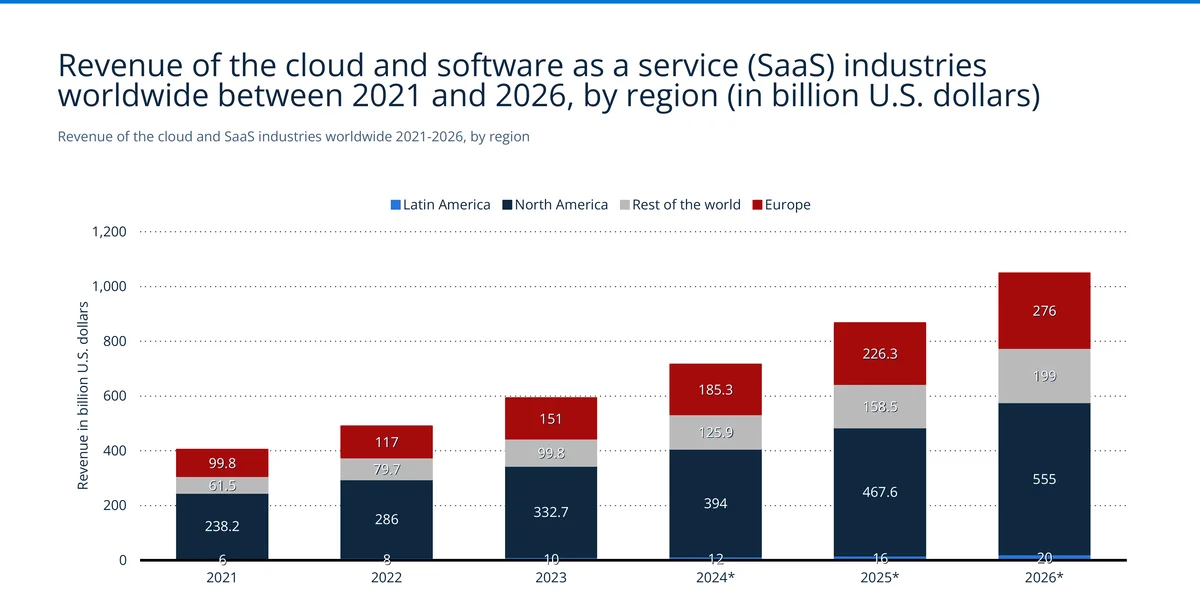
Global SaaS revenue grew from $405.5 billion in 2021 to $593.5 billion in 2023 and is projected to hit $1.05 trillion by 2026. North America dominates at roughly $238 billion in 2021, heading toward $555 billion by 2026. Europe and Asia-Pacific are meaningful but much smaller.
Both SaaS and martech are converging on the trillion-dollar mark by 2026. That's not a coincidence. MarTech is a big chunk of overall SaaS spending, and the same forces (cloud migration, AI integration, remote work infrastructure) are driving growth in both. North America holding above 50% share reflects where most SaaS vendors and enterprise buyers are concentrated.
SaaS annual spending distribution
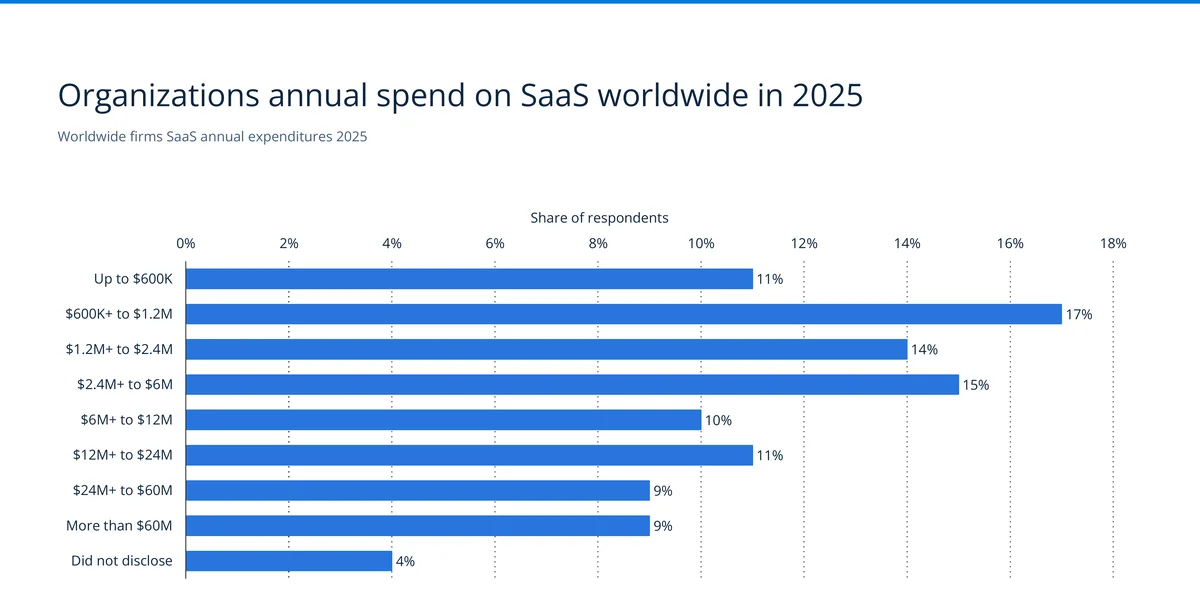
SaaS spending is spread widely. The biggest single group (17%) spends $600K-$1.2M annually. The middle tiers are fairly even: 14% at $1.2M-$2.4M, 15% at $2.4M-$6M, 10% at $6M-$12M. At the top, 9% spend $24M-$60M and another 9% exceed $60M.
That 18% spending over $24M a year? Those are the enterprise accounts where seven-figure martech platform deals happen, the buyers that Salesforce, Adobe, and Oracle are built to sell to. The 28% below $1.2M are the mid-market sweet spot for product-led companies like HubSpot and ActiveCampaign.
SaaS funding by industry vertical
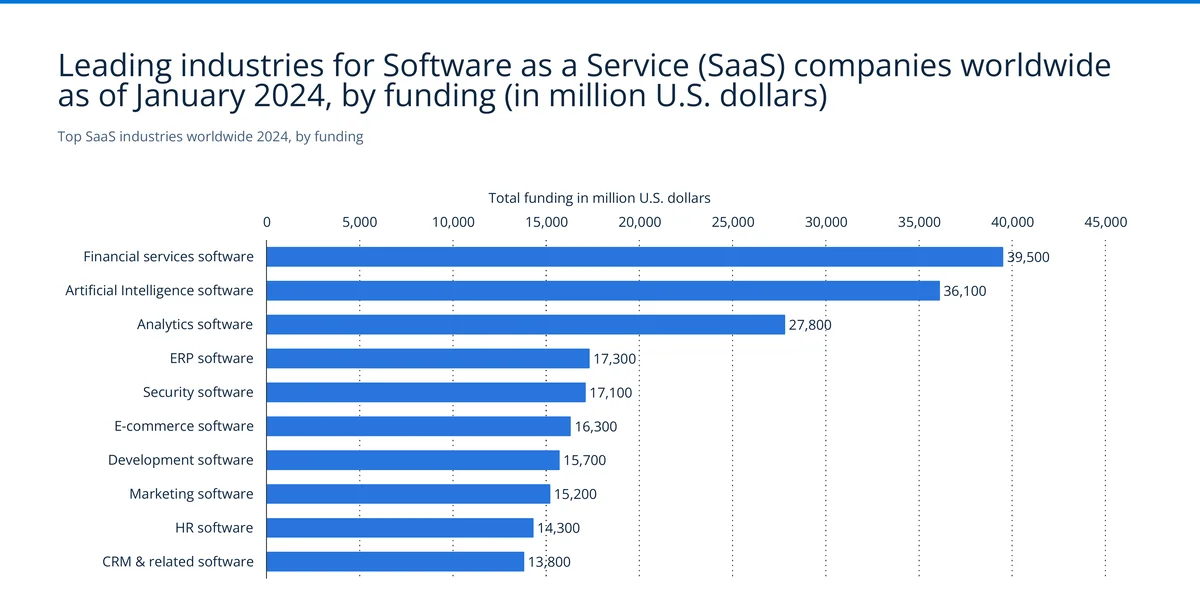
Financial services SaaS leads with $39.5 billion in total funding. AI software is close at $36.1 billion, analytics at $27.8 billion. ERP and security cluster around $17 billion each. Marketing SaaS sits eighth at $15.2 billion, with HR ($14.3B) and CRM ($13.8B) nearby.
Marketing's $15.2 billion in funding is mid-pack on its own. But combine it with CRM ($13.8B), which is heavily intertwined with marketing use cases, and the marketing-adjacent SaaS category totals nearly $29 billion. Venture capital and growth equity have bet heavily on this space, and the funding pipeline points to continued new entrant activity for years.
Emerging SaaS trends by impact
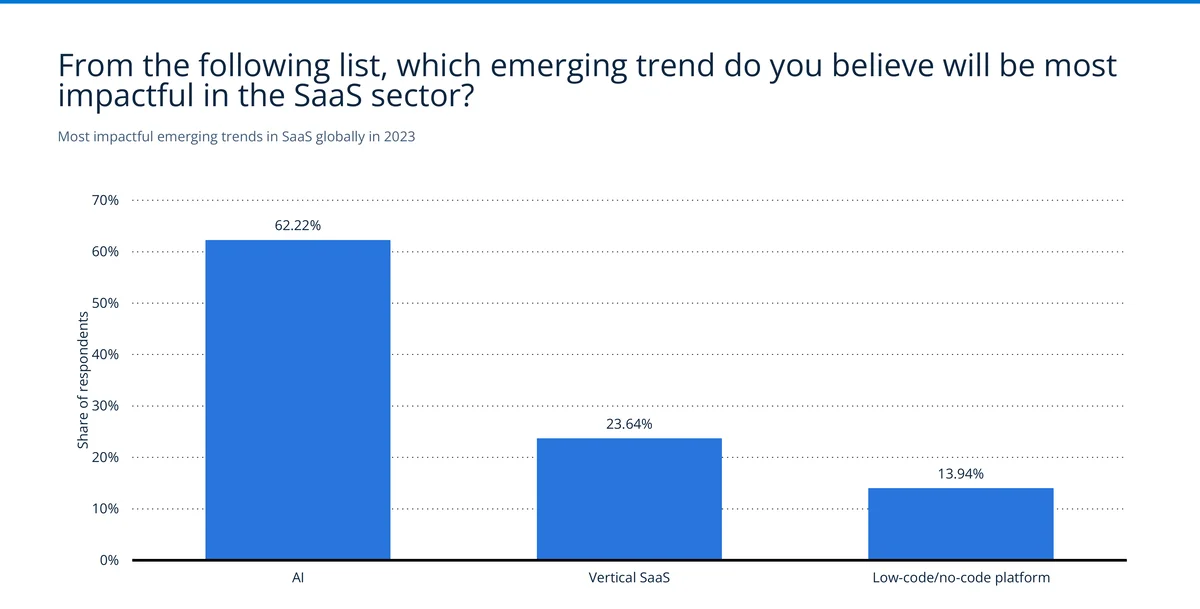
AI took 62.22% of the impact vote, nearly three times vertical SaaS (23.64%) and over four times low-code/no-code (13.94%). Nothing else registered.
Remember, this survey is from 2023, before the massive wave of AI agent and copilot launches in 2024-2025. If run today, AI's share would likely be even higher. The vertical SaaS signal at 23.64% deserves attention though. We're seeing more industry-specific martech tools in our crawl data, things built exclusively for healthcare marketing, real estate, or financial services, because horizontal platforms can't easily address niche compliance and workflow needs.
Customer data platforms (CDPs)
CDPs have gone from niche data infrastructure to a core part of the modern martech stack. With 53% of organizations now running one and 208 vendors competing for share, the segment has clearly arrived.
CDP industry revenue growth
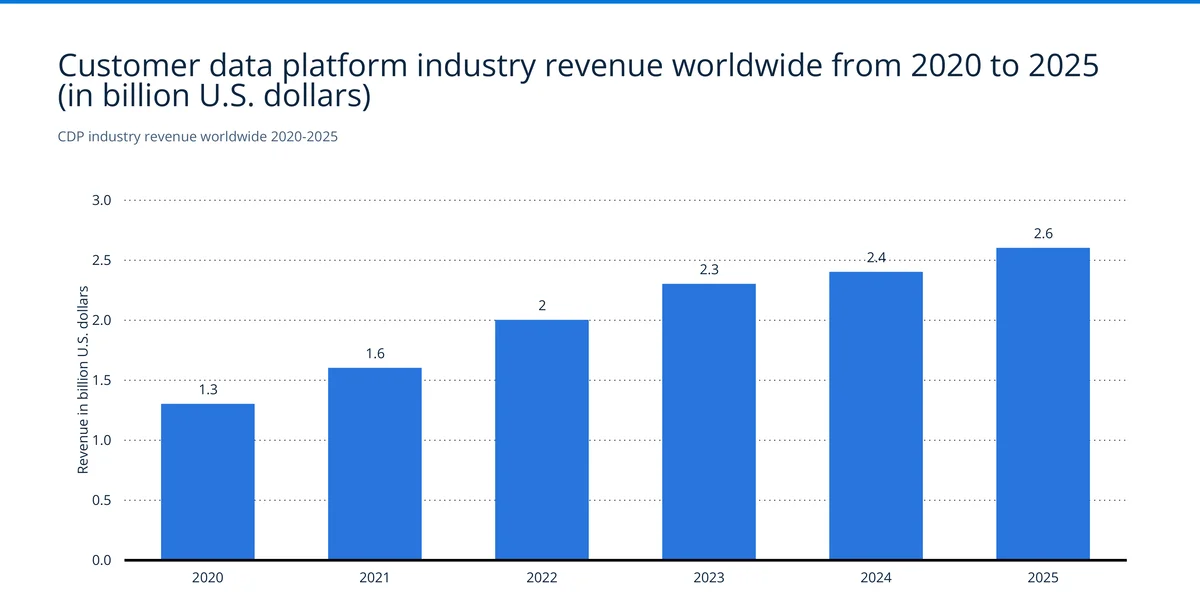
Revenue doubled from $1.3 billion in 2020 to $2.6 billion in 2025. The fastest jump was 2022, when it went from $1.6 billion to $2 billion (25% year-over-year). Growth has since moderated to 8-10% annually.
That slowdown doesn't mean trouble. It means the early adopters, large enterprises with complex data needs, already bought in. Current growth is mid-market adoption and seat expansion. From our detection data, the CDP adoption figure feels right. We've watched CDP signatures spread from enterprise-only to mid-market sites over the past 18 months, and the 53% deployment rate from Clevertouch confirms CDPs have moved from "emerging" to "expected."
CDP funding by region
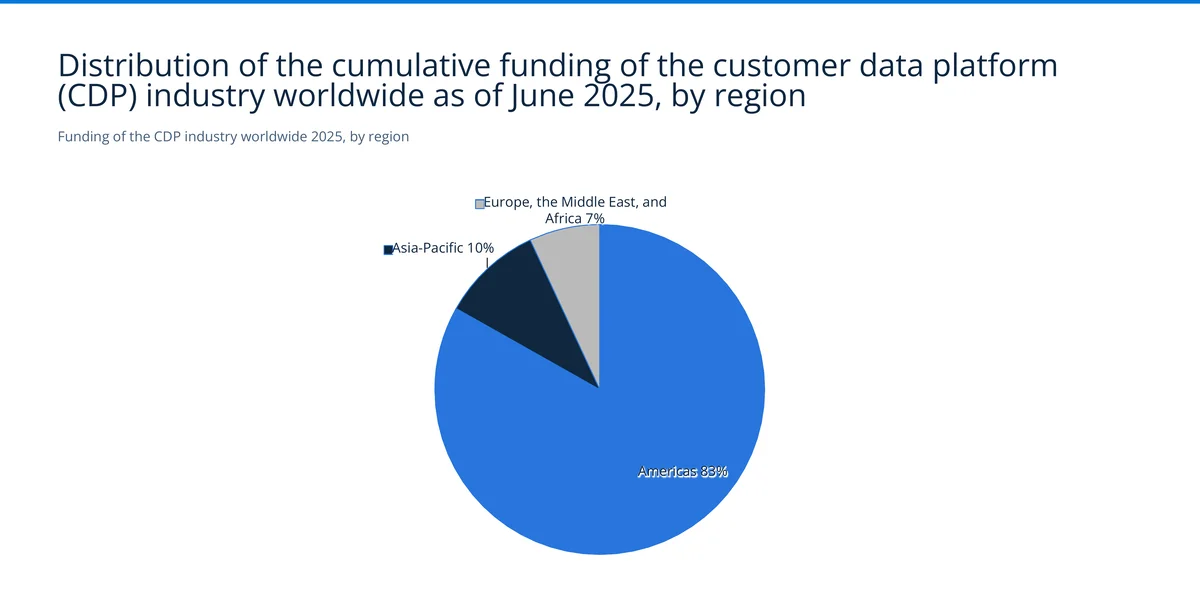
83% of the $9.4 billion in CDP funding went to the Americas. Asia-Pacific got 10%. EMEA just 7%.
That 7% EMEA number is strikingly low. Europe accounts for roughly 25% of global martech spending, so the funding mismatch is hard to ignore. There's an opening for European-headquartered CDP vendors who can differentiate on GDPR compliance and data sovereignty. European-founded platforms like Weglot — a Paris-based translation tool now used by companies that use Weglot including Thermo Fisher Scientific and the UN — show how EU-based SaaS can carve real market share with a compliance-first approach. Bloomreach and Exponea (now merged) have started gaining ground, but the funding data makes clear this is still a heavily U.S.-centric category.
CDP vendor count over time
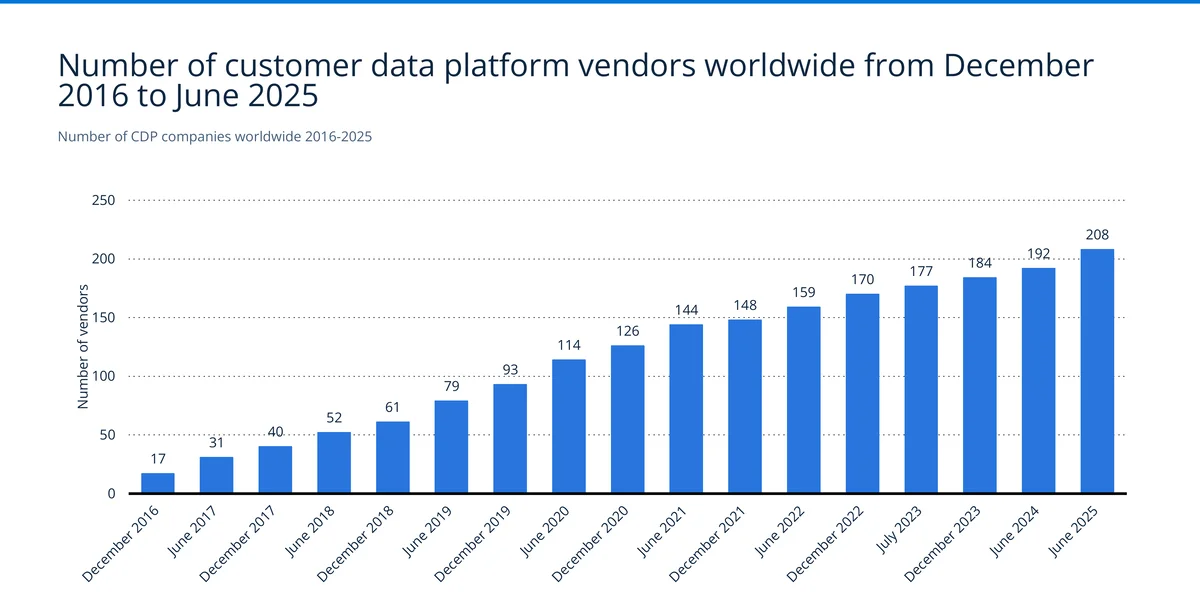
17 vendors in late 2016. 208 by June 2025. A 12x increase. Growth has been steady: past 50 in 2019, past 100 in late 2021, past 150 in 2023, past 200 in 2025. There hasn't been a single quarter of meaningful decline, meaning new entrants keep outpacing exits.
At 208 vendors, this market is fragmented but not yet consolidating hard. Compare it to marketing automation, where HubSpot alone holds 35%. CDPs have no single player anywhere close to that share. That makes evaluation hard for buyers (consistent with the 60% of CMOs who say they don't have time to evaluate new tech) but it also means there's still room for differentiated players to carve out real share.
Our own detection data tells the same fragmentation story from the deployment side. In our July 2025 crawl, Segment led the CDP category with 20,459 active domains, followed by Rudderstack (11,723), Lotame (7,909), Rapleaf (5,795), and LiveRamp (5,414). No single CDP comes close to the dominance that MailChimp (283,090) or Klaviyo (147,491) hold in email automation. The deployed reality matches the vendor count: this is a wide, contested field, not a winner-take-all one.
CDP employees by region
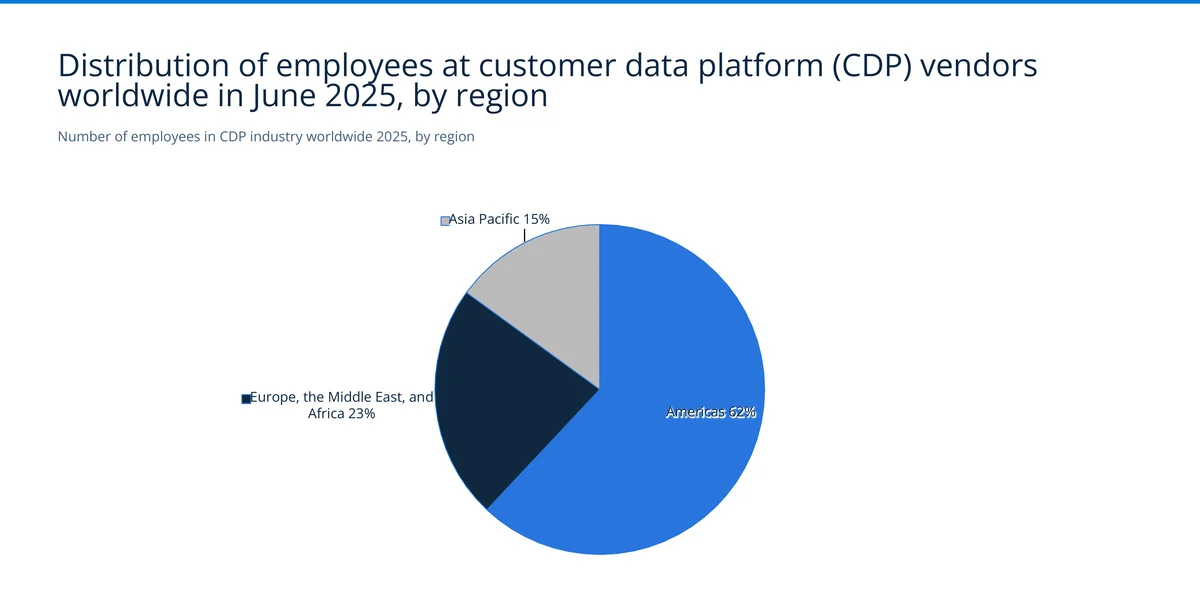
18,360 CDP employees worldwide: 62% in the Americas, 23% in EMEA, 15% in Asia-Pacific. The employee split is more balanced than the funding split. EMEA has 23% of employees but only 7% of funding, which suggests many U.S.-funded CDP companies run significant European operations.
Divide 18,360 employees by 208 vendors and you get an average of 88 people per company. This is a small-team category. Most CDP vendors are growth-stage companies with 20-150 employees. A handful of outliers (Salesforce's CDP division, Adobe Real-Time CDP, Twilio Segment) have much larger teams, which means the median company is well under that 88-person average.
Methodology and data sources
This post combines three data layers. (1) Survey and market data comes from the Statista Marketing Technology Dossier (study_id42670), published in 2025, which aggregated the 21 original research organizations listed below. (2) First-party detection data — platform install counts, CDP and CRM rankings, and the M&A signature-fade pattern — comes from our own crawler at TechnologyChecker.io, which scans 50M+ domains; the figures cited reflect our last complete crawl (July 2025). (3) Live AI-crawler traffic is from Cloudflare Radar (ai/bots, Q2 2026, 1 Apr–30 Jun, retrieved 3 Jul 2026), used to show how AI agents are already crawling the web at scale.
The Statista dossier aggregated data from the following 21 original research organizations:
- Act-On
- Apptension
- Ascend2
- CDP Institute
- Chief Martec
- Clevertouch
- Datanyze
- EBANX
- Flexera Software
- Gartner
- Intent HQ
- Latitud
- LUMA Partners
- LXA
- Marketing AI Institute
- MarketingCharts
- MarTech
- MartechTribe
- Polaris Market Research
- SmarterX
- Statista
- The Latka Agency
Where projections or estimates are used, they're marked with asterisks (*) in the chart data. All figures reflect the most recent data available at the time of the dossier's publication. For live technology market share data, migration trends, and company-level intelligence on specific martech platforms, visit our technology profile directory at TechnologyChecker.io.
Elif Arslan
CMO & Co-founder

