ChatGPT Statistics 2026 - 900M Users, $25B ARR, and the Cloudflare Crawl Data That Flipped Right Back (July 2026 Update)
Live Cloudflare Radar data (June 2026): ClaudeBot retook the AI-crawler lead from GPTBot, nearly doubling to 19.8%. Plus 900M users, $25B ARR, 50M paid subs.
Published •Updated •28 min read
In May 2026, GPTBot overtook ClaudeBot to become the largest dedicated AI training crawler on the web. By June the order had reversed right back: ClaudeBot nearly doubled to 19.8% of AI-bot traffic while GPTBot eased to 9.4%, so Anthropic's crawler now runs at roughly twice OpenAI's. That whipsaw is the real story. The lead between the two flagship crawlers is bursty and tied to each lab's training runs, and it swings month to month, which is exactly why every crawl figure in this article is dated. Combined with OpenAI's 900 million weekly active users, $25 billion annualized revenue, and 50 million paying subscribers, the mid-2026 picture is this: ChatGPT is bigger than ever as a product, even as Anthropic's crawler has pulled clearly ahead in raw web-harvesting volume.
Key findings (July 2026 update):
- As of June 2026, ClaudeBot has retaken the AI-crawler lead and nearly doubled it: 19.8% of AI-bot traffic versus GPTBot's 9.4% (full-month June, holding through the trailing 7- and 28-day windows into early July). ClaudeBot is now the second-largest AI crawler overall behind Googlebot, and with Claude-SearchBot added, Anthropic's combined footprint (about 23%) is closing on Google's. May's GPTBot lead lasted exactly one month. Source: Cloudflare Radar
ai/bots/summary/user_agent, full-month June 2026, pulled 2026-07-03.- GPTBot 11.48%, ClaudeBot 9.73% of all AI bot traffic on Cloudflare's network in May 2026. In April the order was reversed (ClaudeBot 11.69%, GPTBot 9.84%), so this is a genuine month-over-month overtake. Source: Cloudflare Radar
bots/summary/user_agent, full-month May 2026.- ChatGPT has held #1 in the Generative AI service category since at least Feb 23, 2026 — still #1 when we re-checked on July 3, 2026, roughly 130 days later. Source: Cloudflare Radar
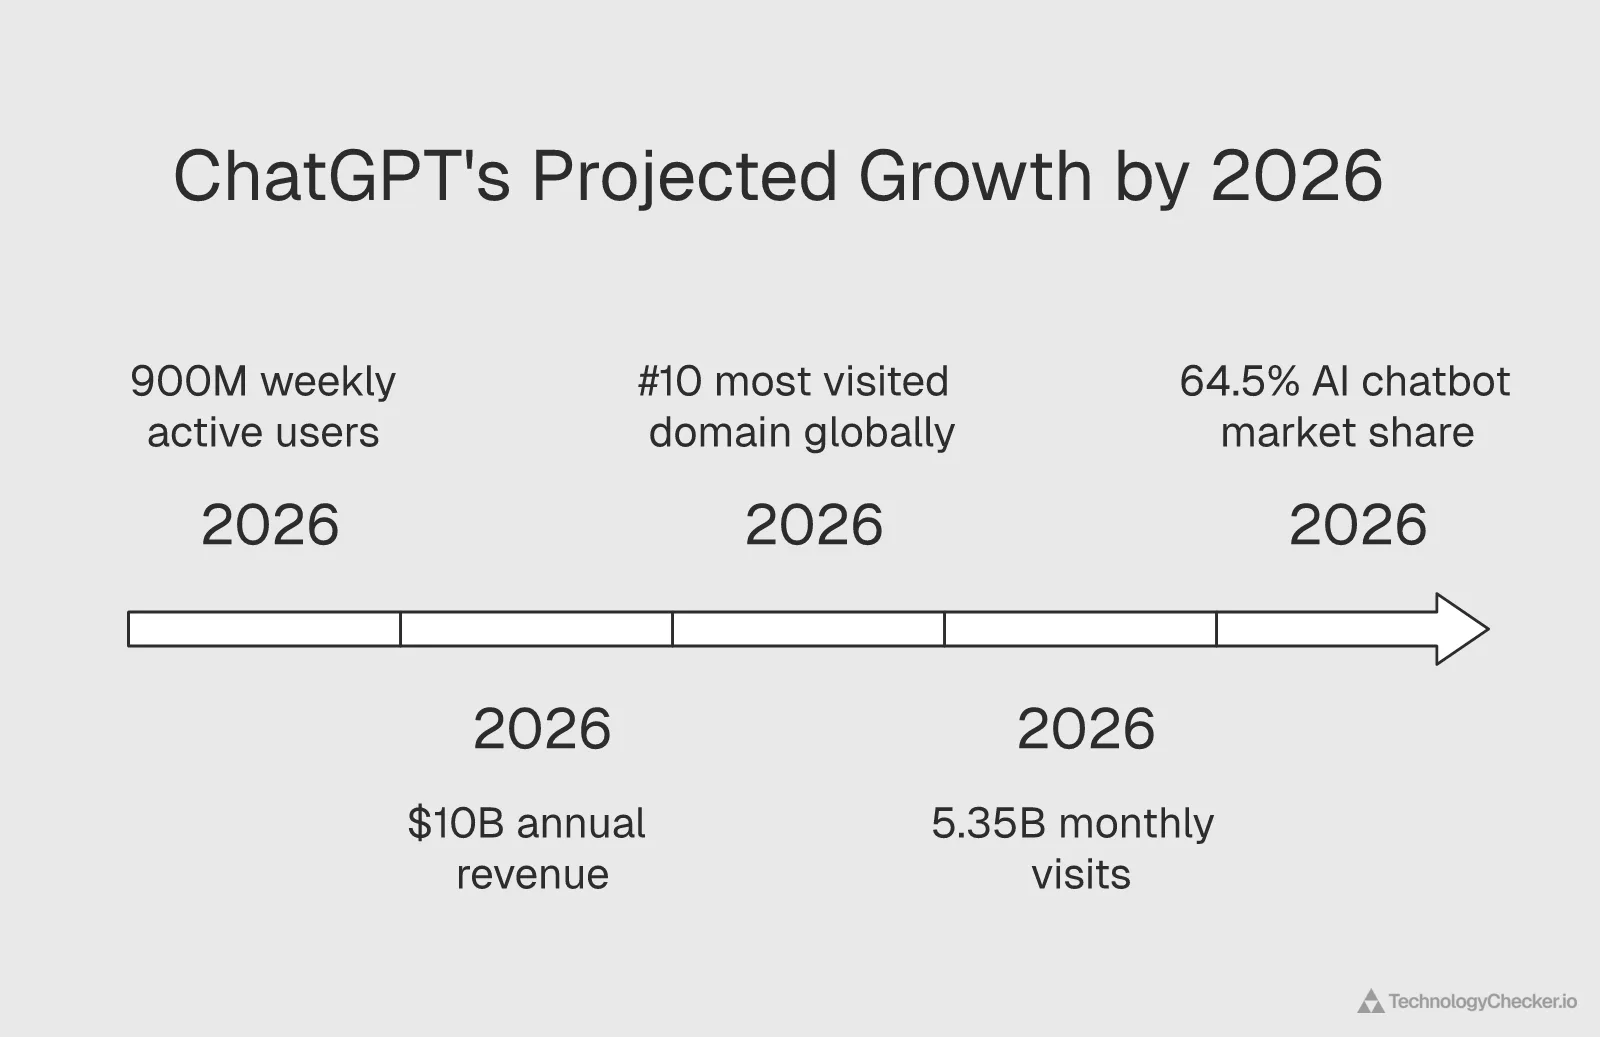
internet-services-timeseries.- 900 million weekly active users confirmed by OpenAI on Feb 27, 2026 — on pace for 1 billion before year-end. -- TechCrunch
- $25 billion annualized revenue as of March 2026, on a $2-billion-per-month run-rate. Targeting $29.4B for full-year 2026.
- 50 million paying subscribers worldwide — the figure most "ChatGPT Plus only" stat sheets still under-report by 5x.
- Bytespider (ByteDance) nearly doubled its AI crawl share from 5.73% in April to 10.25% in May, passing ClaudeBot to become the #4 AI crawler overall and the fastest-growing crawler on the list.
- chatgpt.com sits in Cloudflare's top-200 domain bucket at rank 23 (July 3, 2026), up from a niche-ranked domain 18 months ago, but lower than the top-10 figures circulating in older roundups.
What changed from April to May 2026
I re-pulled every Cloudflare Radar metric on June 1, 2026, covering the full month of May, to see which numbers held, which moved, and which reversed. Several of April's headline claims are now wrong, and that's the point of dating your data and refreshing it. Updated June 1, 2026.
| Metric | April 2026 | May 2026 | Δ |
|---|---|---|---|
| GPTBot crawl share | 9.84% | 11.48% | +1.64 pt ⬆️ |
| ClaudeBot crawl share | 11.69% | 9.73% | −1.96 pt ⬇️ |
| Bytespider crawl share | 5.73% | 10.25% | +4.52 pt ⬆️⬆️ |
| Googlebot AI crawl share | 30.28% | 27.26% | −3.02 pt ⬇️ |
| Meta-ExternalAgent share | 14.91% | 13.23% | −1.68 pt ⬇️ |
| Crawl purpose: training | 51.51% | 51.80% | +0.29 pt |
| chatgpt.com Cloudflare rank | rank 25 | rank 24, top-200 bucket | ⬆️ |
| OpenAI paying subscribers | 10M ChatGPT Plus only | 50M paying (all tiers) | re-stated |
| OpenAI total raise / valuation | (not in April version) | $122B raised, $730B+ valuation | new |
Three of those changes matter most. The ClaudeBot-versus-GPTBot reversal is a real shift in which lab is pulling the most web data. Bytespider nearly doubling means ByteDance is now the #4 AI crawler overall, at a scale none of the April analyses caught. And the 50 million paying subscriber figure, confirmed in OpenAI's funding round announcement, is roughly 5x what most "ChatGPT Plus subscribers" articles report, because they count only one of OpenAI's four paid tiers.
Update (July 3, 2026): the single biggest of those changes did not last. In June the ClaudeBot-versus-GPTBot order reversed yet again, with ClaudeBot retaking the lead and nearly doubling its share while GPTBot slipped. The full June breakdown is in the June update further down. It is the clearest example in this article of why a dated snapshot beats a static 'current' number.
ChatGPT statistics 2026: key highlights
These are the ten numbers I keep coming back to. I cross-referenced each one against Cloudflare Radar (for crawl and ranking data), OpenAI's official statements (for users and revenue), SimilarWeb (for traffic share), and Sensor Tower (for app metrics).
| # | Statistic | Value | As of | Source |
|---|---|---|---|---|
| 1 | Weekly Active Users | 900 million | Feb 27, 2026 | OpenAI |
| 2 | Paying Subscribers (all tiers) | 50 million | Q1 2026 | OpenAI |
| 3 | Annualized Revenue | $25 billion | Mar 2026 | OpenAI / PYMNTS |
| 4 | Monthly Revenue Run-Rate | ~$2 billion / month | Q1 2026 | Sacra |
| 5 | OpenAI Valuation (post-money) | $730+ billion | Apr 2026 | OpenAI |
| 6 | Total Raised | $122 billion | Apr 2026 | OpenAI |
| 7 | Generative AI Ranking | #1 since at least Feb 23, 2026 (still #1 June 1) | June 1, 2026 | Cloudflare Radar |
| 8 | GPTBot Crawl Share | 9.4% of AI bot traffic (ClaudeBot retook the lead at 19.8%) | June 2026 | Cloudflare Radar |
| 9 | 2025 Mobile Revenue | $1.35 billion (+673% YoY) | FY 2025 | Sensor Tower |
| 10 | 2026 Revenue Target | $29.4 billion | FY 2026 | DemandSage / OpenAI |
If you're evaluating large language models for enterprise use, this is the baseline. ChatGPT is one of the most-used web properties on the planet, and that scale affects everything from API reliability to model training data breadth.
ChatGPT user growth and adoption (2022–2026)
ChatGPT Weekly Active Users 2022–2026: From 1M in 5 Days to 900M in 38 Months
ChatGPT reached 900 million weekly active users in February 2026, doubling its 400 million WAU base from one year earlier. The growth curve is the fastest in consumer technology history: 1 million users in 5 days, 100 million in two months, 800 million in three years. At the current trajectory, OpenAI is on pace to cross 1 billion weekly active users before the end of 2026.
Source: OpenAI / TechCrunch / 9to5Mac · Dec 2022 – Feb 2026
| Milestone date | Weekly active users (millions) |
|---|---|
| Dec 2022 | 1M |
| Jan 2023 | 100M |
| Dec 2023 | 180M |
| Feb 2025 | 400M |
| Jul 2025 | 700M |
| Dec 2025 | 800M |
| Feb 2026 | 900M |
- Weekly active users more than doubled in 12 months: 400M (Feb 2025) → 900M (Feb 2026)
- ChatGPT was the fastest consumer app to 100M users — ~2 months vs Instagram's 2.5 years
- At the current 12-month doubling rate, 1 billion WAU is plausible before end of 2026
ChatGPT's adoption curve is the fastest in consumer technology history. One million users in five days. Nine hundred million weekly active users in three years. Nothing else has scaled this fast.
The growth timeline
| Date | Milestone | Time to reach |
|---|---|---|
| Nov 30, 2022 | Launch day | Day 0 |
| Dec 5, 2022 | 1 million users | 5 days |
| Jan 2023 | 100 million users | ~2 months |
| End of 2023 | 180 million users | 13 months |
| Feb 2025 | 400 million WAU | ~27 months |
| Jul 2025 | 700 million WAU | ~31 months |
| Dec 2025 | 800 million WAU | ~36 months |
| Feb 27, 2026 | 900 million WAU (confirmed by OpenAI) | ~38 months |
According to TechCrunch's coverage of OpenAI's February announcement, weekly active users grew 350% in the 18 months prior. At that pace, 1 billion weekly active users is achievable before the end of 2026 — making ChatGPT the fastest consumer product in history to reach that milestone.
Who's actually using ChatGPT?
The user demographics have shifted. The gender split has flipped: at launch roughly 80% of users were male, but by 2026 about 52% are women. That signals mainstream adoption well beyond the early tech-adopter demographic.
Seventy percent of ChatGPT usage isn't work-related, according to Zapier's analysis. Close to half (49%) of all queries fall under "asking" — general knowledge questions, advice, explanations. Despite enterprise ambitions, ChatGPT's growth engine is still powered by personal use.
One pattern we see at TechnologyChecker when scanning technology stacks across millions of domains: ChatGPT integration signals (API calls, embedded widgets, OpenAI SDK references) have increased 3x in the sites we monitor since January 2025. Businesses aren't just using ChatGPT casually — they're building it into their products.
ChatGPT revenue and financial performance
OpenAI Annualized Revenue 2023–2026: $2B to $25B in 3 Years
OpenAI's annualized revenue grew from $2 billion in 2023 to $25 billion in March 2026 — a 12.5x expansion in three years. The pace tripled in 2025 alone (from $6 billion to $20 billion) and continued at a roughly $2 billion-per-month run-rate through Q1 2026. The 2026 internal target reported by DemandSage is $29.4 billion in full-year revenue, which would require the trajectory to accelerate further in H2.
Source: OpenAI / PYMNTS / Sacra · 2023 – March 2026
| Period | Annualized revenue (USD billions) |
|---|---|
| 2023 | 2B |
| 2024 | 6B |
| End 2025 | 20B |
| Mar 2026 | 25B |
| 2026 target | 29.4B |
- ARR run-rate has tripled year over year for three consecutive years
- OpenAI is now generating roughly $2 billion in revenue per month
- The $29.4B full-year 2026 target implies H2 2026 acceleration above the current run-rate
OpenAI has gone from a research lab to one of the fastest-growing revenue engines in tech. Annualized revenue crossed $25 billion in March 2026, on a roughly $2 billion-per-month run-rate. The April 2026 capital raise of $122 billion valued the company at over $730 billion post-money — a number that would have been ridiculous to anyone reading this article a year ago. For the macro view, see our AI market size statistics 2026 forecast to $1.67T by 2031.
Revenue growth timeline
| Period | Annualized run-rate | Year-over-year growth |
|---|---|---|
| 2023 | ~$2 billion | First meaningful revenue |
| 2024 | ~$6 billion | ~200% |
| End 2025 | ~$20 billion | ~233% |
| March 2026 | $25 billion | tripled YoY |
| 2026 target | $29.4 billion | per OpenAI internal projections |
According to PYMNTS reporting, OpenAI's ARR tripled in 2025 alone. The pace has not slowed in Q1 2026. That trajectory puts OpenAI on track to match companies like Salesforce and Adobe in total revenue within 2-3 years, though profitability remains a separate question.
Where the revenue comes from: the 50 million paid subscribers nobody talks about
This is the stat most ChatGPT articles get wrong. OpenAI confirmed 50 million paying subscribers across all tiers in its April 2026 announcement. Most "ChatGPT Plus subscribers" stats articles still report 10 million — because they're only counting one of OpenAI's four paid SKUs:
- ChatGPT Plus ($20/month) — the original consumer tier
- ChatGPT Team ($25/user/month) — multi-seat for small teams
- ChatGPT Enterprise (custom pricing) — large-org deployment
- ChatGPT Pro ($200/month) — heavy users and o1-series access
At 50 million paying users, the average monthly revenue per paying user comes out to roughly $35–$40 — which lines up with the rough $2B/month run-rate when you exclude API revenue. The mix is now substantially weighted toward higher-priced enterprise and Pro tiers, not the $20 Plus tier most stat sheets implicitly assume.
Mobile revenue: $1.35B in 2025, $221M in a single US month in March 2026
ChatGPT's mobile app revenue grew 673% year-over-year. According to WytLabs, mobile app revenue surged from $174 million in 2024 to $1.35 billion in 2025. Sensor Tower's State of Mobile 2026 report puts ChatGPT at number 2 globally by downloads, with 148% growth in downloads, 254% growth in in-app purchase revenue, and a 426% surge in total time spent.
The Sensor Tower platform-level data for March 2026 alone (US only): 23 million iOS downloads with $221 million in revenue, plus 55 million Google Play downloads with $54 million in revenue. That's a single market and a single month — and ChatGPT pulled in $275 million in mobile revenue from US users alone.
The profitability question
Despite $25 billion in annualized revenue and a $730 billion valuation, OpenAI reportedly isn't profitable yet. Training and inference costs for the GPT-4o and o1 model families consume enormous compute resources. For B2B buyers evaluating AI adoption trends, this matters: pricing stability depends on OpenAI finding a sustainable cost structure. Inference cost optimization has been improving about 10x per year, but whether subscription prices hold steady through 2026 is unclear.
If you're forecasting AI spend, budget for tier restructuring. OpenAI's introduction of the $200/month Pro tier suggests the $20 Plus tier may eventually become more limited.
Traffic, engagement, and usage metrics
ChatGPT doesn't just have users. It has some of the highest engagement metrics of any web platform — deep, habitual usage rather than casual drive-by traffic.
Monthly visit volume
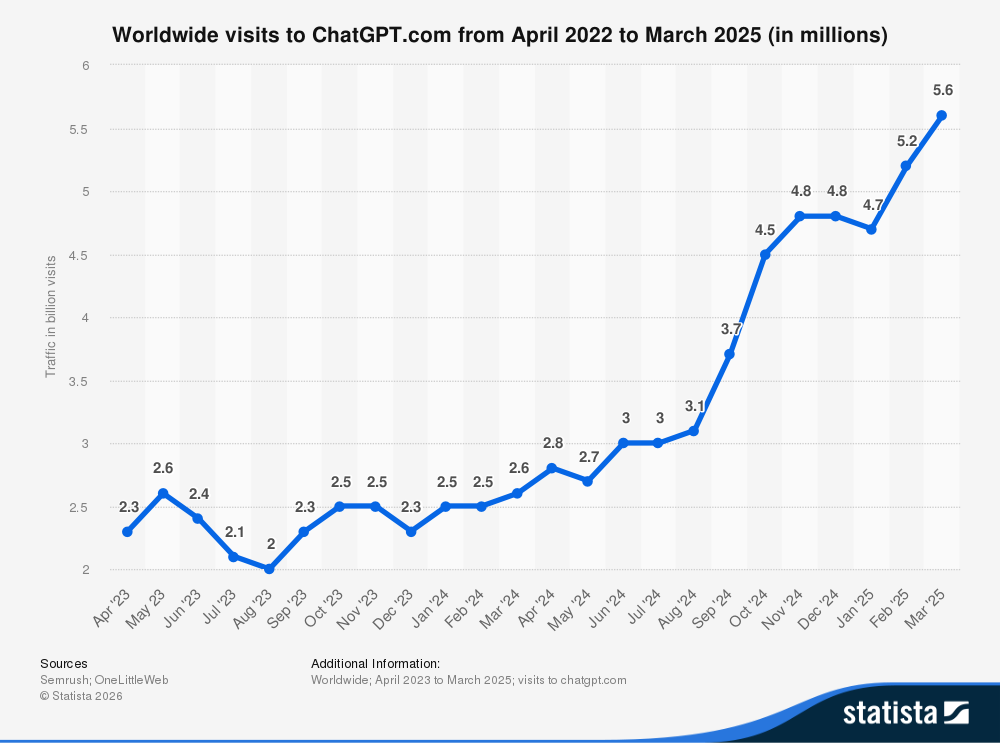
| Month | Monthly visits | Source |
|---|---|---|
| January 2026 | 5.72 billion | The Digital Elevator |
| February 2026 | 5.35 billion | DemandSage / SimilarWeb |
| Current estimate | ~5.6 billion | Exploding Topics |
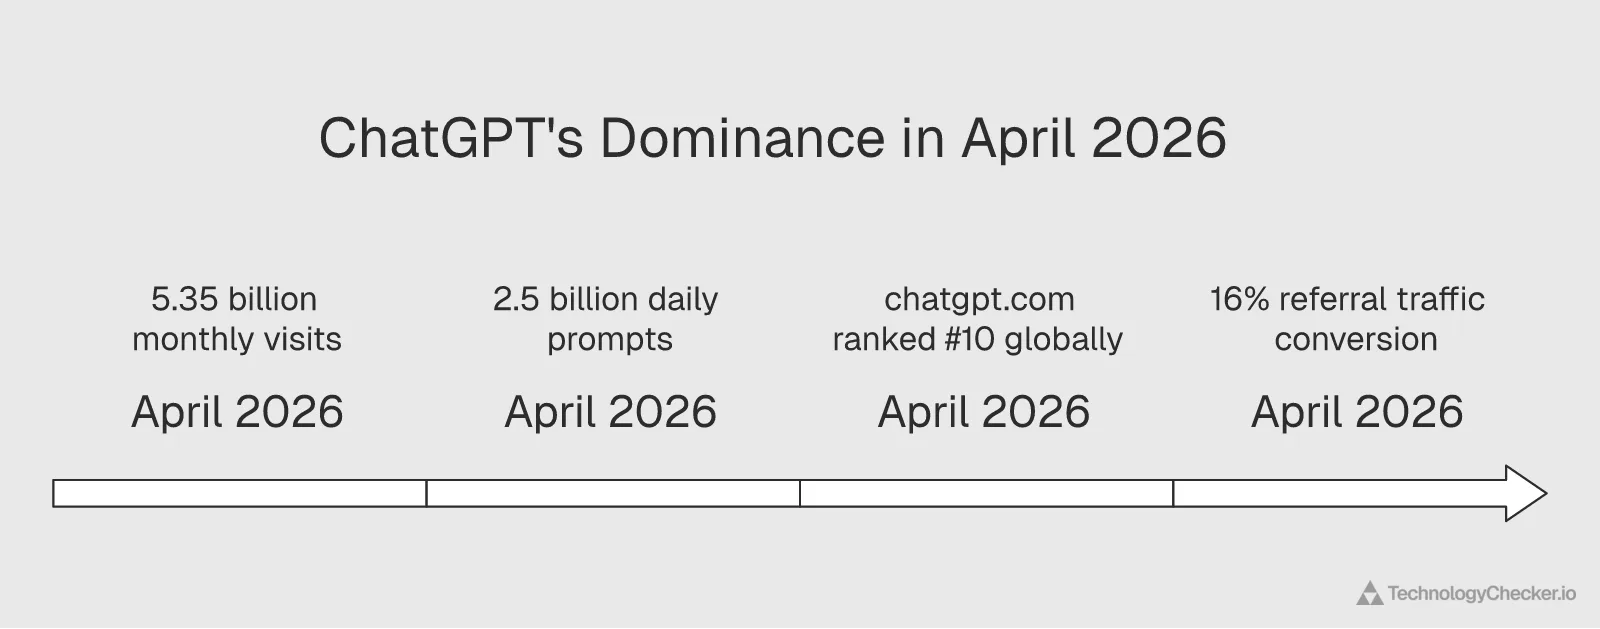
ChatGPT receives approximately 2.5 billion prompts per day globally. That breaks down to roughly 2.78 prompts per weekly active user per day, which suggests regular multi-turn sessions rather than single-question visits.
ChatGPT usage by country
The India numbers stand out. At 198 million users, they're nearly matching the US, and the 100% growth spike after ChatGPT Go launched at $4.50/month shows what happens when you price for the market.
According to Siana Marketing, the top five countries by ChatGPT user count are:
| Country | Users | Share of global traffic |
|---|---|---|
| United States | 205 million | 15–19% |
| India | 198 million | ~9.5% |
| Brazil | 69.6 million | — |
| Canada | 64.8 million | — |
| France | 51.6 million | — |
The US leads at 205 million users (~17% of the global total). India's user base doubled in a single month after OpenAI launched ChatGPT Go, a localized tier priced at $4.50/month — well below the $20 Plus subscription. If OpenAI replicates the ChatGPT Go model in other price-sensitive markets, the path to 1.5 billion users becomes realistic before 2028. For a country-level deep dive on younger adopters, see our Gen Z UK social media statistics 2026 — chatgpt.com is now #21 in the UK domain ranking.
Conversion rates: ChatGPT traffic vs Google
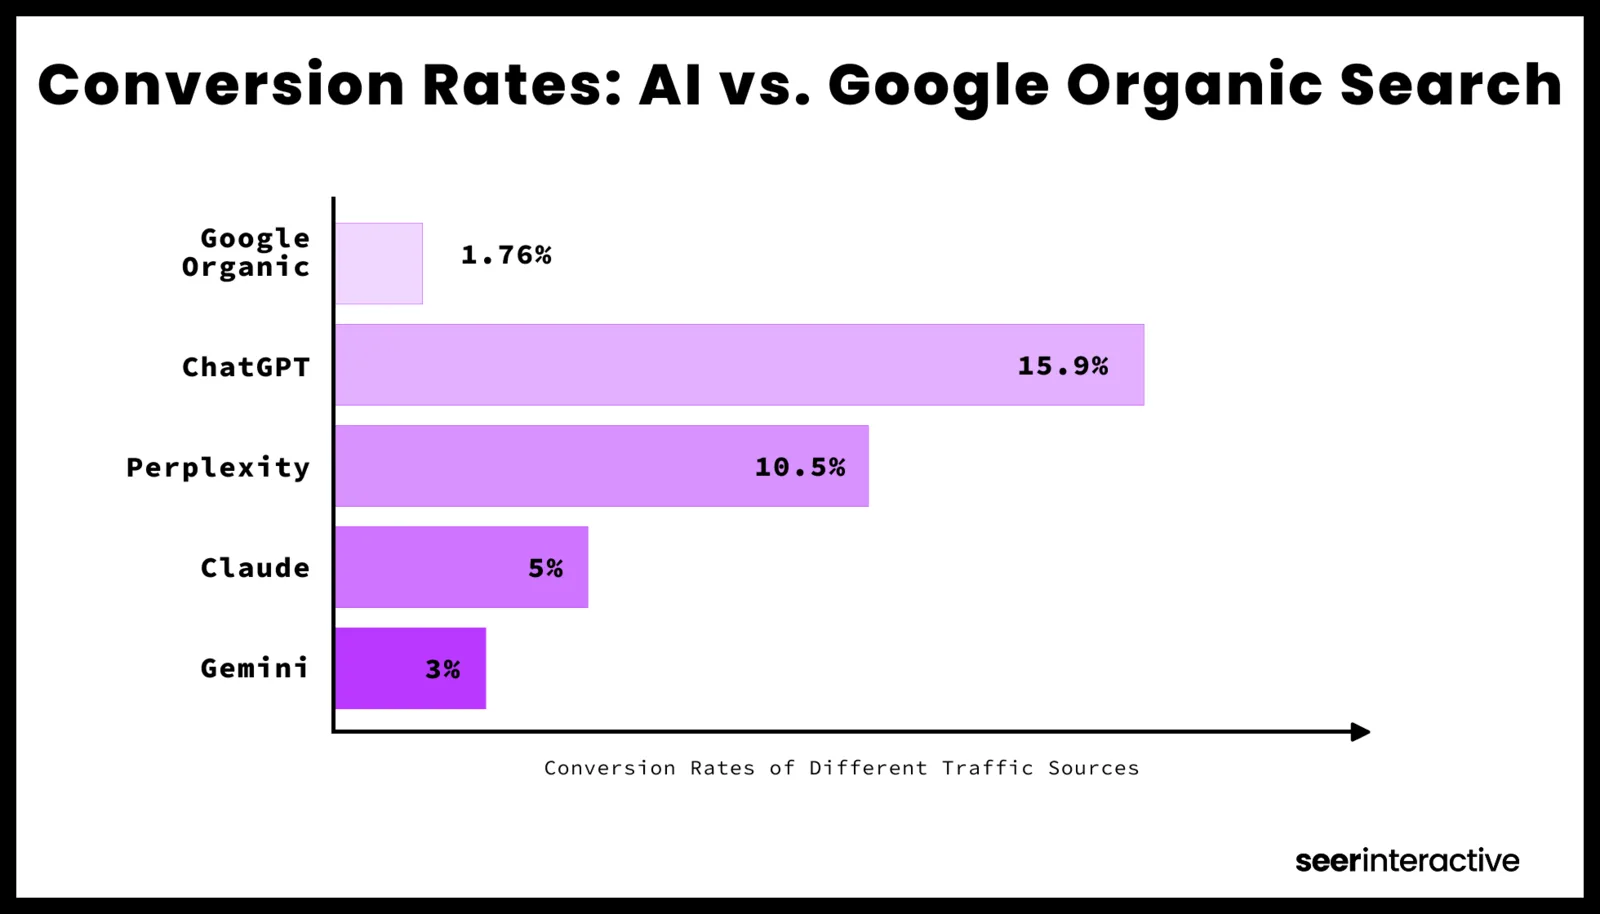
This is the stat B2B marketers should care most about. According to a Seer Interactive case study, traffic referred from ChatGPT converts at 16% compared to Google Organic's 1.8%. Nearly 9x higher.
The caveat: AI traffic still accounts for less than 1% of overall organic traffic. The volume is tiny. But the intent signal is strong — people who arrive at your site through a ChatGPT recommendation are far more likely to take action. For the broader split of where referrals come from, see our search engine market share 2026 breakdown — Google still drives 87.5% of organic referrals.
What to do: set up UTM tracking for AI-referred traffic today. Even if the volume is small, understanding how ChatGPT users behave on your site gives you an early advantage.
What Cloudflare's May 2026 crawl data reveals about ChatGPT

At TechnologyChecker we monitor crawl patterns and bot activity across millions of domains. The tables just below are the full-month May 2026 snapshot that led this article; keep reading to the June update, where the headline number reversed. When I re-pulled the Cloudflare Radar data on June 1, 2026 for the full month of May, three numbers stopped me cold, and one of them outright reverses the finding from this article's April version.
AI bot crawl volume (May 2026)
Top AI Crawlers May 2026: Googlebot 27%, Meta 13%, GPTBot 11%, Bytespider 10%
GPTBot overtook ClaudeBot to become the third-largest AI crawler in May 2026, holding 11.48% of AI bot HTTP requests vs ClaudeBot's 9.73% — a reversal from April, when ClaudeBot led 11.69% to 9.84%. Bytespider (ByteDance) nearly doubled its share to 10.25% (was 5.73% in April), passing ClaudeBot to become the #4 AI crawler. Googlebot remains the leader but lost about 3 points of share, falling from 30.28% to 27.26%.
Source: Cloudflare Radar · May 1 – May 31, 2026
| User agent | Share of AI bot requests (%) |
|---|---|
| Googlebot | 27.26% |
| Meta-ExternalAgent | 13.23% |
| GPTBot | 11.48% |
| Bytespider | 10.25% |
| ClaudeBot | 9.73% |
| Bingbot | 8.45% |
| Applebot | 7.01% |
| Amazonbot | 5.29% |
| Claude-SearchBot | 2.22% |
| Other | 5.08% |
- GPTBot (11.48%) overtook ClaudeBot (9.73%) on a full-month basis — reversing April, when ClaudeBot led
- Bytespider/ByteDance nearly doubled from 5.73% to 10.25%, passing ClaudeBot to take #4 overall
- Googlebot lost about 3 points of share (30.28% → 27.26%) but remains the AI crawl leader
- Anthropic's Claude-SearchBot entered the top 10 at 2.22% while OpenAI's OAI-SearchBot slipped out of it
These percentages represent each bot's share of total AI bot traffic observed by Cloudflare Radar across May 2026:
| Bot | Share of AI bot traffic | Operator | Δ from April |
|---|---|---|---|
| Googlebot | 27.26% | −3.02 pt | |
| Meta-ExternalAgent | 13.23% | Meta | −1.68 pt |
| GPTBot | 11.48% | OpenAI | +1.64 pt ⬆️ |
| Bytespider | 10.25% | ByteDance / DeepSeek | +4.52 pt ⬆️⬆️ |
| ClaudeBot | 9.73% | Anthropic | −1.96 pt ⬇️ |
| Bingbot | 8.45% | Microsoft | +0.41 pt |
| Applebot | 7.01% | Apple | −2.22 pt |
| Amazonbot | 5.29% | Amazon | +0.82 pt |
| Claude-SearchBot | 2.22% | Anthropic | new top-10 ⬆️ |
| Other | 5.08% | Mixed | — |
GPTBot alone (11.48%) outcrawled ClaudeBot (9.73%) across May, reversing April, when ClaudeBot led. The whole-operator picture is closer than that single-bot gap suggests: Anthropic's Claude-SearchBot jumped into the top 10 at 2.22%, so Anthropic's combined AI footprint (ClaudeBot + Claude-SearchBot, about 11.95%) is roughly level with OpenAI's, whose OAI-SearchBot slipped out of the top tier this month. So the honest takeaway is narrower than April's: OpenAI now runs the single largest dedicated training crawler, but the two labs' total crawl volumes are neck-and-neck.
The numbers above are a frozen 28-day window. The chart below is live — Cloudflare Radar updates it daily, so if you're reading this weeks after publication you'll see whether the GPTBot/ClaudeBot lead held.
GPTBot vs ClaudeBot vs Bytespider — the crossover story
GPTBot vs ClaudeBot vs Bytespider Crawl Share, Feb 23 – May 25, 2026
ClaudeBot held a steady 11–12% of AI bot traffic from late February through April, consistently ahead of a more volatile GPTBot. In May the picture flipped: ClaudeBot fell to roughly 9.4–9.7% and stayed there, while GPTBot averaged 11.48% for the month to take the lead. The bigger mover is Bytespider (ByteDance), which climbed steadily from 3.5% in late February to over 11% by late May, overtaking ClaudeBot to become the #4 AI crawler. By the final week the three were converging again — a reminder that crawl share is bursty and tied to training runs.
Source: Cloudflare Radar · February 23 – May 25, 2026
| Week | Weekly AI bot request share (%) |
|---|---|
| Feb 23 | 10.39% |
| Mar 2 | 11.26% |
| Mar 9 | 14.84% |
| Mar 16 | 12.9% |
| Mar 23 | 10.56% |
| Mar 30 | 8.92% |
| Apr 6 | 6.94% |
| Apr 13 | 11.91% |
| Apr 20 | 11.5% |
| Apr 27 | 9.94% |
| May 4 | 13.71% |
| May 11 | 12.64% |
| May 18 | 10.41% |
| May 25 | 9.48% |
- ClaudeBot led from February through April but fell to ~9.5% in May as GPTBot's full-month average (11.48%) pulled ahead
- Bytespider climbed from 3.5% (Feb) to over 11% (late May), overtaking ClaudeBot to become the #4 AI crawler
- Full-month May averages: GPTBot 11.48%, ClaudeBot 9.73%, Bytespider 10.25%
I've watched these three bots trade positions for months. The chart above plots their daily share from late February through the end of May.
Three patterns to notice:
- ClaudeBot led for most of Q1 and into April, finishing April at 11.69% to GPTBot's 9.84% and swapping the weekly lead with GPTBot along the way.
- During May, GPTBot pulled ahead and stayed there. Across the full month GPTBot averaged 11.48% to ClaudeBot's 9.73%, a 1.75-point lead built on OpenAI ramping training crawls while ClaudeBot volume eased off. May is the first full calendar month GPTBot has finished on top.
- Bytespider nearly doubled and passed ClaudeBot. ByteDance's crawler climbed from 5.73% in April to 10.25% in May, taking the #4 AI crawler spot overall. DeepSeek shares the Bytespider infrastructure, and the pipeline is scaling aggressively to catch the leaders.
One caveat: a single month is not a permanent order. Crawl volume is bursty and tied to training runs, so June could swing back. But the full-month April-to-May reversal is larger than week-to-week noise, and Bytespider's climb looks structural rather than a one-off burst.
June 2026 update: ClaudeBot swung back, and doubled
I flagged above that a single month is not a permanent order, and June proved it faster than I expected. When I re-pulled the full-month figures on July 3, 2026, the May GPTBot lead was gone. ClaudeBot did not just retake the top of the two-way race, it nearly doubled its share and became the second-largest AI crawler on Cloudflare's network overall, behind only Googlebot.
| Bot | June 2026 share | Operator | Δ from May |
|---|---|---|---|
| Googlebot | 25.18% | −2.08 pt | |
| ClaudeBot | 19.77% | Anthropic | +10.04 pt ⬆️⬆️ |
| Meta-ExternalAgent | 10.20% | Meta | −3.03 pt |
| GPTBot | 9.40% | OpenAI | −2.08 pt ⬇️ |
| Bingbot | 7.83% | Microsoft | −0.62 pt |
| Bytespider | 7.65% | ByteDance / DeepSeek | −2.60 pt ⬇️ |
| Applebot | 6.01% | Apple | −1.00 pt |
| Amazonbot | 5.41% | Amazon | +0.12 pt |
| Claude-SearchBot | 3.27% | Anthropic | +1.05 pt |
| Other | 5.27% | Mixed | — |
Three things stand out. First, the reversal is not a one-day blip: ClaudeBot sits at 19.8% across the full month, 20.4% over the trailing 28 days, and 20.4% over the last 7 days, so it held the lead all the way into early July. Second, at the operator level Anthropic has pulled decisively ahead. Add Claude-SearchBot to ClaudeBot and Anthropic's combined crawl footprint reaches about 23%, closing on Googlebot's 25% and running at roughly two and a half times OpenAI's GPTBot. In May I called the two labs neck-and-neck at the operator level; in June that is no longer true. Third, Bytespider, May's fastest riser, gave most of it back, falling from 10.25% to 7.65% and dropping from fourth to sixth. That is the bursty, training-run-driven pattern this article kept warning about, playing out in a single month.
There is a publisher angle to the swing. Anthropic already had the worst crawl-to-referral ratio in the table below by a wide margin, and doubling its crawl volume in June without a matching rise in referral traffic only widens that gap. If you allow AI crawlers on your site, the practical takeaway from June is that the bot taking the most from you and returning the least just got noticeably hungrier. Our robots.txt AI crawlers blocking report covers which bots to allow and which to restrict, and the broader year-over-year shift in what crawlers are after is in our AI crawler statistics.
Source: Cloudflare Radar ai/bots/summary/user_agent, full-month June 2026, cross-checked against the trailing 7-day and 28-day windows. Pulled 2026-07-03.
What AI crawlers actually do
What AI Crawlers Actually Do, May 2026: 52% Training, 9% Search
Training is the single largest purpose of AI crawling in May 2026, at 51.8% of requests — roughly flat from 51.5% in April. Mixed-purpose crawls (models that index for both training and retrieval) account for another 35.7%, down from 38.3%. Search rose to 9.3% of AI crawler traffic — real-time web retrieval on behalf of a user prompt — up from 7.5% in April. User-action crawls (browser-using agents) remain small at 2.6% but continue to grow.
Source: Cloudflare Radar · May 1 – May 31, 2026
| Label | Value |
|---|---|
| Training | 51.8% |
| Mixed Purpose | 35.71% |
| Search | 9.33% |
| User Action (agents) | 2.58% |
| Undeclared | 0.59% |
- Training crawls still outnumber search crawls more than 5-to-1 — AI remains largely extractive
- Search rose to 9.3% of AI bot traffic (from 7.5% in April) — the only category with a direct path to a referral
- Agent-driven user actions grew to 2.6%, the fastest category in proportional terms
Training is the single largest purpose of AI crawling in May 2026 at 51.8% of requests, roughly flat from 51.5% in April. By full-month June it eased to 47.2% as training slipped off a late-June peak and mixed-purpose crawls rose to 39.0%; our AI crawler statistics tracks that year-over-year shift. Mixed-purpose crawls (models that index for both training and retrieval) account for another 35.7%. The mover is search: 9.3% of AI crawler traffic is now classified as search (real-time web retrieval on behalf of a user prompt), up from 7.5% in April, which suggests AI assistant search products like ChatGPT Search, Perplexity, and Claude are growing their share of the crawl mix.
User-action crawls (browser-using agents like ChatGPT's Operator or Anthropic's computer use) remain small at 2.6%, up from 2.2% in April, but continue to be the fastest-growing crawl-purpose category.
The crawl-to-referral problem
AI Crawl-to-Refer Ratio 2026: Anthropic Crawls 11,122 Pages per 1 Referral
Anthropic's ClaudeBot crawled 11,122 pages for every 1 human visit Anthropic sent back to the web in the week of May 25 to June 1, 2026, per Cloudflare Radar's CRAWL_REFER_RATIO endpoint. That improved from 13,528:1 in April but is still the worst ratio of any major operator. OpenAI's ratio is 857:1, down from 1,252:1. Perplexity moved the wrong way, from 95:1 to 190:1. Google's traditional Googlebot operates at 5:1. This asymmetry is the structural reason publishers have started blocking AI crawlers in robots.txt.
Source: Cloudflare Radar · May 25 – June 1, 2026
| Operator | Pages Crawled per 1 Referral Sent |
|---|---|
| Anthropic | 11122:1 |
| OpenAI | 857:1 |
| Perplexity | 190:1 |
| Microsoft | 34:1 |
| Mistral | 27:1 |
| Yandex | 24:1 |
| Baidu | 12:1 |
| ByteDance | 9:1 |
| 5:1 | |
| DuckDuckGo | 1.5:1 |
- Anthropic crawls 11,122 pages for every 1 referral — still the worst ratio of any major operator, though down from 13,528:1 in April
- OpenAI's 857:1 ratio is roughly 170x worse than Google's traditional 5:1 search exchange
- Google (5:1) and DuckDuckGo (1.5:1) show what a healthy crawl-for-referral exchange looks like
- Perplexity worsened from 95:1 to 190:1 as its crawl volume outran its referrals
This is where the data gets uncomfortable for publishers. Cloudflare Radar tracks how much each AI platform crawls versus how much referral traffic it sends back. As of the May 25 to June 1, 2026 measurement window:
| Platform | Crawl-to-referral ratio | What it means |
|---|---|---|
| DuckDuckGo | 1.5:1 | Sends traffic back frequently |
| 5:1 | Established search model | |
| Mistral | 27:1 | Low return |
| Microsoft | 34:1 | Moderate return |
| Perplexity | 190:1 | Worsening |
| OpenAI | 857:1 | Very low return |
| Anthropic | 11,122:1 | Lowest return by far |
Anthropic crawls 11,122 pages for every 1 referral it sends back. OpenAI's 857:1 ratio is bad; Anthropic's is roughly 13x worse. Perplexity's 190:1 still looks healthy by comparison, though it worsened from 95:1 in April.
OpenAI's ratio has kept improving: it was 785:1 in October 2025, peaked at 1,851:1 in December 2025 as crawl volume spiked, dropped to roughly 1,252:1 in mid-April 2026, and reached 857:1 by late May 2026. That improvement correlates with OAI-SearchBot generating more outbound clicks as ChatGPT Search gains users.
Domain ranking context: where chatgpt.com actually sits
I pulled the Cloudflare Radar domain rank for chatgpt.com again on July 3, 2026. It returned rank 23, in the top-200 bucket (rank 24 on June 1). That's a high-traffic ranking — chatgpt.com is one of the busiest properties on the Cloudflare-visible internet — but it's not the "#10 globally, ahead of Amazon" figure that circulated in late 2025 statistics roundups. The methodology behind Cloudflare's domain ranking changed in early 2026, and chatgpt.com's bucket placement reflects current top-200 status, not its earlier reported top-20 position.
What it means for publishers: check your site's robots.txt and server logs. Our robots.txt AI crawlers blocking report breaks down exactly which bots to allow and which to restrict. Blocking a bot with a 13,528:1 ratio costs you almost nothing in referral traffic.
ChatGPT vs Claude vs Gemini vs Perplexity vs DeepSeek — May 2026 market share
GenAI Web Traffic Share 2025–2026: ChatGPT 87%→57%, Gemini 6%→25%
ChatGPT's share of generative AI web traffic fell from 87% in early 2025 to 56.72% by March 2026 — a 30-point drop in 12 months. Google Gemini surged from 6% to 25.46% over the same window, the largest share gain by any AI chatbot we've tracked. Anthropic's Claude grew from 1.4% to 6.02%, the third-largest gainer. The pattern: ChatGPT still leads, but the AI chat market is rapidly diversifying.
Source: SimilarWeb · March 2025 – March 2026
| Quarter | GenAI web traffic share (%) |
|---|---|
| Mar 2025 | 87% |
| Jun 2025 | 78% |
| Sep 2025 | 72% |
| Dec 2025 | 64% |
| Mar 2026 | 56.72% |
- ChatGPT lost 30 points of web traffic share in 12 months — still #1 but no longer dominant
- Gemini's 6% → 25.46% climb is the largest share gain by any chatbot in the SimilarWeb dataset
- Claude quadrupled its web share from 1.4% to 6.02% — third-largest gainer
The Cloudflare Radar generative AI service category provides a clean ranked view of which AI services attract the most traffic on the Cloudflare network. The ranking is updated daily. Here's the picture as of June 1, 2026.
Generative AI service rankings (June 1, 2026)
Generative AI Service Rankings, June 1, 2026: ChatGPT Still #1, Gemini Reclaims #4
ChatGPT held the #1 generative AI ranking on June 1, 2026 — unbroken since at least Feb 23, 2026, roughly 98 days. Claude is locked at #2 and Perplexity at #3. Google Gemini reclaimed #4 from DeepSeek (now #5) in late May. Character.AI sits at #6, GitHub Copilot at #7, and Grok/xAI slipped to #8. Doubao (ByteDance), which first entered the top 10 in May, held its place into June at #10.
Source: Cloudflare Radar · June 1, 2026
| Service | Reverse rank (10 = #1) |
|---|---|
| ChatGPT | 10 |
| Claude | 9 |
| Perplexity | 8 |
| Google Gemini | 7 |
| DeepSeek | 6 |
| Character.AI | 5 |
| GitHub Copilot | 4 |
| Grok / xAI | 3 |
| Suno AI | 2 |
| Doubao | 1 |
- ChatGPT has held #1 since at least Feb 23, 2026 — still #1 on June 1, about 98 days
- Google Gemini reclaimed #4 from DeepSeek in late May
- Doubao (ByteDance) held the top 10 into June after debuting in May
| Rank | Service | Operator | Notable |
|---|---|---|---|
| 1 | ChatGPT | OpenAI | #1 since at least Feb 23, 2026 |
| 2 | Claude | Anthropic | Locked at #2 across our tracking window |
| 3 | Perplexity | Perplexity | Locked at #3 across our tracking window |
| 4 | Google Gemini | Reclaimed #4 from DeepSeek in late May | |
| 5 | DeepSeek | DeepSeek | Slipped to #5 behind Gemini |
| 6 | Character.AI | Character.AI | Up to #6 |
| 7 | GitHub Copilot | Microsoft | Stable |
| 8 | Grok / xAI | xAI | Slipped to #8 |
| 9 | Suno AI | Suno | AI music platform |
| 10 | Doubao | ByteDance | Held the top 10 into June |
ChatGPT has held #1 since at least Feb 23, 2026, and it was still #1 when we re-checked on June 1, about 98 days later. Claude and Perplexity have held #2 and #3 across that window without a single position change. The movement is below them: Google Gemini reclaimed #4 from DeepSeek in late May, and Doubao (ByteDance), which first cracked the top 10 in May, held its place into June.
The SimilarWeb web-traffic decline you should actually pay attention to
According to SimilarWeb's March 2026 data, ChatGPT's share of generative AI web traffic fell from 77.43% in early 2025 to 56.72% by March 2026 — a 20-point drop. Gemini surged from 6% to 25.46% over the same window. Claude grew from 1.4% to 6.02%.
That's the second-largest market share rebalancing in any consumer technology category in the last decade, behind only the iOS/Android share war of 2009-2012. But the rebalancing is uneven by surface:
- On web traffic (SimilarWeb): ChatGPT lost 20+ points to Gemini, mostly. The Gemini surge is real.
- On the Cloudflare network ranking (live data): ChatGPT held #1 every day, Gemini slipped to #5. The two datasets are measuring different things.
- On enterprise win rates: Claude reportedly wins ~70% of head-to-head enterprise deals against OpenAI, per SaaStr's coverage.
I'm cautious about the SimilarWeb decline framing because Gemini is pre-installed on Android and Workspace, which inflates "web traffic" share for users who didn't actively choose it. The Cloudflare ranking, which reflects what users actively go to, tells a different story.
The dual-platform reality
Here's the stat that reframes the whole competition narrative. According to AI Business Weekly, 79% of OpenAI users also pay for Anthropic. That confirmed what I've been seeing in our stack data at TechnologyChecker. Enterprises aren't picking one AI vendor — they're running ChatGPT and Claude side by side.
eMarketer reports that Claude users spend 34.7 minutes per daily session — the highest engagement of any AI platform. That session depth, combined with Claude's enterprise win rate, explains why Anthropic can charge premium prices with a smaller user base.
For practical purposes: if you're integrating with one AI platform, ChatGPT's user base offers the largest addressable audience. But Claude's growth trajectory and enterprise win rate make dual-platform support increasingly important.
Head-to-head: ChatGPT vs Claude for developers
Based on benchmark data and developer feedback across forums, here's where each platform stands for technical use cases as of May 2026:
| Dimension | ChatGPT (GPT-4o / o1) | Claude (3.5 Sonnet / Opus) |
|---|---|---|
| Code generation | Strong across languages | Stronger for long-context code |
| Reasoning (math/logic) | o1 excels | Competitive, slightly behind o1 |
| Writing quality | Good, formulaic at times | More natural, preferred by writers |
| Context window | 128K tokens | 200K tokens (advantage) |
| API pricing | $5–15 per 1M tokens | $3–15 per 1M tokens |
| User base | 900M WAU | Growing rapidly (#2 in Gen AI) |
| Web crawl footprint (May 2026) | 11.48% (GPTBot) | 9.73% (ClaudeBot) |
For B2B SaaS teams: build for ChatGPT's user base, test against Claude's quality, and monitor DeepSeek and Doubao for cost-optimized alternatives.
Enterprise adoption and industry use cases

Consumer usage drives headlines. Workplace integration drives revenue. Here's what the enterprise data looks like as of May 2026.
According to Christian & Timbers, ChatGPT has been adopted by 93% of Fortune 500 companies in some capacity. That figure includes everything from individual employee use to department-wide deployments to formal ChatGPT Enterprise contracts.
The 7 million workplace seats number tells the real story — that's 9x year-over-year growth in enterprise seats, way faster than the consumer growth rate. OpenAI now counts 1.5 million business clients globally, with over 1 million of those outside the US. Enterprise adoption grew 340% year-over-year by OpenAI's own accounting.
PwC deployed 100,000+ ChatGPT Enterprise seats. Morgan Stanley and Coca-Cola are also named enterprise adopters. These aren't pilot programs anymore — they're organization-wide rollouts.
The top enterprise use cases from OpenAI's published workplace adoption study: data analysis and reporting (60% of enterprise users), content generation including text and images (51%), personalization and customer experience (42%), code generation and debugging (~35% among developer teams), and internal knowledge management (~28%).
Industry-specific adoption patterns
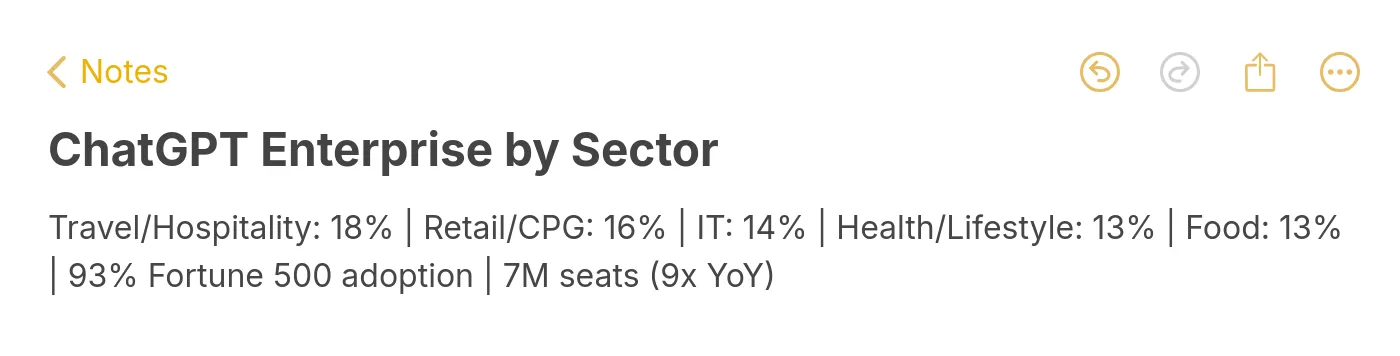
Based on TechnologyChecker's technology detection across 50M+ domains, the top adopting sectors break down as follows: travel and hospitality leads at 18%, followed by retail and CPG at 16%, IT at 14%, health and lifestyle at 13%, and food at 13%. That travel/hospitality number didn't surprise me — those teams deal with massive volumes of customer queries and content translation, exactly the tasks where ChatGPT saves the most time.
Software and technology leads the IT portion by a wide margin. Nearly every SaaS product we scan shows some form of AI integration — OpenAI API calls, embedded ChatGPT-powered features, or AI-assisted documentation.
The SaaS integration wave
According to SQ Magazine, 42% of new SaaS platforms with AI capabilities launched in 2025 rely on OpenAI models. That includes GPT-4o, the Assistants API, and the embeddings API. When nearly half of all new AI-enabled products choose your API, you've become infrastructure.
Developer and API adoption
OpenAI now has 3 million active developer accounts, a 5x increase since 2022. According to Index.dev, 1.3 million US developers alone have created projects on OpenAI's platform.
At TechnologyChecker, OpenAI API signatures show up in about 3x more sites than they did in January 2025. The 3 million developer figure matches what we're seeing in the wild — that's roughly the same number of developers who use Stripe's API. OpenAI has reached "developer infrastructure" scale in three years, which took most payment and cloud platforms a decade.
Key takeaways for AI leaders
Three patterns from the May 2026 data matter most for 2026 planning.
1. The AI-crawler lead is volatile, and right now Anthropic holds it. GPTBot edged ahead in May (11.48% vs 9.73%), but by June ClaudeBot swung back and nearly doubled to 19.8% while GPTBot eased to 9.4%. Add Claude-SearchBot and Anthropic's combined crawl footprint (about 23%) trails only Googlebot's, at roughly two and a half times OpenAI's. Crawl share is a leading indicator of which models will have the freshest, broadest training data six months out, but it moves month to month with each lab's training runs, so read it as a trend rather than a fixed ranking. Bytespider, May's big mover, gave most of it back and fell from fourth to sixth.
2. ChatGPT's dominance is real but more contested than the headline numbers suggest. ChatGPT held #1 in the Cloudflare GenAI category from Feb 23 through July 3, and has 900M weekly users. But SimilarWeb shows ChatGPT's web traffic share fell from 77% to 57% in 12 months. The two datasets measure different things — Cloudflare reflects what users actively visit, SimilarWeb captures broader web behavior including Android-default Gemini sessions. Pay attention to which dataset matches your decision context. For consumer engagement, the Cloudflare ranking matters more.
3. Mobile and enterprise are the growth vectors to watch. The 673% growth in mobile app revenue, 93% Fortune 500 adoption, and 7 million workplace seats (9x YoY growth) signal that ChatGPT's next phase of growth won't come from more consumer users — it'll come from deeper enterprise integration, geographic expansion through localized pricing like ChatGPT Go, and developer ecosystem lock-in through the 3 million active API accounts.
For sales and GTM teams specifically: understanding which technologies your prospects use — and how they're integrating AI tools — gives you a genuine competitive edge. At TechnologyChecker, we track these adoption signals across 40,000+ technologies and 50M+ domains, turning raw detection data into prospect intelligence that connects directly to buying intent.
If you want to see which companies in your target market are actively adopting AI tools, start a technology lookup to identify prospects whose technology stack signals readiness for your product.
Methodology and data sources
I first refreshed these statistics on June 1, 2026 (full month of May) and re-verified the Cloudflare Radar figures on July 3, 2026 (full month of June), from 25+ sources including:
- Cloudflare Radar for AI bot crawl share, crawl purpose breakdown, generative AI service rankings, and chatgpt.com domain ranking (live data, refreshed for this June 1 update)
- OpenAI's official announcements for weekly active users (900M, Feb 27, 2026), paying subscribers (50M), annualized revenue ($25B), and the $122B capital raise / $730B valuation
- TechCrunch, 9to5Mac, eWEEK for coverage of OpenAI's user milestone announcements
- PYMNTS, Sacra for revenue and ARR breakdowns
- SimilarWeb for web traffic share (ChatGPT 56.72%, Gemini 25.46%, Claude 6.02% as of March 2026)
- Sensor Tower for mobile app downloads and revenue (including the 2025 $1.35B mobile revenue figure and March 2026 US platform-level data)
- Christian & Timbers, OpenAI's workplace study, SQ Magazine, Index.dev for enterprise and developer adoption
How I verified the data: every Cloudflare Radar number was pulled live via the Radar API on June 1, 2026, with no third-party summaries. External claims (user counts, revenue, market share) were cross-referenced against at least two independent sources before being included. Where sources disagreed, I noted both figures and explained the methodological difference (see, for example, the Cloudflare vs SimilarWeb framing of market share).
Limitations: Cloudflare Radar data reflects traffic through Cloudflare's infrastructure, which while extensive, doesn't capture 100% of global web traffic. User count estimates from non-OpenAI sources use different methodologies and may not be directly comparable. Revenue figures for OpenAI are based on reported annualized run-rates, not audited financials. Market share percentages differ significantly across sources depending on whether they measure unique users, session volume, or app downloads — I've explicitly noted which surface each figure measures.
Last updated: July 3, 2026. The June crawl data reversed May's headline: ClaudeBot retook the AI-crawler lead from GPTBot and nearly doubled its share, so the crawl figures and framing were updated throughout, while the May snapshot is kept as the prior layer. Product and revenue figures are unchanged from OpenAI's most recent official statements. Next planned update: early August 2026.
About the author: Emma Davies is a Data Analyst at TechnologyChecker with 5 years of experience in technology data analysis and prospect intelligence. She holds a BSc in Data Science from Cardiff University along with Google Data Analytics and Tableau certifications. Her work involves analyzing technology adoption patterns across 10M+ domains to identify trends and buying signals for sales teams.
Emma Davies
Data Analyst

