Top 20 Technologies Used in the Software Development Industry (2026): Data from 29.9M Domains
What technologies do software development companies actually use? We analyzed 176,114 software development domains and broke down adoption by company size: small businesses, mid-market, and enterprise.
Published •17 min read

Among the 176,114 software development domains we analyzed, jQuery still holds the top spot as the most used library at 48.25%, despite the industry building the frameworks meant to replace it. Google Tag Manager (34.86%) and Google Analytics (33.14%) follow. But the real story is in the size-based breakdowns: React adoption nearly doubles from small companies (23.19%) to enterprise (53.31%), and Amazon cloud usage jumps from 28.67% to 56.36% at scale. This ranking draws from TechnologyChecker.io's scan of 29.9M domains cross-referenced with 25.4M LinkedIn company records.
Key Findings
- jQuery remains the most-used library in software development at 48.25%. React (22.94% overall) surges to 53.31% at enterprise scale
- Small businesses favor Google AdSense (5.77%) for advertising, while mid-market and enterprise companies lean toward LinkedIn Ads (21.78% and 29.76% respectively)
- Cloud adoption diverges sharply by company size. Amazon's IaaS sits at 28.67% among small firms but jumps to 56.36% at enterprise scale
- React adoption nearly doubles from small (23.19%) to enterprise (53.31%), making it the dominant JavaScript framework at scale
- 23.5% of software development companies in our geographic data are US-based, with China (71,296 companies) and the UK (32,414) forming the next largest clusters
How We Conducted This Research
TechnologyChecker.io's technology detection database powers this analysis. We scanned 29.9M domains, tracking more than 40,000 technologies, and joined that detection data with 25.4M LinkedIn company records to identify industry classifications and company sizes.
Our sample includes 176,114 domains classified under Software Development based on LinkedIn's industry tags. We segmented companies into three tiers using LinkedIn's self-reported employee count: small businesses (1-50 employees), mid-market (51-1,000 employees), and enterprise (1,000+ employees). Technologies are grouped by function (analytics, JavaScript frameworks, cloud infrastructure, email services, and so on) so you can compare tools within the same category across company sizes.
Data was collected in March 2026. Our detection covers front-end libraries, server-side technologies, DNS configurations, email infrastructure, and third-party scripts. A few limitations worth noting: LinkedIn's industry classifications are self-reported by companies, and employee counts may lag behind actual headcount. Some domains belong to subsidiaries or regional offices, so a single parent company can appear more than once.
Top 20 Technologies Used in the Software Development Industry
Here's what 176,114 software development companies are running on their domains, ranked by adoption rate.
| Rank | Technology | Category | Adoption Rate | Domains Detected |
|---|---|---|---|---|
| 1 | jQuery | JavaScript Libraries | 48.25% | 31,964 |
| 2 | Google Webmaster | SEO Tools | 39.78% | 26,353 |
| 3 | Apple Mobile Web Clips Icon | Accessibility Tools | 39.26% | 26,004 |
| 4 | Google Font API | Font Services | 37.83% | 25,060 |
| 5 | Intersection Observer | JavaScript Libraries | 36.06% | 23,884 |
| 6 | Google Tag Manager | Tag Management | 34.86% | 23,092 |
| 7 | HSTS | Security Tools | 33.16% | 21,967 |
| 8 | Google Analytics | Web Analytics | 33.14% | 21,955 |
| 9 | Social Media Marketing | 32.33% | 21,419 | |
| 10 | US Privacy User Signal Mechanism | Cookie Consent & Compliance | 30.82% | 20,414 |
| 11 | Social Media Marketing | 30.69% | 20,333 | |
| 12 | Global Site Tag | Web Analytics | 30.66% | 20,307 |
| 13 | Amazon | Cloud / IaaS | 28.36% | 18,785 |
| 14 | Google Apps for Business | Email Services | 28.21% | 18,690 |
| 15 | RSS | Feed Readers & RSS | 25.18% | 16,679 |
| 16 | Nginx | Web Servers | 24.92% | 16,510 |
| 17 | core-js | JavaScript Libraries | 23.44% | 15,526 |
| 18 | Font Awesome | Font Services | 23.19% | 15,359 |
| 19 | React | JavaScript Frameworks | 22.94% | 15,196 |
| 20 | Social Media Marketing | 22.58% | 14,956 |
jQuery remains present on 48.25% of domains, which may surprise developers who've written it off. W3Techs data from March 2026 puts jQuery on 77.8% of all websites globally. Our 48.25% figure for software development companies actually runs below the web-wide average. For many companies, jQuery persists in legacy WordPress themes, third-party widgets, and marketing sites that haven't been rebuilt. Google Tag Manager at 34.86% shows that even engineering-heavy organizations rely on tag management for marketing instrumentation. LinkedIn at 32.33% fits an industry obsessed with hiring. React ranks 19th overall at 22.94%, but as the category breakdowns reveal, its adoption rate doubles at larger companies. Amazon cloud infrastructure appears at rank 13 (28.36%), and Nginx at rank 16 (24.92%) rounds out the infrastructure choices.
Top JavaScript Libraries in Software Development
JavaScript libraries power front-end development across software companies of every size. This category captures both utility libraries and browser API polyfills.
| Technology | Small Biz | Mid-Market | Enterprise |
|---|---|---|---|
| jQuery | 47.1% | 71.12% | 69.72% |
| Intersection Observer | 36.89% | 58.96% | 63.09% |
| core-js | 23.05% | 48.14% | 57.62% |
| Moment.js | 9.05% | 35.55% | 44.06% |
| jQuery 3.7.1 | 17.18% | 32.98% | 39.22% |
| JavaScript Modules | 15.32% | 28.81% | 43.01% |
| Lodash | — | 27.31% | 43.22% |
| Facebook for Websites | 9.4% | 25.73% | 31.34% |
| Lightbox | 11.52% | — | — |
| imagesLoaded | 8.7% | — | — |
| jQuery UI | — | — | 36.8% |
| Facebook SDK | — | 23.68% | — |
| jQuery 3.5.1 | — | 22.56% | 33.12% |
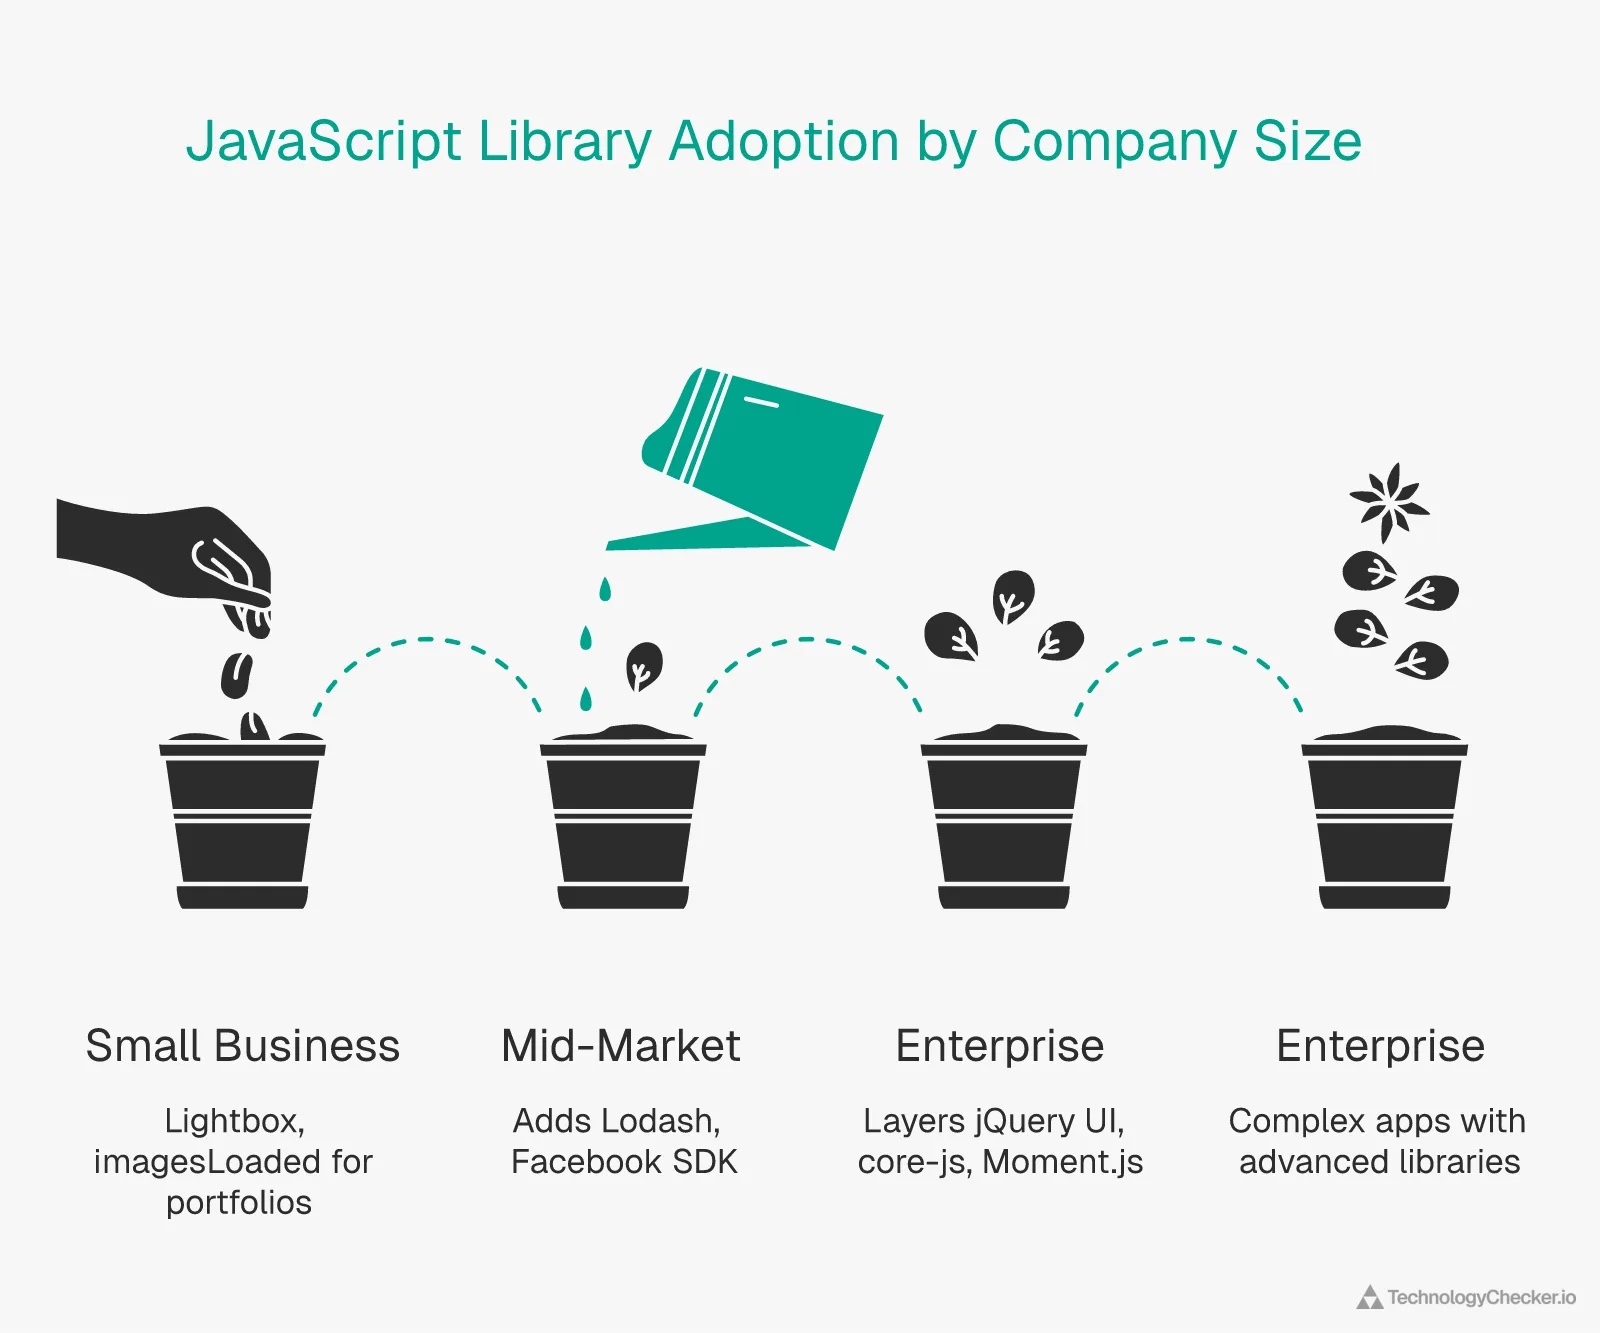
jQuery leads across all three segments, but small businesses sit at 47.1% while mid-market and enterprise hover around 70%. Larger companies aren't abandoning jQuery. They're layering it into more complex applications alongside libraries like core-js (57.62% at enterprise vs. 23.05% at small) and Lodash (43.22% at enterprise, absent from the small segment's top 10).
Moment.js shows a clear enterprise tilt: 44.06% adoption among large companies vs. just 9.05% for small businesses. Enterprise applications deal with multiple time zones and localization, problems that small apps rarely face. Lightbox and imagesLoaded, by contrast, appear only in the small business segment, typically tied to WordPress themes and portfolio sites. jQuery UI (36.8%) is enterprise-only, likely because large organizations rely on its form widgets and interaction patterns in internal tools.
Top Web Analytics Tools in Software Development
Analytics matters for software companies tracking user behavior, conversion funnels, and product usage. The tool mix shifts noticeably as companies grow.
| Technology | Small Biz | Mid-Market | Enterprise |
|---|---|---|---|
| Google Analytics | 33.32% | 62.12% | 61.72% |
| Global Site Tag | 30.97% | 56.24% | 57.2% |
| Google Analytics 4 | 21.08% | 45.37% | 47.63% |
| Google Universal Analytics | 12.94% | 30.03% | 40.17% |
| Cloudflare Radar | 5.82% | 39.58% | 59.73% |
| Facebook Pixel | 6.22% | 18.62% | 22.08% |
| Hotjar | — | 17.3% | 23.24% |
| Microsoft Clarity | — | 15.35% | 23.34% |
| Bing Universal Event Tracking | — | 14.18% | 26.92% |
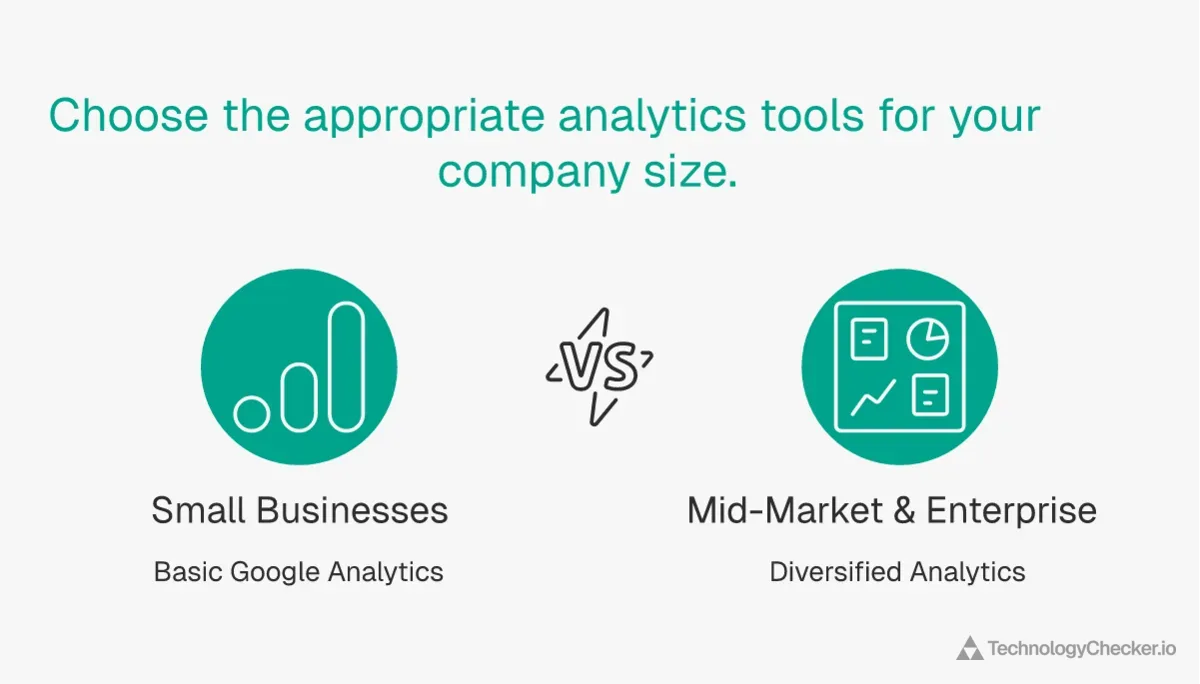
Google Analytics dominates across all sizes, but small businesses run it at just 33.32% compared to 62.12% at mid-market. Cloudflare Radar shows the starkest size gap, jumping from 5.82% (small) to 59.73% (enterprise).
Microsoft Clarity and Hotjar both surface only in mid-market and enterprise segments, each around 15-23%. These behavior analytics tools require dedicated analyst time to review session recordings and heatmaps, resources that smaller shops often lack. At the enterprise tier, companies using Adobe Analytics like Walmart and Siemens invest $50K+/year in cross-channel analytics — a category that doesn't register in small business data at all. Bing Universal Event Tracking at 26.92% enterprise adoption suggests that larger software companies diversify their ad spend beyond Google's ecosystem.
Top Cloud / IaaS Platforms in Software Development
Cloud infrastructure is where company size creates the biggest adoption gaps. Larger companies need more compute, more regions, and more redundancy.
| Technology | Small Biz | Mid-Market | Enterprise |
|---|---|---|---|
| Amazon | 28.67% | 49.53% | 56.36% |
| 10.11% | 22.95% | 34.81% | |
| Google Cloud | 9.73% | 22.33% | 33.96% |
| Amazon Virginia Region | 9.22% | 29.05% | 41.85% |
| Amazon Oregon Region | — | 14.63% | 28.71% |
| Digital Ocean | 3.97% | — | — |
| Google Cloud Global Multi-Region | 4.37% | — | 22.29% |
| Microsoft | — | 13.41% | 29.13% |
| Microsoft Azure | — | — | 25.13% |
| Amazon Ohio Region | — | — | 21.24% |
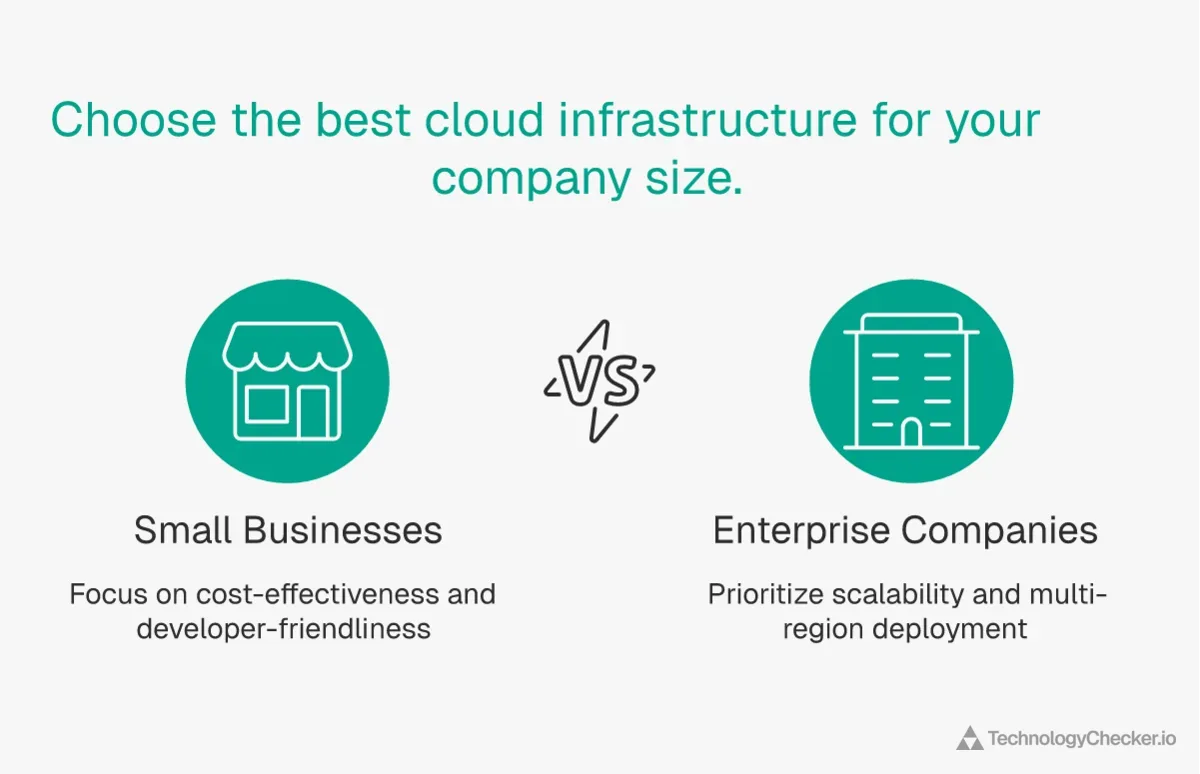
Amazon's IaaS presence doubles from small businesses (28.67%) to enterprise (56.36%). Synergy Research Group reported the global cloud market hit $330 billion in 2024, with AWS holding 30% market share, Azure at 21%, and Google Cloud at 12%. Our data shows these ratios hold within software development specifically, with Amazon leading at every tier. The pattern is even steeper for specific regions: Amazon Virginia Region goes from 9.22% to 41.85%, and Amazon Oregon Region doesn't register for small businesses at all but reaches 28.71% at enterprise. That's multi-region deployment in action. Enterprise companies distribute workloads across data centers for redundancy and latency optimization.
Digital Ocean (3.97%) appears exclusively in the small business segment. It's a developer-friendly, cost-effective option that makes sense for startups and small teams but rarely meets enterprise compliance and support requirements. Microsoft Azure only shows up at enterprise level (25.13%). Organizations already on Microsoft-heavy stacks choose Azure to keep everything under one roof. The Google Cloud platform grows steadily from 9.73% (small) to 33.96% (enterprise), making it the second-most-popular cloud provider at every tier.
Top JavaScript Frameworks in Software Development
JavaScript frameworks power the interactive front-end experiences that software companies build for their products and marketing sites.
| Technology | Small Biz | Mid-Market | Enterprise |
|---|---|---|---|
| React | 23.19% | 42.41% | 53.31% |
| styled-components | — | 18.61% | 21.98% |
| Vue | 5.71% | 14.79% | 23.24% |
| AngularJS | — | 12.65% | 26.29% |
| GSAP | 4.29% | 12.63% | — |
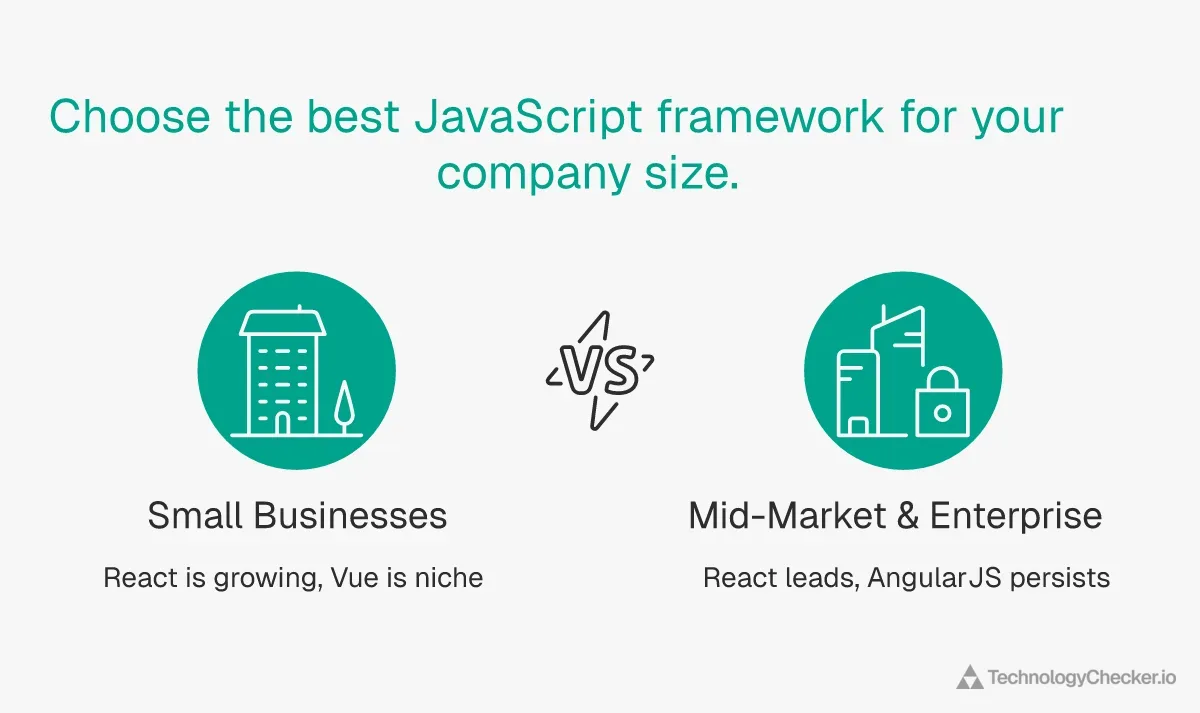
React is the clear winner at every tier, and the gap widens with company size: 23.19% for small businesses, 42.41% for mid-market, and 53.31% for enterprise. The Stack Overflow 2025 Developer Survey reported React at 44.7% among professional developers. Our enterprise figure of 53.31% suggests software development companies adopt React at even higher rates than the general developer population. More than half of enterprise software development companies run React on their domains.
AngularJS is almost invisible among small businesses but reaches 26.29% at enterprise. Many large organizations adopted Angular years ago for internal tools and customer-facing applications, and migration is slow when you have millions of lines of code. Vue grows steadily from 5.71% (small) to 23.24% (enterprise), making it a reliable second choice across the board. GSAP, the animation library, shows up at small (4.29%) and mid-market (12.63%) but drops out of the enterprise top results, where animation-heavy marketing sites are less common than complex web applications. On the build tooling side, companies using Vite now span 93,000+ domains — including Samsung, Nike, and JP Morgan Chase — after surpassing Webpack in npm downloads in July 2025.
Top Email Services in Software Development
Email infrastructure underpins business communication for every software company. The provider split here reflects broader platform allegiances.
| Technology | Small Biz | Mid-Market | Enterprise |
|---|---|---|---|
| Google Apps for Business | 29.72% | 38.48% | 32.6% |
| Microsoft Exchange Online | 15.26% | 30.52% | 30.6% |
| Office 365 Mail | 14.78% | 29.71% | 26.39% |
| GoDaddy Email | 4.11% | — | — |
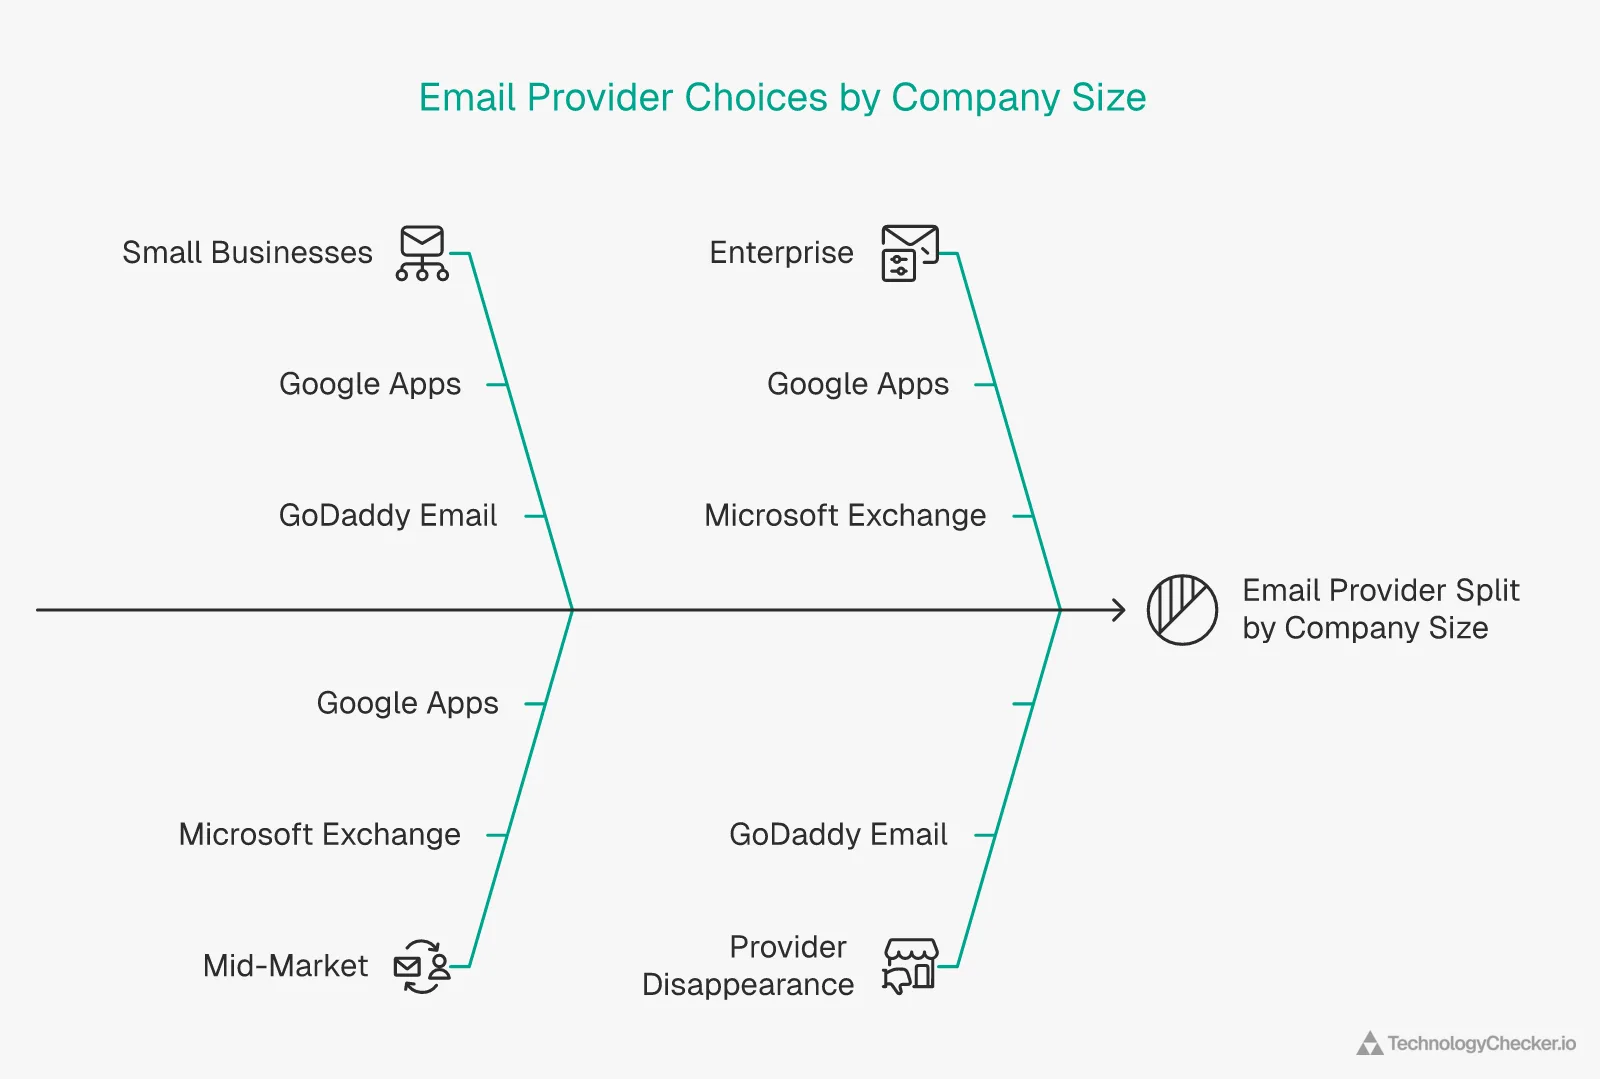
Google Apps for Business leads at small (29.72%) and mid-market (38.48%) but dips slightly at enterprise (32.6%). Microsoft Exchange Online closes the gap as companies grow: 15.26% at small, 30.52% at mid-market, and 30.6% at enterprise. This tracks with what you'd expect. Larger organizations often standardize on Microsoft's ecosystem for compliance, Active Directory integration, and admin controls.
GoDaddy Email at 4.11% is a small-business-only phenomenon. Companies that registered their domain through GoDaddy often start with bundled email before eventually migrating to Google Workspace or Microsoft 365. The absence of GoDaddy Email from mid-market and enterprise data confirms that migration pattern.
Top Social Media Marketing Tools in Software Development
Social media integration on company domains reflects how software firms promote their products and engage their developer communities.
| Technology | Small Biz | Mid-Market | Enterprise |
|---|---|---|---|
| 32.62% | 62.92% | 63.2% | |
| 30.78% | 57.82% | 60.78% | |
| 21.99% | 50.51% | 58.25% | |
| Facebook Sharer | 3.66% | 14.57% | 27.13% |
LinkedIn tops every segment, which fits a B2B-heavy industry. The gap is what matters: small businesses integrate LinkedIn on just 32.62% of their domains, while mid-market and enterprise sit above 62%. The same jump holds for Facebook (30.78% to 60.78%) and Twitter (21.99% to 58.25%).
Facebook Sharer is the most size-dependent tool in this category. It climbs from 3.66% at small businesses to 27.13% at enterprise. Dedicated share buttons on individual pages are more common on content-heavy enterprise sites with blog posts, documentation, and case studies that benefit from social distribution. Smaller companies typically have fewer content pages and less reason to invest in per-page sharing widgets. Beyond social sharing, community engagement tools like Disqus — used by NVIDIA, Penn Medicine, and 28,000+ other companies that use Disqus — remain common on developer blogs and documentation sites.
Top Advertising Platforms in Software Development
Advertising strategy flips by company size. Small software companies and enterprise firms run entirely different playbooks.
| Technology | Small Biz | Mid-Market | Enterprise |
|---|---|---|---|
| Google AdSense | 5.77% | — | — |
| Facebook Conversion Tracking | 5.55% | 15.07% | — |
| AdBlock Acceptable Ads | 4.6% | — | — |
| Google Adsense for Domains | 4.59% | — | — |
| LinkedIn Ads | — | 21.78% | 29.76% |
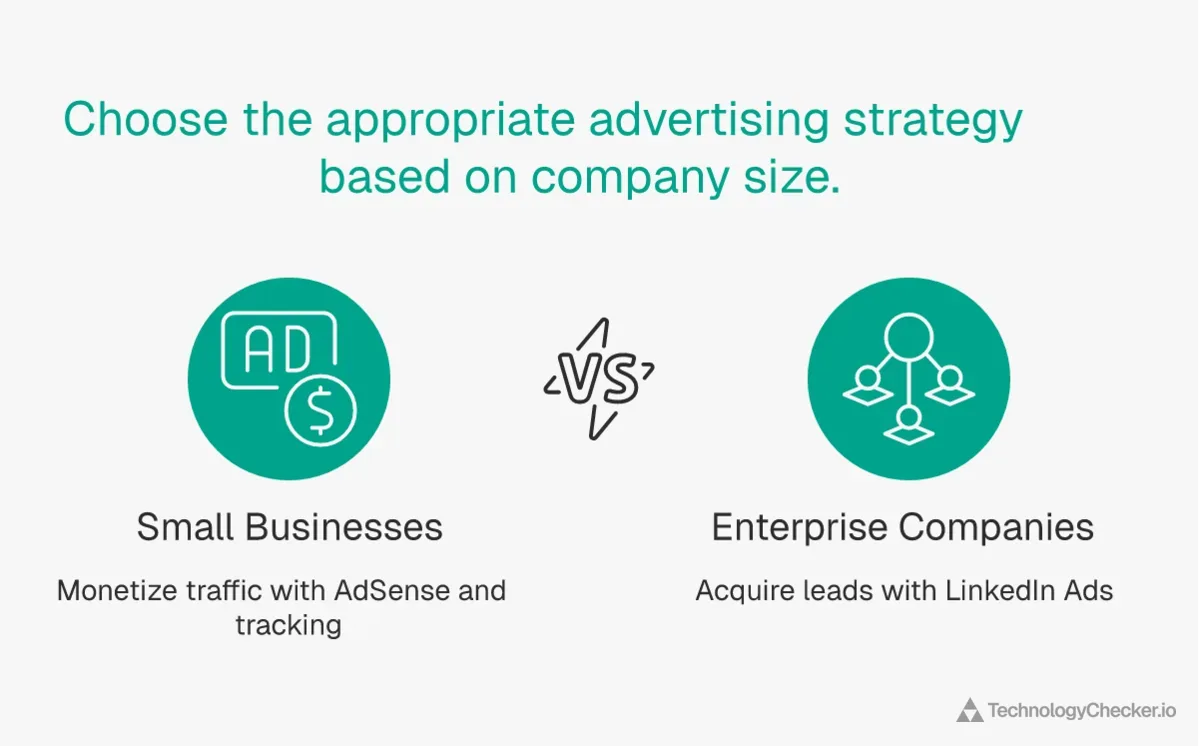
The split here is binary. Small businesses run Google AdSense (5.77%) and Google AdSense for Domains (4.59%) to monetize traffic directly. Enterprise companies don't appear to use AdSense at all. Instead, they run LinkedIn Ads at 29.76% to generate B2B leads.
LinkedIn Ads is absent from the small business top results entirely but dominates mid-market (21.78%) and enterprise (29.76%). Dreamdata's 2025 LinkedIn Ads Benchmarks Report found that LinkedIn's share of total B2B ad budgets grew from 31% in early 2024 to 39% by year-end, and LinkedIn influenced 36% of sales-qualified leads, more than Google or Meta. The cost per click on LinkedIn is high compared to Google or Facebook, which prices out smaller companies but delivers qualified B2B prospects that enterprise sales teams target. Facebook Conversion Tracking bridges both worlds: present at small (5.55%) and mid-market (15.07%) but missing from enterprise. The entire business model (monetizing traffic vs. buying leads) flips depending on company size.
Top Web Hosting Providers in Software Development
Web hosting choices in software development skew toward performance and developer experience over managed WordPress-style solutions.
| Technology | Small Biz | Mid-Market | Enterprise |
|---|---|---|---|
| Cloudflare Hosting | 18.58% | 40.48% | 49% |
| OVH | 4.5% | — | — |
| Cogeco Peer 1 | 4.4% | — | — |
| Hetzner | 3.91% | — | — |
Cloudflare Hosting dominates this category and grows with company size: 18.58% (small), 40.48% (mid-market), 49% (enterprise). According to 6sense, Cloudflare holds 40.56% of the global CDN market and serves 20% of the entire web. Nearly half of enterprise software development companies in our data route through Cloudflare's hosting infrastructure. The DDoS protection, edge caching, and global CDN that come bundled with Cloudflare's offering make it a natural fit for companies at scale.
OVH (4.5%), Cogeco Peer 1 (4.4%), and Hetzner (3.91%) appear exclusively in the small business segment. Companies using Hetzner are overwhelmingly cost-conscious European hosting customers, indie developers and small studios. They don't show up in mid-market or enterprise results at all. At that scale, companies consolidate on major cloud providers and CDN-backed hosting platforms like Cloudflare.
Largest Software Development Companies in Our Data
| Company | Country | Size | Founded |
|---|---|---|---|
| Amazon Literary Partnership | United States | 10001+ | 1994 |
| United States | 10001+ | 1998 | |
| Bosch | Germany | 10001+ | 1886 |
| Upwork Enterprise | United States | 501-1000 | 2015 |
| Meta Careers | United States | 10001+ | 2004 |
| SAP | Germany | 10001+ | 1972 |
| Cisco Systems | United States | 10001+ | 1984 |
| Tencent | China | 10001+ | 1998 |
| Salesforce, Inc. | United States | 10001+ | 1999 |
| Alibaba | China | 10001+ | 1999 |
| DoorDash | United States | 10001+ | 2013 |
| Airbnb, Inc. | United States | 5001-10000 | 2008 |
| Shopee | Singapore | 5001-10000 | 2015 |
| Grab Holdings Inc | Romania | 5001-10000 | 2012 |
| ByteDance | United States | 10001+ | 2012 |
| United States | 10001+ | 2010 | |
| Adobe | United States | 10001+ | 1982 |
| JD.com | China | 10001+ | 1998 |
| Thomson Reuters Corporation | United States | 10001+ | — |
| Amdocs Group | United States | 10001+ | 1982 |
These companies span multiple continents and product categories: cloud platforms (Amazon, Google, Salesforce), consumer tech (Airbnb, DoorDash, Instagram), and enterprise software (SAP, Cisco, Adobe). Their technology choices collectively shape industry trends. When Amazon standardizes on a tool, thousands of smaller companies take notice.
Where Software Development Companies Are Based
| Country | Companies |
|---|---|
| United States | 124,513 |
| China | 71,296 |
| United Kingdom | 32,414 |
| India | 26,751 |
| Germany | 23,113 |
| France | 15,896 |
| Brazil | 13,484 |
| Spain | 13,443 |
| Canada | 12,809 |
| Netherlands | 8,191 |
| Australia | 7,899 |
| Turkey | 6,540 |
The United States accounts for 124,513 companies in our geographic data. China follows with 71,296, driven by its massive domestic software market. The UK (32,414) and India (26,751) round out the top four. London's fintech corridor fuels the UK count, while India's number reflects its established outsourcing and product development hubs.
The European cluster of Germany, France, Spain, and the Netherlands collectively represents over 60,000 companies. Brazil (13,484) is the largest Latin American presence, while Turkey (6,540) is a growing tech market. These geographic patterns explain some technology preferences: European companies drive higher adoption of OVH hosting and GDPR-related cookie consent tools, while US-centric platforms like LinkedIn Ads dominate English-speaking markets.
Software Development Companies by Size
| Employee Range | Companies | Share |
|---|---|---|
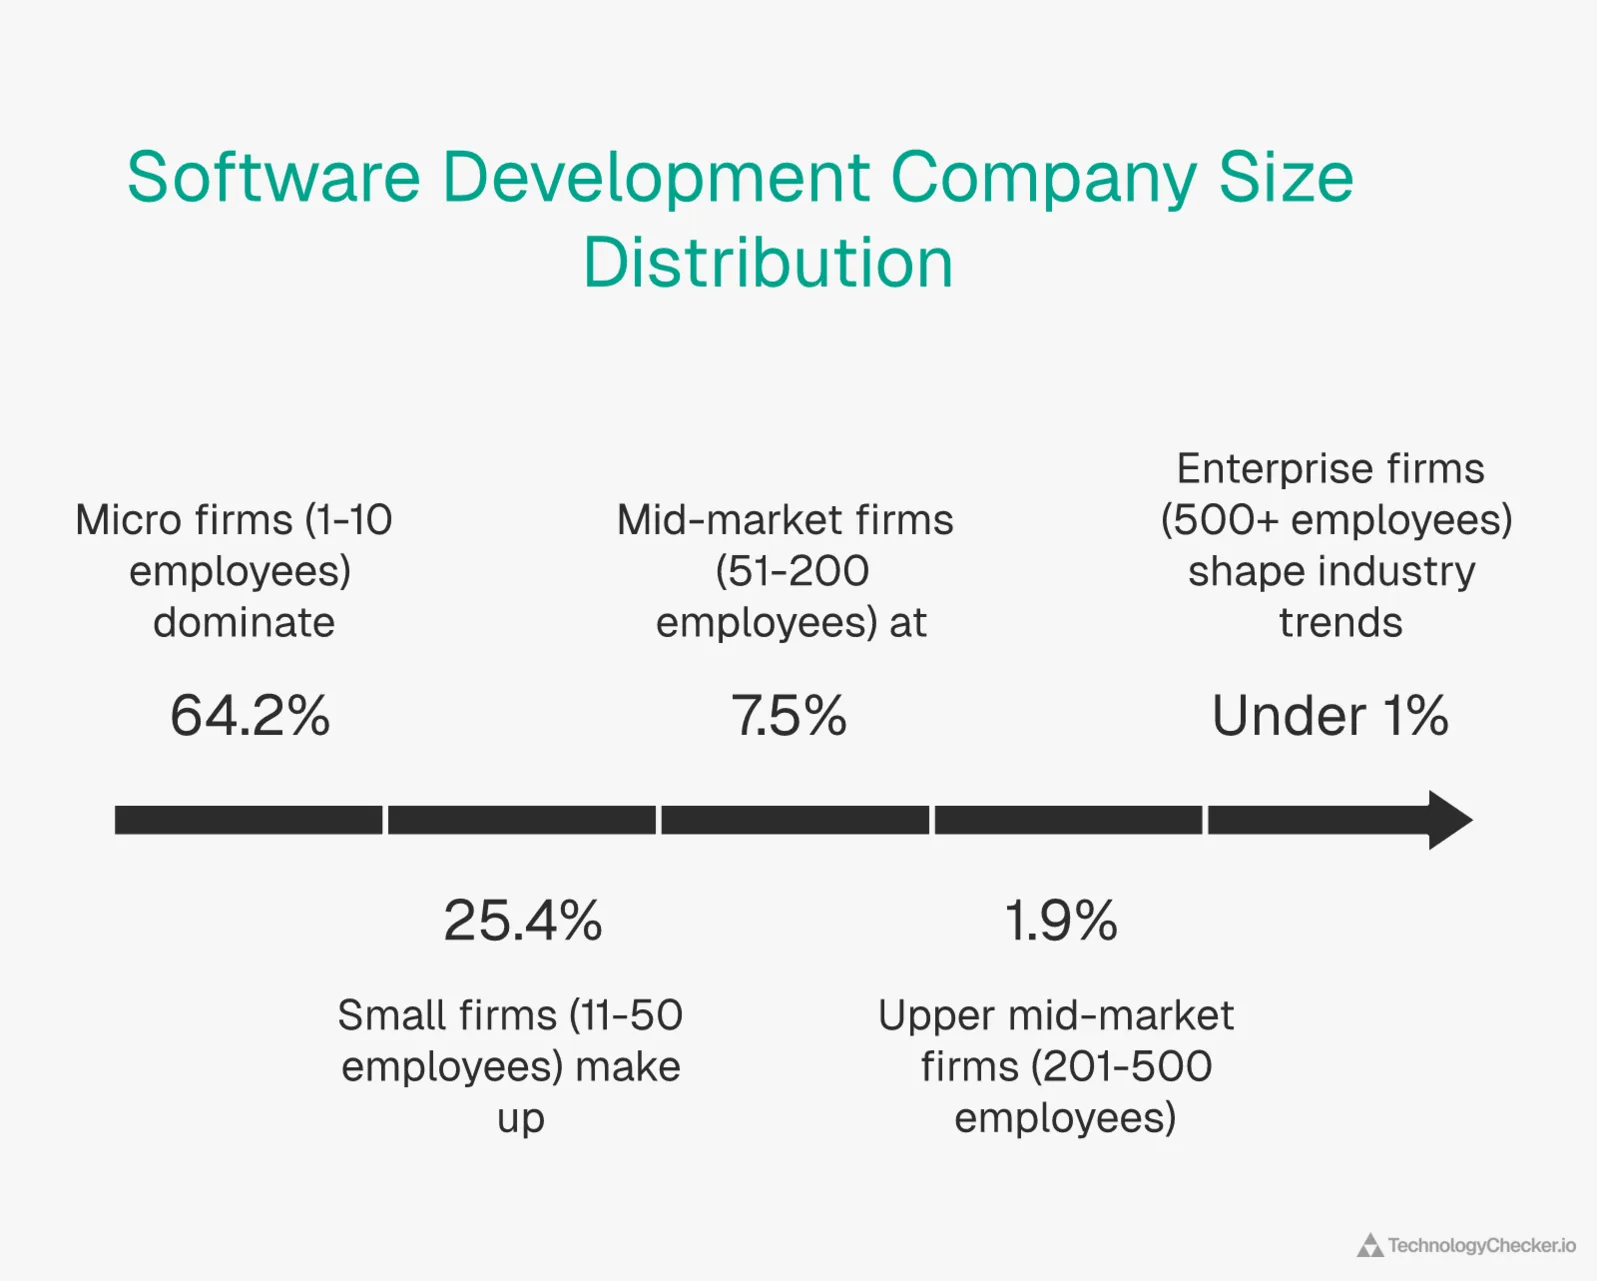
| 1-10 | 339,390 | 64.2% |
| 11-50 | 134,199 | 25.4% |
| 51-200 | 39,626 | 7.5% |
| 201-500 | 10,061 | 1.9% |
| 501-1000 | 2,849 | 0.5% |
| 1001-5000 | 1,803 | 0.3% |
| 5001-10000 | 537 | 0.1% |
| 10001+ | 468 | 0.1% |
Nearly 90% of software development companies have 50 or fewer employees. SlashData's Q1 2025 report puts the global developer population at 47.2 million, up 50% from 31 million in 2022. The 1-10 range alone accounts for 64.2% of all companies in our data. This distribution shapes overall adoption numbers. When a technology shows high overall adoption, it's usually because small businesses drive the volume. Technologies that appear primarily at enterprise scale (like Microsoft Azure or LinkedIn Ads) get diluted in the overall rankings despite being standard at larger organizations.
Frequently Asked Questions
What is the most popular technology in software development?
jQuery is the most widely adopted technology among software development companies, found on 48.25% of the 176,114 domains in our analysis (31,964 domains). Google Tag Manager follows at 34.86% and Google Analytics at 33.14%. The first industry-defining split shows up in JavaScript frameworks: React jumps from 23.19% at small companies to 53.31% at enterprise.
What analytics tools do small software development companies use?
Small software development companies rely primarily on Google Analytics (33.32%) and Global Site Tag (30.97%) for web analytics. Google Analytics 4 sits at 21.08%, while Google Universal Analytics lingers at 12.94%. Facebook Pixel appears on 6.22% of small business domains. Dedicated behavior analytics tools like Hotjar and Microsoft Clarity don't rank in the small business top results. They require more analyst resources than most small teams can commit. See our breakdowns of companies using Hotjar and companies using Microsoft Clarity for size-tier adoption details.
How do enterprise software development companies differ in JavaScript framework adoption?
Enterprise companies show much stronger React adoption (53.31%) compared to small businesses (23.19%). AngularJS is an enterprise-heavy framework at 26.29%, barely registering with small businesses. Vue scales more evenly, growing from 5.71% at small to 23.24% at enterprise. Our data suggests that enterprise organizations adopted React and Angular early and haven't migrated away, while smaller companies are more likely to use newer or lighter alternatives.
Which countries have the most software development companies?
The United States leads with 124,513 software development companies in our data, followed by China (71,296), the United Kingdom (32,414), and India (26,751). Germany rounds out the top five with 23,113 companies. Our geographic distribution reflects LinkedIn company registrations, so countries with higher LinkedIn adoption tend to appear more prominently.
How many software development companies did you analyze?
Our analysis covers 176,114 domains classified under Software Development. We detected 200 distinct technologies across these domains using our detection database, which scans 29.9M domains for 40,000+ tracked technologies. Company size and industry data comes from 25.4M LinkedIn company records, matched to domains in our March 2026 crawl.
What This Data Tells Us
-
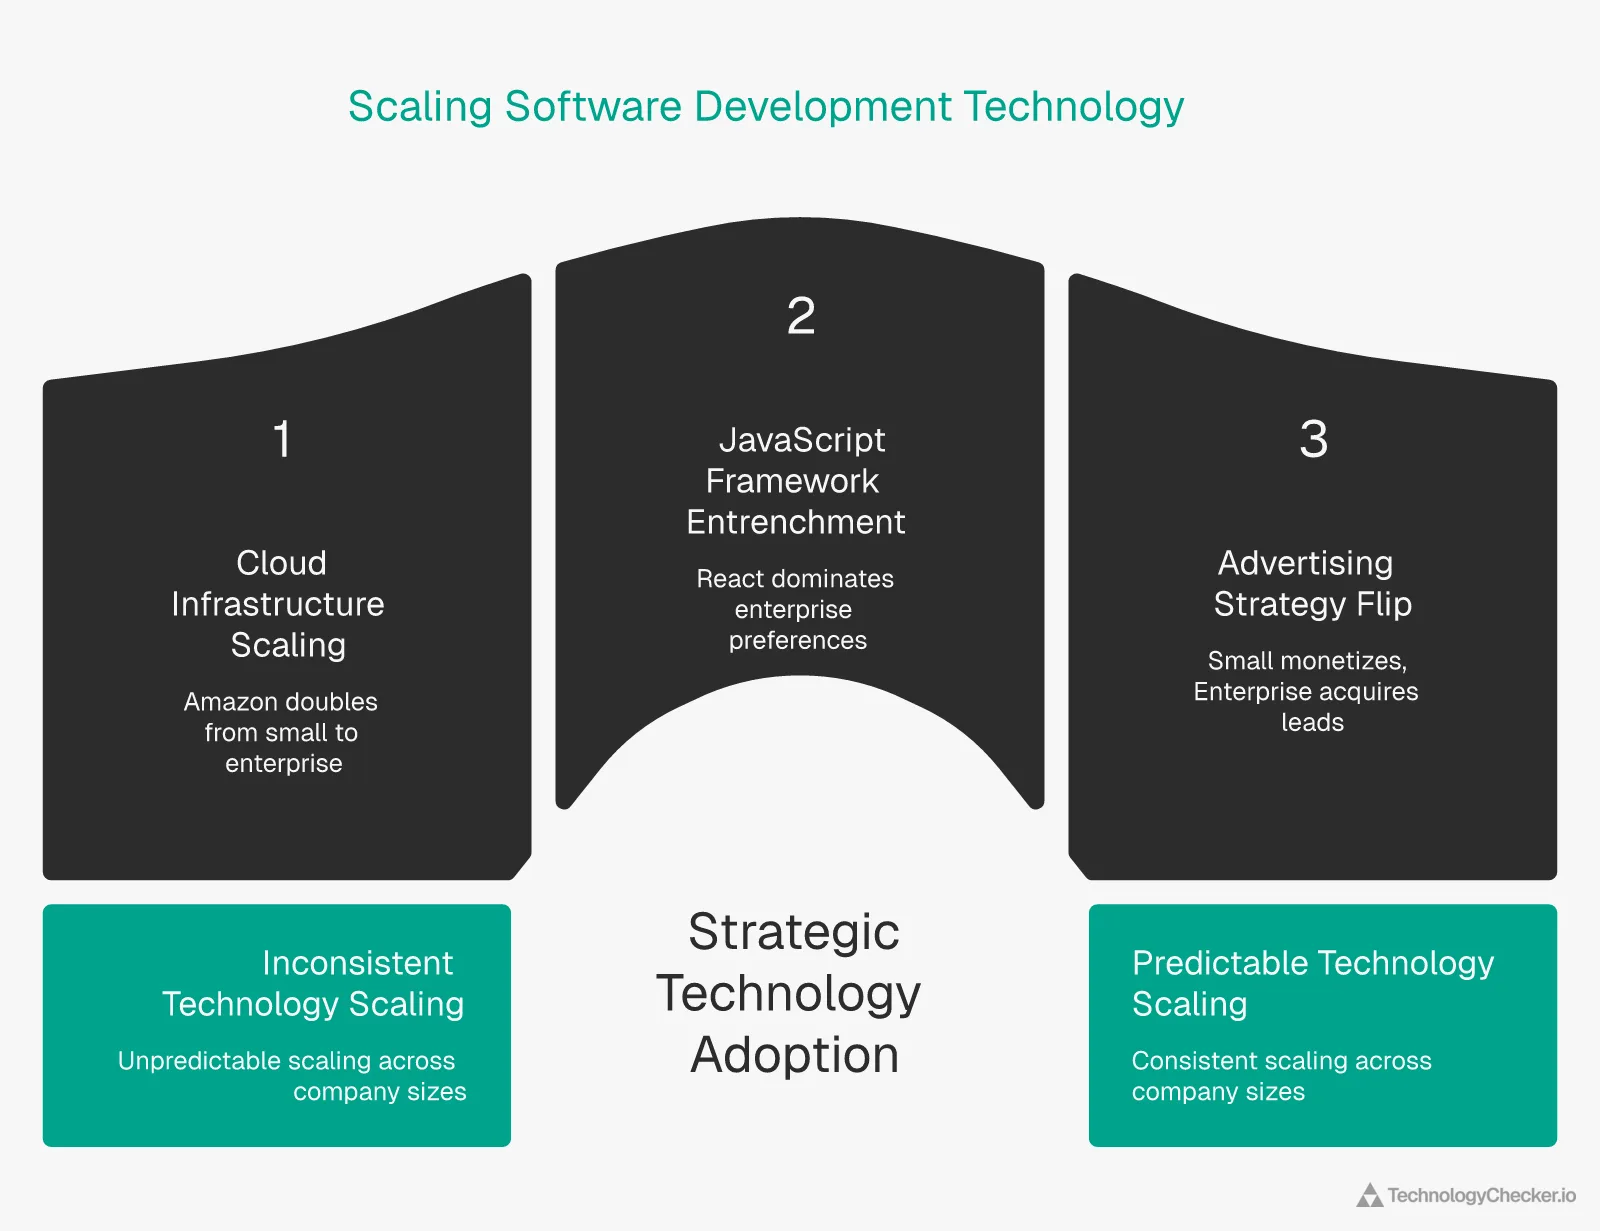
Cloud infrastructure adoption scales predictably with company size. Amazon's IaaS jumps from 28.67% at small businesses to 56.36% at enterprise. Microsoft Azure only appears in the enterprise tier (25.13%). Small companies start with Digital Ocean (3.97%) or basic hosting and migrate as they grow. Our data on companies using Digital Ocean confirms it's almost exclusively a small-business tool.
-
JavaScript framework preferences are entrenched by company size. React dominates at all sizes but is strongest at enterprise (53.31%). AngularJS at 26.29% enterprise adoption shows that large codebases don't get rewritten on trend cycles. Small businesses rarely use Angular at all.
-
Advertising strategy flips entirely based on company size. Small software companies monetize with Google AdSense (5.77%). Enterprise companies don't run AdSense. They buy LinkedIn Ads (29.76%) to drive B2B demand generation. The tools aren't just different; the entire business model is different.
If you're a small software development firm evaluating cloud providers, our data shows Amazon leads at 28.67% adoption, but Digital Ocean (3.97%) is a viable alternative that disappears from adoption data once companies pass 50 employees. For mid-market teams choosing a JavaScript framework, React at 42.41% is the industry default, with Vue (14.79%) as the most common alternative.
Explore individual technology pages for deeper analysis: React, Google Tag Manager, Cloudflare Hosting, Vue, reCAPTCHA, and GSAP. TechnologyChecker.io tracks adoption trends for each of these across industries and company sizes.
David Thomson
CTO