AI Adoption Trends in Q2 2026: We Analyzed 4 Internet Layers of Cloudflare Radar Data to Map How AI Hype Becomes Real Adoption (July 2026 Update)
Original research mapping AI adoption across 4 internet layers with Cloudflare Radar, refreshed for the Q2 2026 close with year-over-year data: Training crawls overtook 'mixed purpose' as the #1 declared crawl reason, ClaudeBot passed GPTBot for the #2 crawler spot, Googlebot's share of AI-bot traffic halved, and more than 1 in 3 crawler requests now returns a 4xx as sites push back.
Published •Updated •65 min read

We've tracked AI adoption across four internet layers every quarter for over a year using Cloudflare Radar data, covering more than 67 million DNS queries per second. This July 2026 update closes the book on Q2 2026 (April 1 – June 30) and adds a year-over-year layer against Q2 2025, and the full-quarter numbers land harder than any single month did. Training crawls overtook "mixed purpose" to become the #1 declared reason AI bots crawl the web (44.9% of crawls, up from 28.7% a year ago); ClaudeBot passed GPTBot to become the #2 AI crawler (13.9%) as Googlebot's share of AI-bot traffic halved (57.2% to 27.5% year over year); and more than a third of all crawler requests now return a 4xx client error (35.8%, up from 10.2% a year ago) as publishers push back. Below the Q2 close we preserve the original Q1 2026 read and the April and May update layers in full, so the trajectory, and every call we got right or wrong, stays visible. Back in Q1, ChatGPT hit global domain rank #11, AI bot traffic surged 34%, and Claude overtook Google Gemini for the #2 generative AI position; by the Q2 close ChatGPT still holds the #1 generative-AI service rank while chatgpt.com has settled around #23 on the global domain list. The macro layer still cross-references two Statista publications, the Q2 2026 AI dossier (33 pages, study ID 38609) and the September 2025 in-depth AI market analysis (295 pages, study ID 50485), to frame whether the infrastructure curve is the beginning, middle, or end of the wave.
Key findings — Q2 2026 close (April 1 – June 30, 2026 Cloudflare Radar telemetry; year-over-year vs Q2 2025):
- Training overtook "mixed purpose" as the #1 declared crawl reason: training-purpose crawls hit 44.9% of AI-bot activity for the full quarter, up from 41.4% in Q1 and 28.7% a year ago — while "mixed purpose" collapsed from 65.1% (Q2 2025) to 43.0%. The crossover happened inside Q2: AI bots stopped hiding intent behind "mixed" and now openly crawl to train
- The crawler leaderboard reordered as Googlebot's grip halved: Googlebot fell from 57.2% of AI-bot traffic a year ago to 27.5% this quarter, and ClaudeBot rose to #2 (8.3% → 13.9% YoY), passing GPTBot (11.4% → 10.2%). Bytespider (ByteDance) more than tripled (2.4% → 7.9%), Applebot went 8x (0.9% → 7.4%), and Meta-ExternalAgent doubled (6.3% → 12.7%)
- The block rate tripled: 35.8% of all crawler requests now return a 4xx client error (blocked, forbidden, rate-limited, or not-found), up from 10.2% a year ago and roughly flat vs Q1's 34.1%. Successful 2xx responses fell from 80.5% to 49.2% YoY — the clearest sign publishers are fighting back
- The operator league shifted: among all bots Cloudflare tracks, Google's share slid from 46.8% (Q2 2025) to 30.1%, while Anthropic entered the top 5 (4.9%) for the first time and Claude-User — Anthropic's real-time fetch-on-demand agent — climbed to #8 among individual bots, ahead of Google's AdsBot
- Search crawls nearly doubled (4.6% → 9.1% YoY) as retrieval bots (Claude-SearchBot) grew, narrowing the pure-training-vs-everything-else gap
- Retail stayed the most-crawled industry and widened its lead: 26.0% of AI-bot traffic a year ago, 29.3% this quarter
- Layers 1, 2 and 4 held their May reads: the .ai-adjacent "other" TLD bucket stayed reset at 14.3% (the Q1 domain gold rush did not bind), chatgpt.com settled at #23 on the global domain list (down from Q1's #11 but stable since May's #25), and the GenAI top 6 froze — ChatGPT, Claude, Perplexity, Gemini, DeepSeek, GitHub Copilot — exactly as the May read predicted
Earlier layers preserved below (updated June 1, 2026 with full-month May 2026 Cloudflare Radar telemetry):
- May reshuffled the AI crawler order: Bytespider (ByteDance) surged from 5.7% to 10.3% of AI bot traffic to become the #4 crawler, GPTBot rebounded to 11.5% (reversing its Q1-into-April slide), Applebot retreated to 7.0%, and Meta-ExternalAgent eased to 13.2%
- chatgpt.com slipped to #25 on Cloudflare's global domain list in May while amazon.com reclaimed #11 — yet ChatGPT held the #1 generative AI service rank, so the domain-popularity signal and the service-traffic signal diverged
- The .ai-adjacent "other" TLD bucket kept unwinding to 14.3% in May, now below where Q1 began (14.7%), and NXDOMAIN fell under 10% (9.88%) for the first time in the series — the Q1 "domain gold rush" did not bind
- Gemini retook the #4 generative AI spot from DeepSeek, GitHub Copilot climbed to #6, and Windsurf AI and QuillBot pushed into the top 12
- Training-purpose crawls held at ~52% and retail held the #1 crawled-industry spot (28.7%) through May — the two most durable Q1 reads
- The "other" TLD category (which includes .ai domains) grew 20% within Q1, from 14.7% to 17.6% of DNS queries, while .com declined from 60.8% to 58.9%
- chatgpt.com ranked #11 globally in Q1, sitting between fbcdn.net and amazon.com — the first AI-native platform in the top 15 at the time
- AI bot traffic increased ~34% over the quarter, with training-purpose crawls growing from 42% to 52% of all bot activity
- Meta-ExternalAgent emerged as the fastest-growing AI crawler (+43% within Q1), while GPTBot traffic dropped 30%
- DeepSeek shot from rank #9 to #4 among GenAI services in just three weeks during late January
- Applebot saw a 5x traffic surge by late March
- Statista forecasts the global AI market to grow from $94.81B (2020) to $1.675T (2031) — a 17.7x expansion, with GenAI alone hitting $442B by 2031
- Global business AI adoption jumped from 20% (2017) to 72% (2024) — the +17-point gain between 2023 and 2024 is the steepest single-year jump in the IDC/McKinsey series (IDC; McKinsey via Statista)
- U.S. AI investment hit $471B in May 2025 — roughly 4x China's $119B and more than the next 8 countries combined (Spherical Insights via Statista)
- China (58%) and India (57%) are the only countries where AI deployment exceeds "still exploring" — the U.S. sits at 25% deployed / 43% exploring (Vention via Statista)
- The AI cybersecurity market is forecast to grow 5.5x ($24.3B → $133.8B, 2023-2030) — and organizations with extensive AI security automation save $1.9M per breach vs no automation (IBM; Ponemon Institute via Statista)
- 53% of new unicorn births in 2025 were AI startups, up from 6% in 2015 (CB Insights via Statista)
- Enterprise AI adoption jumped 23 points in a single year (55% → 78% from 2023 to 2024), with developing markets posting the biggest gain (+28 points)
AI Adoption in Q2 2026: The Full-Quarter Close (April–June, vs Q1 and vs 2025)
Q2 2026 closed on June 30. This section aggregates the full calendar quarter (April 1 – June 30) rather than a single month, and for the first time adds a year-over-year layer against the same window in 2025. The quarter view smooths the month-to-month churn the layers below document, and it surfaces three milestones that no single monthly snapshot made obvious: training crawls became the dominant declared crawl purpose, ClaudeBot became the #2 AI crawler, and the crawler block rate settled above a third. Updated July 2, 2026.
A note on the numbers: these are calendar-quarter aggregates, so a few differ from the rolling monthly figures in the preserved layers below (for example, training-purpose crawls average 44.9% across the full quarter, versus the 51.8% May-only reading we reported in June). Where the two differ, the calendar-quarter figure is the like-for-like one to compare against 2025.
The four-layer Q2 2026 scorecard
| Layer / metric | Q2 2025 | Q1 2026 | Q2 2026 | YoY change |
|---|---|---|---|---|
| L1 · .com share of DNS queries | ~61% | ~59% | 61.0% | Flat |
| L1 · "other" TLD bucket (incl. .ai) | ~15% | 17.6% (Q1 peak) | 14.3% | Rush unwound |
| L1 · NXDOMAIN rate | ~10% | 10.7% | 10.3% | Flat |
| L2 · chatgpt.com global domain rank | outside top 15 | #11 | #23 | Off the Q1 peak |
| L3 · Training crawl purpose | 28.7% | 41.4% | 44.9% | +16.1 pts |
| L3 · "Mixed purpose" crawls | 65.1% | 48.0% | 43.0% | −22.1 pts |
| L3 · Search-purpose crawls | 4.6% | 8.0% | 9.1% | ~2x |
| L3 · Googlebot (share of AI-bot traffic) | 57.2% | 35.2% | 27.5% | Halved |
| L3 · ClaudeBot | 8.3% | 11.3% | 13.9% | Rose to #2 |
| L3 · GPTBot | 11.4% | 12.5% | 10.2% | Slipped |
| L3 · Bytespider (ByteDance) | 2.4% | 3.5% | 7.9% | ~3.3x |
| L3 · Applebot | 0.9% | 3.6% | 7.4% | ~8x |
| L3 · Crawler 4xx (client-error) rate | 10.2% | 34.1% | 35.8% | ~3.5x |
| L3 · Most-crawled industry (Retail) | 26.0% | 28.3% | 29.3% | Widened lead |
| L4 · GenAI #1 service (ChatGPT) | #1 | #1 | #1 | Held |
Source: Cloudflare Radar — dns/summary/{tld,response_code}, ranking/domain/chatgpt.com, ai/bots/summary/{crawl_purpose,user_agent,industry}, bots/crawlers/summary/response_status_category, ranking/internet_services/top. Q2 2026 = 2026-04-01→06-30, Q1 2026 = 2026-01-01→03-31, Q2 2025 = 2025-04-01→06-30. Pulled 2026-07-02. L1/L2 2025 figures are approximate reference points from the rolling series; all L3 figures are direct calendar-quarter pulls.
Layer 3, the headline: training crawls took over, and 1 in 3 requests now gets blocked
Two Layer 3 numbers define the quarter. The first is a crossover. A year ago, AI bots overwhelmingly declared "mixed purpose" (65.1%) rather than admitting they crawl to train (28.7%). That inverted during Q2 2026: training reached 44.9% and passed mixed purpose (43.0%) to become the single most common declared crawl reason, with search-purpose crawls nearly doubling year over year to 9.1%. Read plainly, AI crawlers stopped hedging. The web is being read to build models, and the operators increasingly say so.
The second number is the pushback. A year ago, 80.5% of crawler requests succeeded (2xx) and only 10.2% returned a 4xx. This quarter, successful responses fell to 49.2% and 4xx client errors climbed to 35.8%: more than one in three crawler requests now hits a block, a forbidden path, a rate limit, or a dead URL. The jump happened mostly between Q2 2025 and Q1 2026 (10.2% → 34.1%) and then held (34.1% → 35.8%), so this is now a stable plateau, not a spike. One honesty caveat: a 4xx bucket lumps deliberate 401/403 blocks together with 404s and 429 rate-limits, so it overstates "intentional blocking" somewhat. But a 3.5x jump in a year, against a 31-point fall in successful crawls, is the clearest signal in the dataset that the publisher-versus-crawler standoff we documented in our robots.txt blocking analysis has moved from rhetoric to response codes.
| Crawler response (all crawlers) | Q2 2025 | Q1 2026 | Q2 2026 |
|---|---|---|---|
| 2xx (success) | 80.5% | 50.9% | 49.2% |
| 4xx (blocked / forbidden / rate-limited / not-found) | 10.2% | 34.1% | 35.8% |
| 3xx (redirect) | 8.8% | 12.2% | 12.5% |
| 5xx (server error) | 0.5% | 2.7% | 2.5% |
Source: Cloudflare Radar — bots/crawlers/summary/response_status_category, PERCENTAGE of crawler requests. Windows as above.
The AI-crawler leaderboard reordered: Googlebot halved, ClaudeBot passed GPTBot
Across the full quarter, Googlebot's share of AI-bot traffic fell to 27.5%, less than half its 57.2% of a year ago and down from 35.2% in Q1. It is still #1, but the field around it has gone multipolar. The biggest structural shift is Anthropic: ClaudeBot rose to #2 (13.9%), up from 8.3% a year ago, passing both Meta-ExternalAgent (12.7%) and GPTBot (10.2%). OpenAI's crawler is the only major one to lose share year over year (11.4% → 10.2%), while ByteDance's Bytespider more than tripled (2.4% → 7.9%) and Applebot rose roughly eightfold off a tiny 2025 base (0.9% → 7.4%).
| AI crawler | Q2 2025 | Q1 2026 | Q2 2026 | YoY |
|---|---|---|---|---|
| Googlebot | 57.2% | 35.2% | 27.5% | Halved |
| ClaudeBot (Anthropic) | 8.3% | 11.3% | 13.9% | Rose to #2 |
| Meta-ExternalAgent | 6.3% | 13.9% | 12.7% | Doubled |
| GPTBot (OpenAI) | 11.4% | 12.5% | 10.2% | Slipped |
| Bingbot | 7.0% | 9.2% | 8.1% | Up |
| Bytespider (ByteDance) | 2.4% | 3.5% | 7.9% | ~3.3x |
| Applebot | 0.9% | 3.6% | 7.4% | ~8x |
| Amazonbot | 3.8% | 4.9% | 5.1% | Up |
Source: Cloudflare Radar — ai/bots/summary/user_agent, PERCENTAGE of AI-bot requests. Windows as above.
The operator league: Google's bot dominance is eroding
Rolling the crawlers up to the companies behind them (across every bot Cloudflare tracks, not just AI ones) shows the same story from a different angle. Google's total bot share fell from 46.8% a year ago to 30.1%, a 17-point slide, as its search-crawl volume normalized and AI operators scaled up. Meta held around 15%, OpenAI eased to 7.6%, and Anthropic broke into the top five for the first time at 4.9%; it wasn't in the top ten a year ago.
| Bot operator (all bots) | Q2 2025 | Q1 2026 | Q2 2026 |
|---|---|---|---|
| 46.8% | 35.4% | 30.1% | |
| Meta | 14.6% | 16.6% | 14.9% |
| OpenAI | 8.7% | 9.3% | 7.6% |
| Microsoft | 5.2% | 6.1% | 5.3% |
| Anthropic | not top 10 | not top 10 | 4.9% |
Source: Cloudflare Radar — bots/summary/bot_operator, PERCENTAGE of all bot requests. Windows as above.
One individual-bot detail worth flagging: Claude-User, Anthropic's fetch-on-demand agent (it retrieves a page in real time when a Claude user asks about it), is now the #8 individual bot on the web at 3.8%, ahead of Google's AdsBot. That is a different behavior from a training crawler: real-time retrieval tied to a live user query, and its top-10 presence is the same "search is waking up" signal the crawl-purpose data shows.
Layers 1, 2 and 4 confirmed their May reads
The other three layers moved little across Q2, which is itself the finding. On Layer 1 (DNS), the .ai-adjacent "other" TLD bucket held at 14.3% for the full quarter, right where May left it and below where Q1 began (14.7%), so the Q1 "domain gold rush" narrative stayed retired, with .com steady near 61% and NXDOMAIN easing to 10.3%. On Layer 2, chatgpt.com sat at global rank #23 on the July 2 snapshot, stable in the low-20s since May's #25, well off Q1's #11 but not collapsing; the domain-popularity signal and the service-usage signal remain diverged. On Layer 4, the generative-AI service ranking froze exactly as the May read predicted: ChatGPT #1, Claude #2, Perplexity #3, Gemini #4, DeepSeek #5, GitHub Copilot #6, with Doubao climbing to #7. Consolidation at the top held for a second straight quarter.
What Q2 confirmed, and what we're watching for Q3
Q2 resolved the open questions June left us. Bytespider did not give back its gain: it held around 8% for the quarter, confirming a sustained ByteDance training push rather than a one-off crawl run. Search crawls did keep climbing (9.1% for the quarter, a series high), so the shift toward retrieval is real, not noise. And chatgpt.com stabilized in the low-20s rather than recovering toward the top 15.
Three questions carry into Q3 2026:
- Does the 4xx block rate keep climbing or top out near 36%? Two quarters of ~35% suggests a plateau, but if publishers deploy more aggressive AI-specific rules the rate could resume rising, the clearest single number to watch for the crawler-versus-publisher standoff.
- Does ClaudeBot hold #2, or does the June surge (19.8% for that month alone) push it toward Googlebot? Anthropic's crawl share has risen every quarter for a year; Q3 tests whether that curve bends.
- Does training's lead over "mixed purpose" widen? June already showed training at 47.2% vs mixed at 39.0%. If Q3 extends that, "mixed purpose" is on its way to a minority declaration and intent-transparency in crawling becomes the norm.
The layers below preserve the original Q1 2026 read and the April and May update passes in full, including the calls we later reversed, so the full trajectory stays auditable.
How Did Q1 2026 AI Adoption Trends Evolve Through May 2026?
According to Cloudflare Radar AI insights, the AI crawler order reshuffled again in May 2026. Bytespider (ByteDance) surged to 10.25% of AI bot traffic to become the #4 crawler, GPTBot rebounded to 11.48% (recovering most of its April dip), Applebot retreated to 7.01%, and Meta-ExternalAgent eased to 13.23%. We re-pulled all four layers for the full month of May 2026. The .ai-adjacent "other" TLD bucket kept contracting, from 15.0% in April to 14.33% (now below where Q1 began), and NXDOMAIN fell under 10% for the first time in the series. On the service side, Gemini retook the #4 generative AI spot from DeepSeek, and chatgpt.com slipped to #25 on the global domain list. Updated June 1, 2026.
I've been pulling these four-layer datasets every quarter for over a year now, and the thing May taught me is how much faster the crawler layer churns than the quarterly view suggests. In April I'd flagged Applebot as crossing from trend to structural, and GPTBot as structurally weaker. May reversed both reads: Applebot fell back to 7%, GPTBot rebounded past 11%, and the crawler nobody was watching, ByteDance's Bytespider, doubled to become the #4 bot on the web. The "other" TLD bucket never restored its Q1 trajectory either; it kept sliding to 14.3%. The lesson I'm taking into June is that one month of crawler movement is a draft, not a finding.
Which Cloudflare Radar Metrics Changed Most Between Q1 2026 and May 2026?
| Metric | Q1 2026 | April 2026 | May 2026 | Net direction |
|---|---|---|---|---|
| Layer 1 — DNS | ||||
| .com query share | 58.9% (Q1 end) | 60.22% | 60.80% | Held high |
| .net query share | 12.31% (avg) | 11.63% | 11.75% | Flat |
| "Other" TLDs (incl. .ai/.app/.xyz) | 17.6% (Q1 end) | 15.0% | 14.33% | Kept unwinding |
| .io query share | 1.76% (Q1 end) | 1.77% | 1.66% | Slight slip |
| .ru query share | 2.16% (mid-Mar spike) | 2.10% | 2.02% | Settled at baseline |
| NXDOMAIN rate | 10.74% | 10.48% | 9.88% | Eased below 10% |
| Layer 2 — global domain rank | ||||
| chatgpt.com (Radar popular list) | #11 | not refreshed | #25 | Slipped; amazon.com retook #11 |
| Layer 3 — AI bot user agents | ||||
| Googlebot | 35.0% | 30.28% | 27.26% | Kept easing |
| Meta-ExternalAgent | 14.2% (avg) | 14.91% | 13.23% | Eased off the gain |
| GPTBot | 12.3% (avg, ended 8.6%) | 9.84% | 11.48% | Rebounded |
| Bytespider | 3.5% | 5.73% | 10.25% | Surged to #4 |
| ClaudeBot | 11.3% | 11.69% | 9.73% | Eased |
| Bingbot | 9.1% | 8.04% | 8.45% | Steady |
| Applebot | 3.9% avg, peaked 10.2% | 9.23% | 7.01% | Retreated |
| Amazonbot | 4.8% | 4.47% | 5.29% | Edged up |
| Claude-SearchBot | (not top 10) | (OAI-SearchBot 1.91%) | 2.22% | New search crawler in top 10 |
| Layer 3 — crawl purpose | ||||
| Training | 45.4% (avg, ended 52%) | 51.5% | 51.80% | Held the surge |
| Mixed Purpose | 44.1% | 38.3% | 35.71% | Kept declining |
| Search | 8.0% (avg, ended 6.3%) | 7.5% | 9.33% | Rose to series high |
| User Action | 2.1% | 2.2% | 2.58% | Flat |
| Layer 3 — bot industry mix | ||||
| Retail | 28.2% | 28.9% | 28.71% | Held lead |
| Computer Software | 13.6% | 12.96% | 13.44% | Flat |
| IT & Services | 5.8% | 5.78% | 5.87% | Flat |
| Internet | 5.0% | 5.20% | 5.41% | Slight rise |
| Adult Entertainment | (not top 5) | (not top 5) | 3.12% | New top-5 entrant |
| Telecommunications | (not top 5) | 3.85% | 2.88% | Slipped but held |
| Layer 4 — GenAI service rank | ||||
| Gemini vs DeepSeek | #5 vs #4 | not refreshed | #4 vs #5 | Gemini retook #4 |
| GitHub Copilot | #9 | not refreshed | #6 | Climbed |
Which Q1 and April Narratives Did May Reverse, Confirm, or Extend?
1. The Applebot "structural" call was premature, and May reversed it. In April we wrote that Applebot had "fully crossed from trend to structural" at 9.23% and was plausibly a top-three crawler. May undercut that: Applebot fell to 7.01%, dropping behind Bingbot (8.45%) and well behind GPTBot (11.48%). The Q1 read that Apple was "training something far bigger than what shipped" may still be true, but the crawl share is not the steady, rising line a structural shift would show. We were a month early. Applebot's share is better described right now as volatile than structural.
2. GPTBot's decline did not extend, it rebounded. In April we called OpenAI's crawl position "structurally weaker, now established, not a one-month read." May contradicted that: GPTBot recovered to 11.48%, within a point of its Q1 average and back ahead of every crawler except Googlebot and Meta. The data-sufficiency-versus-publisher-resistance debate from Q1 stays open, but the "OpenAI is structurally retreating from the crawl economy" framing was wrong. One quarter of decline followed by a rebound looks more like crawl-budget cycling than a structural pullback.
3. The real May story is Bytespider. The crawler that actually changed the hierarchy was the one we weren't tracking closely. ByteDance's Bytespider went from 3.5% in Q1 to 5.73% in April to 10.25% in May, nearly doubling month over month to become the #4 AI crawler on the web, ahead of ClaudeBot and Bingbot. When a single crawler doubles its share in a month, the company behind it is usually scaling a training run. ByteDance is the name to add to the Meta/OpenAI/Apple watch list.
4. The "other" TLD bucket confirmed its reversal. This is the one Q1 narrative that has now fully resolved. Q1 read the "other" bucket (which includes .ai/.app/.xyz domains) growing from 14.7% to 17.6% as a proxy for the AI domain rush. April pulled it back to 15.0%; May took it to 14.33%, below where Q1 began. The 20% in-quarter surge did not bind to sustained query volume. NXDOMAIN easing under 10% (9.88%, down from 10.74% in Q1) confirms speculative domain activity cooled rather than converted. The "domain gold rush" was the weakest of our Q1 reads, and the May data retires it.
Which Q1 2026 AI Crawler Findings Held Through May?
Training-purpose crawls held at 51.80% in May, almost exactly the Q1 close of 52% and April's 51.5%. The "more foundation models are coming" read remains the most durable signal in the whole stack — model builders did not pull back across two full months of Q2. One shift worth noting: search-purpose crawls rose to 9.33%, their highest in the series, and Anthropic's Claude-SearchBot entered the top 10 (2.22%) as OpenAI's OAI-SearchBot dropped out. The Q1 read that "search is a small slice of the bot economy" is starting to soften.
Retail kept its lead as the most-crawled industry at 28.71%, essentially flat across Q1, April, and May. The "if you're in e-commerce, AI bots are your second-largest traffic source after Google" read continues to apply. Computer Software, IT, and Internet held their Q1 ranks. Adult Entertainment appeared in the May top five at 3.12%, displacing the Telecommunications entry April had surfaced. Both fit the same pattern as Q1's gambling anomaly: unusually structured, data-rich sites that reward crawling. These low-ranked industry slots churn month to month and are best read as normalization noise.
Unlike April, we do have GenAI service ranking telemetry for May, so we refresh Layer 4 below. The short version: the top three (ChatGPT, Claude, Perplexity) are unchanged, Gemini retook #4 from DeepSeek, and GitHub Copilot, Windsurf AI, and QuillBot all climbed — consolidation at the top, fragmentation in the middle.
What May Resolved, and What We're Watching for June 2026
May answered all three questions April left open, and not in the direction April expected:
- Did the "other" TLD bucket recover or stay reset? It stayed reset, and then some, sliding to 14.33% (below Q1's 14.7% start). The Q1 domain gold rush did not bind to real query volume. Resolved: reset confirmed.
- Did Applebot pass GPTBot? No. Applebot retreated to 7.01% while GPTBot rebounded to 11.48%. The order did not just hold, it widened. Resolved against the April thesis.
- Did Meta-ExternalAgent re-accelerate? No. Meta eased to 13.23%, below its April level. The +43% Q1 surge looks like it found a ceiling rather than a floor, which pushes the next Llama-release timeline read further out.
Three new questions for June:
- Does Bytespider keep climbing or give the gain back? ByteDance went from 5.73% to 10.25% in a month. If June holds above 10%, this is a sustained ByteDance training push; if it falls back, it was a single large crawl run.
- Does Claude-SearchBot's top-10 entry mark a real shift toward search crawls? Search-purpose crawls hit a series high of 9.33% in May. If June extends that, the bot economy is rebalancing from pure training toward retrieval.
- Is chatgpt.com's drop to #25 compositional or real? Cloudflare's popular-domains list now surfaces more infrastructure domains (googleapis, gstatic, amazonaws) in the top 10. June will show whether chatgpt.com stabilizes in the 20s or recovers toward the top 15.
Every major AI adoption report published this quarter relied on surveys. McKinsey's State of AI surveyed executives. Microsoft's AI Economy Institute polled populations across countries. Deloitte's State of AI in the Enterprise asked CIOs about their roadmaps. Their numbers are useful. But they measure what people say they're doing with AI, not what's actually happening on the wire.
Our approach was different. We pulled passive internet telemetry from Cloudflare's DNS infrastructure, covering 92 days of actual internet behavior. No surveys. No self-reporting. Just raw traffic.
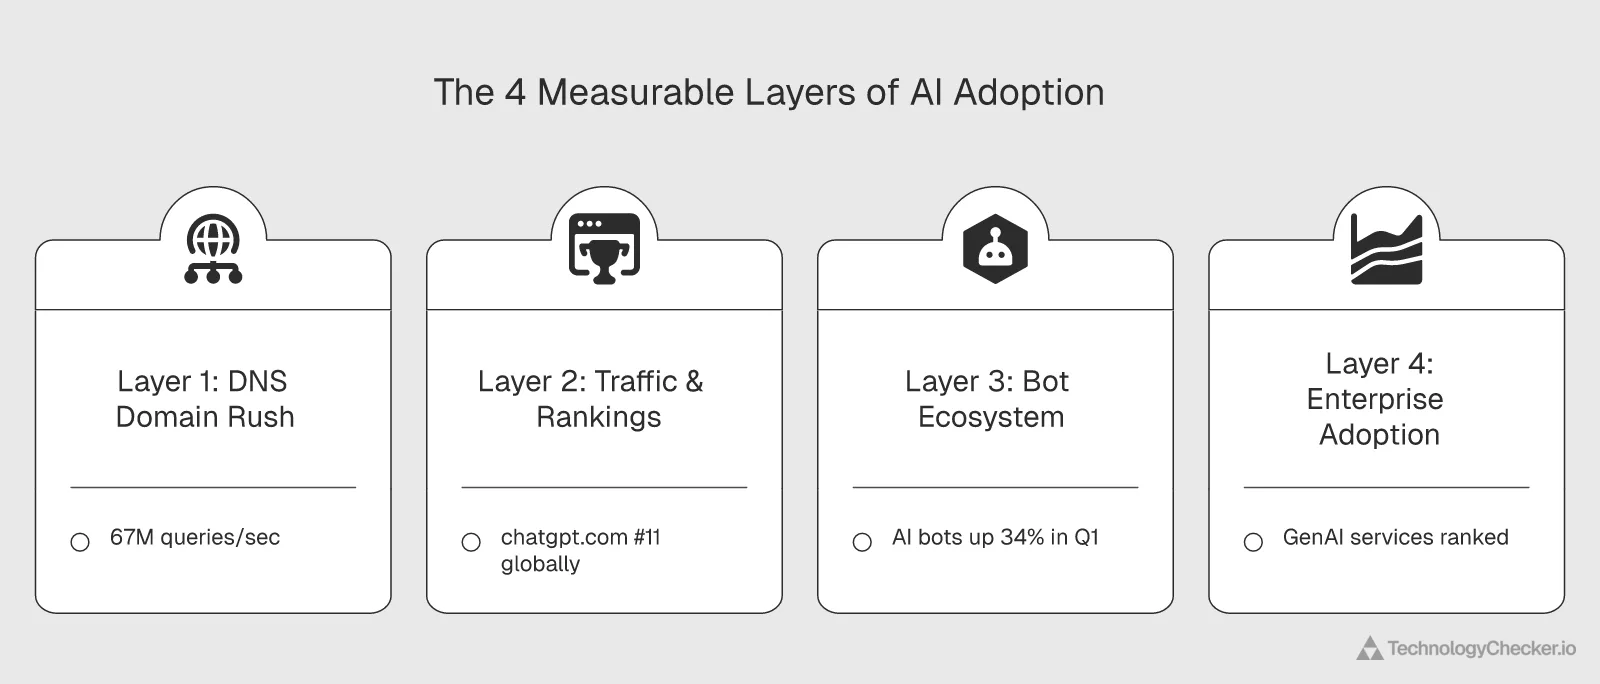
The AI hype cycle has 4 measurable internet layers
Technology hype doesn't just live in headlines and analyst decks. It propagates through the internet's infrastructure in a predictable sequence, and each stage leaves a fingerprint we can measure.
We identified four layers.
The first is the domain gold rush. When a technology trend heats up, entrepreneurs and speculators register domains. DNS query patterns shift. New TLDs gain traction. This tends to run 6-12 months ahead of actual product adoption.
Second comes traffic. As products launch and users show up, domain rankings change. A platform jumping from rank #500 to the top 15 means millions of daily users. That separates working products from press releases.
Third, the bot ecosystem. AI companies need training data and they deploy crawlers to get it. The volume, targeting patterns, and purpose mix of these bots reveal which capabilities are being built right now. When training-purpose crawls spike, new model releases follow within months.
Fourth is enterprise adoption. When services reach stable, high-frequency usage patterns (weekday/weekend cycles, consistent ranking positions), hype has converted to revenue. Deloitte's latest survey found that companies with 40% or more of their AI projects in production are expected to double in the next six months. Our traffic data shows which services those production workloads are running on.
Layer 1: The domain gold rush
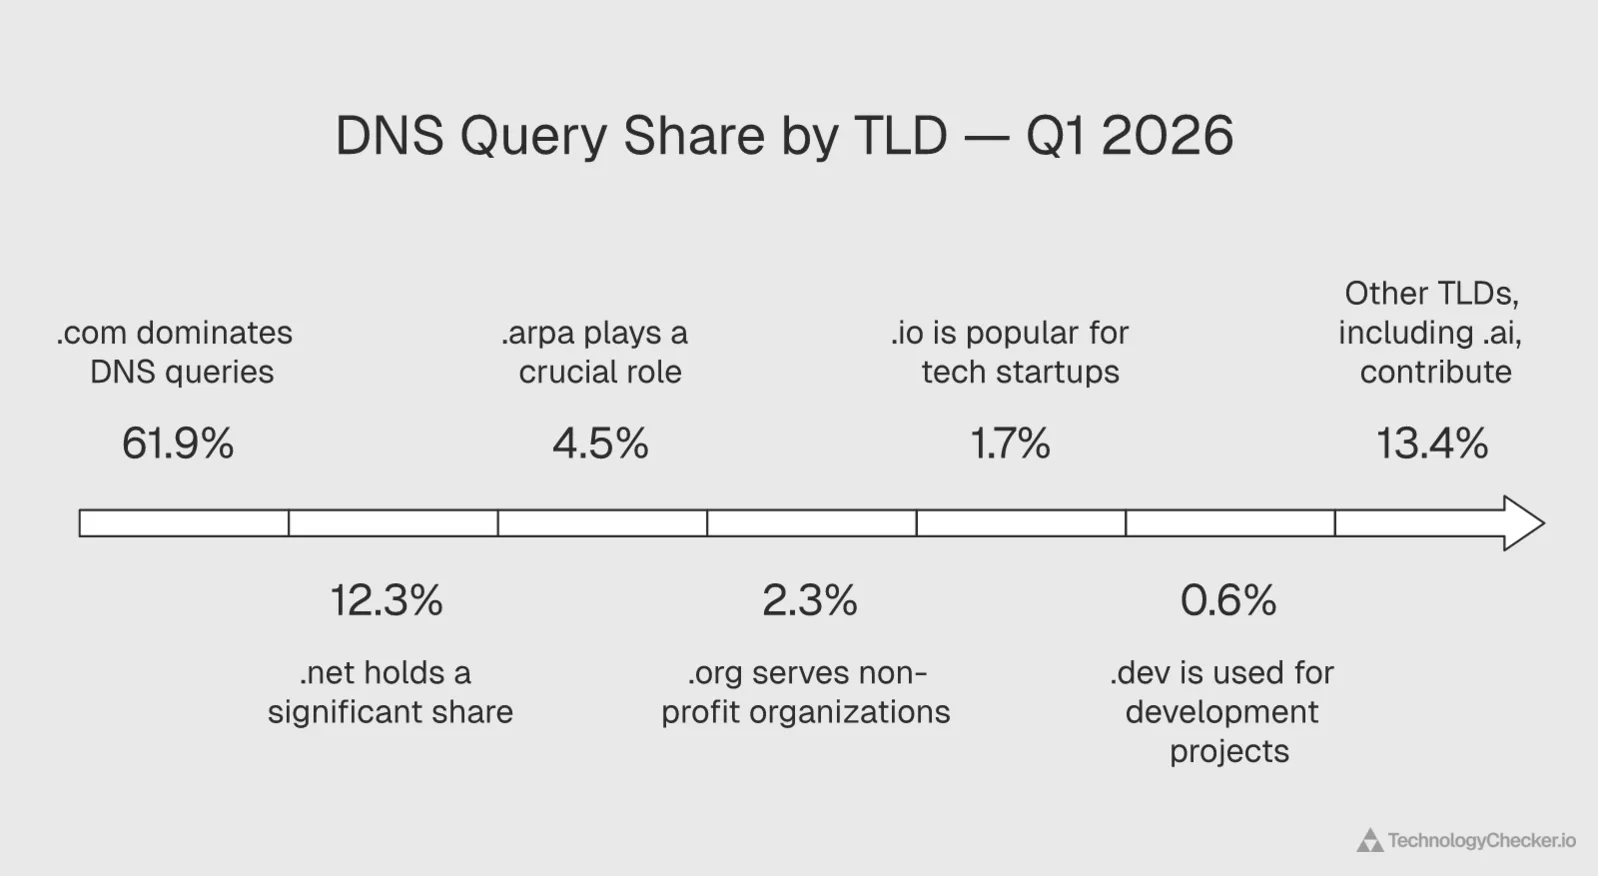
Cloudflare's 1.1.1.1 resolver processes over 67 million DNS queries every second. That volume makes it one of the most reliable proxies for tracking where internet activity is shifting. During Q1 2026, we watched the DNS data for signals of AI's growing presence in the domain name system.
Here's what the TLD distribution looked like:
| TLD | Query share (Q1 avg) | Q1 trend |
|---|---|---|
| .com | 61.86% | Declined from 60.8% to 58.9% |
| .net | 12.31% | Stable |
| .io | 1.72% | Grew from 1.65% to 1.76% (+7%) |
| .dev | 0.61% | Stable |
| "Other" (incl. .ai) | ~16% avg | Grew from 14.7% to 17.6% (+20%) |
May 2026 update — the "other" TLD rush kept unwinding: Full-month May figures put .com at 60.80%, .net at 11.75%, .io at 1.66%, and the "other" bucket down to 14.33% — now below where Q1 began (14.7%). The 20% in-quarter "other" surge we read as a proxy for the AI domain rush reversed in April and kept sliding in May. NXDOMAIN eased to 9.88%, under 10% for the first time in the series, consistent with speculative registration cooling rather than converting to real usage. Of all four Q1 narratives, this is the one the Q2 data has now firmly retired.
The .com TLD still dominates, but its share dropped from 60.8% of queries in early January to 58.9% by late March. At 67 million queries per second, a 2-point shift represents billions of daily queries moving to alternative TLDs.
The real story is the "other" category. This bucket includes .ai, .app, .xyz, and dozens of newer TLDs. It surged 20% within a single quarter. Cloudflare doesn't break out .ai separately yet, but the growth pattern aligns with the AI domain registration boom we've been tracking through our own popular technology data by category..
Why NXDOMAIN rates matter more than registration counts
Surveys can tell you how many .ai domains were registered. They can't tell you how many are actually being used. DNS data can.
10.74% of all DNS queries in Q1 hit non-existent domains (NXDOMAIN responses). One in ten queries pointed to domains that don't resolve. That's a direct measure of speculative activity, typosquatting, and recently expired registrations. For AI-related TLDs, this rate ran even higher, which suggests aggressive domain parking and speculation around AI brand names.
Domain registrations get headlines. NXDOMAIN rates tell you how much of it is real.
A geopolitical footnote
One anomaly worth flagging: .ru domains spiked to 2.16% of queries in mid-March before settling back to baseline. We've documented similar patterns in our cloud provider traffic share analysis. These spikes typically correlate with geopolitical events driving infrastructure changes or traffic rerouting.
For sales teams prospecting into AI-adjacent markets, the DNS layer is your earliest warning system. Domain speculation in a technology category tends to precede the buying cycle by 6-12 months.
Layer 2: ChatGPT enters the top 15 global domains
![]()
Domain rankings based on actual HTTP traffic paint the clearest picture of real adoption. And the Q1 2026 rankings delivered one result that would've seemed absurd two years ago.
chatgpt.com. Global rank #11.
| Rank | Domain | Category |
|---|---|---|
| 1 | google.com | Search |
| 3 | cloudflare.com | Infrastructure |
| 5 | apple.com | Hardware/services |
| 6 | microsoft.com | Enterprise software |
| 7 | facebook.com | Social media |
| 10 | fbcdn.net | CDN (Meta) |
| 11 | chatgpt.com | Generative AI |
| 12 | amazon.com | E-commerce |
| 22 | bing.com | Search (AI-powered) |
| 51 | sentry.io | Developer tooling |
ChatGPT now generates more traffic than Amazon. It sits between Meta's CDN and the world's largest e-commerce platform. No other AI-native platform appears anywhere in the global top 100.
May 2026 update — chatgpt.com slipped to #25, amazon.com retook #11: On the May 31, 2026 Radar popular-domains snapshot, chatgpt.com sits at #25 (it was #26 on May 24, so this is stable, not a one-day dip) while amazon.com is back at #11. The clean Q1 ordering, with chatgpt.com ahead of amazon.com, has flipped. Part of the move is compositional: the May top 10 surfaces more infrastructure and CDN domains (googleapis #2, gstatic #4, amazonaws #8, googlevideo #9) than the Q1 list this table was built from, which pushes consumer domains down. Part may be real softening in chatgpt.com's DNS-popularity signal. Either way, the Q1 claim that ChatGPT "generates more traffic than Amazon" does not hold in the May snapshot. Note the distinction from Layer 4 below: ChatGPT still holds the #1 generative AI service rank by traffic volume. The domain-popularity signal and the service-usage signal have diverged.
Microsoft's AI Economy Institute found that generative AI adoption reached 16.3% of the world's population, up from 15.1% in the first half of 2025. Our traffic data puts a concrete shape on that number: ChatGPT's position at #11 globally requires hundreds of millions of monthly active users, and it's not sharing the spotlight. OpenAI confirmed 900 million weekly active users in February 2026 — our updated ChatGPT statistics report tracks the full revenue, country, and crawl breakdown behind that number. The next AI-native domain (claude.ai, perplexity.ai, deepseek.com) doesn't crack the top 100.
Where that traffic is coming from
Global domain ranks obscure geography. A consumer AI usage survey fielded by KPMG and the University of Melbourne (48,000 respondents) makes the source of ChatGPT's volume clearer — and it flips the usual narrative about where AI lands first.
Consumer AI Usage by Country 2025: India and Nigeria Lead at 92%
In 2025, India and Nigeria reported the world's highest consumer AI usage rates at 92 percent each, followed by UAE (91%), Egypt (90%), and China (89%). Emerging economies dominate the top of the list — every country with 85%+ usage is classified as an emerging market. Advanced economies such as Singapore (73%) trail the leaders by nearly 20 percentage points.
Source: KPMG International; The University of Melbourne · 2025
| Country | Share of respondents (%) |
|---|---|
| India | 92% |
| Nigeria | 92% |
| UAE | 91% |
| Egypt | 90% |
| China | 89% |
| Saudi Arabia | 88% |
| Costa Rica | 87% |
| South Africa | 83% |
| Brazil | 82% |
| Türkiye | 81% |
| Mexico | 77% |
| Argentina | 75% |
| Colombia | 74% |
| Singapore | 73% |
- Emerging economies dominate — every country at 85%+ AI usage is classified as emerging
- India and Nigeria tie for #1 at 92%, reflecting AI's role as a productivity leapfrog in high-growth markets
- Singapore at 73% is the highest-ranked advanced economy — still 19 points behind the leaders
Every country at the top is an emerging market. India and Nigeria tie at 92%, UAE and Egypt clear 90%, and China sits at 89%. The first advanced economy on the list, Singapore at 73%, is 19 points behind the leaders. That matches what we see in Cloudflare's DNS data where the "other" TLD bucket (including newer markets) grew 20% in Q1 — the fastest layer in the stack. The population adopting AI aggressively is not where the English-language AI press is written.
What's missing from the trending lists tells a story too
No AI platforms appear in the "trending rise" domain lists. That's not because growth has stalled. It's because ChatGPT has moved past "trending" entirely. When a domain stops rising fast and holds steady in the top 15, it's no longer a trend. It's infrastructure.
Bing at #22 is worth watching separately. As the backend for Microsoft Copilot, its steady ranking reflects AI-powered search growth rather than traditional Bing usage.
One more signal. Developer tooling platform sentry.io climbed to #51 globally. That's a second-order effect of AI adoption: AI-assisted coding drives more deployments, more error tracking, more developer tool usage. Harvard Business Review's February 2026 analysis found 88% of companies report regular AI use. Our traffic data shows what that 88% is actually using: overwhelmingly ChatGPT, with everything else fighting for a distant second.
Government capacity is clustered tight — except at the top
Consumer adoption tells you where demand shows up. Government AI readiness tells you where public-sector AI policy has the infrastructure to absorb it. Oxford Insights' 2025 Government AI Readiness Index (published via Statista's Q2 2026 AI dossier) scores the top 15 countries on their capacity to deploy AI across healthcare, education, and administration.
Government AI Readiness Index 2025: US Leads at 87.2
The United States tops the 2025 Government AI Readiness Index with a score of 87.2, followed by the United Kingdom (77.64), France (77.27), the Netherlands (75.57), and China (75.55). The index measures a government's capacity to implement AI across public services — healthcare, education, transportation, and administration. The US lead of nearly 10 points over #2 is the largest gap in the top 15.
Source: International Development Research Centre; Oxford Insights · 2025
| Country | AI readiness index score |
|---|---|
| United States | 87.2 |
| United Kingdom | 77.64 |
| France | 77.27 |
| Netherlands | 75.57 |
| China | 75.55 |
| Germany | 75.5 |
| Singapore | 74.36 |
| South Korea | 73.54 |
| Australia | 73.16 |
| Norway | 72.33 |
| Canada | 72.26 |
| Spain | 71.95 |
| Denmark | 71.41 |
| Japan | 70.99 |
| Saudi Arabia | 69.79 |
- US lead of nearly 10 points over #2 is the largest gap anywhere in the top 15
- China (#5) and Saudi Arabia (#15) are the only non-OECD countries in the leading cluster
- The top 15 all score above 69 — government AI capacity is clustered tightly outside the US
The United States sits almost ten points ahead of the UK, the largest single-country gap anywhere in the top 15. Outside that lead, everyone is bunched: 13 of the top 15 score between 69 and 78. China is the only non-OECD country in the top five. Pair this against the consumer usage chart and a picture forms — emerging markets lead on consumer uptake, but advanced economies still dominate the government capacity to build AI into public services.
Layer 3: A three-tier AI crawler economy is forming
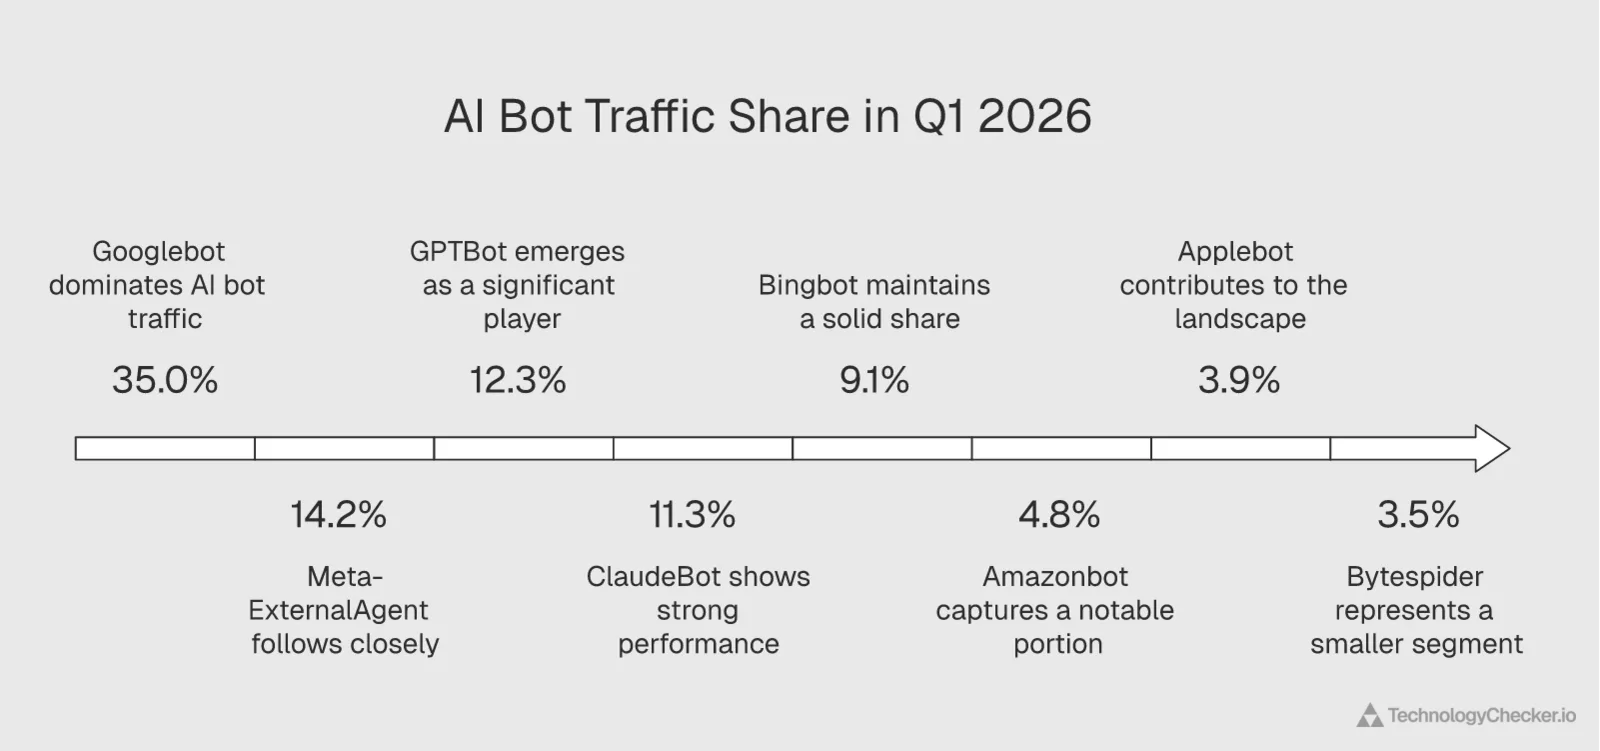
Every major AI company needs web data. They need it to train models, power search features, and serve real-time user queries. We tracked nine major AI bot user agents across Q1 2026, and the traffic patterns reveal an ecosystem that's maturing fast.
Total AI bot traffic increased roughly 34% over the quarter, measured by a normalized index rising from 0.71 to 0.95.
| Bot | Traffic share | Q1 trend | Primary purpose |
|---|---|---|---|
| Googlebot | 35.0% | Stable | Mixed (search + training) |
| Meta-ExternalAgent | 14.2% | +43%, from 11% to 15.7% | Training |
| GPTBot | 12.3% | -30%, from 12.4% to 8.6% | Training |
| ClaudeBot | 11.3% | Stable at 11-13% | Training |
| Bingbot | 9.1% | Stable | Search + Copilot |
| Amazonbot | 4.8% | Stable | Alexa AI / training |
| Applebot | 3.9% avg, peaked 10.2% | 5x surge by late March | Apple Intelligence |
| Bytespider | 3.5% | Grew to 4.5% | Training (ByteDance) |
| OAI-SearchBot | 2.2% | Stable | SearchGPT |
May 2026 update — Bytespider surged to #4, Applebot retreated, GPTBot rebounded: The April ranking order did not hold. In May, Googlebot eased to 27.26%, Meta-ExternalAgent slipped to 13.23%, and GPTBot rebounded to 11.48%, recovering most of the decline we had flagged as structural in April. The headline mover is Bytespider (ByteDance) at 10.25% (up from 5.73%), now the #4 crawler, ahead of ClaudeBot (9.73%) and Bingbot (8.45%). Applebot fell back to 7.01%, undoing the "Applebot is becoming structural" April read. Anthropic's Claude-SearchBot also entered the top 10 at 2.22% as OAI-SearchBot dropped out. The honest revision to the Q1 line "OpenAI's share is shrinking while Meta's and Apple's are growing": across two months of Q2, OpenAI's share recovered, Apple's faded, and the actual gainer was ByteDance.
Three things jumped out at us.
Meta is crawling the web harder than anyone expected

Meta-ExternalAgent was the quarter's biggest gainer. From 11% to 15.7% of AI bot traffic in 92 days. Meta has been relatively quiet about its training data strategy compared to OpenAI or Google. The crawl data tells a different story. They're consuming web content at an accelerating rate, which aligns with their Llama model development timeline. When a company's crawling ramps like this, a major model release is usually 2-4 months away.
OpenAI pulled back. The question is why.
GPTBot traffic dropped 30% across the quarter, from 12.4% to roughly 8.6%. This was the single most significant shift we observed.
Two explanations. OpenAI may have accumulated enough training data for their current model pipeline. Or the growing publisher resistance to AI crawlers, which we documented in our robots.txt blocking analysis, is having a measurable effect. Probably both. The practical result is the same: OpenAI's share of the crawl economy is shrinking while Meta's and Apple's are growing.
Apple's crawl volume says more than any WWDC keynote
Applebot surged from 2% of AI bot traffic to 10.2% by late March. A 5x increase in a quarter. Apple Intelligence launched in late 2025 with limited capabilities, and the reviews were mixed. But this crawl volume tells us they're training something far bigger than what shipped. When Apple moves quietly and at scale, you pay attention.
Training, search, and user action: the three tiers
The bot traffic breaks into three purpose tiers that reveal what the industry is building — the same training, search, and user-action split we break down in our AI crawler statistics report:
| Crawl purpose | Share (Q1 avg) | Q1 trend |
|---|---|---|
| Training | 45.4% | Grew from 42% to 52% |
| Mixed purpose | 44.1% | Declined from 48% to 44% |
| Search | 8.0% | Declined from 7.4% to 6.3% |
| User action | 2.1% | Stable |
May 2026 update — training held, but search crawls woke up: Training crawls held at 51.80% in May (Q1 close 52%, April 51.5%), the steadiest line in the dataset. Mixed Purpose eased to 35.71% and User Action ticked to 2.58%. The change worth flagging is Search, which rose to 9.33%, its highest in the series (Q1 ended at 6.3%, April was 7.5%), coinciding with Anthropic's Claude-SearchBot entering the crawler top 10. Model-builder demand is still the dominant signal, but the pure-training-versus-everything-else gap is narrowing as retrieval crawlers grow.
Training crawls grew from 42% to 52% of all AI bot activity during Q1. More foundation models are coming. The industry hasn't finished building. McKinsey's State of AI survey found that 80% of high-performing companies set growth and innovation as AI objectives, not just efficiency. The crawl data shows model builders responding to that demand in real time.
Meanwhile, search-purpose crawls actually declined. AI-powered search (OAI-SearchBot, parts of Bingbot) is still a small slice of the bot economy. The real volume is in training.
What the bots are after
| Industry | Bot traffic share |
|---|---|
| Retail | 28.2% |
| Computer software | 13.6% |
| Information technology | 5.8% |
| Internet | 5.0% |
| Gambling & casinos | 2.8% |
Retail dominates at 28.2%. Product catalogs, reviews, pricing pages, comparison content: it's structured, factual data that AI models need. If you're in e-commerce, AI bots are your second-largest traffic source after Google. The gambling number (2.8%) is surprising until you realize that casino and sports betting sites are among the most structured, data-rich websites on the internet.
Vention's 2026 AI report found that 93% of companies are already using AI in some capacity. Our bot data adds color to that number: the AI tools those companies use are themselves consuming web content at an accelerating pace, creating a feedback loop. More adoption means more crawling means more capable models means more adoption.
Layer 4: The generative AI rankings tell us who's winning
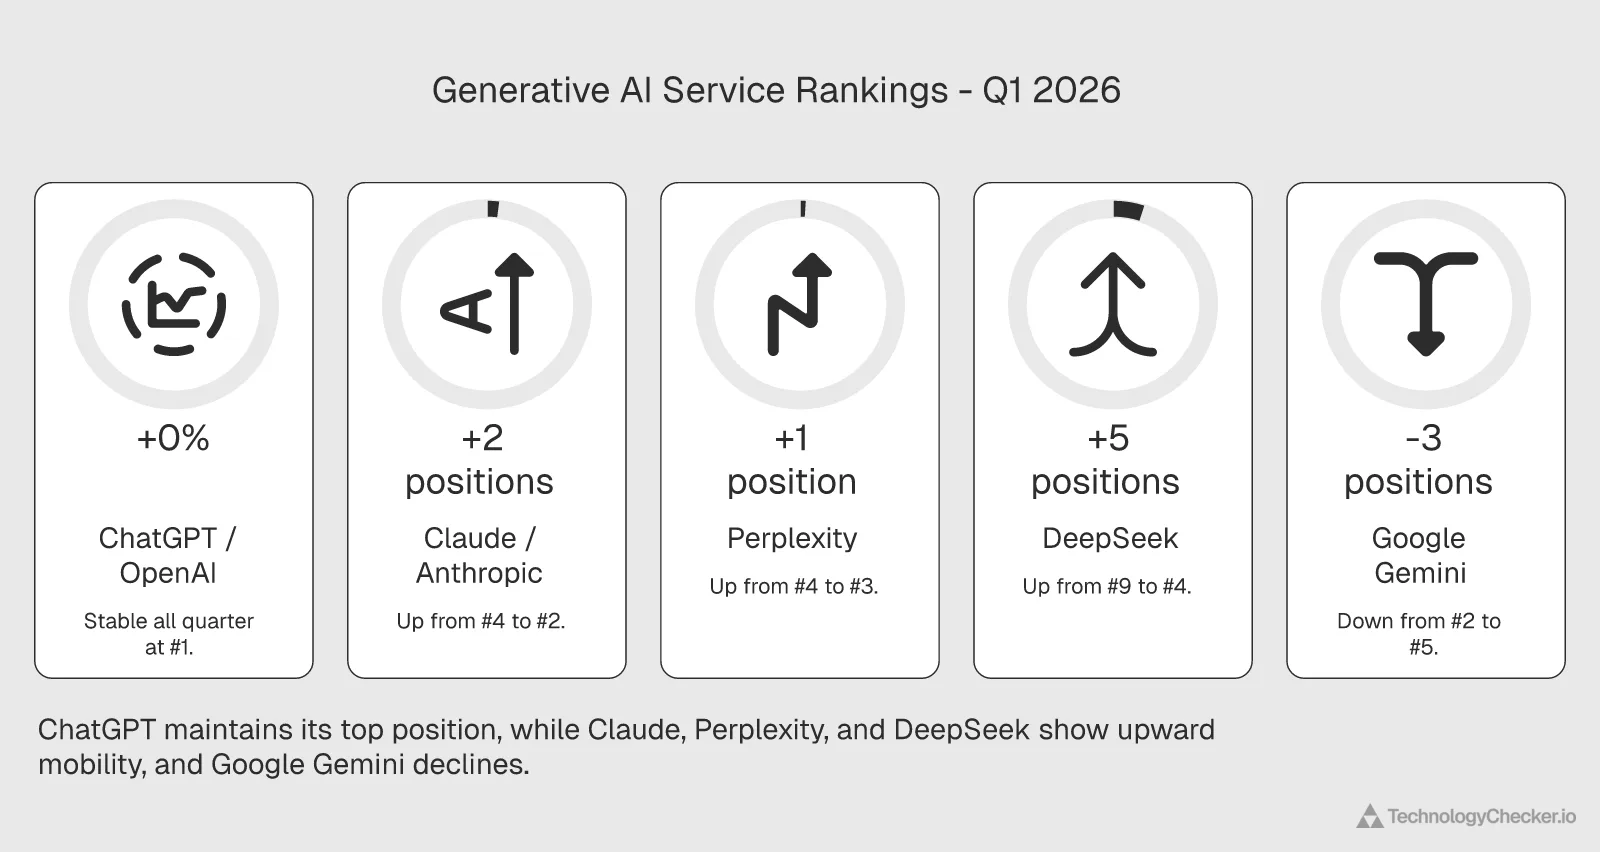
Cloudflare Radar tracks generative AI service usage daily. These rankings reflect actual user traffic, not app store downloads or press mentions. The Q1 2026 picture is a market consolidating fast at the top and churning hard below.
| Rank | Service | Q1 movement |
|---|---|---|
| 1 | ChatGPT / OpenAI | #1 for 92/92 days |
| 2 | Claude / Anthropic | Rose from #4 to #2 by mid-Jan, held 85+ days |
| 3 | Perplexity | Stable #3 |
| 4 | DeepSeek | Rose from #9-10 to #4 in 3 weeks (late Jan) |
| 5 | Google Gemini | Fell from #2 to #5 by mid-Feb |
| 6 | Character.AI | Stable |
| 7 | Grok / xAI | Stable |
| 8 | Suno AI | Stable |
| 9 | GitHub Copilot | Volatile, #5-9 weekday/weekend pattern |
| 10 | Doubao | Intermittent new entrant |
May 2026 update — Gemini retook #4, Copilot climbed, two new entrants: The May 31, 2026 GenAI service ranking keeps the top three frozen (ChatGPT #1, Claude #2, Perplexity #3) but reshuffles below them. Gemini recovered to #4, pushing DeepSeek to #5, a partial reversal of the Q1 "Gemini collapse" story; Google clawed back one spot. GitHub Copilot climbed from #9 to #6, consistent with the weekday/weekend enterprise-coding pattern described below. Windsurf AI graduated from the Q1 "top 20" into the top 11, and QuillBot entered at #12, more of the category fragmentation the Q1 rankings first hinted at. Doubao held #10. The May read: consolidation at the very top, churn from #4 down.
The market size behind the rankings
Service rankings show who is winning. They don't show what the prize is worth. Statista Market Insights forecasts that the generative AI segment alone will grow from roughly $5.5 billion in 2020 to $442 billion by 2031.
Generative AI Market Forecast 2020-2031: $5.5B to $442B
The generative AI segment of the AI market is projected to grow from roughly $5.5 billion in 2020 to $442 billion by 2031 — an 80x expansion. The 2024 market size of $37.87 billion is forecast to rise by $404.2 billion over the 2024-2031 period. GenAI growth rates peak in 2024 (+85%) and taper to ~20% by 2031 as the base gets larger.
Source: Statista Market Insights · 2020-2031
| Year | Market size (billion USD) |
|---|---|
| 2020 | $5.51B |
| 2021 | $8B |
| 2022 | $12B |
| 2023 | $20B |
| 2024 | $37.87B |
| 2025 | $67B |
| 2026 | $108B |
| 2027 | $161B |
| 2028 | $224B |
| 2029 | $294B |
| 2030 | $367B |
| 2031 | $442.07B |
- 2026 GenAI market hits $108B — more than 3x the 2024 actual of $37.87B
- GenAI grows 80x between 2020 and 2031 — fastest sub-segment in the AI dossier
- Peak growth year is 2024 at +85%; by 2031 growth decelerates to ~20% as the base scales
The 2026 mark is projected at $108 billion — roughly 3x the 2024 actual of $37.87 billion. When ChatGPT holds #1 for 92 consecutive days in a market growing at that pace, the durability of its lead compounds with every quarter it doesn't lose ground. Peak growth year is 2024 at +85%, and by 2031 growth decelerates to ~20% as the base scales. The window for displacing incumbents closes fastest between now and 2028.
ChatGPT's lock is tighter than you think
Number one every single day. 92 out of 92 days. No wobbles, and it still held the #1 generative AI service rank in the May 31, 2026 snapshot. When a product holds rank #1 in its category for an entire quarter and beyond, displacement becomes a structural problem for competitors, not just a product quality question. You'd need to change user habits at a scale that hasn't happened in consumer tech since the smartphone transition.
Claude's rise isn't noise. It's an enterprise signal.
Anthropic's Claude moved from #4 to #2 by mid-January and held that position for 85+ consecutive days. Not a spike. A sustained shift.
Claude overtook Google Gemini, which held #2 for most of late 2025. The reason matters: Claude's focus on safety, long-context windows, and business-facing use cases is winning the segment where revenue concentration is highest. Deloitte found that only 34% of enterprises are truly reimagining their businesses around AI. The ones that are tend to pick tools built for enterprise workflows, not consumer chatbots.
DeepSeek's three-week rocket

From rank #9-10 to #4 in three weeks. That happened in late January, driven by DeepSeek's open-source model releases. The open-source angle matters here. According to NVIDIA's State of AI report, North America leads with 70% actively using AI, 27% assessing, and just 3% not using it at all. Open-source models give the "assessing" cohort a way to experiment without procurement cycles.
Whether DeepSeek sustains this position depends on trial-to-retention conversion. The daily data suggests they're holding, but the signal is noisier than Claude's steady line.
What happened to Gemini?

From #2 to #5 in about a month. Despite massive cloud infrastructure, deep integration across Workspace, Android, and Search, and distribution advantages no competitor can match, Gemini lost ground to Claude and DeepSeek simultaneously.
The market is choosing specialized AI tools over bundled ones. That's an unusual dynamic. Google has never lost a market where distribution was the deciding factor, but generative AI is apparently not that kind of market. Product quality, or at least perceived product quality, is winning.
The weekday/weekend pattern and what it reveals
GitHub Copilot bounces between #5 and #9, with clear weekday peaks and weekend drops. That's the fingerprint of enterprise adoption. A tool deeply embedded in work routines but ignored on Saturday.
Compare that to Character.AI and Suno AI. Their rankings are flat across weekdays and weekends. Consumer products. The weekday/weekend split is how you identify real B2B adoption from traffic data alone, without asking anyone a survey question.
Two new categories are forming
Windsurf AI (an AI coding assistant) and Manus (an AI agent platform) both entered the top 20 during Q1. They represent something the rankings haven't shown before: category fragmentation.
McKinsey found that 62% of organizations are at least experimenting with AI agents. Manus's appearance in the rankings is the traffic-level confirmation of that survey data. AI is fragmenting from "general chatbot" into specialized vertical tools, and the ranking data captures this as it happens. But Deloitte's enterprise survey adds a caution: only one in five companies has a mature governance model for autonomous AI agents. The adoption is outrunning the guardrails.
The macro AI market behind the Q1 traffic data
The four internet layers measure current behavior. Statista's Q2 2026 AI dossier measures the trajectory — where the market was, where it's forecast to go, and which cohorts are driving the curve. The telemetry tells you what is happening now. The forecast tells you whether now is early, peak, or late.
AI market size 2020-2031: 17.7x over the decade
Global AI Market Forecast 2020-2031: $94B to $1.67 Trillion
The global AI market is forecast to grow from $94.81 billion in 2020 to $1.675 trillion by 2031 — a 17.7x expansion over the decade. Between 2026 and 2031 alone, the market is projected to add $1.3 trillion (+382.65 percent). Growth is not linear: 2022 dipped to $126.78B from the 2021 surge to $206.34B before resuming its long-term trajectory. The strongest compounding happens after 2027.
Source: Statista Market Insights · 2020-2031
| Year | Market size (billion USD) |
|---|---|
| 2020 | $94.81B |
| 2021 | $206.34B |
| 2022 | $126.78B |
| 2023 | $137.5B |
| 2024 | $186.93B |
| 2025 | $254.5B |
| 2026 | $347.05B |
| 2027 | $473.98B |
| 2028 | $648.34B |
| 2029 | $888.24B |
| 2030 | $1218.8B |
| 2031 | $1675B |
- 2026 market size hits $347B — roughly the combined revenue of the world's top five SaaS companies
- Forecast implies +$1.3 trillion in new market value between 2026 and 2031
- 2022's dip to $126.78B from the 2021 peak of $206.34B is the only contraction year in the series
The worldwide AI market is modeled to grow from $94.81 billion in 2020 to $1.675 trillion by 2031 — an addition of $1.3 trillion between 2026 and 2031 alone. The 2022 dip to $126.78B from the 2021 surge to $206.34B is the only contraction year in the series, and it resolved the following year. Everything after 2024 is forecast, but the 2020-2024 actuals match the trajectory the infrastructure layer confirms: usage is not decelerating. The 34% quarterly growth in AI bot traffic we measured in Q1 aligns with the dossier's implied annualized growth rate through 2028.
User base crosses 500 million by 2028
AI Users Worldwide 2020-2030: From 116M to 729M
The global AI user base is projected to grow from 115.9 million in 2020 to 729.1 million by 2030 — a 6.3x expansion. The 500M threshold is expected to be crossed by 2028. User growth is consistent year-over-year with no dip, in contrast to the revenue series which contracted in 2022.
Source: Statista Technology Market Insights · 2020-2030
| Year | Users (millions) |
|---|---|
| 2020 | 115.9M |
| 2021 | 154.3M |
| 2022 | 201.4M |
| 2023 | 254.8M |
| 2024 | 314.4M |
| 2025 | 378.8M |
| 2026 | 451.8M |
| 2027 | 529.8M |
| 2028 | 605.9M |
| 2029 | 673.8M |
| 2030 | 729.1M |
- AI users surpass 500 million by 2028 under the current forecast
- 2026 user count of 451.8M roughly matches the monthly active base ChatGPT alone commands
- 6.3x total user growth over the decade — steady compound growth, no contraction years
Revenue forecasts get challenged. User count forecasts are cleaner. Statista's model grows the global AI user base from 115.9 million in 2020 to 729.1 million by 2030 — a 6.3x expansion with no contraction year. The 451.8 million projected for 2026 is roughly the monthly active base ChatGPT alone commands today. Which means either the forecast is conservative, or a meaningful share of ChatGPT users aren't being counted as "AI users" yet by this methodology. Both readings support the infrastructure pattern.
The unicorn signal: from 6% to 53%
AI Share of New Unicorns 2015-2025: From 6% to 53%
In 2025, 53 percent of new unicorn births worldwide were AI startups — up from 6 percent in 2015 and 44 percent in 2024. Growth accelerated sharply between 2023 and 2025, roughly tripling the AI share of new billion-dollar companies in three years. CB Insights reports that one in five new unicorns in 2025 are AI agents.
Source: CB Insights · 2015-2025
| Year | AI share of new unicorns (%) |
|---|---|
| 2015 | 6% |
| 2016 | 11% |
| 2017 | 15% |
| 2018 | 17% |
| 2019 | 23% |
| 2020 | 14% |
| 2021 | 18% |
| 2022 | 17% |
| 2023 | 32% |
| 2024 | 44% |
| 2025 | 53% |
- 53% of 2025 unicorn births were AI startups — more than half of all new billion-dollar companies
- The 2023-2025 acceleration (32% → 53%) maps directly to the GenAI funding wave post-ChatGPT launch
- One in five new 2025 unicorns are AI agents, per CB Insights — an emerging category inside the category
In 2015, 6% of new unicorn startups worldwide were AI companies. In 2025, 53% were — more than half of all new billion-dollar valuations in a single year. The inflection point is 2023-2025, which maps cleanly to the post-ChatGPT funding wave. CB Insights also notes that one in five new 2025 unicorns are AI agents specifically — a sub-category inside a category that didn't meaningfully exist two years ago. The same signal that made Manus and Windsurf appear in our Cloudflare Layer 4 rankings is showing up in the VC data.
Enterprise adoption: the 23-point year
Enterprise AI Adoption 2024: 78% Globally, 82% in North America
Organizational AI use grew from 55% in 2023 to 78% in 2024 globally — a 23-point jump in a single year. North America leads at 82%, followed by Europe (80%), Developing markets (77%), Greater China (75%), and Asia-Pacific (72%). The largest year-over-year gain came in developing markets (+28 points), likely reflecting laxer regulation and lower procurement friction.
Source: McKinsey & Company; Stanford University · 2023-2024
| Region | Share of organizations using AI (%) |
|---|---|
| All geographies | 78% |
| North America | 82% |
| Europe | 80% |
| Developing markets | 77% |
| Greater China | 75% |
| Asia-Pacific | 72% |
- Global enterprise AI adoption jumped 23 points year-over-year (55% → 78%)
- Developing markets posted the largest gain (+28 points) — less regulation means faster rollouts
- North America leads in absolute terms (82%), but growth is actually faster elsewhere
McKinsey's Global Survey found that organizational AI use jumped from 55% in 2023 to 78% in 2024 — a 23-point year-over-year gain globally. The biggest regional move came in developing markets, where AI adoption rose 28 points (49% → 77%), likely because procurement friction and regulatory overhead are lower. North America still leads in absolute terms at 82%, but the growth rate is actually faster elsewhere. The production gap remains: using AI in "at least one function" is a low bar, and Deloitte's finding that only 20% of organizations are generating revenue from AI still holds underneath these numbers.
Where AI becomes a required skill
AI as Core Skill by Industry 2025-2030: 66% in Tech & Telecom
66% of employers in information technology services and telecommunications expect artificial intelligence and big data to be core worker skills between 2025 and 2030 — tied for the highest share of any industry, according to the World Economic Forum and Qualtrics' Future of Jobs survey of 1,000 employers. Financial services (61%), insurance (58%), education (56%), and automotive/aerospace (54%) round out the top six. Professional services (37%) and infrastructure (39%) rank lowest, but every industry surveyed expects more than a third of its workforce to need AI skills by 2030.
Source: Qualtrics; World Economic Forum · 2025-2030
| Industry | Share of employers (%) |
|---|---|
| Info tech services | 66% |
| Telecommunication | 66% |
| Financial services | 61% |
| Insurance | 58% |
| Education | 56% |
| Automotive/aerospace | 54% |
| Medical/healthcare | 51% |
| Government | 50% |
| Electronics | 44% |
| Supply chain | 44% |
| Real estate | 43% |
| Consumer goods production | 42% |
| Retail & wholesale | 41% |
| Infrastructure | 39% |
| Professional services | 37% |
- Tech and telecom tie at 66% — AI skills are effectively non-optional in those verticals
- Financial services and insurance (61% and 58%) signal a compliance + risk-driven AI skill demand
- Even the lowest-ranked industry (professional services) sits at 37% — there is no low-AI-skill industry
A World Economic Forum employer survey (1,000 respondents) asked which industries expect AI and big data to be core worker skills between 2025 and 2030. Information technology services and telecommunications tie at 66% — effectively, AI skill is no longer optional in those verticals. Financial services (61%) and insurance (58%) are compliance-and-risk-driven: regulation plus model risk management plus fraud detection all push AI deep into day-to-day work. Even the lowest-ranked industry (professional services at 37%) sits above a third of employers. There is no AI-exempt industry in the 2025-2030 outlook.
The agentic AI bottleneck is regional
Top Barriers to Agentic AI in Production 2025: 60% Cite Agent Management
60% of senior IT leaders in Asia-Pacific cite managing and monitoring AI agents at scale as the top barrier to putting agentic AI into production in 2025 — the highest rate globally, according to Dynatrace and Qualtrics' survey of 919 respondents. In EMEA, 50% cite the same barrier. The Americas reverses the order — 51% cite shortage of skilled staff as the #1 obstacle versus 45% citing management overhead. The regional split: in Asia and Europe, the problem is operational complexity; in the Americas, it is talent supply.
Source: Dynatrace; Qualtrics · 2025
| Barrier | Share of respondents (%) |
|---|---|
| Managing agents at scale | 60% |
| Shortage of skilled staff | 51% |
- APAC has the hardest time scaling agent operations (60%) — 15 points higher than the Americas
- The Americas is the only region where talent shortage (51%) outranks operational complexity
- EMEA sits in the middle on both dimensions — neither the hardest to hire nor the hardest to operate
A Dynatrace/Qualtrics study (919 IT and line-of-business leaders) asked about the hardest parts of moving agentic AI into production. The answer depends on where you are. APAC (60%) and EMEA (50%) name managing and monitoring agents at scale as their #1 barrier. The Americas flip the order: 51% cite a shortage of skilled staff versus 45% citing operational complexity. This is the clearest regional divergence in the dossier. In Asia and Europe, the agent problem is operational. In the Americas, it is labor-market. Either way, it lines up with the weekday/weekend Copilot pattern we saw in Layer 4 — enterprise AI adoption is hitting limits, and those limits are different in different places.
What the September 2025 Statista in-depth report adds
The Q2 2026 dossier we leaned on earlier is a 33-page summary. The September 2025 in-depth report (study ID 50485, 295 pages) is the full long-form analysis behind it — and it surfaces five datasets we didn't have at our April refresh. They sharpen the picture of where the AI adoption curve actually bends.
Enterprise AI adoption: a 52-point expansion in 7 years
Global AI Business Adoption 2017-2024: From 20% to 72% in Seven Years
Global AI adoption in businesses jumped from 20 percent in 2017 to 72 percent in 2024 — a 3.6x expansion. The curve isn't smooth: 2020 (50%) and 2022 (50%) were both years of stalled or slight retreat, often attributed to budget uncertainty and the gap between early-experiment cohorts and broader rollout. The 17-point spike from 55% (2023) to 72% (2024) is the steepest single-year jump in the series — driven by generative AI moving from pilots into production functions. Cross-reference this with the deployed-vs-exploring gap by country: the 72% headline still hides large differences in how much of that AI use is actually in production.
Source: IDC; McKinsey via Statista · 2017-2024
| Year | Share of businesses using AI (%) |
|---|---|
| 2017 | 20% |
| 2018 | 47% |
| 2019 | 58% |
| 2020 | 50% |
| 2021 | 56% |
| 2022 | 50% |
| 2023 | 55% |
| 2024 | 72% |
- 20% (2017) → 72% (2024): a 52-point expansion in 7 years
- 2024's +17-point jump from 55% to 72% is the largest single-year gain on record
- The 2020 and 2022 plateaus show enterprise AI adoption is not a straight line — macroeconomic conditions slow it
The IDC/McKinsey survey series is the longest comparable enterprise-AI-adoption benchmark we have. From 20 percent of businesses using AI in 2017 to 72 percent in 2024, the curve isn't smooth — 2020 and 2022 were both flat or slight retreats, tied to macroeconomic budget cycles. What stands out in the 2024 number is the +17-point jump from 2023's 55 percent. That's the largest single-year gain in the entire series and maps cleanly to the generative AI productionisation wave we see in our Layer 3 bot data (training crawls went from 42 percent to 52 percent in the same window).
The 72 percent number is also where most "AI adoption" coverage stops. The next chart is the more useful one.
The deployment gap: 72% adoption hides who's actually in production
AI Deployed vs Exploring by Country 2024: China and India Already Past 'Exploring'
China (58%) and India (57%) lead in actual AI deployment in 2024 — and they're the only two countries where the deployed share is higher than the exploring share. Every other country surveyed by Vention still has more organizations exploring AI than deploying it. The US sits at 25% deployed / 43% exploring; the UK at 26% / 47%. The deployed-to-exploring gap is the cleanest signal of which countries are past the experimentation phase and which are still planning.
Source: Vention via Statista · 2024
| Country | Share of organizations (%) |
|---|---|
| China | 58% |
| India | 57% |
| Italy | 42% |
| Singapore | 39% |
| UAE | 38% |
| Germany | 34% |
| France | 31% |
| Spain | 31% |
| Latin America | 29% |
| Canada | 28% |
| UK | 26% |
| U.S. | 25% |
| Australia | 24% |
| South Korea | 22% |
| World | 34% |
- China (58%) and India (57%) are the only countries where deployed share exceeds exploring share
- The U.S. sits 12th of 14 countries on deployment despite leading on funding ($471B in 2025)
- World averages: 34% deployed, 42% exploring — most organisations are still in the pre-production phase
Vention's 2024 country-level survey splits AI use into "deployed" (in production) and "exploring" (considering or piloting). Only two countries — China (58 percent deployed) and India (57 percent) — have more organizations running AI in production than evaluating it. Every other country in the survey has a higher exploring share than deployed share. The U.S. sits twelfth out of fourteen at 25 percent deployed versus 43 percent exploring.
That's a meaningful counterweight to the headline 72 percent global adoption number from McKinsey. Yes, businesses have AI somewhere in their stack. No, most of it isn't in production in most countries. The "experimentation-to-production gap" we already flagged from Deloitte's data shows up sharply when you split deployment status by geography.
For GTM teams, this reverses a common assumption: the U.S. is not the easiest market to sell production AI tools into. India and China are. The U.S. is the easiest market to sell pilots into.
Investment doesn't track deployment
AI Investment Leaders 2025: U.S. at $471B Dwarfs Every Other Country
The U.S. ($471B) is investing roughly 4x more in AI than China ($119B) — and the gap between the top two and the rest is even more extreme. The UK ($28B), Canada ($15B), and Israel ($15B) round out the top five, but every country outside the top two sits below $30B. AI investment is the most concentrated metric in the entire dataset: the top two countries account for over 80 percent of tracked AI capital allocation.
Source: Spherical Insights via Statista · 2025
| Country | AI investment (billion USD) |
|---|---|
| U.S. | $471B |
| China | $119B |
| UK | $28B |
| Canada | $15B |
| Israel | $15B |
| Germany | $11B |
| India | $11B |
| France | $9B |
| South Korea | $7B |
| Singapore | $7B |
- The U.S. lead over China ($471B vs $119B) is wider than China's lead over the rest combined
- Israel ($15B) ties Canada for #4 — punching far above its weight per capita
- Top 10 combined ($693B) is roughly 7x the global AI funding flow in 2024 ($100.4B)
Spherical Insights' May 2025 cut shows the U.S. ($471B) ahead of China ($119B) by roughly 4x in total AI investment — and ahead of the next eight countries combined. That number includes VC funding, corporate R&D, government programs (notably the CHIPS and Science Act's $280B commitment), and infrastructure spending.
What's interesting is the disconnect with deployment. The U.S. invests 4x more than China but deploys at less than half the rate. Two readings: (a) U.S. AI investment is overwhelmingly going into data center infrastructure and model R&D rather than enterprise deployment, which matches NVIDIA's market position (almost 100 percent share of AI training compute); (b) Chinese enterprises are deploying off the back of a leaner, more domestically-focused AI stack (Baidu's ERNIE, Alibaba's Qwen, Huawei's Ascend chips). Either reading supports our Layer 3 finding that the U.S.-headquartered crawlers (GPTBot, ClaudeBot) are crawling for future models, not current production workloads.
AI cybersecurity is the fastest-growing AI sub-market
AI Cybersecurity Market 2023-2030: $24B to $134B in Seven Years
The AI cybersecurity market is forecast to grow from $24.3 billion in 2023 to $133.8 billion by 2030 — a 5.5x expansion at roughly 28 percent CAGR. The growth curve accelerates after 2025: each year past 2026 adds more in absolute dollars than the previous one. The driver is the documented breach-cost gap (see the next chart): organizations with extensive AI security automation saved $1.9M per breach in 2024 vs. those with no automation, and that delta is widening.
Source: Techopedia via Statista · 2023-2030
| Year | Market value (billion USD) |
|---|---|
| 2023 | $24.3B |
| 2024 | $31.1B |
| 2025 | $39.8B |
| 2026 | $50.8B |
| 2027 | $65B |
| 2028 | $83.1B |
| 2029 | $106.2B |
| 2030 | $133.8B |
- AI cybersecurity grows 5.5x over 7 years — faster than most AI sub-segments
- 2027 is the inflection point: each subsequent year adds >$18B in absolute market value
- Growth tracks the breach-cost gap — organizations without AI security pay nearly $2M more per incident
Techopedia's AI cybersecurity forecast (via Statista) projects the segment from $24.3B in 2023 to $133.8B by 2030 — a 5.5x expansion. That growth rate is faster than most AI sub-segments in the same window, including the broader machine learning market (32.4 percent CAGR per Statista Market Insights) only because the cybersecurity base is smaller. What matters more than the trajectory is the reason behind it.
The $1.9M reason
Breach Cost by Security Automation 2018-2024: AI Saves $1.9M Per Breach
In 2024, organizations with extensive AI-driven security automation paid an average of $3.8M per data breach. Organizations with no security automation paid $5.7M — a $1.9M gap. The gap has been wider in some years ($3.8M in 2021), but the directional finding has held every year since 2018: more AI automation, lower breach cost. The 2024 number is the clearest ROI signal in the report for AI cybersecurity spending — and explains why 77 percent of organizations expect their cybersecurity budget to grow in 2025.
Source: IBM; Ponemon Institute via Statista · 2018-2024
| Year | Average breach cost (million USD) |
|---|---|
| 2018 | $2.9M |
| 2019 | $2.7M |
| 2020 | $2.5M |
| 2021 | $2.9M |
| 2022 | $3.2M |
| 2023 | $3.6M |
| 2024 | $3.8M |
- 2024 breach-cost gap: $1.9M between extensive-AI use and no automation
- Every year since 2018 has shown a positive gap — AI security ROI is not a 2024 anomaly
- Peak gap was 2021 at $3.8M — pandemic-era manual operations were the costliest
IBM/Ponemon Institute's breach-cost benchmark is the clearest ROI signal in the entire Statista in-depth report. In 2024, organizations with extensive AI security automation paid an average of $3.8M per data breach. Organizations with no security automation paid $5.7M. That $1.9M delta isn't a 2024 anomaly — the gap has been positive every single year since 2018, peaking at $3.8M in 2021 (pandemic-era manual operations were the costliest).
This explains why PwC's 2024 survey found 77 percent of organizations expect their cybersecurity budget to grow in 2025, with 20 percent expecting double-digit-percent increases (PwC via Statista). CFOs don't usually fund "AI strategy." They fund "$1.9M of avoided cost per breach." The framing is what gets the budget approved.
For our Layer 4 service rankings, this means AI cybersecurity platforms — Darktrace, CrowdStrike, Microsoft Sentinel, Vectra, Cynet 360 — are likely to push into the top 20 over the next 18 months as adoption scales. We've already seen Microsoft Security Copilot show up in enterprise-pattern traffic (weekday peaks, weekend drops) on Cloudflare Radar.
What this layer adds to the four-layer model
The September 2025 in-depth report doesn't change our four-layer model. It adds a fifth signal underneath it: the dollars that justify the deployment. Layer 4 told us which services are winning user traffic. The cybersecurity breach-cost gap and the investment-vs-deployment country split tell us why those services will keep winning — and where the next 18 months of enterprise budget is actually going to land.
What the data actually tells sales and GTM teams
Cloudflare Radar shows the macro wave. DNS patterns, traffic rankings, bot behavior, service usage. But sales teams don't sell to waves. They sell to companies.
The question isn't "is AI growing?" It's: which specific companies adopted which AI tools, when they adopted them, and what those tools replaced. That's where technographic data platforms like TechnologyChecker come in, detecting 40,000+ technologies across 50M+ domains with real-time adoption and churn signals.
Here's how we'd translate the four layers into action.
If you're an SDR, the bot traffic data gives you targeting intelligence. Retail (28.2% of bot traffic) and computer software (13.6%) are the most crawled industries. Those verticals will see the most AI tool launches in the next 6-12 months. Companies already seeing heavy AI bot activity on their sites are thinking about AI strategy right now, whether they're blocking crawlers or building AI features. Digital Third Coast found that 52% of large organizations have dedicated AI adoption teams compared to 23% of small organizations. Enterprise prospects have buyers specifically tasked with AI procurement. That's who you're looking for.
If you lead GTM or RevOps, the four-layer model gives you timing. Domain speculation in a category (Layer 1) means start building content. Traffic ranking shifts (Layer 2) mean launch prospecting campaigns. Bot traffic targeting an industry (Layer 3) means those companies are 3-6 months from evaluating vendors. Stable service rankings (Layer 4) mean you're selling into an established market with clear incumbents. GitHub Copilot's weekday/weekend pattern is your template for identifying enterprise adoption in any vertical. Our technology lookup checker shows how real-time detection data can pinpoint companies at each stage.
If you run marketing, the DeepSeek and Claude stories prove that distribution doesn't guarantee market position. Google had every advantage and still dropped three positions. Content strategy should track these shifts. The audience searching for AI adoption data wants to understand dynamics, not just confirm AI is popular. Harvard Business Review found that 88% of companies now use AI regularly. Your marketing should assume AI familiarity and focus on differentiation.
The experimentation-to-production gap is real

One pattern we noticed across all four layers: there's a wide gap between AI experimentation and AI in production. Deloitte's latest data makes this concrete. Worker access to AI rose 50% in 2025, and 66% of organizations achieved productivity improvements. But only 20% are seeing actual revenue growth from AI, despite 74% aspiring to it. Only 42% believe their strategy is highly prepared.
Our traffic data maps to this gap. ChatGPT and Claude have stable, enterprise-grade traffic patterns. But below the top 5, the rankings churn weekly. Tools appear, spike, and fade. The long tail of AI services is still in experimentation mode. Only 27% of organizations review 100% of AI outputs before acting on them, per Digital Third Coast. The rush to adopt is outpacing the infrastructure to govern.
AI adoption benchmarks at a glance (Q2 2026 close)
| Benchmark | Value | Source |
|---|---|---|
| ChatGPT global domain rank | #11 (Q1) → #23 (Jul 2026) | Cloudflare Radar (our analysis) |
| Training-purpose crawl share | 28.7% (Q2 2025) → 44.9% (Q2 2026) | Cloudflare Radar (our analysis) |
| #1 AI crawler (share of AI-bot traffic) | Googlebot 27.5% (down from 57.2% YoY) | Cloudflare Radar (our analysis) |
| #2 AI crawler | ClaudeBot 13.9% (up from 8.3% YoY) | Cloudflare Radar (our analysis) |
| Crawler 4xx (block) rate | 35.8% (up from 10.2% YoY) | Cloudflare Radar (our analysis) |
| AI bot traffic growth (Q1) | +34% | Cloudflare Radar (our analysis) |
| .ai-adjacent TLD growth | +20% in Q1, unwound to 14.3% by Q2 | Cloudflare Radar (our analysis) |
| NXDOMAIN rate | 10.3% (Q2 2026) | Cloudflare Radar (our analysis) |
| Most crawled industry | Retail (29.3%, Q2 2026) | Cloudflare Radar (our analysis) |
| GenAI #1 consistency | 92/92 days (Q1), held through Q2 | Cloudflare Radar (our analysis) |
| Claude #2 streak | 85+ days | Cloudflare Radar (our analysis) |
| Enterprise AI adoption rate | 72% | McKinsey Global Survey |
| Global GenAI population reach | 16.3% | Microsoft AI Economy Institute |
| Worker AI access increase | +50% in 2025 | Deloitte State of AI |
| Orgs achieving AI revenue growth | 20% (74% aspire) | Deloitte State of AI |
| Companies with AI agent governance | 1 in 5 | Deloitte State of AI |
| Companies regularly using AI | 88% | Harvard Business Review |
| AI market size 2026 (forecast) | $347B | Statista Market Insights |
| AI market size 2031 (forecast) | $1.675T | Statista Market Insights |
| GenAI market size 2031 (forecast) | $442B | Statista Market Insights |
| AI users worldwide 2026 (forecast) | 451.8M | Statista Technology Market Insights |
| New unicorns that are AI (2025) | 53% | CB Insights via Statista |
| Enterprise AI adoption YoY gain | +23 points (55% → 78%) | McKinsey Global Survey |
| Top consumer-AI country (2025) | India, Nigeria (92%) | KPMG / Univ. of Melbourne |
| #1 government AI readiness | United States (87.2) | Oxford Insights |
| Global business AI adoption 2017 → 2024 | 20% → 72% | IDC; McKinsey via Statista |
| U.S. AI investment (May 2025) | $471B | Spherical Insights via Statista |
| China AI investment (May 2025) | $119B | Spherical Insights via Statista |
| #1 AI-deployed country (2024) | China (58%) | Vention via Statista |
| U.S. AI deployment vs exploring (2024) | 25% / 43% | Vention via Statista |
| AI cybersecurity market 2030 (forecast) | $133.8B | Techopedia via Statista |
| Breach cost savings (extensive AI vs none) | $1.9M per breach | IBM; Ponemon Institute via Statista |
| Orgs expecting cybersecurity budget growth 2025 | 77% | PwC via Statista |
Our methodology
We collected data from four Cloudflare Radar API endpoints covering January 5 through April 6, 2026 (92 days, full Q1 plus the first week of April), and re-pulled all four layers for the full months of April and May 2026 in our Q2 update passes.
Cloudflare Radar draws on traffic flowing through Cloudflare's global network. That includes DNS resolution data from the 1.1.1.1 public resolver (67M+ queries/sec), HTTP request volumes, AI bot classification by user agent and declared purpose, and generative AI service rankings by traffic volume.
We used four endpoint groups:
- DNS query distribution by TLD (summary and weekly time-series)
- Global domain rankings (top 100 popular and top 50 trending)
- AI/ML bot traffic by user agent, crawl purpose, and target industry
- Internet services rankings filtered to "Generative AI"
All trend percentages compare the first week of Q1 to the last available data point. Bot traffic was analyzed by both user agent identity and declared crawl purpose. GenAI service rankings used daily position data to calculate streak lengths and transition points. We cross-referenced signals across layers to identify patterns that wouldn't be visible in any single data set.
What Cloudflare doesn't see: traffic that doesn't flow through its network, DNS queries to other resolvers (Google Public DNS, ISP resolvers), and .ai TLD breakouts (we track it within the "other" bucket). Bot user agents can be spoofed, though major AI companies have strong incentives to identify their crawlers honestly for robots.txt compliance. Our SSL certificate transparency research follows a similar methodology, using infrastructure-level data to draw adoption conclusions.
Statista Q2 2026 AI dossier (added April 2026)
For the long-view forecast layer, we cross-referenced our Q1 telemetry with Statista's 33-page Q2 2026 artificial intelligence dossier (study ID 38609). The dossier pulls together 27 curated datasets from Statista Market Insights (AI market sizing and segment forecasts through 2031), CB Insights (AI share of unicorn births), KPMG/University of Melbourne (consumer AI usage by country, 48,000 respondents), Oxford Insights (Government AI Readiness Index), McKinsey & Company / Stanford University (enterprise AI adoption by region), the World Economic Forum (AI as a core worker skill by industry), Dynatrace/Qualtrics (agentic AI barriers), Deloitte (talent strategy adjustments), and the Digital Education Council (faculty views on AI in education).
Attribution format in the dossier: the chart header lists the original data provider as "Source(s)"; Statista is the aggregator. Each chart embedded in this post preserves that attribution via the chart card's Source: X via Statista header line. "Read more" links in the chart panels point back to this article; the underlying Statista chart URLs are available via the dossier.
Statista in-depth AI market analysis, September 2025 (added May 2026)
The May 2026 refresh adds five additional datasets sourced from Statista's 295-page in-depth artificial intelligence market analysis (study ID 50485, published September 2025). The in-depth report is the long-form source behind the Q2 2026 dossier and includes data dimensions the dossier summarises but doesn't reproduce in full:
- IDC; McKinsey via Statista — Global AI adoption rate in businesses, 2017-2024 (20% → 72%)
- Vention via Statista — AI deployed vs exploring by country, 2024 (China and India are the only countries past the deployment threshold)
- Spherical Insights via Statista — Leaders in AI investment by country, as of May 2025 (U.S. $471B; China $119B)
- Techopedia via Statista — AI cybersecurity market value, 2023-2030 ($24.3B → $133.8B)
- IBM; Ponemon Institute via Statista — Average breach cost by security automation level, 2018-2024 ($1.9M gap between extensive AI use and no automation)
Each chart card embedded in this post uses the original source as the primary attribution, with "via Statista" appended to mark the aggregation chain. The September 2025 in-depth report shares some sources with the Q2 2026 dossier (CB Insights, McKinsey, WEF), so where a chart in this post draws from both we cite the primary research source.
June 2026 telemetry refresh
For this update we re-pulled all four Cloudflare Radar layers for the full month of May 2026: DNS TLD distribution and response codes, AI bot traffic by user agent, crawl purpose, and industry, the generative AI service ranking, and the popular-domains list. Where May contradicted a Q1 or April read, we flagged the reversal in place rather than overwriting the original call, so the trajectory stays visible. The macro Statista layer is forecast and survey data that does not change month to month, so those datasets and their charts are unchanged from the May 2026 refresh.
July 2026 telemetry refresh (Q2 2026 close)
For the July 2, 2026 update we added a full calendar-quarter close. Rather than pull another single month, we aggregated the entire Q2 2026 window (April 1 – June 30) and, for the first time in this series, pulled the same window one year earlier (Q2 2025, April 1 – June 30) to give every Layer 3 metric a like-for-like year-over-year comparison, plus Q1 2026 (January 1 – March 31) for quarter-over-quarter momentum. The endpoints used: ai/bots/summary/{crawl_purpose,user_agent,industry,content_type}, bots/summary/{bot_operator,bot,bot_category}, bots/crawlers/summary/response_status_category, dns/summary/{tld,response_code}, ranking/domain/chatgpt.com, and ranking/internet_services/top. All Layer 3 figures in the Q2 close section are direct calendar-quarter percentage pulls; because these are quarter aggregates, a few differ from the rolling monthly readings preserved below (most notably training-purpose crawls at 44.9% for the quarter versus the 51.8% May-only figure). We flagged that difference in place rather than reconcile it silently. As before, the macro Statista forecast and survey layer does not change month to month and is unchanged from the earlier refreshes.
Frequently asked questions
What are the AI adoption trends in 2026?
Based on our Cloudflare Radar analysis through the Q2 2026 close (April–June), AI adoption has moved past experimentation for the top platforms, and three shifts define the quarter. First, training crawls overtook "mixed purpose" to become the #1 declared reason AI bots crawl the web (44.9% for the quarter, up from 28.7% a year earlier). Second, ClaudeBot passed GPTBot to become the #2 AI crawler (13.9%) while Googlebot's share of AI-bot traffic halved year over year (57.2% to 27.5%). Third, publishers pushed back: more than a third of crawler requests now return a 4xx client error (35.8%, up from 10.2% a year ago). The GenAI service market stayed consolidated in a frozen top 6 (ChatGPT, Claude, Perplexity, Gemini, DeepSeek, GitHub Copilot). McKinsey's survey data (72% enterprise adoption) and Deloitte's findings (worker AI access up 50%) align with what we see in the traffic.
What are AI crawlers used for in 2026, training or search?
For the Q2 2026 quarter, training was the single most common declared crawl purpose at 44.9% of AI-bot activity, up from 28.7% a year earlier and enough to overtake "mixed purpose" (43.0%, down from 65.1%) for the first time in our series. Search-purpose crawls nearly doubled year over year to 9.1%, and user-action crawls reached 2.5%. The takeaway: AI bots have largely stopped hiding intent behind "mixed purpose" and now mostly crawl to train models, while a smaller but fast-growing slice crawls to answer live search and retrieval queries. Source: Cloudflare Radar, ai/bots/summary/crawl_purpose, April–June 2026 vs 2025.
What percentage of AI crawler requests get blocked in 2026?
In Q2 2026, 35.8% of all crawler requests returned a 4xx client-error response, up from 10.2% a year earlier and roughly flat versus Q1's 34.1%. Over the same year, successful (2xx) responses fell from 80.5% to 49.2%. A 4xx bucket includes deliberate 401/403 blocks alongside 404 not-found and 429 rate-limits, so it slightly overstates intentional blocking, but a 3.5x jump in a year is a clear sign publishers are restricting AI crawlers. Source: Cloudflare Radar, bots/crawlers/summary/response_status_category, April–June 2026 vs 2025.
Which company's bots crawl the web the most in 2026?
Across all bots Cloudflare tracks, Google still leads but its share fell from 46.8% (Q2 2025) to 30.1% (Q2 2026). Meta held around 15%, OpenAI eased to 7.6%, and Anthropic broke into the top five for the first time at 4.9%. Narrowing to AI crawlers specifically, Anthropic's ClaudeBot (13.9%) passed OpenAI's GPTBot (10.2%) for the #2 spot behind Googlebot (27.5%). Anthropic's real-time fetch agent, Claude-User, is now the #8 individual bot on the web. Source: Cloudflare Radar, bots/summary/bot_operator and ai/bots/summary/user_agent, April–June 2026 vs 2025.
What are AI adoption trends by industry?
Our AI bot traffic analysis shows retail leads all industries at 29.3% of crawler traffic for the full Q2 2026 quarter (28.3% in Q1, and 26.0% a year earlier, so its lead is widening), followed by computer software (13.2%), information technology (5.7%), and internet services (5.3%). The fifth slot churns month to month: it was gambling and casinos in Q1, telecommunications in April, and adult entertainment (about 3%) across late Q2, all of which share the same trait of unusually structured, data-rich sites that reward crawling. The top four are stable. These numbers reflect where AI companies direct their training resources, and the industries crawled most heavily tend to see the most AI-powered products in the next 6-12 months.
How does AI adoption vary by country?
Our Cloudflare Radar analysis focuses on global aggregates, but two geographic signals stood out in Q1. The .ru TLD spiked to 2.16% of DNS queries in mid-March, reflecting geopolitical infrastructure shifts. And Doubao's intermittent appearance in the GenAI top 10 signals Chinese AI platforms beginning to expand globally. NVIDIA's State of AI report found North America leads with 70% actively using AI, 27% assessing, and just 3% not using it. Most top-ranked AI platforms (ChatGPT, Claude, Perplexity) are headquartered in the US with predominantly North American traffic patterns, but DeepSeek and Doubao suggest that's changing.
What are the latest AI growth statistics?
From our Q1 2026 data: AI bot traffic grew 34% in 92 days. Training-purpose crawls reached 52% of all AI bot activity. chatgpt.com held global rank #11, with more traffic than Amazon at the time. Meta-ExternalAgent grew 43% within the quarter. Applebot surged 5x. On the service side, Claude took #2, DeepSeek reached #4, and Gemini dropped to #5. MIT Sloan Management Review's Thomas Davenport and Randy Bean identified potential AI bubble deflation as a 2026 theme. Our traffic data shows the opposite at the infrastructure level: usage is still accelerating. The disconnect might be that public market sentiment is cooling while actual adoption keeps climbing. Updated for the Q2 2026 close: across the full quarter (April–June, year over year vs 2025), ClaudeBot rose to the #2 AI crawler at 13.9% (from 8.3%), Googlebot's share of AI-bot traffic halved to 27.5% (from 57.2%), training crawls overtook "mixed purpose" to lead all crawl reasons at 44.9% (from 28.7%), the crawler 4xx block rate reached 35.8% (from 10.2%), Retail widened its most-crawled-industry lead to 29.3%, and chatgpt.com settled at #23 on the global domain list.
Where can I find an AI adoption graph for 2026?
This article contains six static layer visualizations (DNS query share by TLD, global domain rankings, AI bot traffic by user agent, crawler purpose distribution, generative AI service rankings, and a GTM strategy summary) plus 14 interactive charts covering the macro AI market. The Cloudflare Radar layers draw on data from January 5, 2026 through the May 31, 2026 refresh. For additional technology tracking data, see our industry statistics insights and technology category breakdowns.
What do recent reports say about AI adoption trends in 2026?
The major reports this cycle include McKinsey (72% enterprise adoption, 62% experimenting with AI agents), Deloitte (worker AI access up 50%, but only 20% achieving revenue growth), Microsoft (16.3% global population using GenAI), NVIDIA (70% of North American companies actively using AI), and HBR (88% regular use). Our research adds the infrastructure dimension. Real traffic flows, actual crawler behavior, daily service rankings. Where surveys tell you what companies plan to do, traffic data shows what they're actually doing today.
What percentage of companies are using AI?
It depends on how you define "using." Vention's 2026 report puts it at 93% of companies using AI in some form, with 80% using it directly in operations. McKinsey's Global Survey says 72% have adopted at least one AI capability. HBR says 88% report regular use. Our Cloudflare Radar data adds a different dimension: ChatGPT held the #1 generative AI service rank through May 2026, and chatgpt.com reached global domain rank #11 in Q1 (easing to #25 by late May as more infrastructure domains filled the top 10). But Deloitte's data reveals the nuance beneath those headline numbers. Only 20% of organizations are actually generating revenue from AI, despite 74% aspiring to. The gap between "using AI" and "getting business value from AI" remains wide.
How fast is the AI market growing?
Our infrastructure-level data shows AI-related internet activity growing at roughly 34% per quarter (Q1 2026), measured by AI bot traffic volume. The "other" TLD bucket that includes .ai domains grew 20% within Q1 alone. Training-purpose crawls jumped from 42% to 52% of all AI bot activity, signaling that model development is still accelerating. Microsoft's AI Economy Institute found that global generative AI adoption reached 16.3% of the world's population, up from 15.1% in H1 2025. On the services side, our data shows the top 5 GenAI platforms consolidating their positions while the long tail churns rapidly.
Which AI has the highest market share?
By actual traffic volume, ChatGPT is the clear leader. It held the #1 generative AI service position for all 92 days of Q1 2026 and still held #1 in the May 31, 2026 snapshot. No other AI service comes close. Claude (Anthropic) held a stable #2 for 85+ days and remained #2 in May. Perplexity locked in #3. In Q1, DeepSeek had risen to #4 and Gemini fell to #5; by May that order reversed, with Gemini back at #4 and DeepSeek at #5. One caveat on the domain side: chatgpt.com ranked #11 among all global domains in Q1 but slipped to #25 by late May (amazon.com reclaimed #11), so the domain-popularity signal softened even as the service-traffic lead held. The gap between #1 and #2 in generative AI is still far wider than the ranking numbers suggest.
Is ChatGPT losing market share?
On the service side, no. ChatGPT held the #1 generative AI service position every single day of Q1 2026 and still held #1 in the May 31, 2026 snapshot. On the domain side, there is a real shift to flag honestly: chatgpt.com fell from Q1's global domain rank of #11 (ahead of amazon.com) to #25 by late May, while amazon.com reclaimed #11. Part of that is compositional, as Cloudflare's popular-domains list now surfaces more infrastructure and CDN domains in the top 10, and part may be a softer DNS-popularity signal. The takeaway: ChatGPT's lead in generative AI usage is intact, but the Q1 claim that chatgpt.com was a top-15 global domain no longer holds. Below it, Q1's narrative also moved, with Gemini falling to #5 in Q1 but retaking #4 in May.
Why do 85% of AI projects fail?
The often-cited failure rates (85%, 90%) come from Gartner estimates about enterprise AI projects not reaching production. Our traffic data offers a partial explanation. Below the top 5 GenAI services, the rankings churn weekly: tools spike, plateau, and fade. This pattern mirrors the experimentation-to-production gap that Deloitte quantified: 66% of organizations achieved productivity improvements from AI, but only 20% are generating revenue. Only one in five companies has a mature governance model for AI agents. The problem isn't that AI doesn't work. It's that most organizations adopt faster than they can operationalize. They're running before they've figured out how to walk.
How big will the AI market be by 2031?
Statista Market Insights forecasts the worldwide AI market to grow from $94.81 billion in 2020 to $1.675 trillion by 2031 — a 17.7x expansion. The 2026 mark is $347 billion, roughly the combined revenue of the world's top five SaaS companies. The generative AI segment alone is projected to grow 80x over the same period, from $5.5 billion to $442 billion. Our Q1 2026 infrastructure telemetry (AI bot traffic +34% in a single quarter, training crawls jumping from 42% to 52% of all AI crawler activity) is consistent with that trajectory. Growth rates decelerate after 2027 as the base scales, but absolute dollar additions peak late: $1.3 trillion in new market value is forecast between 2026 and 2031 alone.
Which country uses AI the most?
By consumer usage rate, India and Nigeria tied for #1 in 2025 at 92%, according to a KPMG and University of Melbourne survey of 48,000 respondents. The UAE (91%), Egypt (90%), China (89%), and Saudi Arabia (88%) follow. Every country above 85% is classified as an emerging market — the highest-ranked advanced economy, Singapore, sits at 73%. By government AI readiness, the United States leads at 87.2, nearly ten points ahead of the UK. The consumer-usage picture and the government-capacity picture tell different stories about where AI's center of gravity lives.
What share of new unicorns are AI companies?
According to CB Insights (via Statista's Q2 2026 AI dossier), 53% of new unicorn startups worldwide in 2025 were AI companies — up from 6% in 2015 and 44% in 2024. The inflection point is 2023-2025, mapping directly to the post-ChatGPT funding wave. One in five 2025 unicorns are specifically AI agents, a category that didn't meaningfully exist two years ago. The appearance of Windsurf AI and Manus in our Q1 2026 Cloudflare Layer 4 rankings is the traffic-level confirmation of this fundraising data.
Which countries have actually deployed AI vs are still exploring it?
Vention's 2024 country survey (via Statista's September 2025 in-depth AI report) is the clearest split available. Only China (58% deployed, 30% exploring) and India (57% / 27%) have more organizations running AI in production than evaluating it. Every other country in the survey — including the U.S. (25% / 43%), UK (26% / 47%), Germany (34% / 44%), and France (31% / 44%) — has a higher exploring share than deployed share. That's a meaningful counterweight to the global 72% adoption number, which combines both groups. The world averages are 34% deployed and 42% exploring.
How much do AI cybersecurity tools actually save companies?
IBM and the Ponemon Institute (via Statista's September 2025 in-depth report) put the 2024 average breach cost at $3.8M for organizations with extensive AI security automation and $5.7M for organizations with no automation — a $1.9M gap per breach. The gap has been positive every year since 2018, peaking at $3.8M in 2021. The forecast for the AI cybersecurity market is $24.3B in 2023 growing to $133.8B by 2030, a 5.5x expansion driven primarily by this documented ROI. PwC found that 77% of organizations plan to increase their cybersecurity budget in 2025.
How much is the U.S. actually investing in AI compared to China?
As of May 2025, Spherical Insights (via Statista) tracks total U.S. AI investment at $471 billion versus China at $119 billion — roughly a 4x gap. The U.S. invests more than the next eight countries combined. The figure includes VC funding, corporate R&D, government programs (notably the CHIPS and Science Act's $280B commitment), and infrastructure spending. The disconnect: the U.S. invests 4x more than China but has less than half the AI deployment rate (25% deployed vs China's 58%), suggesting U.S. AI capital is going more into infrastructure and R&D than into enterprise production deployments.
Is AI more hype than reality?
Both, depending on which layer you're measuring. At the DNS level (Layer 1), there's genuine speculation: 10.74% of DNS queries hit non-existent domains in Q1, and the "other" TLD bucket (including .ai) grew 20% in a quarter before unwinding to 14.3% by May. That's hype activity, and the May reversal shows how much of it was speculative. But at the traffic level (Layer 2), ChatGPT is not hype: it held the #1 generative AI service rank through May, and chatgpt.com was a top-25 global domain even after slipping from Q1's #11. That scale requires hundreds of millions of active users. At the bot level (Layer 3), training crawls holding near 52% shows real infrastructure investment, not just announcements. And at the service ranking level (Layer 4), the top 5 GenAI platforms held stable positions for months. MIT Sloan's Thomas Davenport flagged "AI bubble deflation" as a 2026 theme. Our data says the bubble may be deflating in public markets, but the underlying usage is still accelerating.
Emma Davies
Data Analyst

