DNSSEC Adoption Q3 2026: Only 0.57% of DNS Queries Are Protected
Cloudflare Radar, Q3 2026: 9.90% of DNS queries reached DNSSEC-signed domains, but only 0.57% were validated end to end. Resolver support fell again.
Published •Updated •Data through September 2026•57 min read

Our analysis of Cloudflare Radar telemetry for Q3 2026 (July to September) shows 9.90% of DNS queries reach domains signed with DNSSEC, yet only 0.573% are validated end-to-end. That 17× gap, not the signing headline, is the real DNSSEC story in 2026, and it's the one most industry reports miss.
Updated October 1, 2026 with Q3 data. In August I said validation was falling and I would not call it a collapse yet. September settled that: end-to-end validation held at 0.545%, flat on August's 0.542%, so the fall stopped rather than accelerated. Over the full quarter it averaged 0.573%, below Q2's 0.596% but up 55% on Q3 2025 (0.369%). The signing jump I flagged as provisional half-reversed, and resolver support fell for a fourth straight month.
Does 1.1.1.1 validate DNSSEC?
Yes. Cloudflare documents 1.1.1.1 as a DNSSEC-validating resolver: it sets the DO flag on every query and checks signatures before it answers. The low numbers in this report sit elsewhere in the chain. In September 2026 only 10.36% of queries reaching 1.1.1.1 were for signed domains, and 0.54% were validated end to end.
| What Cloudflare Radar measures at 1.1.1.1 (September 2026, provisional) | Share of queries |
|---|---|
| Query asked for DNSSEC data (DNSSEC-aware) | 10.07% |
| Answer came from a DNSSEC-signed domain (SECURE) | 10.36% |
| Validated end to end | 0.54% |
Source: Cloudflare Radar, radar/dns/summary/{dnssec_aware, dnssec, dnssec_e2e}, calendar month September 2026, pulled 2026-10-01. Normalization: PERCENTAGE of queries.
The resolver does its part. The ceiling is set by how few domains are signed and how few of the clients and forwarding resolvers in front of 1.1.1.1 ask for DNSSEC at all.
Q3 2026 analysis: validation stopped falling, and half the signing jump reversed
| Metric | Q3 2025 | Q2 2026 | Q3 2026 | QoQ | YoY |
|---|---|---|---|---|---|
| End-to-end validated (DNSSEC e2e) | 0.369% | 0.596% | 0.573% | −0.023 pt | +55.3% |
| Queries reaching signed domains (SECURE) | 8.08% | 8.11% | 9.90% | +1.79 pt | +1.82 pt |
| Signing-to-validation gap | 21.9× | 13.6× | 17.3× | widened | narrower |
| Resolver DNSSEC support (aware) | 12.33% | 11.43% | 10.80% | −0.63 pt | −1.53 pt |
| Encrypted DNS (DoT + DoH) | 11.64% | 12.08% | 12.88% | +0.80 pt | +1.24 pt |
| DNS over TLS (DoT) | 6.97% | 6.34% | 6.66% | +0.32 pt | −0.31 pt |
| DNS over HTTPS (DoH) | 4.67% | 5.75% | 6.23% | +0.48 pt | +1.55 pt |
| Plain UDP | 86.01% | 84.40% | 84.74% | +0.34 pt | −1.27 pt |
Source: Cloudflare Radar, radar/dns/summary/{dnssec_e2e, dnssec, dnssec_aware, protocol}, calendar quarters (Q3 2025 = July to September 2025), pulled 2026-10-01. Q3 2026 includes provisional September data.
Here is how I read the quarter, and how the calls I made in August held up.
"Validation is falling, and I am not calling it a collapse yet." Right on both halves. The weekly series bottomed in the first days of September and then moved sideways: 0.560%, 0.550%, 0.537% and 0.552% for the weeks beginning 7, 14, 21 and 28 September. A metric that falls for five weeks and then holds is a step down, not a slide. The climb that ran from January to July has ended, and the level it ended at is still more than half again what it was a year ago.
"Treat the signing jump as provisional." That was the right call, and September answers part of it. Queries reaching signed domains fell from 11.80% in August to 10.36% in September, giving back two-fifths of the jump in one month while staying well above the 8% plateau of the previous fifteen months. A real wave of zone signing does not un-sign a large part of itself four weeks later. I now read the August spike as mostly a change in how Cloudflare classifies those answers, with a smaller real gain underneath that I can't yet size. The gap figure inherits that uncertainty: 17.3× for the quarter, but the honest comparison with earlier quarters is the validation number on its own.
"Resolver support is the number that worries me." Still true, and worse. The DNSSEC-aware share fell to 10.07% in September, the fourth monthly decline in a row, and the Q3 average of 10.80% is 1.53 points below Q3 2025. Validation cannot climb back while fewer of the queries arriving at the resolver even ask for signatures.
One smaller turn: in September, DNS over HTTPS (6.68%) carried more queries than DNS over TLS (6.35%), the reversal I wrote off in July. Over the whole quarter DoT still led, so I'm reporting it as a September event, not a new order.
radar/dns/timeseries_groups/dnssec_e2e with explicit dates (the 28-day and 52-week presets return errors on this dataset).2026 month by month: January to September
| Month | End-to-end validated | Signed (SECURE) | DNSSEC-aware | Invalid | DoH | DoT |
|---|---|---|---|---|---|---|
| September 2025 | 0.383% | 8.05% | 13.32% | 0.062% | 5.22% | 6.77% |
| January 2026 | 0.407% | 8.29% | 11.82% | 0.067% | 5.39% | 6.40% |
| February 2026 | 0.459% | 8.03% | 14.96% | 0.054% | 5.32% | 6.66% |
| March 2026 | 0.514% | 7.98% | 13.22% | 0.077% | 5.42% | 6.21% |
| April 2026 | 0.589% | 8.13% | 11.51% | 0.222% | 5.69% | 6.05% |
| May 2026 | 0.600% | 8.10% | 10.95% | 0.125% | 5.58% | 6.12% |
| June 2026 | 0.604% | 8.08% | 11.68% | 0.058% | 5.86% | 6.75% |
| July 2026 | 0.621% | 8.23% | 11.54% | 0.054% | 6.19% | 7.16% |
| August 2026 | 0.542% | 11.80% | 10.56% | 0.051% | 6.00% | 6.56% |
| September 2026 (provisional) | 0.545% | 10.36% | 10.07% | 0.065% | 6.68% | 6.35% |
| January → September | +0.138 pt | +2.07 pt | −1.75 pt | −0.002 pt | +1.29 pt | −0.05 pt |
Source: Cloudflare Radar, radar/dns/summary/{dnssec_e2e, dnssec, dnssec_aware, protocol}, calendar months, every month re-pulled 2026-10-01. February's DNSSEC-aware reading sits on a query-flood anomaly Cloudflare annotates for 11 to 13 February; see the June section below.
Read the first column and the story of 2026 is a seven-month climb from 0.41% to 0.62%, a one-month drop in August, and a September that held. Read the third column and the pressure on that climb is plain: the share of queries asking for DNSSEC at all has drifted down from about 12% to 10%.
August 2026: validation fell for the first time in seven months
August is the first month since this post began tracking the series where end-to-end validation went down. It also moved the other two axes hard enough that the headline gap is back where it was a year ago.
| Metric | Aug 2025 | June 2026 | July 2026 | Aug 2026 | MoM | YoY |
|---|---|---|---|---|---|---|
| End-to-end validated (DNSSEC e2e) | 0.370% | 0.603% | 0.620% | 0.542% | −0.078 pt | +46.5% |
| Queries reaching signed domains (SECURE) | 8.07% | 8.07% | 8.22% | 11.79% | +3.57 pt | +3.72 pt |
| Signing-to-validation gap | 21.8× | 13.4× | 13.3× | 21.8× | widened 8.5× | unchanged |
| Resolver DNSSEC support (aware) | 12.75% | 11.66% | 11.53% | 10.55% | −0.98 pt | −2.20 pt |
| Encrypted DNS (DoT + DoH) | 11.90% | 12.60% | 13.35% | 12.55% | −0.80 pt | +0.65 pt |
| DNS over TLS (DoT) | 6.94% | 6.74% | 7.15% | 6.55% | −0.60 pt | −0.39 pt |
| DNS over HTTPS (DoH) | 4.96% | 5.87% | 6.20% | 6.00% | −0.20 pt | +1.04 pt |
| Plain UDP | 85.51% | 83.69% | 84.48% | 85.28% | +0.80 pt | −0.23 pt |
Source: Cloudflare Radar — radar/dns/summary/{dnssec_e2e, dnssec, dnssec_aware, protocol}, calendar-month windows, pulled 2026-09-03. All PERCENTAGE normalized, so shares are read directly.
The decline is five weeks, not one bad week
At the July close I flagged a single weak week and declined to call it a reversal. August removes that ambiguity.
| Week beginning | Validated |
|---|---|
| 2026-07-27 | 0.591% |
| 2026-08-03 | 0.560% |
| 2026-08-10 | 0.530% |
| 2026-08-17 | 0.520% |
| 2026-08-24 | 0.515% |
| 2026-08-31 | 0.531% |
Source: Cloudflare Radar — radar/dns/timeseries_groups/dnssec_e2e, weekly buckets, pulled 2026-09-03.
Five consecutive weekly declines, then a partial recovery in the final week. That is a trend, not noise, and it is the first sustained fall this post has had to report.
Why the gap reopened, and why I am not calling it a collapse yet
The gap widened from 13.3× to 21.8× in a single month, which sounds dramatic until you look at which side moved. Validation fell by 0.078 points. Signed-domain reach rose by 3.57 points, from 8.22% to 11.79% — a 43% relative jump in one month, after fifteen months of sitting flat near 8%.
A metric that has not moved in over a year does not usually gain 43% in four weeks. The redistribution is internally tidy — INSECURE fell 2.98 points and OTHER fell 0.59, which almost exactly funds the 3.57-point SECURE gain — and that shape is as consistent with a classification change on Cloudflare's side as it is with a real wave of zone signing.
The honest summary: validation is falling, that part is solid. The gap arithmetic depends on a signing number that appeared in one month and could be revised. I would rather flag that now than publish a clean-sounding reversal and quietly correct it later.
Resolver support is the number that worries me
Resolver DNSSEC support fell for a third consecutive month, 11.53% to 10.55%, and it is down 2.20 points year over year. This is the axis the whole post has argued is the real bottleneck, and it is the one moving backwards. Validation cannot rise durably while the share of resolvers willing to check signatures shrinks.
July 2026: validation is up 68% on the year, but the monthly climb has stalled
July 2026 is the first month I can set against the same calendar month a year earlier, which is a cleaner comparison than the quarter-versus-quarter view I used at the Q2 close. Here's where every number this post tracks landed.
| Metric | July 2025 | Q2 2026 | June 2026 | July 2026 | YoY |
|---|---|---|---|---|---|
| End-to-end validated (DNSSEC e2e) | 0.369% | 0.595% | 0.603% | 0.620% | +68% |
| Queries reaching signed domains (SECURE) | 8.00% | 8.10% | 8.07% | 8.22% | +0.22 pt |
| Signing-to-validation gap | 21.7× | 13.6× | 13.4× | 13.3× | narrowed 8.4× |
| Resolver DNSSEC support (aware) | 11.42% | 11.42% | 11.66% | 11.53% | +0.10 pt |
| Encrypted DNS (DoT + DoH) | 11.60% | 12.08% | 12.60% | 13.35% | +1.75 pt |
| DNS over TLS (DoT) | 6.93% | 6.33% | 6.74% | 7.15% | +0.22 pt |
| DNS over HTTPS (DoH) | 4.66% | 5.75% | 5.87% | 6.20% | +1.53 pt |
| Plain UDP | 86.21% | 84.41% | 83.69% | 84.48% | −1.73 pt |
Source: Cloudflare Radar — radar/dns/summary/{dnssec_e2e, dnssec, dnssec_aware, protocol}, calendar-month and quarter windows, pulled 2026-08-01. All PERCENTAGE normalized, so shares are read directly.
The year-over-year line is the one that matters, and it's genuinely good news. Validation went from 0.369% to 0.620% of queries, a 68% gain, while the share of queries reaching signed domains barely moved (8.00% to 8.22%). That's exactly the asymmetry this post has argued since April: the bottleneck was never signing, it was resolvers choosing to check the signatures. The gap between the two closed from 21.7× to 13.3× in twelve months, and all of that movement came from the validation side.
July barely extended the streak, and ended on a decline
At the Q2 close I reported a sixth consecutive monthly gain and framed validation as a steady upward march. July technically makes it seven, but only barely: 0.603% to 0.620% is a gain of 0.017 percentage points, and the weekly detail shows the month ending weaker than it started.
| Week beginning | Validated |
|---|---|
| 2026-06-29 | 0.632% |
| 2026-07-06 | 0.627% |
| 2026-07-13 | 0.628% |
| 2026-07-20 | 0.616% |
| 2026-07-27 | 0.585% |
Source: Cloudflare Radar — radar/dns/timeseries_groups/dnssec_e2e, weekly buckets, pulled 2026-08-01.
The final week of July is the weakest reading since May. One soft week isn't a reversal and I'm not going to call it one, but it does mean the honest description of July is "a seventh gain that was mostly flat, ending on a decline," rather than the continuing climb the monthly headline implies. I'd rather flag the flattening now than describe a stall as momentum for another month. If August comes in below 0.62%, the six-month climb story's over and I'll say so.
⚠️ Answered by the September update above: August came in at 0.542%, and the climb story is over. Prediction preserved as originally published.
The DoH-overtaking-DoT call has reversed
This is the one I got wrong. At the Q2 close I wrote that the transport underneath encrypted DNS had flipped, with DoH closing to near parity with DoT (6.33% against 5.75%) and on track to overtake it. July went the other way.
Both grew, but DoT grew faster. The DoT lead was 0.58 points at the Q2 close; in July it's 0.95 points (7.15% against 6.20%). The convergence I described is real over the full year, since DoT's lead was 2.27 points in July 2025 and is under a point now, but the crossover I implied was imminent has moved further away rather than closer. Encrypted DNS as a whole is the durable trend: 11.60% to 13.35% year over year, with plain UDP giving up 1.73 points. Which encrypted transport wins is a much noisier question than I made it sound in July.
Resolver support stayed flat, which holds up the correction I made in June
One thing did behave exactly as expected. Resolver DNSSEC support was 11.42% in July 2025 and 11.53% in July 2026, essentially unchanged across the full year. That matters because in June I walked back an earlier reading that showed resolver support jumping to 13.03% in Q1, arguing it was a February anomaly rather than a trend. A full year of flat data confirms that correction. Resolver support isn't growing. What's growing is how often supporting resolvers actually validate, which is a different and more encouraging thing.
Where DNSSEC Stands at the Q2 2026 Close, With the Year-Over-Year Picture
Here are the load-bearing DNSSEC numbers across three windows: Q2 2025 (the year-ago seasonal baseline), Q1 2026 (last quarter), and Q2 2026 (the close). The year-over-year column is the one earlier editions of this post never had.
| Metric | Q2 2025 | Q1 2026 | Q2 2026 | YoY (Q2→Q2) | QoQ (Q1→Q2) |
|---|---|---|---|---|---|
| End-to-end validated (POSITIVE) | 0.326% | 0.466% | 0.595% | +82% (near-doubled) | +28% |
| Signed (SECURE share of queries) | 7.69% | 8.11% | 8.10% | +0.41 pt | Flat |
| Resolver DNSSEC-aware (SUPPORTED) | 11.35% | 13.03% | 11.46% | +0.11 pt (flat) | −1.57 pt |
| Unsigned (INSECURE) | 78.89% | 79.35% | 77.60% | −1.29 pt | −1.75 pt |
| Invalid signatures (INVALID) | 0.068% | 0.094% | 0.128% | Roughly doubled (small) | +0.034 pt |
| Signing-to-validation gap | 23.6× | 17.4× | 13.6× | Closed ~10× | Tightening |
Source: Cloudflare Radar — dns/summary/{dnssec, dnssec_e2e, dnssec_aware}, Q2 2025 / Q1 2026 / Q2 2026, pulled 2026-07-02.
End-to-end validation made it six straight months, then the climb flattened
In the June refresh I asked one direct question: would end-to-end validation post a sixth consecutive monthly gain, or was the five-month run about to break? It made six. Full-month June 2026 came in at 0.604%, up from May's 0.596%, so the streak now reads 0.41% → 0.46% → 0.51% → 0.58% → 0.60% → 0.604% across January through June. Six clean months up, no down months, on a metric that historically doesn't move for quarters at a time. Back in April I said I couldn't yet tell whether the jump was real adoption or a sample-mix artifact, and that a real shift would compound while an artifact would revert. It compounded. I now treat this as a genuine trend rather than noise.
The honest caveat is in the slope. January-to-May added about 0.05 points a month. May-to-June added 0.008. The streak survived; the acceleration did not, because June was a near-flat hold at the new higher level rather than another leg up. My June forecast that e2e would clear 0.7% by autumn at the prevailing pace now looks optimistic. The direction is real; the speed is not what it was in the spring.
Resolver support is flat over the full year, which settles the correction I made in June
The June refresh carried a correction I owed readers: the original analysis had called Q1's 13.05% resolver-support figure "the fastest resolver-side growth we've seen," and pulling the months apart showed that number was inflated by a February query-flood anomaly Cloudflare annotates in its own data. Resolver-aware fell every month after February. The clean year-over-year read now settles it. Resolver-aware was 11.35% in Q2 2025 and 11.46% in Q2 2026: flat to within a tenth of a point over a full year. The Q1 2026 spike to 13.03% really was the outlier, and the honest baseline is a hair above 11%, exactly where June 2026 landed (11.73%).
My second June question was whether resolver support would keep sliding below 11% and signal a genuinely shrinking validating population. It didn't. June ticked back up to 11.73%, and the year-over-year line is flat, not falling. So the resolver side isn't collapsing, but it isn't growing either. That is the real bottleneck: end-to-end protection is climbing because validating resolvers are landing on more signed zones, not because new resolvers are switching validation on.
Encrypted DNS crossed 12%, and the transport underneath it flipped from DoT to DoH
The third thing I flagged to watch in June was whether encrypted DNS would push past 12% of queries. It did: DNS over TLS plus DNS over HTTPS reached 12.08% of queries in Q2 2026, and full-month June ran hotter at 12.70%. Encrypted DNS is now about 20 times the size of end-to-end DNSSEC validation, which keeps the post's core asymmetry intact: the operator side is rolling out DNS privacy far faster than DNS authenticity.
The net-new finding is what happened inside that encrypted slice. A year ago the encrypted transport was mostly DNS over TLS: DoT was 8.90% of queries against DoH's 2.12%, better than four to one. By Q2 2026 that ratio has nearly closed. DoT slipped to 6.33% while DoH climbed to 5.75% from 2.12% a year ago, close to a tripling. The two encrypted transports are now near parity, and on the June slope DoH is on track to overtake DoT outright. The encrypted-DNS story stopped being "DoT is the standard" and became "DoH is taking over," which tracks the broader move of DNS resolution into browsers and mobile operating systems that speak HTTPS natively.
⚠️ Superseded by the July data. The overtake called here didn't happen. In July 2026 DoT widened its lead back to 0.95 points (7.15% against DoH's 6.20%). The year-long convergence is real, but the crossover is further away than this paragraph implies. See the July section near the top of this report.
Source: Cloudflare Radar — dns/summary/protocol, Q2 2025 / Q1 2026 / Q2 2026 / June 2026, pulled 2026-07-02.
The rest of the DNS query, in one place: types, failures, and cache
DNSSEC is a thin slice of what Cloudflare's resolver sees, so this refresh adds the surrounding query anatomy, both because it's the most-cited "DNS statistics" shape in AI answers and because two of the axes moved year-over-year in ways worth naming.
| Dimension | Q2 2025 | Q2 2026 | Read |
|---|---|---|---|
| A (IPv4 address) query | 63.76% | 62.50% | Still the bulk of DNS |
| AAAA (IPv6 address) query | 17.68% | 21.17% | +3.5 pt: IPv6-address demand rising |
| HTTPS resource-record query | 9.27% | 7.14% | Down, not up (see note) |
| PTR (reverse) query | 4.86% | 4.00% | Slight decline |
| NXDOMAIN responses | 11.07% | 10.27% | ~1 in 10 lookups is for a name that doesn't exist |
| SERVFAIL responses | 2.33% | 2.16% | Flat |
| Cache-hit rate | 82.82% | 76.66% | Down 6.2 pt |
| Queries over IPv6 transport | 10.31% | 9.32% | Slight decline |
Source: Cloudflare Radar — dns/summary/{query_type, response_code, cache_hit, ip_version}, Q2 2025 / Q2 2026, pulled 2026-07-02.
Two of these deserve a word so they aren't misread. First, there are two different "HTTPS" numbers in DNS and they moved in opposite directions. The HTTPS transport (DoH, in the encrypted section above) grew; the HTTPS resource-record query type (the record browsers fetch to learn a site's HTTP/3 and ECH parameters) actually fell year-over-year, from 9.27% to 7.14%. If you see "HTTPS DNS is growing," check which one is meant, because the transport is and the record type isn't. Second, AAAA queries rose 3.5 points while queries arriving over IPv6 transport slipped. Clients are increasingly asking for IPv6 addresses even when the question itself still travels over IPv4, so IPv6-address demand and IPv6 transport aren't the same signal and shouldn't be conflated.
The one number I won't over-explain is the cache-hit drop, from 82.8% to 76.7%. A lower cache-hit rate usually points to more unique or longer-tail names, or shorter record TTLs, but aggregate telemetry can't tell me which, so I'm flagging the move rather than inventing a cause for it.
The country climb is broad, and Argentina is the new standout
To check that the global doubling isn't one big resolver operator moving the average, I re-pulled end-to-end validation for the same six countries the June refresh spotlighted, this time as a clean Q2-over-Q2 comparison.
| Country | Q2 2025 e2e | Q2 2026 e2e | YoY | Read |
|---|---|---|---|---|
| India | 0.96% | 1.42% | +49% | Still the leader |
| Belgium | 0.47% | 1.19% | +153% | Resolvers finally validating its heavy signing |
| Argentina | 0.18% | 1.04% | +480% | Laggard to leader in a year |
| United States | 0.31% | 0.45% | +44% | Rising with the tide |
| Sweden | 0.31% | 0.41% | +32% | The signature paradox keeps easing |
| China | 0.060% | 0.104% | +73% | Still the floor, both sides underbuilt |
Source: Cloudflare Radar — dns/summary/dnssec_e2e with location filter, Q2 2025 / Q2 2026, pulled 2026-07-02.
The rise shows up in every country in the sample, which is the point: this is a broad shift, not a one-operator mirage. The standout is Argentina, which went from 0.18% to 1.04% end-to-end in a year, nearly six times, moving from the bottom of the pack to above the 1% mark that only India and Belgium had cleared before. Belgium is the other headline. Its resolvers spent years ignoring some of the most heavily signed zones in the world, and they've now more than doubled their validation to 1.19%: the exact paradox this post has tracked since it launched, finally starting to resolve.
The rest of this post preserves earlier layers in full. The June 2026 refresh (the month-by-month January–May series and the February resolver anomaly it caught) is directly below, followed by the Q1 2026 baseline numbers, the 30-country Q1 table, the 2025 quarterly trend, and the explainer and methodology. Nothing there was rewritten; the Q2 close is layered on top.
How Did DNSSEC Adoption Evolve Through May 2026?
According to Cloudflare Radar DNS analytics, end-to-end DNSSEC validation held its gains and edged higher again in May 2026, reaching 0.596% — its fifth consecutive monthly increase (0.41% in January, 0.46%, 0.51%, 0.58%, 0.60%). Signed-domain share stayed flat at 8.07%, so the signing-to-validation gap tightened to ~13.5× (from Q1's 17×) entirely because validation rose, not because signing fell. Encrypted DNS (DoT + DoH) held at 11.80% of queries. The one number moving the wrong way is resolver support, which slipped again to 11.07% — and the month-by-month view below shows why that matters: Q1's headline 13.05% resolver-aware figure was lifted by a February measurement anomaly, not real adoption. We re-pulled the three DNSSEC dimensions for the full month of May 2026 and added a month-by-month breakdown for the whole year. Updated June 1, 2026.
In April I flagged the e2e jump to 0.59% and said I couldn't yet tell whether it was a real adoption shift or a sample-mix artifact — and that a real shift would compound while an artifact would revert. May settled it: it compounded. Five straight months of growth on a metric that historically sits dead still is the clearest signal I've seen in three years of tracking this that the resolver side of the two-sided market is genuinely closing, even if slowly. The flip side is a correction I owe you. When I pulled each month separately instead of the 90-day Q1 average, the "resolver support hit 13.05%, the fastest growth we've ever seen" line from the original analysis fell apart — resolver-aware spiked to 14.92% in February during a query-flood anomaly that Cloudflare itself annotates, then declined every month since. Outside that spike, resolver support has been flat-to-down. The quarterly average hid an artifact, and the monthly data caught it. That is exactly why this refresh leads with months, not quarters.
How Did DNSSEC Adoption Shift From Q1 2026 Through May 2026?
| Layer | Q1 2026 (post) | April 2026 | May 2026 | Net direction |
|---|---|---|---|---|
| Signed (DNSSEC SECURE share of queries) | 8.11% | 8.17% | 8.07% | Flat near 8% |
| Unsigned (INSECURE) | 79.29% | 76.37% | 77.14% | Broadly flat |
| Other / undetermined | 12.51% | 15.25% | 14.69% | Reclassification noise |
| Invalid signatures | 0.096% | 0.22% | 0.10% | Back to Q1 level |
| Resolver DNSSEC-aware (SUPPORTED) | 13.05% | 11.41% | 11.07% | Slipped again (Q1 was anomaly-inflated) |
| End-to-end validated (POSITIVE) | 0.47% | 0.59% | 0.596% | 5th straight monthly gain |
| Signing-to-validation gap | 17× | 14× | ~13.5× | Tightening (validation rising) |
Plus: DNS query protocol distribution in May 2026 — UDP 84.46%, TLS 6.14%, HTTPS 5.65%, TCP 3.74% (encrypted DNS via DoT + DoH = 11.80%, the third pillar of "honest DNS" alongside DNSSEC, holding flat versus April).
Which April 2026 Narratives Did May Confirm, Reverse, or Extend?
1. The end-to-end validation gain held — it's a real trend, not an artifact. April's open question was whether the jump to 0.59% was a genuine adoption shift or a sample-mix blip. May answered it: end-to-end ticked up again to 0.596%, the fifth straight monthly increase (0.41% → 0.46% → 0.51% → 0.58% → 0.60%). On a metric that historically shows no movement for quarters at a time, five consecutive months of growth is a real signal. It still means 99.4% of queries get no end-to-end protection, but the direction is no longer in doubt — a measurable, sustained batch of recursive resolvers is validating that wasn't a year ago.
2. We corrected ourselves: the "fastest-ever resolver growth" was a February anomaly. The original analysis celebrated Q1 resolver support at 13.05% as "the fastest resolver-side growth we've seen." Pulling the months separately undid that. Resolver-aware was 11.96% in January, spiked to 14.92% in February — during a query-flood anomaly Cloudflare flags in its own data (Feb 11–13) — then fell every month since: 13.84% (March), 11.54% (April), 11.07% (May). The 90-day Q1 average inherited the February spike and read it as growth. Stripped of the anomaly, resolver support is flat-to-declining. This is the honest correction the monthly view forced, and it's a cleaner read of the resolver bottleneck than the quarterly number ever was.
3. The e2e-up-while-resolver-aware-down divergence is real, and we won't over-explain it. It looks contradictory that end-to-end validation rose while the resolver-aware share fell. The two are measured differently — dnssec_e2e counts queries that were both signed and validated; dnssec_aware counts the resolver-validation population regardless of signing — and the most likely reconciliation is that the validating-resolver traffic, though a smaller share, increasingly lands on signed zones. But we can't see operator decisions in aggregate data, so we're flagging the divergence rather than inventing a tidy story for it. The metric that reflects real protection (e2e) is up; the population proxy (aware) is down; watch both.
4. The signing-to-validation gap tightened to ~13.5×. Q1 framed the ratio as signing 8.11% vs end-to-end 0.47%, a 17× delta. With May signing flat at 8.07% and end-to-end at 0.596%, the gap is now ~13.5× — and every bit of that tightening came from validation rising, not signing falling. The structural problem is unchanged: most signed zones still aren't validated by the resolvers their queries hit.
Which DNSSEC Findings Held Through May?
Signing held flat near 8% all year (8.21% in January, 8.07% in May) — the "deployed DNSSEC system has been stuck near 8% for years" structural read remains correct. End-to-end protection is still rounding-error territory in absolute terms.
Encrypted DNS (DoT + DoH = 11.80% of May queries) continued to outpace DNSSEC end-to-end validation by ~20×, holding flat versus April. The "DNS privacy is winning the operator-side rollout race; DNS authenticity is losing it" framing extends cleanly through Q2's first two months — though the steady e2e climb is the first real dent in the second half of that sentence.
What Should We Watch for in June 2026?
Does e2e make it six months? A sixth consecutive monthly gain would cement end-to-end validation as a genuine growth trend rather than a 2026 fluke. At the current ~0.05pt/month pace, e2e would clear 0.7% by autumn and approach 1% in 2027.
Does resolver-aware keep declining? Now that we know the Q1 13.05% was anomaly-inflated, the honest baseline is ~11%. If June drops below 11%, the resolver-validating population is genuinely shrinking — a worrying trajectory for a mechanism that depends entirely on resolver-side adoption, and one that would eventually cap e2e growth.
Encrypted DNS share. DoT + DoH at 11.80% is still ~20× the DNSSEC e2e share. If encrypted DNS extends past 12%, it reconfirms the operator-priority asymmetry: DNS privacy keeps getting attention, DNS authenticity gets it slowly.
Month-by-month: how DNSSEC adoption moved across 2026
The original post leaned on a 90-day Q1 average. This June refresh adds the view that average smoothed over — what each month of 2026 actually did. It changes one of our conclusions (resolver support) and strengthens another (end-to-end validation). Here are all three DNSSEC dimensions, January through May 2026, from Cloudflare Radar's 1.1.1.1 telemetry.
| Month | End-to-end validated (POSITIVE) | Signed (SECURE) | Resolver-aware (SUPPORTED) | Invalid |
|---|---|---|---|---|
| January 2026 | 0.41% | 8.21% | 11.96% | 0.065% |
| February 2026 | 0.46% | 8.02% | 14.92% | 0.053% |
| March 2026 | 0.51% | 7.97% | 13.84% | 0.073% |
| April 2026 | 0.58% | 8.14% | 11.54% | 0.130% |
| May 2026 | 0.60% | 8.07% | 11.07% | 0.101% |
⚠️ Preserved as published in June. Re-pulled on 1 October 2026, Cloudflare's current values move some resolver-aware and invalid readings (March aware 13.22%, May aware 10.95%, April invalid 0.222%); the end-to-end column reproduces. The current series is in the January-to-September table at the top of this post.
Three things the monthly view makes obvious that the quarterly one didn't.
End-to-end validation rose every single month — that's the real story. From 0.41% in January to 0.60% in May, with no down months. That monotonic climb is what convinced us the April uptick wasn't a sample-mix blip. It's a small absolute number, but a perfectly smooth five-month rise on a metric that usually doesn't budge is about as clean a trend as aggregate DNS telemetry produces.
Signing is genuinely flat — it's not the thing that's moving. SECURE share stayed in a tight 7.97%–8.21% band all year. The "stuck near 8%" framing is exactly right. So the tightening signing-to-validation gap (17× → 13.5×) is being driven entirely from the validation side, not by more zones getting signed.
February's resolver-aware spike was an artifact, and it distorted the Q1 average. Resolver-aware reads 14.92% in February — far above every other month — and it sits squarely on top of a query-flood anomaly Cloudflare annotates in its own data (Feb 11–13). Take February out and the series is 11.96% → 13.84% → 11.54% → 11.07%: no growth trend, if anything a slow decline. The Q1 quarterly average (13.05%) absorbed the February spike and presented it as "fastest-ever resolver growth." It wasn't. This is the correction the monthly pull forced, and it's why we now lead this post with months.
Emma Davies, Customer Success Lead, on why we re-cut to months: I've tracked this metric for three years, and the discipline I keep relearning is that a quarterly average is a story-smoothing machine. When February's resolver-aware number came in at 14.92% inside a flagged query-flood window, the Q1 average quietly inherited a spike that had nothing to do with adoption — and we published it as a growth headline. Pulling each month separately is more work and it cost us a tidy narrative, but it's the honest cut. The upside of doing it: the end-to-end trend that survived the same scrutiny — five clean months up — is one I now trust far more than I did when it was a single quarterly delta. If you take one methodological thing from this refresh, take this: when a metric is this small, never quote a quarter without looking at its months.
Did the country leaders hold in May?
The 30-country Q1 table further down is our frozen baseline. To check whether the global e2e climb shows up locally, we re-pulled end-to-end validation for a handful of notable countries for full-month May 2026:
| Country | Q1 2026 e2e | May 2026 e2e | Read |
|---|---|---|---|
| India | 1.50% | 1.38% | Still the leader, eased slightly |
| Belgium | 1.17% | 1.19% | Held its #2 standing |
| Argentina | 0.97% | 1.02% | Crossed above 1% |
| United States | 0.37% | 0.46% | Up with the global tide |
| Sweden | 0.27% | 0.42% | Paradox easing — +56% relative |
| China | 0.094% | 0.094% | Still the floor |
The global rise isn't concentrated in one outlier — it shows up across most of the sample. The standout is Sweden, the post's signature paradox (high signing, near-zero validation): its end-to-end rate jumped from 0.27% to 0.42%, meaning Swedish resolvers finally started validating a meaningful slice of the zones Swedish registrars have been signing for years. China remains the floor at ~0.09%, where both sides of the two-sided market are underbuilt. None of this re-ranks the baseline table dramatically, but it confirms the trend is broad, not a single-country mirage.
What Is DNSSEC and How Does It Work?
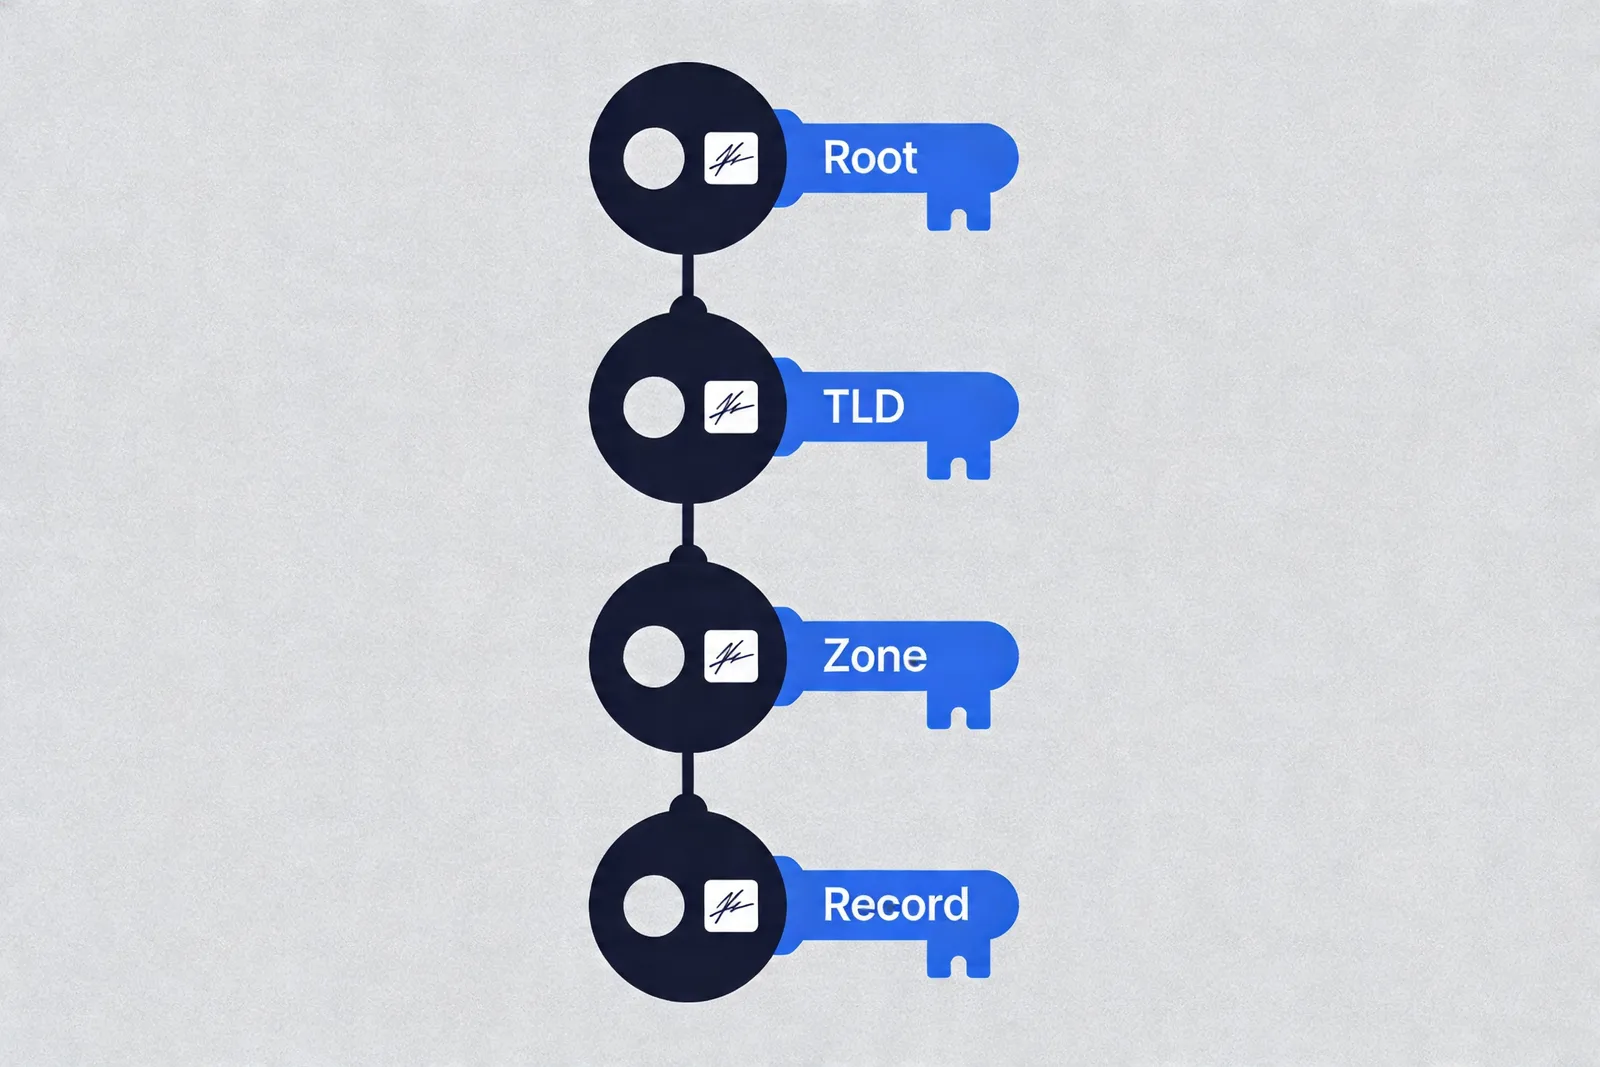
DNSSEC — short for DNS Security Extensions — adds cryptographic signatures to DNS records so a resolver can prove a response came from the authoritative zone and wasn't tampered with in transit. It was first standardised in RFC 4033, 4034, and 4035 back in 2005, and it's been available in some form for close to 30 years. Without it, DNS is a trust-by-default protocol. You ask a resolver for example.com, it returns an IP, and you accept the answer. An on-path attacker or a poisoned cache can hand back anything they want, and your browser will happily connect.
The problem DNSSEC solves is real and old. Dan Kaminsky's 2008 cache-poisoning research showed how quickly an attacker can fill a resolver's cache with forged records. DNSSEC signs every authoritative record set so a validating resolver can detect that kind of forgery before passing the answer back to the client.
Keys, signatures, and the chain of trust
DNSSEC uses four main record types in practice:
- DNSKEY — the public keys used to sign records. Each zone typically has a Zone Signing Key (ZSK) for everyday record sets and a Key Signing Key (KSK) for signing the DNSKEY set itself. The KSK-over-ZSK split lets operators rotate the ZSK often without touching the parent.
- RRSIG — the digital signature attached to each record set. A resolver fetches the RRSIG alongside the answer and verifies it using the DNSKEY.
- DS — the Delegation Signer record. This lives in the parent zone (e.g.,
.com) and contains a hash of the child's KSK. It's how a parent vouches for its child. - NSEC / NSEC3 — authenticated denial-of-existence, used to prove that a queried name doesn't exist without leaking the full zone contents.
The chain of trust runs from the root zone down. The root KSK is the anchor of trust. The root signs the .com DS record. .com signs the DS record for example.com. example.com signs its own A, AAAA, MX, and TXT records. A validating resolver follows this chain back up to the root, and if any signature in the chain fails, the response is thrown out with a SERVFAIL.
What DNSSEC actually protects against
DNSSEC is authentication, not encryption. It proves where a DNS answer came from. It does nothing to hide the fact that you queried a particular domain — that's what DNS over HTTPS (DoH) and DNS over TLS (DoT) handle. Think of the two as complementary: DoH/DoT keeps the question private from the network, and DNSSEC keeps the answer honest.
It's also worth being precise about what "protection" means in the DNSSEC model. A signed zone alone doesn't protect anyone. The resolver has to validate. If 91.9% of the world's resolvers accept unsigned answers, signing your zone helps only that small sliver of traffic running through validating resolvers. Hold onto that idea — it's the mechanical reason the next section's numbers look the way they do.
DNSSEC Adoption in Q1 2026: The Real Numbers
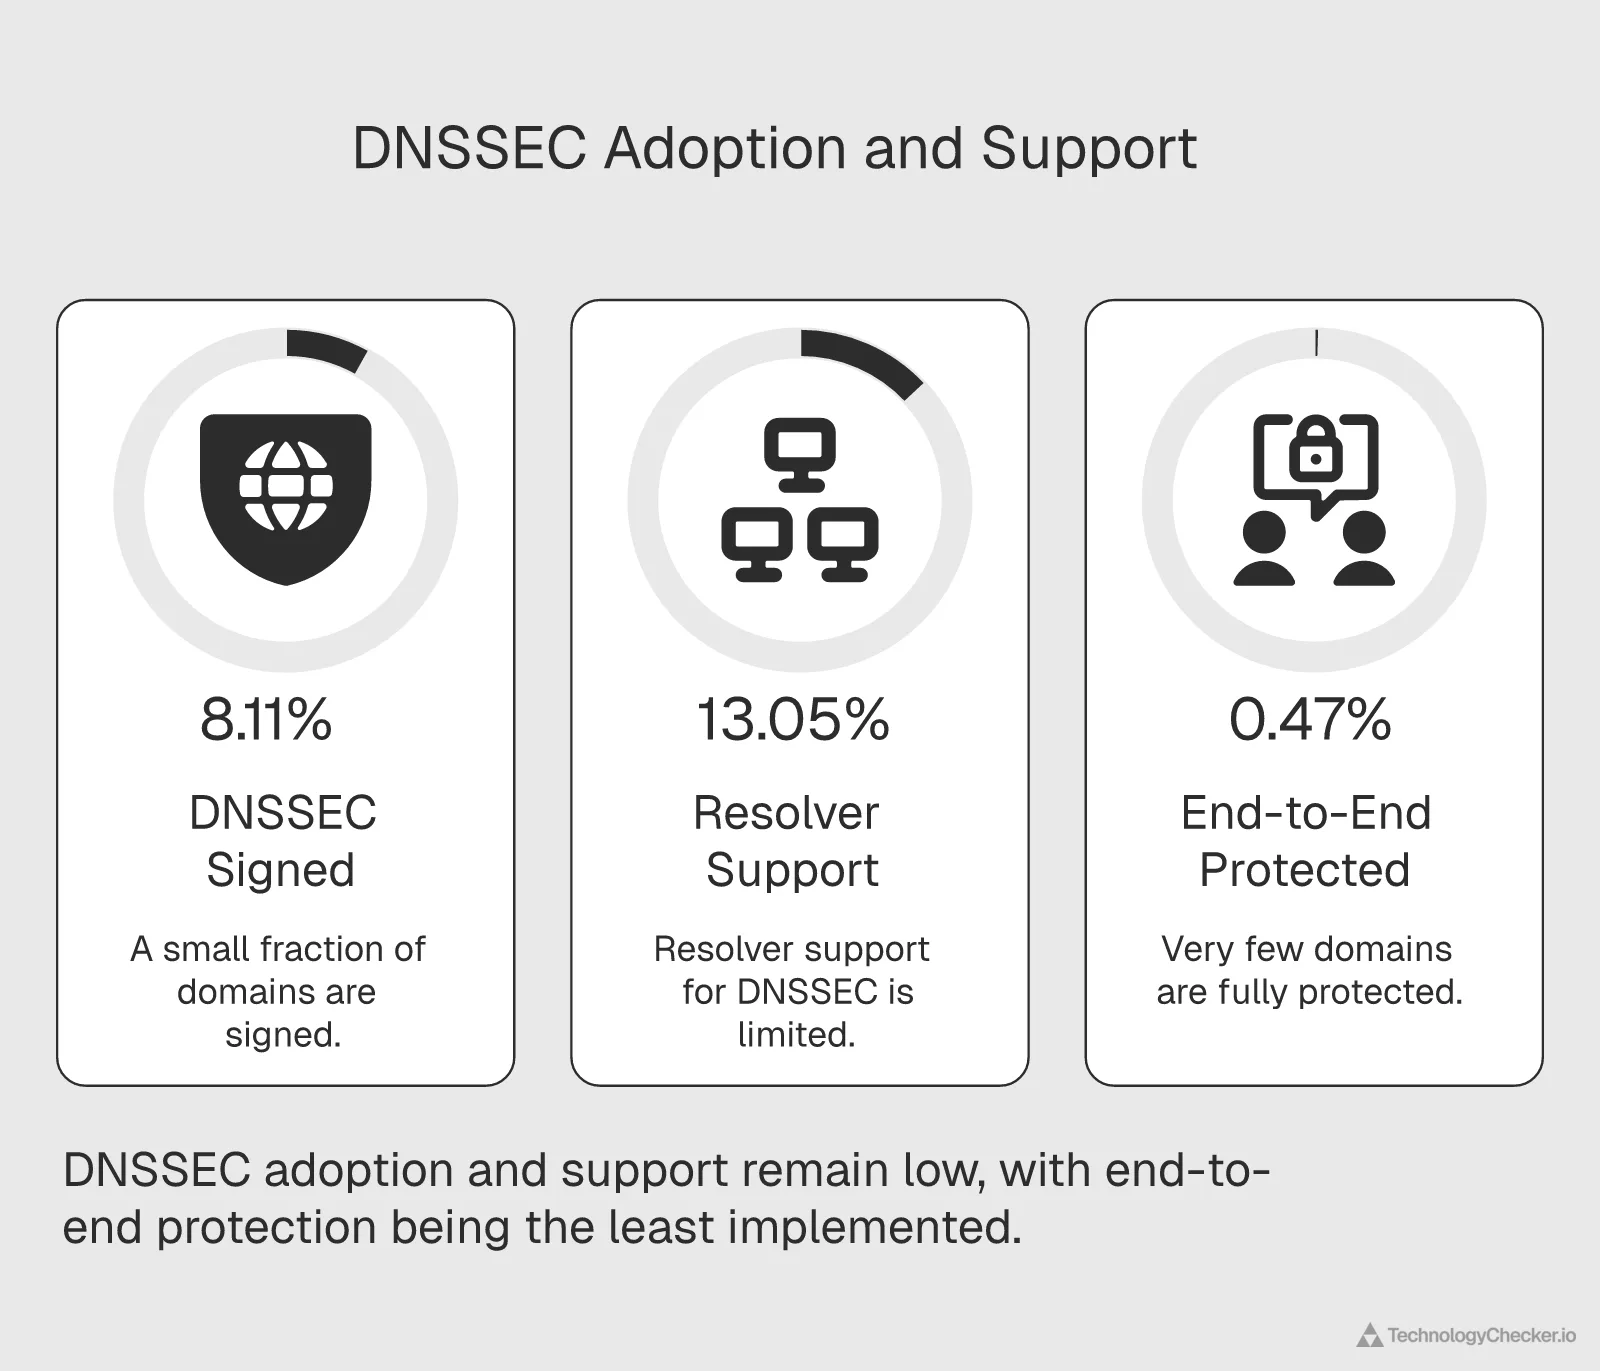
Our analysis of Cloudflare Radar public DNS telemetry pulls three distinct Q1 2026 measurements that together describe the state of DNSSEC. Each measures a different dimension of adoption, and they disagree with each other by more than an order of magnitude.
Signing: 8.11% of queries. In the January 1 to March 31, 2026 window, 8.11% of DNS queries resolved to domains with valid DNSSEC signatures (the SECURE class in the Radar summary/dnssec dimension). Another 0.096% had signatures that failed validation (INVALID), 12.51% returned OTHER responses (mostly non-A/AAAA queries or lookups where signing state couldn't be determined), and a large 79.29% were simply unsigned. So roughly 8 in every 100 queries hit a domain that bothered to sign its zone.
Resolver validation: 13.05% of queries. Over the same period, 13.05% of queries were handled by resolvers that actively perform DNSSEC validation (the dnssec_aware dimension). The remaining 86.95% of queries went through resolvers that do not validate. Cloudflare's 1.1.1.1 itself validates, as does Google's 8.8.8.8 and Quad9, so this figure understates what's possible if users switched resolvers — but it accurately captures what's actually happening today.
End-to-end protection: 0.47% of queries. The dnssec_e2e dimension is the one that actually matters. It counts queries where both sides are doing their jobs — the domain is signed and the resolver is validating. In Q1 2026 that number is 0.469%. Fewer than 5 queries in every 1,000 are actually protected by the cryptographic guarantees DNSSEC is supposed to deliver.
Add one more number to round out the picture. The global INVALID rate sits at 0.096% — responses where a signature exists but fails validation, meaning either the zone operator made a mistake or the chain of trust is broken somewhere upstream. That's small in aggregate but it's meaningful because INVALID responses represent outright authentication failures that non-validating resolvers would silently accept. If every resolver validated tomorrow, 0.096% of the internet would immediately break until those signing errors were cleaned up.
None of these three percentages are the "DNSSEC adoption rate." They're three different rates, and any article quoting just one of them is missing most of what's going on.
The Signing vs Validation Gap: Why the 8% Number Misleads
Here's the mechanical reason for the gap. Signing is a zone-operator decision. Validation is a resolver-operator decision. They happen at opposite ends of the DNS lookup. A signed domain without a validating resolver is no safer than an unsigned one — the forged response is accepted either way. A validating resolver asking for an unsigned domain has nothing to check. Both sides must cooperate for DNSSEC to deliver on its promise.
The Q1 2026 numbers show how badly that cooperation fails at global scale. Our read of Cloudflare Radar's end-to-end measurement puts the actual protection rate at 0.469% — 17 times smaller than the 8.11% signing rate. Put differently, out of every 100 queries that could have been protected (because the domain was signed), only about 6 were. The rest were wasted cryptographic work.
Sweden: the clearest example of the paradox
Sweden is the case study that makes the gap stop feeling abstract. Swedish domains sign 12.34% of queries — above the 8.11% global average and evidence of serious effort from the country's registrars and ISPs. But Sweden's end-to-end rate is 0.27%. That's a 45× gap between signing and protection. Sweden is pouring resources into signing zones that most Swedish resolvers then ignore.
Contrast that with India, which signs 8.63% of queries — barely above the global average — but achieves a 1.50% end-to-end rate, the highest in our 30-country dataset. India's resolvers are doing more of the validation work. The result is three times more real protection than Sweden, despite Sweden signing 43% more of its domains.
What this means for how "adoption" should be measured
The community has been using "DNSSEC adoption" loosely for years. Industry stats pages quote signing percentages because those numbers are easy to collect from zone files. Our read of Radar telemetry says that framing overstates the real security picture by more than an order of magnitude. If the goal is fewer DNS cache poisoning attacks and fewer forged responses reaching end users, the number that matters is end-to-end validation, and that number is 0.62% as of July 2026, not 8%.
APNIC's Geoff Huston made a similar argument in his 2024 essay questioning DNSSEC's practical utility. Our numbers support the mechanical part of his concern: the protocol works, but the two-sided market hasn't closed. It's the resolver side that's really stuck, and the domain side keeps signing into a system most resolvers ignore.
How DNSSEC Adoption Changed Across 2025
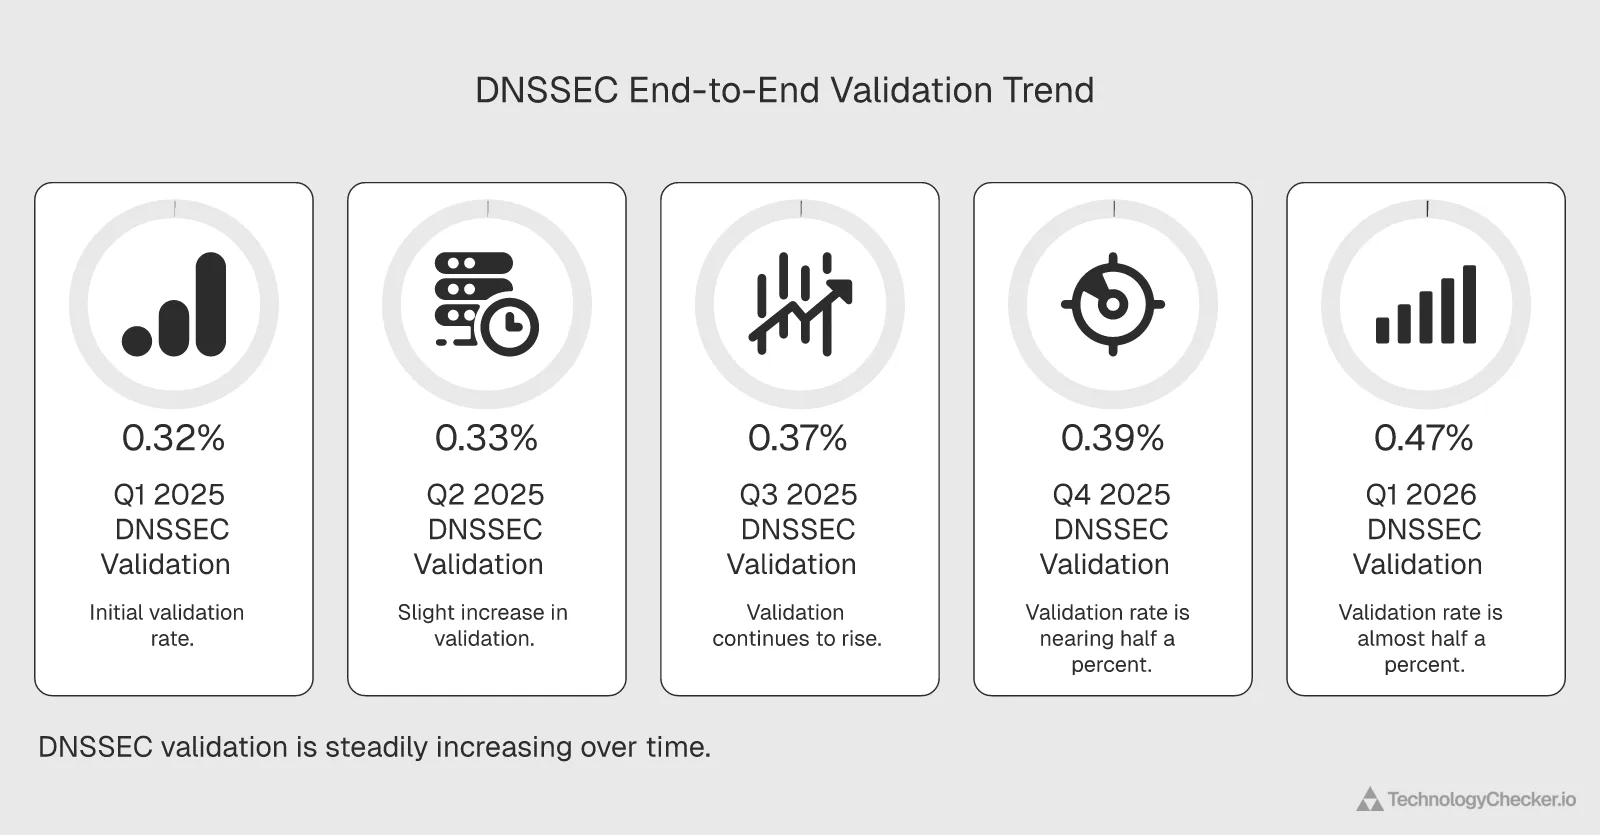
The gap is real, but it's closing. Our analysis of five consecutive quarterly windows on Cloudflare Radar shows end-to-end DNSSEC validation grew from 0.323% in Q1 2025 to 0.469% in Q1 2026 — a relative increase of 45% year-over-year. That's still a small absolute number, but the direction is clearly up and the pace picked up in the second half of 2025.
| Quarter | End-to-end validated | Signing rate |
|---|---|---|
| Q1 2025 | 0.323% | 7.28% |
| Q2 2025 | 0.325% | 7.76% |
| Q3 2025 | 0.373% | 8.05% |
| Q4 2025 | 0.388% | 7.68% |
| Q1 2026 | 0.469% | 8.11% |
Two patterns stand out in this data. First, end-to-end growth accelerated sharply between Q3 2025 and Q1 2026 — the jump from 0.388% to 0.469% in one quarter is larger than the entire first-half movement. Second, signing rates moved much more slowly (7.28% to 8.11% over the same 15 months, an 11% relative gain). Signing is growing, but resolver-side validation is growing faster.
The resolver side is finally moving
Resolver support tells the same story. In full-year 2025, 12.02% of queries went through DNSSEC-aware resolvers. In Q1 2026, that hit 13.05% — a 1.03 percentage point jump in a single quarter and a relative gain of 8.6%. That's the fastest resolver-side growth we've seen in any comparable window of Radar data. Signing grew just 5.5% over the same year-over-quarter comparison.
June 2026 correction. When we re-cut Q1 into individual months for this refresh, this "fastest resolver-side growth" read did not survive. The 13.05% Q1 average was lifted by a single anomalous month — resolver-aware spiked to 14.92% in February, on top of a query-flood event Cloudflare annotates in its own data (Feb 11–13) — and the metric has declined every month since (13.84% in March, 11.54% in April, 11.07% in May). Stripped of the February spike, resolver support is flat-to-declining, not accelerating. The end-to-end validation growth below is real and held up under the same monthly scrutiny; this particular resolver-support claim did not. See the month-by-month section for the full series.
This matters because the resolver bottleneck is what's kept end-to-end rates so low. A few big resolver operators flipping the validation switch moves the global number far more than thousands of domains signing their zones. Cloudflare's 1.1.1.1, Google's 8.8.8.8, and Quad9 already validate. The remaining headroom is in ISP-operated resolvers, corporate resolvers, and country-specific public resolvers — and the Q3 2025 to Q1 2026 acceleration suggests some of those operators finally flipped the switch.
What's driving the change
We can't see individual operator decisions in aggregate data, but three broad factors line up with the timing. Registrar-integrated DNSSEC automation has matured — Cloudflare announced automatic multi-signer provisioning as a default path, and similar tooling has improved across other managed DNS providers. Regulatory pressure has also increased — several European telecoms regulators tightened DNS authentication requirements in 2025. And the operational cost of validation has fallen as resolver software (BIND, Unbound, Knot Resolver, PowerDNS Recursor) has gotten noticeably better at handling signed responses at scale.
45% year-over-year isn't dramatic in startup terms, but for a 20-year-old protocol that was widely declared dead, it's a real signal that the two-sided market is starting to close.
Country-Level DNSSEC Leaders and Laggards
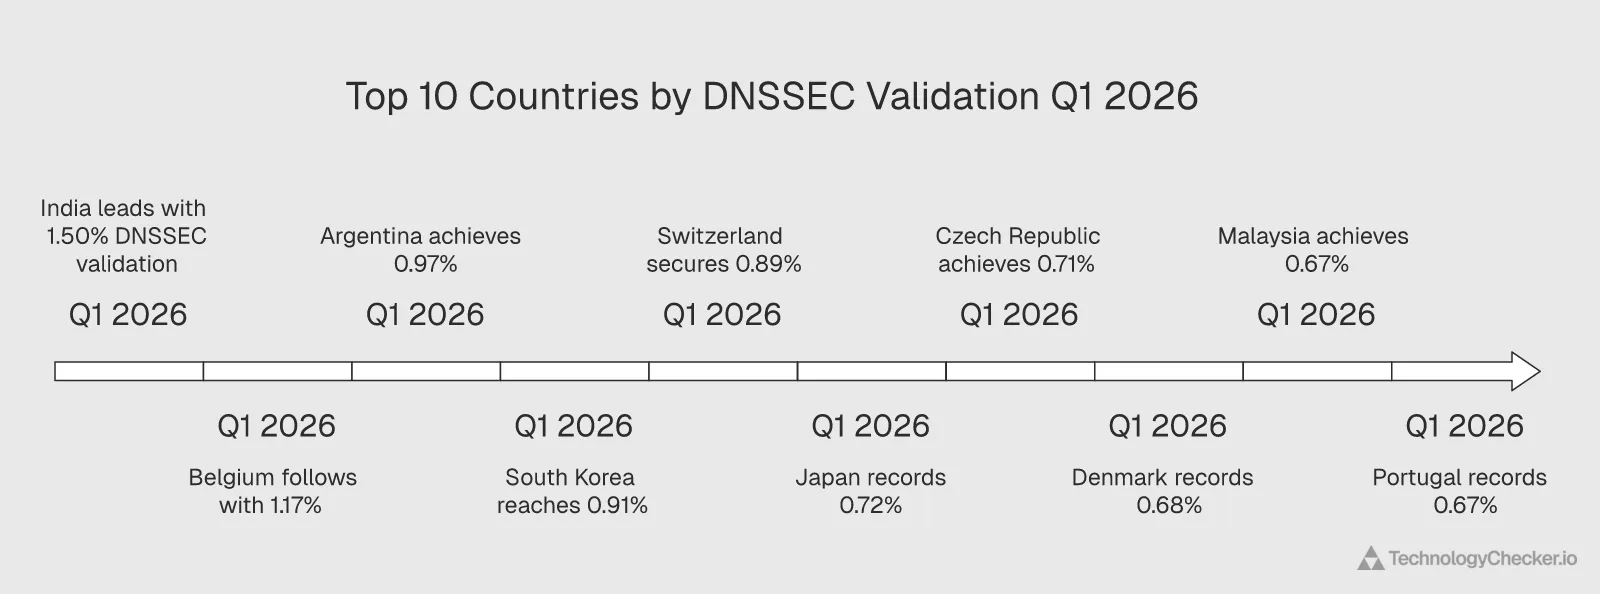
The 30-country breakdown shows just how unevenly DNSSEC adoption is distributed — and how often the leaders aren't the places you'd expect. The table below is our pull of the summary/dnssec and summary/dnssec_e2e dimensions for Q1 2026.
| Rank | Country | End-to-end validated | Signed | INVALID |
|---|---|---|---|---|
| 1 | India | 1.50% | 8.63% | 0.031% |
| 2 | Belgium | 1.17% | 16.60% | 0.055% |
| 3 | Argentina | 0.97% | 7.32% | 0.032% |
| 4 | South Korea | 0.91% | 10.00% | 4.09% |
| 5 | Switzerland | 0.89% | 9.43% | 0.063% |
| 6 | Japan | 0.72% | 9.51% | 0.035% |
| 7 | Czech Republic | 0.71% | 13.11% | 0.072% |
| 8 | Denmark | 0.68% | 11.16% | 0.058% |
| 9 | Malaysia | 0.67% | 7.26% | 0.058% |
| 10 | Portugal | 0.67% | 11.72% | 0.048% |
| 11 | Germany | 0.63% | 7.46% | 0.035% |
| 12 | France | 0.59% | 10.70% | 0.035% |
| 13 | Norway | 0.58% | 15.76% | 0.196% |
| 14 | Finland | 0.57% | 6.96% | 0.019% |
| 15 | United Kingdom | 0.56% | 10.55% | 0.065% |
| 16 | Australia | 0.54% | 11.06% | 0.042% |
| 17 | Poland | 0.52% | 8.42% | 0.046% |
| 18 | Austria | 0.52% | 8.90% | 0.026% |
| 19 | Netherlands | 0.51% | 8.08% | 0.066% |
| 20 | Brazil | 0.49% | 12.76% | 0.029% |
| 21 | Ireland | 0.49% | 10.05% | 0.053% |
| 22 | Canada | 0.49% | 8.82% | 0.059% |
| 23 | Mexico | 0.46% | 5.02% | 0.015% |
| 24 | Italy | 0.42% | 9.93% | 0.032% |
| 25 | United States | 0.37% | 8.06% | 0.107% |
| 26 | Spain | 0.35% | 13.38% | 0.036% |
| 27 | Indonesia | 0.34% | 5.86% | 0.063% |
| 28 | Sweden | 0.27% | 12.34% | 0.239% |
| 29 | China | 0.10% | 2.20% | 0.017% |
| 30 | Singapore | 0.07% | 5.46% | 0.116% |
The unexpected story at the top
India leads the 30-country sample at 1.50% end-to-end — more than triple the global average. That's surprising given India's sheer DNS query volume and its mix of small and large resolver operators. Belgium is second at 1.17% with the highest signing rate in the sample at 16.60%, more than double the worldwide 8.11%. Argentina's third-place 0.97% is genuinely unexpected; its signing rate is barely above the global average, which means Argentine resolvers are validating at an unusually high rate for a country at that infrastructure tier.
The middle band is thick
Nineteen of the 30 countries cluster between 0.40% and 0.75% end-to-end — most of Europe, most of North America, Japan, Australia, and Brazil. The differences here are small enough that small shifts in major resolver operators could re-rank the list quarter-to-quarter. Don't read too much into rank order within this band; read the trend instead.
The laggards have two different problems
Singapore (0.065%) and China (0.095%) sit at the bottom. Singapore signs 5.46% of its domains — below average but not terribly so — yet its end-to-end rate is less than one-fifteenth of that. The resolver side is the problem. China is different: only 2.20% of Chinese queries hit signed domains in the first place, roughly a quarter of the global signing rate. Both sides are underperforming.
Sweden is the standout paradox. Its 12.34% signing rate places it among the European leaders, but its 0.27% end-to-end rate puts it fourth from the bottom in our sample. Swedish zone operators are doing real work that Swedish resolvers are mostly ignoring.
South Korea's INVALID anomaly
South Korea earns a special mention for a 4.09% INVALID rate — 50× the global average of 0.096%. INVALID means the signature is there but the validation fails, which points to signing errors, stale DS records, or broken chains of trust somewhere in the Korean DNS hierarchy. This is the kind of metric that tells you where operational DNSSEC debt is piling up. On a country that's also in the top five for end-to-end validation, it's especially notable — Korea's resolvers are validating aggressively, and they're catching real signing mistakes that would pass silently in less rigorous environments.
Why DNSSEC Adoption Is Still Slow After 30 Years
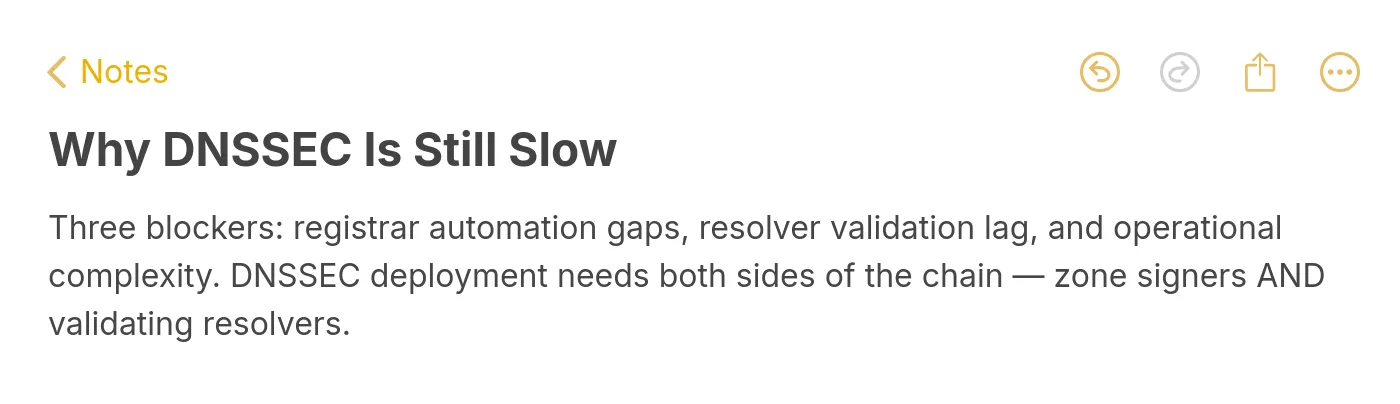
The protocol was first published in 1997, re-specified in RFC 4033 in 2005, and has had working code in major DNS servers for at least 15 years. Why does it still sit at 0.62% end-to-end? Three things keep coming up when you look at the data.
Registrar automation is still patchy
Signing a zone is technically easy. Getting the DS record into the parent zone through your registrar is where most deployments die. Some registrars have clean DNSSEC APIs. Others require a support ticket. Others don't support DS submission at all for certain TLDs. APNIC's analysis of deployment friction puts this high on the list of blockers, and it matches what we see in the data: countries with dominant national registrars that handle DNSSEC cleanly (Belgium's .be, Norway's .no) show signing rates close to 16%, while countries where registrar support is fragmented stay below 10%.
Cloudflare's one-click DNSSEC and similar features across the major DNS providers have helped a lot in the last three years. But if you're not on a platform that hides the DS-submission step, you're still doing it by hand.
The resolver side moves slowly
Resolver operators — ISPs, corporate IT, mobile carriers — have no direct user-visible reason to turn on validation. It costs a small amount of CPU and adds a small amount of latency. It breaks DNS for any domain that's signed incorrectly (hence Korea's visible 4.09% INVALID rate). And the typical end user never notices the difference. The Internet Society's DNSSEC deployment tracker has been pointing at this asymmetry for years.
The Q1 2026 jump from 12.02% to 13.05% resolver support suggests some operators finally decided the cost-benefit math had shifted. But it's still 13%. That's the single largest choke point in the DNSSEC pipeline.
Operational complexity at scale
Even when signing and DS submission go smoothly, DNSSEC introduces operational surface area that unsigned DNS doesn't. Key rollovers have to be coordinated with TTL windows. NSEC3 parameters have to be chosen. Signature lifetimes have to be managed. When something breaks, the failure mode is usually "the domain goes dark," which is worse than most operators' day-one tolerance for the protocol.
Sweden's 12.34% signing rate alongside 0.24% INVALID (also well above the global average) hints at this — aggressive deployment without fully mature tooling produces visible signing errors. Norway shows a similar pattern at 15.76% signed and 0.20% INVALID. The gap between "turned it on" and "kept it working" is real.
None of these barriers are fatal. All three are slowly eroding. But three simultaneous slow-moving barriers compound, and that's why a 30-year-old protocol still protects less than 1% of traffic.
Is DNSSEC Still Worth Implementing in 2026?
The honest answer depends on who's asking. Here's how we'd break it down using the Q1 2026 data.
If you operate a domain that handles auth, payments, or anything with real cache-poisoning risk — yes, sign. The cost of signing through a modern managed DNS provider is minimal. Cloudflare DNS, Route 53, Google Cloud DNS, and NS1 all handle key management for you. The DS-submission step is usually a single API call or registrar checkbox. Even though only 13% of resolvers will validate your signature today, that number is growing, and signed zones are the pre-requisite for any future benefit — including DANE for email authentication and any post-quantum successor protocol.
If you operate a resolver — turn on validation. The marginal cost is small. The marginal benefit — catching forged responses for the 8% of queries hitting signed zones — isn't zero and is growing. If you don't validate, signed zones provide zero protection to your users. That's the asymmetry the whole end-to-end number is describing.
If you're deciding between investing in DNSSEC or investing in DoH/DoT for your user base — do the encrypted transport first. DNSSEC and DNS over HTTPS solve different problems. DoH stops network-level DNS inspection and manipulation, which is a bigger practical threat for most end users than cache poisoning. DNSSEC proves the answer is authentic. In a layered architecture you want both. If budget forces a choice, DoH/DoT usually wins on user impact per engineering hour.
If you're operating a small personal site with no sensitive data — it's optional. The signing work is a real cost and the benefit is close to zero today. This is where APNIC's "calling time on DNSSEC" framing has some truth. For a brochure site or a static blog, the honest answer is that you can skip it without measurable risk increase.
The trend is the strongest argument
The 45% year-over-year growth in end-to-end validation is the most useful signal here. DNSSEC has been stuck at sub-1% for years. It's not stuck anymore. If Q1 2026's pace holds, end-to-end protection would double to roughly 1% by mid-2027 and hit 2-3% by 2028. That's still small, but it's the difference between a protocol that's irrelevant and one that's starting to matter. Signing now is cheap insurance against a future where that growth continues.
What Our Cloudflare Radar Analysis Reveals for SaaS Teams
For SaaS sales and security teams, the more interesting question is what DNSSEC adoption says about the prospects on your target list. Signed zones aren't randomly distributed. They cluster with other signals — DMARC enforcement, SPF coverage, modern CDN usage, and organised DNS operations. A company that's deployed DNSSEC cleanly is almost always a company that's made other mature infrastructure decisions. That pattern matters when you're trying to segment an account list by technical readiness.
Our DNS detection data at TechnologyChecker already captures signing status alongside DMARC, SPF, DKIM, and CDN provider for tens of millions of domains. Cross-referencing DNSSEC with those other signals is a surprisingly clean way to identify security-mature accounts — the kind that typically convert well for enterprise security tooling, compliance software, and zero-trust platforms. If your team wants to know which of your prospects have deployed DNSSEC (and the rest of their security stack), TechnologyChecker's detection covers 29.9 million active domains including DNS security signals. Pair that with the country-level patterns above and you get a ranked view of where your mature buyers actually live.
The other thing the data is useful for is timing. Resolver-side growth of 1.03 percentage points in a single quarter is the sort of shift that moves what "a secure prospect" means. Accounts that were unsigned in 2024 and are signed in 2026 are often in the middle of larger infrastructure modernisation projects — often adopting serverless compute on AWS at the same time. That's a buying signal. Pricing information for TechnologyChecker plans that include DNS-layer detection is available on our pricing page.
Methodology
All numbers in this post come from Cloudflare Radar's public DNS telemetry at radar.cloudflare.com/dns, queried through the Radar MCP get_dns_queries_data endpoint. The original Q1 analysis was pulled on 2026-04-15; the April and May update layers and the month-by-month breakdown were pulled on 2026-06-01. Radar measures query volumes to Cloudflare's 1.1.1.1 public resolver, which processes billions of queries per day across a globally distributed anycast network.
Time windows. Q1 2026 means the 90-day period from January 1, 2026 to March 31, 2026. Full 2025 means the 12-month period from January 1, 2025 to December 31, 2025. Quarterly breakdowns (Q1 2025 through Q1 2026) use the standard calendar quarters. The month-by-month tables added in the June 2026 refresh use individual calendar-month windows (January 1–31, February 1–28, and so on) pulled separately, not slices of a smoothed timeseries — which is how the February resolver-aware anomaly became visible.
The February 2026 anomaly. Cloudflare's own data carries an annotation for an "anomalous query flood over TCP" spanning February 11–13, 2026. Our February resolver-aware figure (14.92%, far above every adjacent month) sits on top of that event, and it is the single largest reason the 90-day Q1 average for resolver support (13.05%) overstated the underlying level. We retain the Q1 figures as originally published for continuity, but the month-by-month section and the inline June correction flag where that average is misleading. End-to-end validation and signing did not show comparable February distortion.
June 2026 refresh. This update re-pulled all three DNSSEC dimensions (summary/dnssec, summary/dnssec_aware, summary/dnssec_e2e) and the protocol distribution (summary/protocol) for the full month of May 2026, plus each individual calendar month January–May 2026, and re-pulled summary/dnssec_e2e with a location filter for India, Belgium, Argentina, the United States, Sweden, and China to check the country leaders. The Q1 2026 baseline figures and the 30-country Q1 table are retained unchanged; the May data and the monthly breakdown are layered on top.
July 2026 refresh (Q2 close plus year-over-year). This update re-pulled the three DNSSEC dimensions plus the wider DNS query anatomy (summary/protocol, summary/query_type, summary/response_code, summary/cache_hit, summary/ip_version) for three calendar windows: Q2 2025 (April 1 to June 30, 2025), Q1 2026, and the full Q2 2026 quarter (April 1 to June 30, 2026). It also pulled full-month June 2026 to extend the monthly series and re-ran summary/dnssec_e2e with a location filter for the six spotlight countries across both Q2 windows. All figures are PERCENTAGE-normalized query shares, so the numbers are read directly with no manual computation. The Q2-over-Q2 comparison is the clean like-for-like year-over-year (the same three calendar months a year apart); it is the first such comparison in this post and supersedes the earlier Q1-2025-to-Q1-2026 read, which spanned mismatched windows. "Encrypted DNS" is the sum of the DoT (TLS) and DoH (HTTPS) transport shares. One deliberate omission: AS112 traffic is not a Radar summary dimension, so it isn't quoted here; the PTR (reverse-lookup) query share is the closest available proxy for that load. The Q1 baseline, the 30-country Q1 table, the 2025 quarterly trend, and the January-to-May monthly series are all retained unchanged; the Q2 close is layered on top.
September 2026 refresh (August data). This update re-pulled the three DNSSEC dimensions plus summary/protocol for three calendar windows (August 2025, July 2026 and August 2026) and re-pulled timeseries_groups/dnssec_e2e in weekly buckets across the July–August boundary to test whether the July flattening had become a decline. June and July 2026 were re-pulled in full to check for revisions; every previously published figure reproduced exactly, so no correction was needed this cycle. The Q1 baseline, the 30-country Q1 table, the 2025 quarterly trend and the monthly series through July are all retained unchanged; August is layered on top.
Dimensions pulled. Three Radar summary dimensions:
summary/dnssec— classifies each query by the signing state of the authoritative zone (SECURE, INSECURE, INVALID, OTHER).summary/dnssec_e2e— classifies each query as POSITIVE (signed and successfully validated by a DNSSEC-aware resolver) or NEGATIVE.summary/dnssec_aware— classifies each query by whether the requesting resolver performs DNSSEC validation (SUPPORTED / NOT_SUPPORTED).
Country-level numbers came from the same three dimensions with a location filter applied across 30 major DNS markets.
Caveats. First, Radar measures query share, not domain share. A single popular unsigned domain can drag the aggregate down more than a thousand signed low-traffic domains pull it up. Signing-rate percentages in this analysis should not be interpreted as "% of registered domains" — they are "% of DNS queries." Second, 1.1.1.1's user base has its own geographic and demographic skew. Country-level resolver-support numbers reflect resolver choice among 1.1.1.1 users in that country, not the full national population. Third, a 90-day Q1 window smooths out short-term incidents but can mask rapid shifts within the quarter. Fourth, DNSSEC classification depends on Cloudflare's internal resolver behaviour for that query; a small amount of edge noise is unavoidable.
Reproducibility. The raw quarterly figures are published in the Radar dashboard under DNS → DNSSEC and are updated continuously. Anyone can verify the numbers by pulling the same endpoints for the same date windows. The 30-country table is our aggregation; the individual country pages on Radar show the same underlying values.
Frequently Asked Questions
What is the adoption rate of DNSSEC?
DNSSEC adoption depends on how you measure it. Our analysis of Cloudflare Radar data for Q3 2026 shows 9.90% of DNS queries resolve to domains with DNSSEC signatures, 10.80% of queries come from resolvers or clients that ask for DNSSEC, and only 0.573% of queries are both signed and validated end-to-end. The end-to-end number is the one that reflects real protection, and the signing headline overstates effective adoption by more than an order of magnitude. Year over year the end-to-end figure rose 55.3%, from 0.369% in Q3 2025, but it fell 0.023 points from Q2 2026. (Source: Cloudflare Radar DNS telemetry, pulled 2026-10-01; September provisional.)
Is DNSSEC outdated?
It's old, not outdated. The protocol was first proposed in the 1990s and re-specified in RFC 4033 in 2005, so the cryptographic primitives are aging, but DNSSEC is still actively supported by all major DNS vendors and is a prerequisite for newer standards like DANE. Post-quantum successors are being discussed at the IETF but aren't deployed. End-to-end validation nearly doubled year-over-year in our data (Q2 2025 to Q2 2026, up 82%), which isn't the trajectory of a dead protocol.
Is DNSSEC adoption growing in 2026?
Year over year yes, quarter to quarter no. End-to-end validation rose 55.3% between Q3 2025 (0.369%) and Q3 2026 (0.573%), but Q3 came in below Q2 (0.596%) after August's drop. September held at 0.545%, so the decline stopped rather than continued. The DNSSEC-aware share is going backwards, 12.33% to 10.80% over the year. (Source: Cloudflare Radar DNS telemetry, pulled 2026-10-01.)
Did DNSSEC validation go down in 2026?
Yes, in August, and then it held. End-to-end validation fell from 0.621% of queries in July 2026 to 0.542% in August across five weekly declines, the first monthly drop of the year. September read 0.545% (provisional), essentially flat. Year over year the September figure is still up 42%, from 0.383% in September 2025. (Source: Cloudflare Radar, dns/summary/dnssec_e2e, pulled 2026-10-01.)
Why is the DNSSEC signing-to-validation gap widening again?
Because the signing side jumped in August 2026: queries reaching signed domains went from 8.23% to 11.80% while validation fell to 0.542%, widening the gap from 13.3× to 21.8×. September reversed part of that jump (10.36% signed), and the gap averaged 17.3× over Q3. A signing wave that gives back two-fifths of itself in a month looks more like a classification change than new signed zones, so compare quarters on the validation figure itself. (Source: Cloudflare Radar, dns/summary/dnssec, pulled 2026-10-01.)
Is DNS traffic encrypted in 2026?
Mostly not. Encrypted DNS (DNS over TLS plus DNS over HTTPS) reached 12.88% of queries in Q3 2026, up from 11.64% in Q3 2025, so roughly 87% of DNS still travels in plaintext over UDP or TCP. Within the encrypted slice, DoH rose to 6.23% over the quarter and passed DoT in September (6.68% against 6.35%), while DoT led for the quarter as a whole. (Source: Cloudflare Radar, dns/summary/protocol, Q3 2025 / Q3 2026, pulled 2026-10-01.)
What percentage of DNS queries return NXDOMAIN?
About 10.27% in Q2 2026, roughly one in ten lookups, where the queried name doesn't exist. The bulk of queries succeed (NOERROR at 85.3%), 2.16% fail with SERVFAIL (which includes DNSSEC validation failures), and the rest are NOTIMP or REFUSED. NXDOMAIN eased slightly from 11.07% a year earlier. (Source: Cloudflare Radar — dns/summary/response_code, Q2 2025 / Q2 2026, pulled 2026-07-02.)
What are the downsides of DNSSEC?
Three downsides keep coming up in operator reports. Operational complexity — key rollovers and DS-record coordination have to be done right or the domain goes dark. Signing errors become visible — Korea's 4.09% INVALID rate in our data shows how broken zones suddenly break queries once resolvers validate. And asymmetric payoff — if resolvers don't validate, your signing effort delivers zero security benefit to those users. Signing without resolver validation is essentially security theatre.
Should I enable DNSSEC on Cloudflare in 2026?
For most domains, yes. Cloudflare handles key generation, signing, and DS submission automatically for domains on their managed DNS. The operational cost is close to zero, and signing today is a prerequisite for benefiting from future resolver-validation growth. The main reason to hold off would be if your registrar doesn't support DS submission or if you run your own signing infrastructure that hasn't been tested for key rollover under load.
Is there any reason not to enable DNSSEC?
Yes, a few. If you run a small personal site with no login or payment flow, the benefit today is near-zero. If your registrar doesn't automate DS submission for your TLD, the operational risk of a misconfigured rollover can outweigh the benefit. If you operate your own DNS infrastructure without mature signing tooling, the INVALID failure mode can take your domain offline. For most commercial domains on a managed DNS provider, none of these apply.
How does DNSSEC work technically?
DNSSEC attaches a cryptographic signature (RRSIG record) to every record set in a signed zone. A validating resolver fetches the RRSIG alongside the answer, looks up the zone's public key (DNSKEY), and verifies the signature. The zone's key itself is vouched for by a DS record in the parent zone, which is signed by the parent's key, and so on up to the root zone. If any signature in this chain of trust fails, the resolver rejects the answer and returns SERVFAIL. The mechanism is defined across RFCs 4033, 4034, and 4035.
Update history
End-to-end validation averaged 0.573% in Q3 2026 and held at 0.545% in September, so August's fall stopped. Added a Q3 2026 analysis, a January-to-September monthly table and an answer to whether 1.1.1.1 validates DNSSEC. The August signing jump half-reversed (11.80% to 10.36%), and the post now reads it as mostly a classification change. Re-pulling every 2026 month moved some early-2026 DNSSEC-aware and invalid readings (March aware 13.84% to 13.22%, April invalid 0.130% to 0.222%); the monthly table uses Cloudflare's current values. Title moved from the August monthly figure (0.54%) to the Q3 figure (0.57%).
End-to-end validation fell to 0.542%, the first monthly decline in seven months, answering the open question left at the July close. Signed-domain reach jumped to 11.79% and resolver support fell to 10.55%, reopening the signing-to-validation gap to 21.8×. The signing jump is flagged as provisional. June and July were re-pulled for revisions and reproduced exactly.
Our analysis of Cloudflare Radar telemetry for August 2026 shows 11.79% of DNS queries reach domains signed with DNSSEC, yet only 0.542% are validated end-to-end. That 22× gap, not the signing headline, is the real DNSSEC story in 2026, and it's the one most industry reports miss.
Updated September 3, 2026 with August data. Last month I wrote that if August came in below 0.62%, the climb story was over and I'd say so. It did, so I am. End-to-end validation fell to 0.542% of queries in August 2026, down from 0.620% in July, and the weekly series shows five consecutive declines rather than one soft week. The year-over-year picture is still positive, with August 2025 at 0.370% and validation up 46.5% on the year. But the seven-month monthly climb this post has tracked since April has ended.
Updated August 1, 2026 with July data. July gives the cleanest year-over-year read this post has had: July 2025 against July 2026, the same calendar month a year apart. End-to-end DNSSEC validation was 0.369% of queries in July 2025. In July 2026 it's 0.620%, a 68% year-over-year gain on a metric that sat frozen for most of the last decade. The signing-to-validation gap this whole post is built around narrowed from 21.7× to 13.3× over that year, and every bit of that came from validation rising while signing stayed flat near 8%. Two things in the July data cut against what I wrote at the Q2 close, and I cover both below: the monthly climb has essentially stalled, and the DoH-overtaking-DoT rotation I called has reversed.
Updated July 2, 2026 for the Q2 close. Q2 has now finished, and this is the first edition with a clean year-over-year comparison: Q2 2025 against Q2 2026, the same three months a year apart. The headline is a milestone. End-to-end DNSSEC validation was 0.326% of queries in Q2 2025. In Q2 2026 it's 0.595%, close to a doubling (+82%) in a single year on a metric that sat frozen for most of the last decade. The signing-to-validation gap closed from 23.6× to 13.6× over the year, and every bit of that came from validation rising while signing stayed flat near 8%.

Data Analyst
5+ years of experience
Emma is a Data Analyst at TechnologyChecker, where she analyses technology adoption data to build better prospect lists and uncover actionable patterns for sales teams.
- BSc Data Science, Cardiff University
- Google Data Analytics Professional Certificate
- Tableau Desktop Certified Associate
Never miss our research