DMARC Adoption Statistics Q3 2026: 89% Pass, About 1 in 6 Fail SPF
Cloudflare Radar, Q3 2026: DMARC pass held at 89.1%, SPF failed on 16.0% of messages, and routed email fell to 76.8% encrypted as IPv6 mail grew.
Published •Updated •Data through September 2026•76 min read

We pulled 90 days of Cloudflare Radar email security data for Q1 2026. DMARC pass rates now sit at 88.99% globally, up from 86.42% a year earlier. SPF enforcement jumped nearly six percentage points over the same window. Those are the headline numbers, and they're good.
Then I kept reading. 27.61% of email traffic is still negotiating TLS 1.0, a transport protocol the IETF formally deprecated in March 2021. Five years ago. That was the finding that stopped me cold.
Updated October 1, 2026 with Q3 2026 data. The authentication numbers held. DMARC pass averaged 89.12% across July to September and SPF failed on 16.00% of messages, still about one in six. The threat numbers came down from their spring peak without returning to 2025 levels: malicious mail was 9.41% of Q3 against 5.37% a year earlier. The number that moved is encryption in transit. Mail forwarded through Cloudflare Email Routing was 76.76% encrypted in Q3 and 73.59% in September, down from 93.09% a year ago, and this edition shows where that plaintext is coming from: IPv6.
Is DMARC mandatory now?
For anyone sending email at volume, effectively yes, though no law requires it for every domain. Since 1 February 2024 Gmail has required senders of more than 5,000 messages a day to publish a DMARC record (a policy of p=none is enough). Yahoo asks bulk senders for the same, and Outlook.com has applied the rule to senders above 5,000 messages a day since 5 May 2025.
| Mailbox provider | Who it applies to | DMARC requirement | In force since |
|---|---|---|---|
| Gmail | Senders of more than 5,000 messages a day to Gmail accounts | DMARC record published; p=none accepted | 1 February 2024 (Google) |
| Yahoo Mail | Bulk senders | "A valid DMARC policy with at least p=none", and DMARC must pass (Yahoo Sender Hub) | February 2024, alongside Gmail |
| Outlook.com, Hotmail, Live | Senders of more than 5,000 messages a day | SPF and DKIM pass, DMARC at least p=none aligned with one of them | 5 May 2025 (Microsoft) |
In Q3 2026, 5.33% of the messages Cloudflare's email security scanned came from domains with no DMARC policy at all (Cloudflare Radar, radar/email/security/summary/dmarc, NONE, calendar quarter). That share is down from 6.54% a year earlier, the direction the bulk-sender rules were meant to push it.
Q3 2026 analysis: authentication held, and routed email lost encryption over IPv6
| Metric | Q3 2025 | Q2 2026 | Q3 2026 | QoQ | YoY |
|---|---|---|---|---|---|
| DMARC pass | 87.46% | 87.25% | 89.12% | +1.87 pt | +1.66 pt |
| DMARC fail | 6.00% | 7.02% | 5.55% | −1.47 pt | −0.45 pt |
| DMARC none (no policy) | 6.54% | 5.72% | 5.33% | −0.39 pt | −1.21 pt |
| SPF pass | 78.32% | 79.36% | 80.61% | +1.25 pt | +2.29 pt |
| SPF fail | 17.69% | 16.97% | 16.00% | −0.97 pt | −1.69 pt |
| DKIM pass | 88.39% | 89.66% | 90.15% | +0.49 pt | +1.76 pt |
| Spoof rate | 12.83% | 20.40% | 14.14% | −6.26 pt | +1.31 pt |
| Malicious rate | 5.37% | 14.68% | 9.41% | −5.27 pt | +4.04 pt |
| Spam rate | 7.35% | 5.59% | 4.60% | −0.99 pt | −2.75 pt |
| TLS 1.3 | 38.68% | 35.43% | 41.53% | +6.10 pt | +2.85 pt |
| Deprecated TLS (1.0 + 1.1) | 40.61% | 47.85% | 41.74% | −6.11 pt | +1.13 pt |
| Encrypted in transit (Email Routing) | 93.09% | 88.16% | 76.76% | −11.40 pt | −16.33 pt |
| IPv6 transport (Email Routing) | 13.21% | 15.06% | 34.52% | +19.46 pt | +21.31 pt |
Source: Cloudflare Radar, radar/email/security/summary/{dmarc, spf, dkim, spoof, malicious, spam, tls_version} and radar/email/routing/summary/{encrypted, ip_version}, calendar quarters, pulled 2026-10-01. Normalization: PERCENTAGE of messages. Email security and Email Routing are different populations: scanned inbound mail versus mail forwarded through Cloudflare.
In August I called encryption in transit the clearest bad trend in this dataset. Q3 makes it clearer, and it also explains most of it. When I split September's routed mail by IP version, the two halves look like different internets:
| Email Routing, by IP version | June 2026 | September 2026 |
|---|---|---|
| IPv4: encrypted in transit | 93.79% | 91.95% |
| IPv6: encrypted in transit | 63.90% | 44.26% |
| IPv6 share of routed mail | 15.54% | 38.51% |
| All routed mail: encrypted | 89.15% | 73.59% |
Source: Cloudflare Radar, radar/email/routing/summary/encrypted with ipVersion=ipv4 and ipv6 (the filter is applied: an invalid value returns error 2001), calendar months, pulled 2026-10-01.
Two things happened at once. IPv6's share of routed mail more than doubled, and the IPv6 mail that arrived was much less likely to be encrypted than it was in June. IPv4 mail barely moved. If IPv6 had stayed at June's share, September would have read about 84.5% encrypted rather than 73.6%; if IPv6 mail had kept June's encryption rate, about 81.2%. Neither alone explains the fall; together, with a small dip on IPv4, they account for all of it. I don't know which senders moved onto IPv6 without TLS, and Radar can't say, so I'm reporting the shape and not guessing the cause.
The calls from August, graded:
- "Malicious mail is the metric that genuinely did not come back down." Half right. It fell to 8.73% in September, its lowest month of 2026, but the Q3 average of 9.41% is still 4.04 points above Q3 2025.
- "Spoof has returned to the 14 to 15% band it occupied in late 2025." Right, and it went below it in September (13.18%).
- The title. SPF failed on 15.45%, 15.71% and 16.76% of messages in July, August and September. That is three rises in a row, and September's figure is almost exactly one in six. The non-numeric title was built for this.
Quick answers on the Q3 2026 email security picture
What is the DMARC pass rate in Q3 2026?
89.12% of messages passed DMARC in Q3 2026, up from 87.46% in Q3 2025 and 87.25% in Q2 2026. September alone read 89.22% (provisional). (Source: Cloudflare Radar, email/security/summary/dmarc, pulled 2026-10-01.)
How much email fails SPF in 2026?
16.00% of messages failed SPF in Q3 2026, about one in six, against 17.69% a year earlier. September read 16.76%, the third monthly rise in a row. (Source: Cloudflare Radar, email/security/summary/spf.)
Why is less email encrypted in transit?
Because more of it is arriving over IPv6, where most of it is plaintext. In September 2026, email forwarded through Cloudflare Email Routing over IPv6 was 44.26% encrypted against 91.95% over IPv4, and IPv6 carried 38.51% of that mail. Overall routed mail was 73.59% encrypted, down from 89.15% in June. (Source: Cloudflare Radar, email/routing/summary/encrypted by ipVersion.)
2026 month by month: email authentication and transport
| Month | DMARC pass | DMARC none | SPF fail | Spoof | Malicious | Encrypted (routing) | IPv6 (routing) |
|---|---|---|---|---|---|---|---|
| September 2025 | 87.38% | 6.06% | 19.00% | 12.29% | 5.05% | 91.18% | 12.58% |
| January 2026 | 87.56% | 8.69% | 14.54% | 19.00% | 12.44% | 95.16% | 7.59% |
| February 2026 | 91.15% | 5.68% | 13.74% | 16.20% | 10.47% | 90.54% | 13.29% |
| March 2026 | 88.36% | 5.87% | 14.64% | 15.72% | 10.66% | 89.25% | 15.39% |
| April 2026 | 89.22% | 5.08% | 15.22% | 20.57% | 15.84% | 87.85% | 14.55% |
| May 2026 | 84.76% | 5.69% | 18.26% | 25.07% | 17.80% | 87.44% | 14.97% |
| June 2026 | 87.84% | 6.52% | 17.51% | 14.77% | 9.72% | 89.15% | 15.54% |
| July 2026 | 89.04% | 5.65% | 15.45% | 14.08% | 9.13% | 80.77% | 29.76% |
| August 2026 | 89.09% | 5.19% | 15.71% | 15.21% | 10.38% | 76.03% | 35.16% |
| September 2026 (provisional) | 89.22% | 5.19% | 16.76% | 13.18% | 8.73% | 73.59% | 38.51% |
| January → September | +1.66 pt | −3.50 pt | +2.22 pt | −5.82 pt | −3.71 pt | −21.57 pt | +30.92 pt |
Source: Cloudflare Radar, radar/email/security/summary/{dmarc, spf, spoof, malicious} and radar/email/routing/summary/{encrypted, ip_version}, calendar months, every month re-pulled 2026-10-01. June to September are provisional.
August 2026: the spoof wave broke a month earlier than we said
| Metric | Aug 2025 | Jun 2026 | Jul 2026 | Aug 2026 | MoM | YoY |
|---|---|---|---|---|---|---|
| DMARC pass | 86.73% | 87.84% | 89.01% | 89.08% | +0.07 pt | +2.35 pt |
| DMARC fail | 6.55% | 5.65% | 5.33% | 5.73% | +0.41 pt | −0.82 pt |
| DMARC none (no policy) | 6.72% | 6.52% | 5.67% | 5.19% | −0.48 pt | −1.53 pt |
| SPF pass | 78.58% | 78.87% | 81.00% | 80.90% | −0.10 pt | +2.32 pt |
| SPF fail | 17.55% | 17.52% | 15.47% | 15.73% | +0.26 pt | −1.82 pt |
| SPF none | 3.87% | 3.61% | 3.53% | 3.37% | −0.16 pt | −0.50 pt |
| DKIM pass | 87.37% | 89.20% | 90.10% | 89.96% | −0.14 pt | +2.59 pt |
| DKIM fail | 2.10% | 1.33% | 1.25% | 1.75% | +0.51 pt | −0.35 pt |
| DKIM none | 10.53% | 9.47% | 8.65% | 8.28% | −0.37 pt | −2.24 pt |
| ARC none (no header) | 70.96% | — | 70.07% | 70.77% | +0.70 pt | −0.19 pt |
| Spoof rate | 14.10% | 14.82% | 14.11% | 15.22% | +1.11 pt | +1.12 pt |
| Malicious rate | 5.88% | 9.73% | 9.15% | 10.39% | +1.24 pt | +4.51 pt |
| Spam rate | 8.12% | 4.95% | 4.83% | 4.68% | −0.16 pt | −3.44 pt |
| Encrypted in transit | 93.35% | 89.15% | 80.77% | 76.03% | −4.73 pt | −17.31 pt |
| Deprecated TLS (1.0+1.1) | 41.95% | — | 43.75% | 41.26% | −2.48 pt | −0.69 pt |
| Modern TLS 1.3 | 36.54% | — | 39.39% | 40.59% | +1.20 pt | +4.05 pt |
| IPv6 transport | 14.18% | — | 29.76% | 35.16% | +5.40 pt | +20.98 pt |
Source: Cloudflare Radar — radar/email/security/summary/{dmarc,spf,dkim,arc,spoof,malicious,spam,tls_version} and radar/email/routing/summary/{encrypted,ip_version}, calendar-month windows, pulled 2026-09-03. Normalization: PERCENTAGE. June and July figures here are Cloudflare's current values, which differ from what earlier sections of this post published — see the revision table below. Deprecated TLS is TLS 1.0 + 1.1 summed.
What Cloudflare revised, and by how much
Every month this post has published on the email-security endpoints was re-pulled on 3 September. Here is everything that moved by more than a rounding error.
| Series | Window | We published | Returns now | Move |
|---|---|---|---|---|
| Spoof rate | June 2026 | 23.56% | 14.82% | −8.74 pt |
| Malicious rate | June 2026 | 18.99% | 9.73% | −9.26 pt |
| Spoof rate | July 2026 | 17.67% | 14.11% | −3.56 pt |
| Malicious rate | July 2026 | 12.91% | 9.15% | −3.76 pt |
| Spoof rate | Q2 2026 | 24.30% | 20.68% | −3.62 pt |
| Malicious rate | Q2 2026 | 18.73% | 14.87% | −3.86 pt |
| SPF fail | June 2026 | 15.85% | 17.52% | +1.67 pt |
| SPF fail | July 2026 | 14.90% | 15.47% | +0.57 pt |
| SPF pass | July 2026 | 81.70% | 81.00% | −0.70 pt |
| DMARC pass | June 2026 | 88.69% | 87.84% | −0.85 pt |
| DMARC pass | July 2026 | 89.37% | 89.01% | −0.36 pt |
| DKIM pass | July 2026 | 90.42% | 90.10% | −0.32 pt |
| Spoof / malicious / DMARC / SPF | July 2025 | 12.05 / 5.18 / 88.29 / 16.50 | 12.05 / 5.18 / 88.32 / 16.46 | no change |
| Encrypted in transit | June and July 2026 | 89.15% / 80.77% | 89.15% / 80.77% | no change |
Source: Cloudflare Radar, all windows re-pulled 2026-09-03 against the figures published in this post's July 2026 and Q2 2026 sections.
Two rows in that table are doing the diagnostic work. A window from twelve months ago reproduces to
two decimal places, so Cloudflare is not rewriting its history — recent months settle, old ones stay
put. And email/routing/* did not move at all, while email/security/* moved by up to nine points.
The revision is specific to the security classifiers, which is consistent with reclassification as more
of a month's mail gets scored, and it means the transport numbers in this post were never affected.
The corrected spoofing series, in one place
| Month | Spoof rate | Malicious rate |
|---|---|---|
| August 2025 | 14.10% | 5.88% |
| November 2025 | 13.67% | 7.63% |
| January 2026 | 19.00% | 12.44% |
| February 2026 | 16.21% | 10.48% |
| March 2026 | 15.91% | 10.84% |
| April 2026 | 21.17% | 16.27% |
| May 2026 (peak) | 25.24% | 17.87% |
| June 2026 | 14.82% | 9.73% |
| July 2026 | 14.11% | 9.15% |
| August 2026 | 15.22% | 10.39% |
Source: Cloudflare Radar — radar/email/security/summary/{spoof,malicious}, calendar-month windows, all pulled 2026-09-03 so every month sits on the same vintage of Cloudflare's scoring.
Read as one series rather than as a sequence of monthly updates, spoofing spiked hard in April and May and then went straight back to where it had been since late 2025. Three consecutive months at 14–15% is the same band as August and November 2025. Whatever drove April and May, it was an episode, and it is over.
Malicious-classified mail is the one that did not round-trip. It ran 5.9% to 7.6% in late 2025 and has sat near 9–10% for three months. That is close to a doubling year over year and it has held. If you are choosing one number from this post to act on, it is that one, not the spoof rate.
Encryption in transit is now the clearest bad trend in this dataset
Last month I published 80.77% encrypted-in-transit and hedged it, on the grounds that IPv6 transport had nearly doubled in the same month and the whole thing looked like a change in which senders were reaching Cloudflare rather than a fleet-wide regression. That hedge is now resolvable in two directions, and both resolved.
The figure did not revise — 80.77% for July returns 80.77% today, because the routing endpoints do not move. And August fell further, to 76.03%. That is 17.31 points below August 2025. Meanwhile IPv6 transport went to 35.16%, from 14.18% a year ago.
So the mix-change explanation is still the most likely one, and it is no longer a one-month curiosity — it is a year-long re-composition of who sends mail through this vantage point, and encryption in transit has fallen every month while it happened. I am no longer treating 76% as provisional noise. Whether the cause is composition or regression, the mail arriving at this vantage point is measurably less encrypted than it was a year ago.
Updated June 1, 2026 — full-month May data: DMARC pass dipped to 85.61% in May (fail doubled to 8.79%) — a message-mix effect, as the adoption-tracking "NONE" rate kept falling; February was 2026's high-water mark at 91.06%, not now. Deprecated TLS (1.0+1.1) climbed to 56.45% of email transport while modern TLS 1.3 collapsed to 25.96%. Spoof attempts escalated to 31.64% (Q1 was 18.11%), driven by a +48.9-point jump in Scam flags. Full month-by-month 2026 breakdown below. ⚠️ Cloudflare has since revised May: the same query now returns 84.78% pass and 9.31% fail. Preserved as originally published; see the August 2026 correction above.
Key findings from our Q1 2026 email authentication analysis:
- DMARC pass rate hit 88.99% globally in Q1 2026, up from 86.42% in Q1 2025 (+2.58 points YoY).
- SPF had the biggest jump of any protocol, climbing from 74.27% to 80.24%. That's a +5.97 point swing in twelve months, driven by post-enforcement compliance after the Google and Yahoo bulk sender mandate.
- DKIM quietly leads the pack at 90.90% pass rate, with the lowest fail rate of any authentication method (1.67%).
- 14.54% of all emails still fail SPF, even though DMARC is widely enforced. That's the authentication gap every deliverability team is fighting.
- 91.79% of emails now travel encrypted in transit, up from 89.67% a year ago. But 1 in 12 still flows in plaintext.
- TLS 1.0 accounts for 27.61% of email transport. Combined with TLS 1.1 (22.51%), more than half of encrypted email is using protocols deprecated five years ago.
- 18.11% of all inbound emails are spoof attempts. Roughly 1 in every 5.5 messages arriving at a Cloudflare-protected mailbox.
- 70.07% of emails have no ARC header, so most forwarded mail loses its original authentication chain.
Quick answers on the August 2026 email security picture
What is the DMARC pass rate in August 2026?
89.08% of inbound mail passed DMARC in August 2026, essentially flat on July's 89.01% and up from 86.73% in August 2025. Mail from domains publishing no policy at all fell to 5.19%, the lowest figure in this post's record. Source: Cloudflare Radar, email/security/summary/dmarc, August 2026.
How much email fails SPF in 2026?
15.73% of messages failed SPF in August 2026, against 15.47% in July and 17.55% in August 2025. SPF has failed on between 15% and 18% of mail in every month we have measured this year, which is why this post now describes it as roughly one message in six rather than quoting a single figure. Source: Cloudflare Radar, email/security/summary/spf, August 2026.
Did email spoofing get worse in 2026?
It spiked and then went back. On Cloudflare's corrected data, spoof attempts peaked at 25.24% in May 2026, fell to 14.82% in June, and have held at 14–15% since — the same band as late 2025. August was 15.22%. The metric that did not come back down is malicious-classified mail, at 10.39% against 5.88% a year earlier. Source: Cloudflare Radar, email/security/summary/{spoof,malicious}, monthly windows re-pulled 2026-09-03.
Why did Cloudflare's email spoofing numbers change?
Cloudflare keeps scoring a month's mail after the month closes, so recently closed months are provisional. June 2026's spoof rate has fallen 8.74 points since we first published it. Months older than about eight weeks are stable — July 2025 reproduces to two decimal places — and the transport endpoints (email/routing/*) do not revise at all. Source: Cloudflare Radar, all windows re-pulled 2026-09-03.
How much email is encrypted in transit in August 2026?
76.03%, down from 80.77% in July and 93.35% in August 2025, so nearly one message in four travelled unencrypted. IPv6 transport rose to 35.16% over the same year, from 14.18%, so a change in which senders reach this vantage point is the most likely driver — but the decline has now run for a full year. Source: Cloudflare Radar, email/routing/summary/{encrypted,ip_version}, August 2026.
July 2026: adoption's best month, and the spoof wave breaking
⚠️ Several figures in this section have been revised by Cloudflare since publication — most importantly the June and July spoof and malicious rates, which have fallen by up to 9.26 points. The section is preserved as originally published; the corrected values are in the revision table in the August 2026 section above.
The Q2 section below closed a quarter and set it against Q2 2025. This layer does the thing that section couldn't: it reads one closed month, July 2026, against the month immediately before it and against the same month a year earlier. Both are like-for-like. The Q2 column stays in the table as a bridge for anyone who cited it, labelled as a quarter, because a 91-day sample and a 31-day sample are not two points on one line.
| Metric | Jul 2025 | Q2 2026 (quarter) | Jun 2026 | Jul 2026 | MoM | YoY |
|---|---|---|---|---|---|---|
| DMARC pass | 88.29% | 87.53% | 88.69% | 89.37% | +0.69 pt | +1.09 pt |
| DMARC fail | 4.85% | 6.77% | 5.17% | 5.18% | +0.01 pt | +0.33 pt |
| DMARC none (no policy) | 6.86% | 5.70% | 6.14% | 5.44% | −0.70 pt | −1.42 pt |
| SPF pass | 78.68% | 80.01% | 80.60% | 81.70% | +1.09 pt | +3.02 pt |
| SPF fail | 16.50% | 16.28% | 15.85% | 14.90% | −0.95 pt | −1.60 pt |
| SPF none | 4.82% | 3.71% | 3.55% | 3.40% | −0.15 pt | −1.42 pt |
| DKIM pass | 88.76% | 89.82% | 89.91% | 90.42% | +0.51 pt | +1.66 pt |
| DKIM fail | 1.49% | 2.02% | 1.52% | 1.26% | −0.26 pt | −0.24 pt |
| DKIM none | 9.74% | 8.16% | 8.57% | 8.33% | −0.25 pt | −1.42 pt |
| ARC none (no header) | 69.18% | 72.67% | 72.19% | 71.31% | −0.89 pt | +2.13 pt |
| Spoof rate | 12.05% | 24.30% | 23.56% | 17.67% | −5.90 pt | +5.61 pt |
| Malicious rate | 5.18% | 18.73% | 18.99% | 12.91% | −6.08 pt | +7.73 pt |
| Spam rate | 6.76% | 5.44% | 4.45% | 4.64% | +0.18 pt | −2.12 pt |
| Encrypted in transit | 94.42% | 88.16% | 89.15% | 80.77% | −8.38 pt | −13.65 pt |
| Deprecated TLS (1.0+1.1) | 41.14% | 51.24% | 51.06% | 48.15% | −2.92 pt | +7.01 pt |
| Modern TLS 1.3 | 38.72% | 30.64% | 28.95% | 33.89% | +4.95 pt | −4.83 pt |
| IPv6 transport | 12.80% | 15.06% | 15.54% | 29.76% | +14.22 pt | +16.96 pt |
Source: Cloudflare Radar — email/security/summary/{dmarc,spf,dkim,arc,spoof,malicious,spam,tls_version} and email/routing/summary/{encrypted,ip_version}, four windows (July 2025, Q2 2026, June 2026, July 2026), pulled 2026-08-01. Normalization: PERCENTAGE. MoM is June to July 2026; YoY is July 2025 to July 2026. The Q2 column is a quarter average and is not a point in the monthly trend. Deprecated TLS is TLS 1.0 + 1.1 summed.
The NONE column had another good month, and this time the pass rate agreed
Since June this post has told you to watch the DMARC "NONE" rate rather than the pass rate, because NONE tracks whether the long tail of domains is publishing records at all. July: 5.44%, down from 6.14% in June and 6.86% in July 2025. SPF NONE hit 3.40%, the lowest of any month in 2026. DKIM NONE was 8.33%, which is mid-pack for the year rather than a low.
One precision point, because this post has claimed a record once before and shouldn't do it twice. July's 5.44% is the second-lowest DMARC NONE month of 2026. April sits lower at 5.07% on Cloudflare's current data. Second-lowest is still a good month, and calling it a record would be wrong.
What's new is that the pass rate moved with adoption instead of against it. 89.37% is the highest month of 2026 apart from February's 91.06%, and it arrived while NONE was falling. For most of this year those two lines have pointed in different directions, which is why the distinction mattered so much. In July they agreed.
The threat trend broke, which makes the Q2 call half right
The Q2 update ended one of its three graded predictions with a flat sentence: the hostile-inbound trend "wasn't a campaign cycle. It's the new baseline." July says otherwise.
Spoof attempts fell to 17.67% of inbound mail, down 5.90 points from June. Malicious-classified mail fell to 12.91%, down 6.08 points. Those are the two largest single-month declines in anything this post has recorded. Set against July 2025 both are still far up (spoof 12.05%, malicious 5.18%), so the year-scale direction we reported holds. The "new baseline" framing does not. A metric that drops six points in a month was carrying campaign volume, not only structural volume. Half right, and the wrong half was the confident half.
The detection-signal breakdown shows where the drop came from.
| Detection signal | Jul 2025 | Jun 2026 | Jul 2026 | MoM |
|---|---|---|---|---|
| Malicious link | 48.84% | 81.05% | 76.02% | −5.02 pt |
| Scam | 2.18% | 75.62% | 74.87% | −0.75 pt |
| IP reputation | 18.08% | 67.65% | 68.90% | +1.25 pt |
| Identity deception | 34.75% | 69.67% | 50.08% | −19.59 pt |
| Brand impersonation | 26.63% | 68.31% | 48.24% | −20.07 pt |
| Newly-registered domain (DomainAge) | 25.51% | 40.55% | 42.77% | +2.22 pt |
Source: Cloudflare Radar — email/security/summary/threat_category, July 2025, June 2026 and July 2026, pulled 2026-08-01. Normalization: OVERLAPPED_PERCENTAGE. A single message usually carries several signals at once, so these figures are the share of flagged mail carrying each signal and they do not sum to 100%.
Identity deception and brand impersonation each fell about 20 points month over month. Scam held at 74.87% and IP reputation ticked up. So the impersonation campaigns eased off in July while the scam and reputation signals stayed where they were. That fits a lull between campaign waves better than it fits attackers giving up, and the newly-registered-domain signal climbing to 42.77% says the raw material is still being stockpiled.
Encryption in transit fell again, and the caveat matters this time
The Q2 update published a walk-back: encryption in transit had fallen from 93.59% to 88.16% year over year, reversing a number the original Q1 post celebrated. July extends it hard. 80.77% for the month, against 94.42% in July 2025. That's 13.65 points off in a year, and roughly one message in five now crossing the network in plaintext.
Because that's a large move, we checked it two ways. The summary endpoint returns 80.77%. A separate daily series over the same 31 days averages 80.97%, agreeing within 0.2 points, and it rules out a single bad day: the share slid from 89.77% on July 1 to 75.15% on July 31, roughly monotonically, with no step.
Now the caveat, which is doing real work here. IPv6 transport nearly doubled in the same month, 15.54% to 29.76%. And the TLS version mix of the mail that stayed encrypted got better, not worse: TLS 1.3 rose 4.95 points to 33.89% while deprecated TLS 1.0 and 1.1 fell 2.92 points to 48.15%. Three routing-level metrics moving together inside one month, with quality improving while quantity collapses, looks like a change in which senders reached Cloudflare Email Routing rather than a fleet-wide TLS regression. The year-over-year direction is solid and consistent across four windows. The one-month magnitude is provisional, and I'd rather say that than let 80.77% travel as a fact about the world's mail servers.
So the Q2 walk-back was the right call, and if anything it understated the trend. The Q2 line about deprecated TLS is the one July softens: combined TLS 1.0 and 1.1 came down to 48.15%, the first month under 50% since February, which pushes the 60% question further out.
The most-abused TLD table rotated, and the last one was a single month
This is the finding I'd flag hardest to anyone who cited the Q2 version of this section. That table put .vg (British Virgin Islands) at 11.39% of all DMARC-failing mail, second only to .com, and I wrote that the most-abused-TLD title had changed hands.
Pulled month by month, .vg accounted for 24.21% of DMARC-failing mail in May 2026 and in no other month. It's absent from the top 60 in March, April, June and July, below a 0.08% floor. One month of activity, spread across ninety days by a quarter average, read as a standing state of the world. It's the inverse of the caution this post has run since June: a quarter average protects you from a noisy month, and it can also hide that the entire phenomenon was one month.
Here is July's list, computed the same way as before.
| TLD | Share of all mail | Share of DMARC-failing mail | Over-representation |
|---|---|---|---|
.ru |
0.28% | 1.97% | 7.0× |
.net |
6.17% | 13.10% | 2.1× |
.jp |
1.59% | 3.13% | 2.0× |
.edu |
4.19% | 8.15% | 1.9× |
.org |
3.73% | 5.63% | 1.5× |
.com |
36.30% | 40.23% | 1.1× |
.cn |
0.30% | 0.20% | 0.7× (under) |
Source: Cloudflare Radar — email/security/top/tlds, baseline versus the dmarc=FAIL filter, July 2026, pulled 2026-08-01. Over-representation is share of failing mail divided by share of all mail. The malicious=, spoof=, spam= and encrypted= filters are silently ignored on this endpoint and return the baseline list unchanged, which is why the DMARC-failure lens is the one we use.
.ru is the row to watch, and unlike .vg it looks like a trend rather than a spike: 0.25% of failing mail in April, 0.27% in May, 0.76% in June, 1.97% in July. Eight times in three months, climbing every month. .cn went the other way and is now under-represented at 0.7×, down from 3.1× at the Q2 close. .com crossed from slightly under to slightly over. If you key a suspicion score on sending TLD, the practical lesson from two refreshes running is that this leaderboard rotates faster than a quarter, so check it monthly and don't hard-code a country code.
Two corrections to numbers we published
Cloudflare has revised three months of DMARC data since the June refresh. Re-running the identical calendar-month queries on 2026-08-01 returns different figures than the ones in the month-by-month table further down this post.
| Month | As published | Re-queried 2026-08-01 | Change |
|---|---|---|---|
| March 2026 | 88.61% pass | 88.27% | −0.34 pt |
| April 2026 | 89.50% pass | 89.23% | −0.27 pt |
| May 2026 | 85.61% pass, 8.79% fail | 84.78%, 9.31% | −0.84 pt, +0.52 pt |
January and February reproduce to the decimal. Q2 2026's deprecated-TLS figure also moved, 51.13% to 51.24%. None of this changes a conclusion: May was still the worst month of the year and the transport story is unchanged. We're publishing the deltas because anyone who re-runs our queries deserves to know the source moved under us, and because the original figures stay in the post exactly as they ran.
And a note on this post's own title. It says 14.5% of mail still fails SPF, which was the Q1 2026 figure. July reads 14.90%, so the headline runs 0.4 points light. The path matters more than the gap: SPF fail peaked at 17.86% in May, then fell to 15.85% in June and 14.90% in July. It's moving back toward the Q1 level rather than away from it. It has cleared 15% in three months this year, so it's volatile enough that a bad month would force the title to change. This one didn't. ⚠️ Graded in the September 2026 update: the next month did. August 2026 came in at 15.73%, and the title changed. Cloudflare has also revised July itself upward to 15.47%, so on current data July had already cleared 15% when this paragraph said it hadn't. Preserved as originally published.
Quick answers on the July 2026 email security picture
What is the DMARC pass rate in July 2026?
89.37% of inbound mail passed DMARC in July 2026, up from 88.69% in June and 88.29% in July 2025. Mail from domains with no published policy fell to 5.44%, the second-lowest month of 2026 behind April's 5.07%. Source: Cloudflare Radar, email/security/summary/dmarc, July 2026.
Did email spoofing slow down in 2026?
In July, yes. Cloudflare Radar classified 17.67% of inbound mail as spoof attempts, down from 23.56% in June, the sharpest one-month fall in our record. It remains well above July 2025's 12.05%. Malicious-classified mail fell alongside it, 18.99% to 12.91%. Source: Cloudflare Radar, email/security/summary/{spoof,malicious}, July 2026.
How much email is encrypted in transit in July 2026?
80.77%, down from 89.15% in June and 94.42% in July 2025, so roughly one message in five travelled in plaintext. Read that with care: IPv6 transport doubled to 29.76% the same month, so part of the drop reflects which senders Cloudflare saw, not TLS behaviour alone. Source: Cloudflare Radar, email/routing/summary/{encrypted,ip_version}, July 2026.
Everything below this line is preserved as originally published: the July 2026 Q2-close refresh, then the June 2026 month-by-month refresh, then the Q1 2026 baseline and deep dives. Where July contradicts a claim, the claim is annotated in place rather than removed.
Email authentication at the Q2 2026 close, with the year-over-year picture
The June refresh below tracked 2026 month by month. This July update does the thing that refresh couldn't: it sets the full second quarter of 2026 against the same quarter a year earlier, so we can separate a noisy month from a real trend. Every figure here is a fresh radar.sh pull of Cloudflare Radar's email/security and email/routing summaries over three calendar windows: Q2 2025, Q1 2026, and Q2 2026.
Two things happened over the year, and they point in opposite directions. Authentication adoption kept improving. The inbound threat environment got worse, and email transport security went backward. Here's the whole picture in one table.
| Metric | Q2 2025 | Q1 2026 | Q2 2026 | YoY |
|---|---|---|---|---|
| DMARC pass | 87.72% | 88.89% | 87.53% | −0.19 pt |
| DMARC fail | 4.23% | 4.37% | 6.77% | +2.54 pt |
| DMARC none (no policy) | 8.05% | 6.75% | 5.70% | −2.35 pt |
| SPF pass | 76.73% | 80.30% | 80.01% | +3.28 pt |
| SPF fail | 17.60% | 14.42% | 16.28% | −1.32 pt |
| SPF none | 5.67% | 5.28% | 3.71% | −1.96 pt |
| DKIM pass | 88.17% | 90.81% | 89.82% | +1.65 pt |
| DKIM fail | 1.91% | 1.69% | 2.02% | +0.12 pt |
| ARC none (no header) | 67.71% | 69.73% | 72.67% | +4.97 pt |
| Spoof rate | 12.08% | 17.21% | 24.30% | +12.21 pt (2.0×) |
| Malicious rate | 5.46% | 11.43% | 18.74% | +13.28 pt (3.4×) |
| Spam rate | 6.55% | 5.65% | 5.45% | −1.10 pt |
| Encrypted in transit | 93.59% | 91.79% | 88.16% | −5.43 pt |
| Deprecated TLS (1.0+1.1) | 42.79% | 47.62% | 51.13% | +8.34 pt |
| Modern TLS 1.3 | 35.95% | 35.28% | 30.72% | −5.23 pt |
| IPv6 transport | 13.70% | 11.93% | 15.06% | +1.36 pt |
Source: Cloudflare Radar — email/security/summary/{dmarc,spf,dkim,arc,spoof,malicious,spam,tls_version} and email/routing/summary/{encrypted,ip_version}, three calendar windows (Q2 2025, Q1 2026, Q2 2026), pulled 2026-07-02. Normalization: PERCENTAGE. Deprecated TLS is TLS 1.0 + 1.1 summed.
Adoption is still improving. Watch the NONE column, not the pass rate.
The number I told you to watch in June was the DMARC "NONE" rate, because it tracks whether the long tail of domains is publishing records at all, and it's the cleanest adoption signal in the dataset. Over the full year it fell from 8.05% to 5.70%, its lowest point in anything we've pulled. ⚠️ Superseded by the August update above, and imprecise as published: 5.70% is a quarter average, and individual months already sat lower (April 2026 at 5.07%, July 2026 at 5.44%). Preserved as originally published. SPF "NONE" fell to 3.71% and DKIM "NONE" to 8.16%. All three moved the right way. So when you see the message-weighted DMARC pass rate essentially flat year-over-year (87.72% to 87.53%), don't read stagnation into it. More domains published records than ever; the pass rate is flat because it's dominated by a handful of enormous senders whose volume swamps the millions of small domains quietly doing the right thing. Adoption and pass rate are different questions, and adoption won the year.
The threat environment doubled, and the mix changed
Now the part that would keep me up at night if I ran a security team. The spoof rate: 12.08% of inbound mail a year ago, 24.30% now. It doubled. Malicious-classified mail more than tripled, from 5.46% to 18.74%. And here's the tell that this is a genuine shift in attacker behavior rather than more of the same: bulk spam actually fell over the year, from 6.55% to 5.45%. Attackers didn't send more junk. They sent more targeted impersonation. The threat-category breakdown makes the mechanism unmistakable.
| Detection signal | Q2 2025 | Q2 2026 | YoY |
|---|---|---|---|
| Malicious link | 54.99% | 75.84% | +20.8 pt |
| Identity deception | 34.61% | 58.81% | +24.2 pt |
| Scam | 1.78% | 58.01% | +56.2 pt |
| Brand impersonation | 28.77% | 57.40% | +28.6 pt |
| IP reputation | 29.07% | 46.12% | +17.0 pt |
| Newly-registered domain (DomainAge) | 20.43% | 45.57% | +25.1 pt |
Source: Cloudflare Radar — email/security/summary/threat_category, Q2 2025 vs Q2 2026, pulled 2026-07-02. Reported as overlapping percentages: a single message usually carries several signals at once, so the column doesn't sum to 100%.
The "Scam" signal is the one to sit with. A year ago it fired on 1.78% of flagged mail, essentially a rounding error. This quarter it fired on 58.01%. Pair that with the newly-registered-domain signal more than doubling (20.43% to 45.57%) and you have the whole playbook: register domains in bulk, run scam and brand-impersonation campaigns off them, burn them before reputation systems catch up. It's the same pattern I flagged in the June refresh, now confirmed across a full year rather than a five-month window. And it's exactly why DMARC enforcement alone doesn't save you. A domain registered yesterday to impersonate your brand can publish a flawless DMARC record of its own. Authentication proves a sender controls a domain. It says nothing about whether that domain was created to defraud your customers.
The most-abused sending TLDs, and how the leaderboard rotated
The plan for this refresh was to publish the most-abused sending TLDs. Cloudflare's API won't segment top TLDs by "malicious" directly (that filter is a no-op on the endpoint, something I confirmed the hard way), but it will segment them by DMARC result, which gets at the same thing from a cleaner angle: which top-level domains account for a disproportionate share of the mail that fails DMARC. Compare each TLD's slice of DMARC-failing mail against its slice of all mail, and the over-represented ones are where spoofing and misconfiguration concentrate.
| TLD | Share of all mail | Share of DMARC-failing mail | Over-representation |
|---|---|---|---|
.com |
35.79% | 33.78% | 0.9× (under) |
.vg (British Virgin Islands) |
not in top 15 | 11.39% | ≥ 8× |
.net |
6.32% | 9.73% | 1.5× |
.edu |
4.59% | 8.91% | 1.9× |
.cn |
1.56% | 4.78% | 3.1× |
Source: Cloudflare Radar — email/security/top/tlds, baseline vs the dmarc=FAIL filter, Q2 2026, pulled 2026-07-02. Over-representation = share of failing mail ÷ share of all mail.
.com sends a third of the world's email and fails DMARC slightly less than its volume would predict, which is what you'd expect from a TLD dominated by large, well-configured senders. The interesting rows are the over-represented ones. .vg, the British Virgin Islands, doesn't crack the top 15 of all sending yet accounts for 11.39% of DMARC-failing mail, the second-largest slice of failing mail of any single TLD. .cn fails at roughly three times its sending share. .edu at nearly twice, which tracks with the reality that university mail runs on some of the oldest, most federated infrastructure on the internet.
The year-over-year rotation is the part I didn't expect. In Q2 2025, .net owned failing mail at a startling 24.79% of it. This quarter .net has fallen to 9.73% and .vg has taken its place at the top of the over-represented list. The "most-abused TLD" title changed hands over the year, from a mainstream TLD cleaning up its act to a small offshore one that spoofers have clearly discovered. If you maintain a blocklist or a suspicion score keyed on sending TLD, that's the kind of rotation worth re-checking every quarter.
⚠️ Superseded by the August 2026 update above. Pulled month by month, .vg accounted for 24.21% of DMARC-failing mail in May 2026 and in no other month, and it has been absent from the top 60 since. The quarter average spread one month's burst across ninety days. .ru leads July's over-represented list at 7.0×. Preserved as originally published.
Transport security went backward on both axes
The June refresh warned that email's transport layer was getting older even as more of it got encrypted. The full-year numbers confirm it, and they're worse than the one-month view suggested was safe to conclude. Encryption in transit didn't just stall. It fell, from 93.59% a year ago to 88.16% this quarter. Plaintext nearly doubled, from 6.41% to 11.84% of mail. Roughly one in every eight messages now crosses the network readable by anyone on the path, where a year ago it was one in sixteen. At the same time the quality of the encrypted portion eroded: deprecated TLS 1.0 and 1.1 rose from 42.79% to 51.13% of encrypted transport, while modern TLS 1.3 fell from 35.95% to 30.72%. This is the finding I'd retract the Q1 headline over. The original post celebrated encryption in transit climbing year-over-year. A full year later that has reversed, and I'd rather correct it in public than let a rosy number stand.
The three June predictions, now settled
June's update posed three questions the Q2 close could answer. Here's how they landed.
Did the DMARC pass rate snap back? Broadly yes. May's 85.61% was the low point of a single month; the full-quarter pass rate came in at 87.53%, back near the year's band, and the "NONE" rate kept falling. May was a message-mix blip, not a structural break. Called correctly.
Did deprecated TLS cross 60%? Not at the quarter level. Combined TLS 1.0 and 1.1 reached 51.13% for the full quarter (the 56.45% figure was a single alarming month, May). The 60% line held for now, but the year-over-year direction (+8.34 points) makes it a question of when, not if.
Did the spoof rate keep compounding? Yes, and this is the call I most wish I'd gotten wrong. Full-quarter spoof landed at 24.30%, up from 17.21% in Q1, with malicious mail tripling alongside it. The hostile-inbound trend wasn't a campaign cycle. It's the new baseline.
⚠️ Superseded by the August 2026 update above: July broke this call. Spoof fell to 17.67% and malicious to 12.91%, the sharpest one-month declines in our record, so the compounding was carrying campaign volume after all. Both remain above July 2025. Preserved as originally published.
Quick answers on the Q2 2026 email security picture
⚠️ These three answers describe the Q2 2026 quarter and are preserved as originally published. For the current picture, see the July 2026 answers above: DMARC "NONE" is now 5.44%, the spoof rate 17.67%, and encryption in transit 80.77%.
Is DMARC adoption still growing in 2026? Yes. The clearest adoption signal is the DMARC "NONE" rate, the share of mail from domains with no published policy at all, and it fell from 8.05% in Q2 2025 to 5.70% in Q2 2026, the lowest in our record. SPF "NONE" fell to 3.71% and DKIM "NONE" to 8.16% over the same year. The message-weighted pass rate looks flat (87.53%) only because it's dominated by a few very high-volume senders; the underlying population of domains kept publishing records.
Has email spoofing gotten worse in 2026? Sharply. Cloudflare Radar classified 24.30% of inbound mail as spoof attempts in Q2 2026, double the 12.08% of a year earlier, and malicious-classified mail more than tripled to 18.74%. Bulk spam actually fell over the same period (6.55% to 5.45%), which signals that attackers moved from high-volume junk to targeted impersonation. The "Scam" detection signal went from 1.78% of flagged mail to 58.01%.
Is email still encrypted in transit in 2026? Less than it was. Encryption in transit fell from 93.59% in Q2 2025 to 88.16% in Q2 2026, so roughly one in eight messages now travels in plaintext, up from one in sixteen a year ago. The encrypted portion also aged: deprecated TLS 1.0 and 1.1 rose to 51.13% of encrypted transport while modern TLS 1.3 fell to 30.72%.
The June 2026 refresh below is preserved as first published: the month-by-month 2026 trajectory (January through May) and the May clean-month pull that set up the three predictions graded above. The Q1 2026 baseline and all deep dives follow it, unchanged.
How Did Email Authentication and TLS Security Evolve Through May 2026?
According to Cloudflare Radar email security, the trend turned in May 2026. DMARC pass rates, which had climbed steadily to 89.48% in April, fell to 85.61% in May — a 3.87-point drop — while DMARC fail rates more than doubled from January's 3.84% to 8.79%, the highest of the year. Deprecated TLS 1.0 broke past 31%, pushing combined deprecated transport (TLS 1.0 + 1.1) to 56.45% of encrypted email, up from 50.12% in Q1. And the spoof rate kept escalating: 18.11% in Q1, 24.33% in April, 31.64% in May — nearly 1 in 3 inbound messages. We re-pulled every Cloudflare Radar email-security dimension for the full month of May 2026 and added a month-by-month view of the whole year. Updated June 1, 2026.
Here's the honest read, from someone who has run scanning infrastructure across 29.9 million active domains: the May DMARC dip is almost certainly a message-mix effect, not a collapse in adoption. Cloudflare's pass rate is weighted by message volume, so one or two very high-volume senders hitting a rough patch — a rotated DKIM key, a new sending IP missing from an SPF record, a forwarding surge that breaks alignment — can pull the global number down for a month while the underlying domain population keeps improving. The DMARC "NONE" rate, which actually tracks adoption, kept falling. What I can't wave away is the transport data. Deprecated TLS climbing to 56.45% while modern TLS 1.3 fell from 34.55% in January to 25.96% in May is the opposite of progress, and it's the trend I'd want every email security buyer reading these numbers to sit with.
How Did Email Security Metrics Shift From Q1 2026 Through May 2026?
| Metric | Q1 2026 (post) | April 2026 | May 2026 | Net direction |
|---|---|---|---|---|
| DMARC pass rate | 88.99% | 89.48% | 85.61% | Dipped in May |
| DMARC fail rate | 4.33% | 5.55% | 8.79% | Doubled since January |
| DMARC none rate | 6.68% | 4.97% | 5.61% | Still below Q1 — adoption holding |
| SPF pass rate | 80.24% | 81.62% | 79.54% | Roughly flat |
| SPF fail rate | 14.54% | 14.67% | 16.86% | Edging up |
| SPF none rate | 5.23% | 3.71% | 3.61% | More domains publishing |
| DKIM pass rate | 90.90% | 90.41% | 89.92% | Slow drift down |
| DKIM fail rate | 1.67% | 2.13% | 2.30% | Slowly up |
| TLS 1.0 share | 27.61% | 29.89% | 31.32% | Still climbing |
| TLS 1.1 share | 22.51% | 21.76% | 25.13% | Jumped in May |
| TLS 1.2 share | (Q1 not cited) | 18.03% | 17.59% | Flat |
| TLS 1.3 share | (Q1 not cited) | 30.32% | 25.96% | Eroding fast |
| Combined deprecated TLS (1.0 + 1.1) | 50.12% | 51.65% | 56.45% | Worsening |
| Spoof rate | 18.11% | 24.33% | 31.64% | Sharp, sustained climb |
| Spam rate | (Q1 not cited) | 4.65% | 6.66% | Rising |
| Malicious email rate | (Q1 not cited) | 19.57% | 24.87% | Rising |
| Encrypted in transit | 91.79% | (not cited) | 87.44% | Slipped |
| ARC none rate | 70.07% | (not cited) | 75.44% | More mail missing ARC |
Which April 2026 Narratives Did May Reverse, Confirm, or Extend?
1. DMARC's steady climb reversed in May. April's update read DMARC pass as "continued improvement" at 89.48%. May undercut that: pass fell to 85.61% and fail more than doubled from January's 3.84% to 8.79%. I don't read this as adoption going backward — it's a message-weighted metric, and a high-volume sender breaking alignment for a few weeks moves the global line more than thousands of small domains publishing clean records (the DMARC "NONE" rate, which tracks publishing, stayed below Q1). But it's a direct walk-back of the "improvement is monotonic" framing. Anyone who quoted April's 89.48% as a stable figure should swap in the month-by-month view below.
2. The deprecated-TLS warning we flagged for May came true — and then some. April's update asked one explicit question: if May showed TLS 1.0 above 30%, the Q1 framing badly understated the issue. May's TLS 1.0 share landed at 31.32%, and combined deprecated transport (1.0 + 1.1) hit 56.45%, up from 50.12% in Q1. Worse, modern TLS 1.3 fell from 34.55% in January to 25.96% in May. The encryption-quality story isn't stabilizing; it's actively deteriorating.
3. The spoof escalation didn't reverse — it accelerated. Q1 measured 18.11% of inbound mail as spoof attempts. April measured 24.33%. May measured 31.64% — nearly 1 in 3 messages. That's a +13.5-point climb across five months, and the steepest single-month jump (April→May, +7.3 pts) is the most recent one. The Q2 threat environment isn't a one-month spike; it's a trend. Malicious-classified mail rose in lockstep (19.57% → 24.87%), and the threat-category breakdown below shows exactly what kind of attacks are driving it.
4. Encryption-in-transit slipped, reversing Q1's "progress is real." The Q1 post celebrated 91.79% of email encrypted in transit, up 2.12 points year-over-year. May's Email Routing data shows encrypted transport back down to 87.44%, with plaintext up from 8.21% to 12.56% — now 1 in 8 messages instead of 1 in 12. Combined with the TLS-version erosion, the transport-security picture is the clearest "the headline was misleading" moment in this refresh.
Which Email Authentication Patterns Held Through May?
DKIM continued to lead all three protocols, holding an 89–93% pass rate every month with the lowest fail rate of any method (1.4–2.3%) — the "DKIM quietly does the heavy lifting" read remains correct. SPF's structural fail rate stayed in its familiar 14–17% band all year; the multi-hop alignment problem isn't being solved, it's being papered over by DMARC's "either-SPF-or-DKIM" pass logic. And DMARC "NONE" stayed below its Q1 level (6.68% → 5.61%), so the long tail of domains kept publishing records even in a month when the message-weighted pass rate dipped — the distinction between adoption and pass rate that the month-by-month section below makes concrete.
What Should We Watch for in June 2026?
Does the DMARC pass rate snap back? If June returns to the 88–91% band, May was a message-mix blip. A second sub-87% month would mean something structural shifted in the high-volume sender population, not just one bad cohort.
Will deprecated TLS cross 60%? Three straight months of climbing deprecated transport (and falling TLS 1.3) put 60% within a quarter's reach. That would make "encrypted in transit" almost meaningless as a security signal without the version breakdown.
Is the spoof rate going to keep compounding? A fourth consecutive monthly increase would confirm a structurally more hostile inbound environment rather than a campaign cycle. With newly-registered-domain flags already up 31 points since January, the raw material for more spoofing is clearly being stockpiled.
Month-by-month: how DMARC adoption moved across 2026
The most useful thing this June refresh adds is the view we didn't have when the post first ran: what every month of 2026 looked like, side by side. Quarter averages hide the turning points. Here is the full month-by-month DMARC breakdown from Cloudflare Radar, January through May 2026.
| Month | DMARC PASS | DMARC FAIL | DMARC NONE |
|---|---|---|---|
| January 2026 | 87.47% | 3.84% | 8.69% |
| February 2026 | 91.06% | 3.24% | 5.70% |
| March 2026 | 88.61% | 5.68% | 5.71% |
| April 2026 | 89.50% | 5.53% | 4.97% |
| May 2026 | 85.61% | 8.79% | 5.61% |
Three things stand out.
February was the high-water mark, not "now." DMARC pass peaked at 91.06% in February and has drifted lower since. If you cited a single "2026 DMARC pass rate," you'd probably have grabbed February's number — and you'd be more than five points high for May. This is exactly why a quarter average (88.99% for Q1) is a safer headline than any single month, and why we anchor the post on the quarter and treat the monthly numbers as the trajectory.
The "NONE" column is the real adoption story, and it's good news. DMARC NONE — emails from domains with no published policy at all — fell from 8.69% in January to the 5–6% range by spring. That's the metric that actually tracks adoption (are domains publishing records?), as opposed to pass rate (did this month's mail happen to align?). Adoption kept improving all year, even in May. That distinction is the whole ballgame, and it's why the May pass-rate dip doesn't worry me the way the transport numbers do.
The May fail spike is concentrated, not broad. Fail more than doubled from January (3.84%) to May (8.79%) while NONE stayed roughly flat. If adoption were regressing, you'd expect NONE to climb as domains pulled their records. Instead, records are still being published — they're just failing alignment more often in May, which points at a handful of high-volume senders rather than a population-wide problem.
David Thomson, CTO, on reading a one-month dip: I've spent the better part of a decade reading authentication data at scale — first at Google, now running TechnologyChecker's crawl pipeline from Edinburgh across 29.9 million active domains. The instinct people have when a pass rate drops is to assume the sky is falling. It usually isn't. A message-weighted metric like Cloudflare's tells you about this month's mail, not about whether the world's domains are configured correctly. When I want to know whether adoption is genuinely improving, I ignore the pass rate and watch two things: the NONE rate (is the long tail still publishing records?) and the domain-weighted enforcement numbers from Valimail and Red Sift (are publishers moving from
p=nonetop=reject?). By both measures, 2026 is still trending the right way — even in a month the headline pass rate fell. The number I'd actually lose sleep over isn't DMARC at 85.6%. It's TLS 1.3 share falling while we keep calling email "encrypted."
For the protocols underneath DMARC, here's how all three pass rates moved across the year:
| Month | DMARC PASS | SPF PASS | DKIM PASS |
|---|---|---|---|
| January | 87.47% | 78.48% | 88.98% |
| February | 91.06% | 82.26% | 92.88% |
| March | 88.61% | 80.15% | 90.95% |
| April | 89.50% | 81.65% | 90.43% |
| May | 85.61% | 79.54% | 89.92% |
DKIM held the top spot in four of five months — the "DKIM quietly does the heavy lifting" finding holds up month by month. SPF stayed the weakest of the three all year, never clearing 83%, with its fail rate parked in the 14–17% band. The three protocols move together, which is what you'd expect: they share the same underlying population of senders, so when a big sender has a bad month it tends to drag SPF and DMARC down together (DKIM is more insulated because forwarding doesn't break it the way it breaks SPF).
The transport trend the monthly view exposes
The original post's most uncomfortable finding was that half of encrypted email used TLS versions deprecated in 2021. The monthly data shows that wasn't a fluke — it's a deteriorating trend:
| Month | TLS 1.0 | TLS 1.1 | TLS 1.3 (modern) | Deprecated (1.0 + 1.1) |
|---|---|---|---|---|
| January | 27.69% | 21.32% | 34.55% | 49.01% |
| February | 25.51% | 22.11% | 34.73% | 47.61% |
| March | 28.34% | 23.75% | 31.05% | 52.09% |
| April | 30.43% | 21.62% | 29.87% | 52.05% |
| May | 31.32% | 25.13% | 25.96% | 56.45% |
Modern TLS 1.3 lost nearly nine points of share in five months (34.55% → 25.96%) while the deprecated bucket gained seven (49.01% → 56.45%). Read those two lines together and the conclusion is uncomfortable: as more long-tail senders get pulled onto "encrypted" transport, they arrive with legacy TLS stacks that drag the quality of email encryption backward even as the quantity of it inches along. The encrypt-in-transit headline (still in the high 80s to low 90s) is hiding a transport layer that's getting older, not newer.
The other breakdown: how the shape of malicious mail changed
Cloudflare's email telemetry doesn't expose an industry or vertical dimension the way its AI-crawler data does — and its one segmentation endpoint (top sending TLDs) is currently erroring on the API, so we won't publish a per-sector cut we can't stand behind this month. What it does expose is a threat-category breakdown: for mail flagged as a threat, which detection signals fired. Comparing January to May shows the spoof-rate escalation isn't just bigger — it's a different kind of attack.
| Threat signal | Jan 2026 | May 2026 | Shift |
|---|---|---|---|
| Malicious link | 75.73% | 79.58% | +3.8 pt |
| Scam | 18.34% | 67.21% | +48.9 pt |
| Identity deception | 56.11% | 64.67% | +8.6 pt |
| Brand impersonation | 54.22% | 63.72% | +9.5 pt |
| Newly-registered domain (DomainAge) | 19.42% | 51.04% | +31.6 pt |
| IP reputation | 28.58% | 48.88% | +20.3 pt |
These categories overlap. A single malicious message is usually flagged with several at once — a scam link from a newly-registered domain impersonating a brand — so the column doesn't sum to 100%. Each figure is the share of flagged mail carrying that signal.
The two explosive movers — Scam (+48.9 points) and newly-registered-domain age (+31.6 points) — describe the same campaign pattern: attackers spinning up fresh domains in bulk and burning them on scam and impersonation runs before reputation systems catch up. That's the mechanism behind the spoof rate climbing from 18% to 32%. It also explains why DMARC enforcement alone doesn't save you: a brand-new domain impersonating you can publish a perfect DMARC record of its own. Authentication proves a sender controls a domain. It says nothing about whether that domain was registered yesterday to defraud your customers — which is why monitoring lookalike domains matters as much as enforcing your own policy.
Every email authentication decision a company makes leaves a trail in the DNS and in the message headers. Adding a DMARC record. Enforcing p=reject. Rotating DKIM keys. Upgrading TLS versions. Each of those actions writes a public fingerprint that anyone on the internet can read. We can't see inside your marketing stack, but we can see whether your engineering team bothered to secure the front door.
I spent five years on the Search team at Google working on large-scale crawling and indexing systems. One of the lessons I took away from that period: DNS records are the internet's version of a company's LinkedIn profile. They're public, they're structured, and they reveal more than people think they do. A company that publishes no DMARC record has told you something about itself, whether it meant to or not.
I run TechnologyChecker's crawling infrastructure now from Edinburgh. We scan 29.9 million active domains every month and we see DMARC, SPF, and DKIM records every single day. But DNS records only tell you what a company claims to support. They don't tell you whether the actual mail flow passes verification when it arrives at a recipient. For that, you need network-level data. So we pulled Q1 2026 email security telemetry from Cloudflare Radar, which aggregates patterns from the billions of messages processed by Cloudflare Email Security each quarter. Then we cross-referenced it against the industry's most cited third-party datasets from Valimail, Red Sift, and the Verizon 2025 Data Breach Investigations Report.
Here's what the combined data says, what it means for your deliverability, and why email authentication maturity is one of the most reliable technology sophistication signals we've ever measured.
The global numbers for Q1 2026
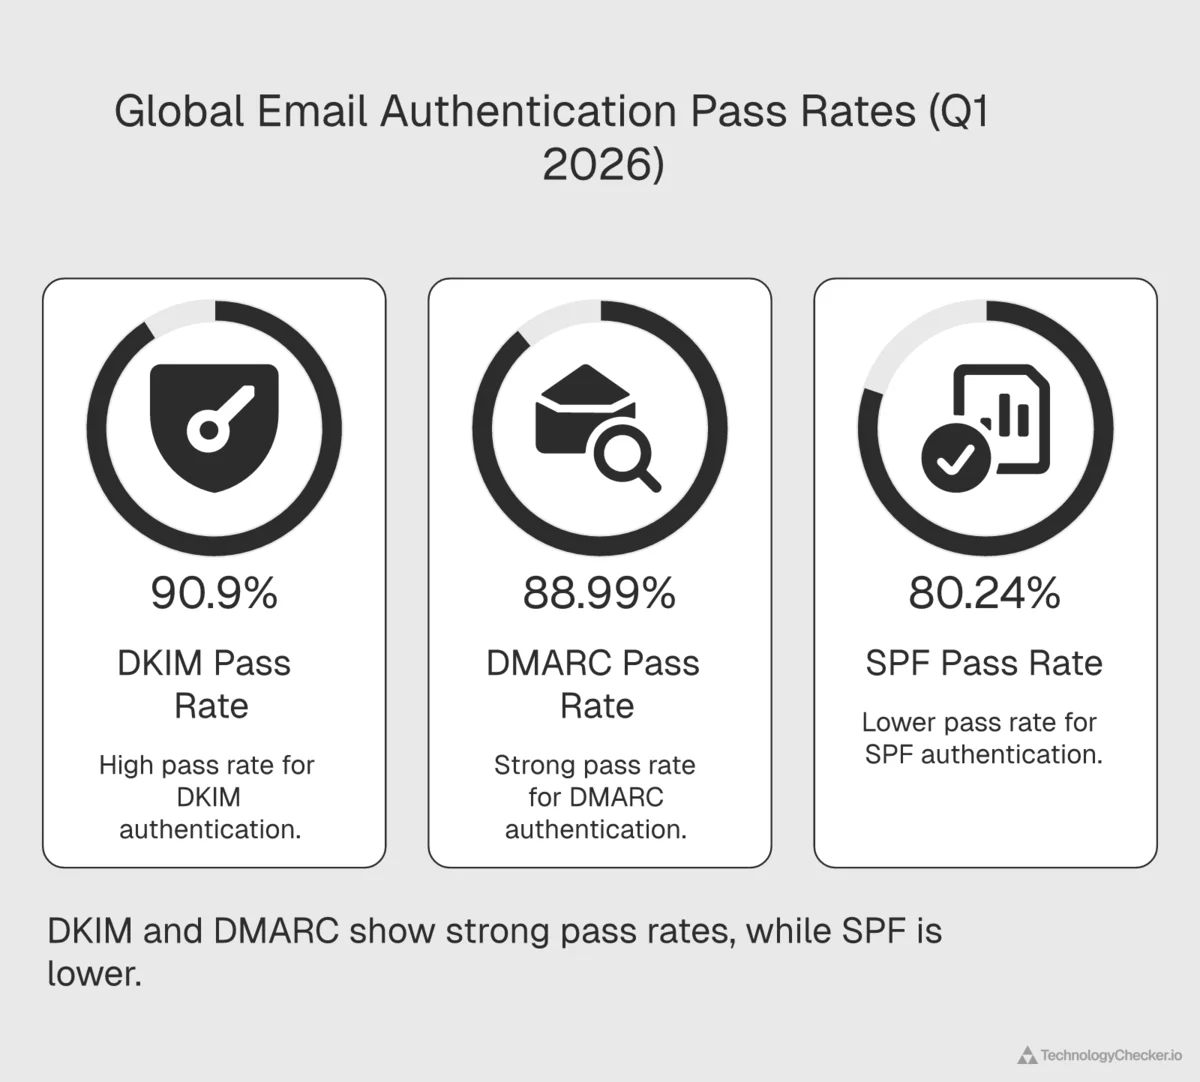
Here are the headline numbers from Cloudflare Radar for the full Q1 2026 period (January 1 through March 31, 2026):
| Protocol | PASS | FAIL | NONE | What "NONE" means |
|---|---|---|---|---|
| DMARC | 88.99% | 4.33% | 6.68% | No DMARC policy published |
| SPF | 80.24% | 14.54% | 5.23% | No SPF record published |
| DKIM | 90.90% | 1.67% | 7.43% | Message not signed with DKIM |
A few patterns jump out.
DKIM has the highest pass rate of any authentication method, beating DMARC by nearly 2 percentage points and SPF by more than 10. That's counterintuitive. Most people assume DMARC is the "strictest" protocol because it's the enforcement layer, but DMARC only passes if either SPF or DKIM passes with alignment. In practice, DKIM is doing most of the heavy lifting worldwide.
SPF fails 14.54% of the time. That's more than 3x the DMARC fail rate and nearly 9x the DKIM fail rate. SPF has a well-known structural weakness: every hop, every forwarding server, every mailing list relay can break its alignment. The numbers confirm what deliverability engineers have been saying for a decade. SPF alone is not enough, and relying on it for authentication is fragile.
And 6.68% of emails still arrive from domains with no DMARC policy at all. One in every 15 messages. Google and Yahoo have required DMARC from bulk senders since February 1, 2024, with the requirements announced jointly on October 3, 2023. The remaining long tail is either very small senders, legacy infrastructure, or organizations that simply haven't caught up.
The enforcement gap: why Cloudflare's 89% and Valimail's 42% both tell the truth
If you spend any time reading DMARC research, you'll run into an apparent contradiction. Cloudflare says 88.99% of emails pass DMARC. Valimail's 2026 State of DMARC Report says only 42% of domains with DMARC records are actually in enforcement (p=reject or p=quarantine), leaving a 36-point gap between awareness (78%) and real protection. Valimail's finding sounds catastrophic. Cloudflare's sounds rosy. Both are right. They measure different things.
Cloudflare's 88.99% is a message-weighted pass rate. It counts the share of actual emails arriving at Cloudflare-protected mailboxes that pass DMARC evaluation. The number is dominated by high-volume senders (Google Workspace, Microsoft 365, SendGrid, Mailgun, and the big transactional providers) which have had DMARC perfectly configured for years. So when you look at the volume of mail, authentication is mature. We publish the sender side of that from our own crawl: the companies that use Google Workspace we currently detect.
Valimail's 42% is a domain-weighted enforcement rate. It counts the share of DMARC-publishing domains that have set p=reject or p=quarantine. This one captures the long tail: millions of small and mid-sized companies that published a DMARC record (often because Google or Yahoo told them to) but left it at p=none, which provides monitoring and zero actual blocking. From a security posture standpoint, those domains are wide open to spoofing even though they technically "have DMARC."
In practical terms: the big senders you receive mail from are doing fine. The domains you might impersonate (competitors, suppliers, acquisition targets) are mostly not. Both realities matter, depending on whether you're thinking about your inbound security or your outbound deliverability.
Valimail's report notes that enforcement grew from 35% to 42% over the course of 2025. That's a 7-point improvement. But the report also concludes that "most domains with DMARC are not fully protected" and that the enforcement gap "represents a growing sentiment of organizations that have implemented DMARC to meet basic mailbox provider requirements but remain entirely unprotected against domain spoofing and AI-driven impersonation." That's the ceiling any mandate can hit. Google and Yahoo can force you to publish a record. They can't force you to actually enforce it.
Year-over-year: The biggest SPF jump we've ever measured
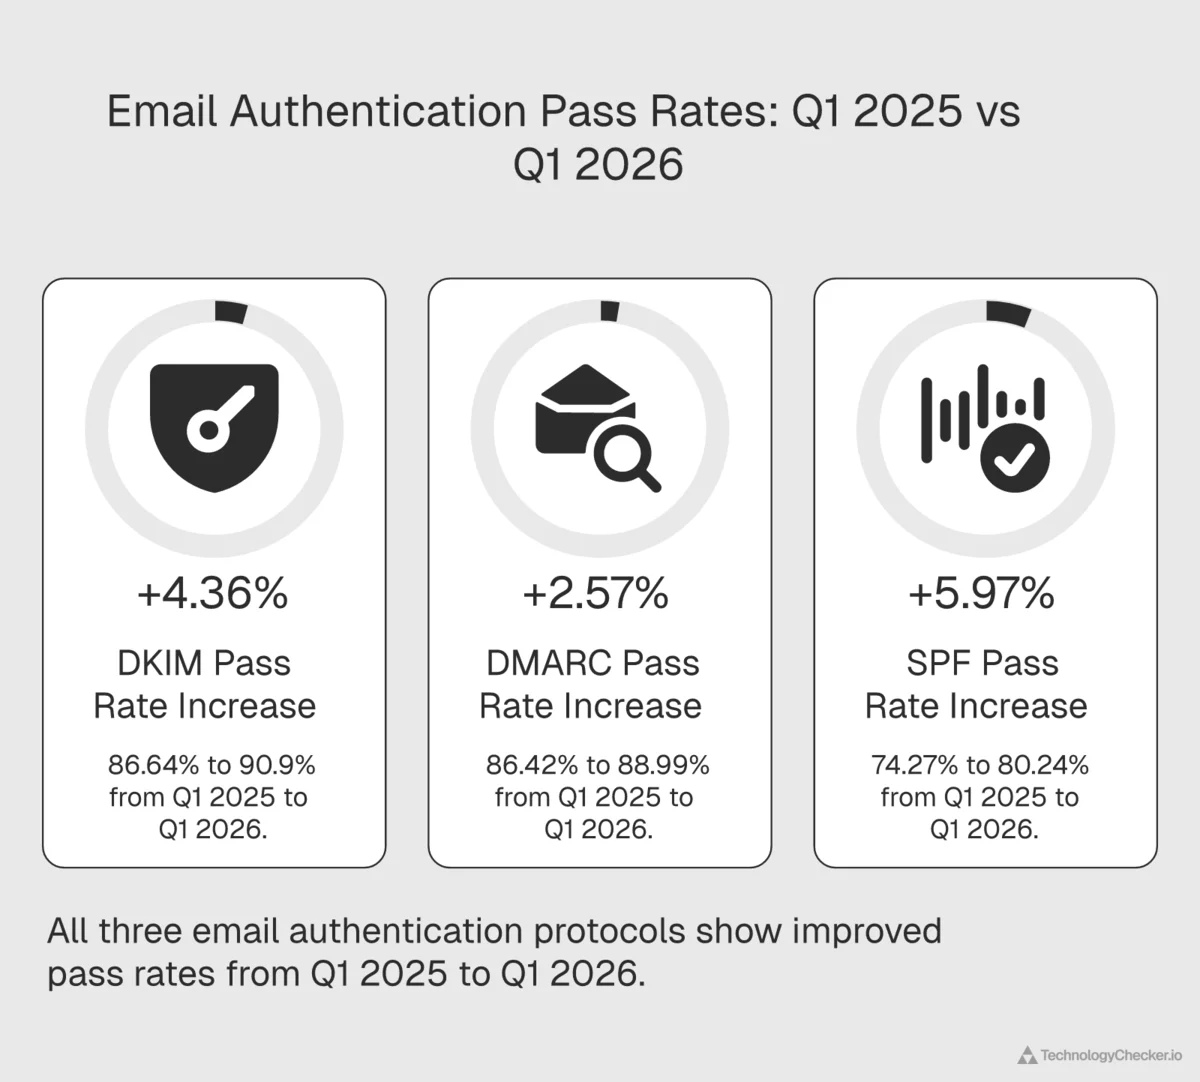
To understand how fast email authentication is maturing, we pulled the same Q1 summary for 2025 and compared it directly:
| Metric | Q1 2025 | Q1 2026 | YoY Delta |
|---|---|---|---|
| DMARC PASS | 86.42% | 88.99% | +2.58 pts |
| DMARC FAIL | 5.79% | 4.33% | −1.46 pts |
| SPF PASS | 74.27% | 80.24% | +5.97 pts |
| SPF FAIL | 20.49% | 14.54% | −5.95 pts |
| DKIM PASS | 86.64% | 90.90% | +4.26 pts |
| DKIM FAIL | 3.27% | 1.67% | −1.60 pts |
SPF had the biggest single-year improvement of any protocol. A 5.97 point jump in twelve months is extraordinary for an infrastructure metric. For comparison, IPv6 adoption has moved less than 3 points in the same window. The explanation is almost certainly the Google and Yahoo bulk sender enforcement that went into full effect during 2024 and kept tightening through 2025. Companies that were previously "soft-compliant" had to properly publish and maintain their SPF records, or their marketing and transactional email stopped landing in inboxes.
Third-party crawl data tells the same story. Red Sift reported in early 2025 that 2.3 million organizations adopted DMARC over the previous twelve months, and that the adoption rate literally doubled after the Google and Yahoo mandate came into force. EasyDMARC's 2026 Adoption Report, which analyzed 1.8 million domains alongside the Fortune 500 and Inc. 5000, tells a similar story: adoption is up sharply, but enforcement is lagging behind. Proofpoint's telemetry, which covers 2.8 trillion scanned emails across 230,000 organizations, has independently flagged 2024 to 2025 as the fastest improvement in email authentication adoption it has ever measured.
DKIM's 4.26 point jump is also remarkable. DKIM is the harder protocol to get right. It requires generating keys, publishing them in DNS, and configuring your mail server to sign outbound messages. That 90.90% global pass rate means DKIM has effectively become the default for business email, not the exception. If your outbound mail isn't DKIM-signed in 2026, you are measurably out-of-step with the rest of the internet.
DMARC's 2.58 point jump is smaller than SPF's, but more significant. DMARC is the final layer. It only matters if SPF and DKIM are already in place. A DMARC pass rate of 88.99% means the vast majority of global email has all three protocols configured and aligned. If I had to pick a single proxy for "this organization has its email infrastructure sorted," DMARC pass rate is the one I'd use.
Why SPF failures still matter, even when DMARC passes

Here's the twist that deliverability engineers understand but most marketers don't: DMARC can pass even when SPF fails, as long as DKIM passes with alignment. So you might look at that 88.99% DMARC pass rate and assume SPF failures don't really matter.
They do. Here's why.
SPF failures are visible to receiving mail servers before DMARC evaluation happens. Many spam filters weight SPF failures heavily in their scoring models regardless of the DMARC outcome. A message that passes DMARC via DKIM but fails SPF is still more likely to land in the Promotions tab or the Junk folder than a message that passes both.
SPF failures are also the leading cause of "DMARC broke my mailing list" incidents. When an employee subscribes to a mailing list with their corporate address and the list forwards messages, the forwarded copy almost always fails SPF (because the list server isn't in the sender's SPF record). If DKIM is also broken by content modification, such as footer injection or Subject rewriting, both mechanisms fail and DMARC rejects the message. This is exactly why ARC exists. And exactly why the 70.07% of emails still missing an ARC header should worry anyone running a deliverability program.
There's a third reason to care about SPF. It correlates with organizational sophistication in a way that almost no other public signal does. A company with a clean, well-maintained SPF record, proper include: directives, and fewer than 10 DNS lookups is a company where IT, marketing, and security talk to each other. A company with ?all or a broken include: chain is a company where those teams don't coordinate.
I've seen hundreds of thousands of SPF records in the course of running TechnologyChecker's crawl pipeline, and one pattern repeats relentlessly. A company adopts a new sending platform (a fresh Marketo instance, a SendGrid account for transactional mail, you pick the example) and forgets to update its SPF include: directive. Nobody notices until campaign bounce rates spike two weeks later. By that point, 40,000 messages have already landed in junk folders. It's the single most common cause of "why did our open rate drop?" incidents I've watched unfold in customer data. The opposite mistake is reading a TXT or SPF entry as the mailbox: on September 29, 2026, 110,913 domains with a Zoho entry delivered their mail to Google, Microsoft or another host, against the 362,108 domains in our list of Zoho Mail customers, where Zoho is the first stop for incoming mail.
The encryption gap: 1 in 12 emails still flows in plaintext

Email authentication is only half the story. The other half is whether the message itself is encrypted in transit. We pulled the Cloudflare Email Routing encrypted-vs-plaintext data for Q1 2026:
| Status | Q1 2025 | Q1 2026 | YoY Delta |
|---|---|---|---|
| Encrypted | 89.67% | 91.79% | +2.12 pts |
| Not encrypted | 10.33% | 8.21% | −2.12 pts |
Progress is real. The encrypted share climbed more than 2 percentage points year-over-year. But the absolute number still matters: 1 in every 12 emails flowing through Cloudflare's network in Q1 2026 was not encrypted in transit. That means the message contents, the subject line, the sender, and every recipient address traveled between mail servers in plaintext, readable by anyone with access to the network path.
This isn't unique to Cloudflare. Google's own Email Encryption in Transit Transparency Report, which publishes aggregated data for mail flowing to and from Gmail, has shown a similar long tail of unencrypted traffic for years. Regional variation ranges from near-100% TLS for mail exchanged with major EU providers down to the 70s for some emerging markets. Two independent datasets (Cloudflare's Email Security and Google's Gmail transparency data) agreeing on roughly the same encryption ceiling is about as good as cross-validation gets in this kind of research.
In 2026. Nine years after Let's Encrypt made TLS certificates free and automatic.
If you work in healthcare, finance, or legal, an 8.21% plaintext rate isn't an abstract statistic. It's a compliance risk. Every one of those unencrypted messages is a potential reportable incident under HIPAA, PCI-DSS, or GDPR.
The TLS 1.0 scandal: Deprecated protocols are still carrying your email
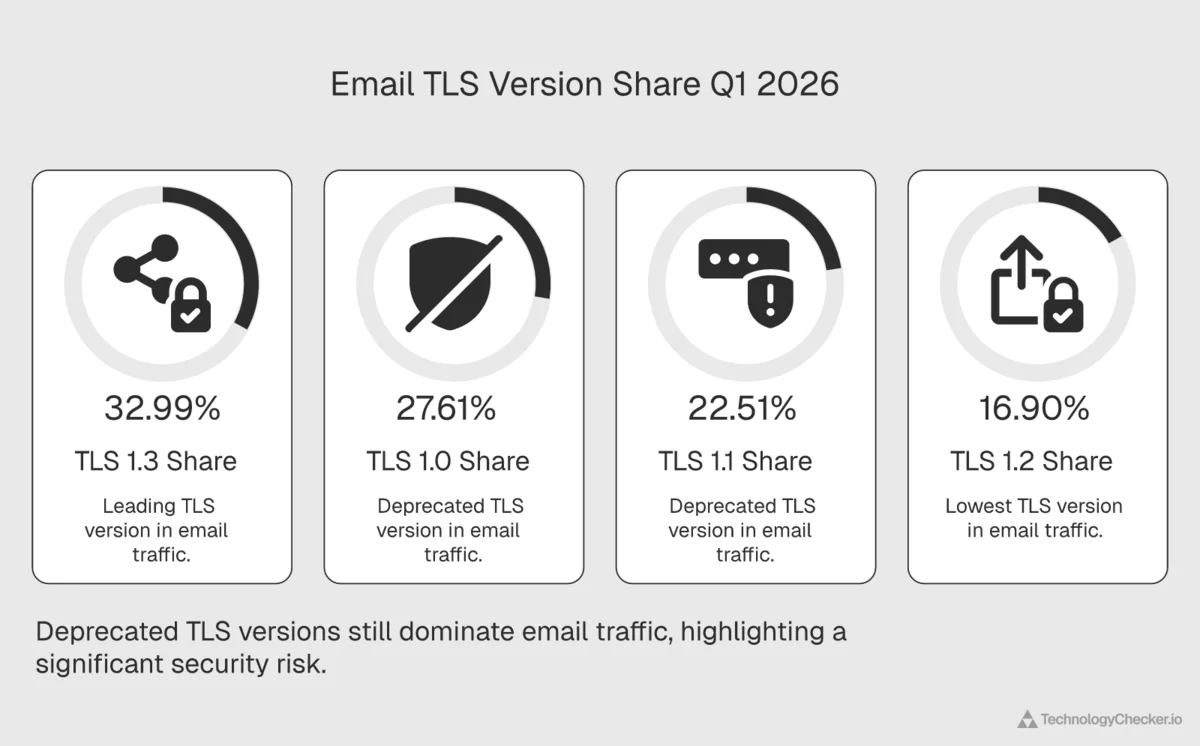
This was the most surprising finding in the entire Q1 2026 dataset, and it deserves its own section. We pulled the TLS version breakdown for all encrypted email traffic:
| TLS Version | Q1 2026 Share | IETF Status |
|---|---|---|
| TLS 1.0 | 27.61% | Deprecated March 2021 (RFC 8996) |
| TLS 1.1 | 22.51% | Deprecated March 2021 (RFC 8996) |
| TLS 1.2 | 16.90% | Still acceptable |
| TLS 1.3 | 32.99% | Modern, recommended |
Let me repeat that, because it took me two re-reads to believe it. 50.12% of encrypted email traffic in Q1 2026 is using a TLS version that was formally deprecated by the IETF in March 2021. Only 32.99% is using the modern TLS 1.3 standard, which has been around since 2018.
Some context for how strange that is. Most modern web browsers dropped TLS 1.0 and 1.1 support in 2020; if you try to visit a website using those protocols today, your browser will refuse. Major web hosts, CDNs, and API services rejected TLS 1.0 connections years ago. The PCI Security Standards Council officially prohibited TLS 1.0 for processing cardholder data on June 30, 2018, and PCI DSS has required a minimum of TLS 1.1 (TLS 1.2 strongly encouraged) for any in-scope system ever since. That was almost eight years ago.
Email is different. Because SMTP falls back to unencrypted transmission if TLS negotiation fails, mail servers have historically been reluctant to reject outdated TLS versions. The alternative is the email travels in plaintext instead. So the infrastructure silently accumulated a backlog of ancient TLS implementations nobody bothered to upgrade.
I've spent enough time in Edinburgh data centers staring at on-premises Exchange servers to know why this happens. Upgrading a mail relay isn't a weekend project. It's a political project. Some of these TLS 1.0 endpoints are running because a single downstream system (often a legacy ERP, a vendor integration, or an old scanning appliance that emails PDFs to a shared inbox) can't negotiate anything newer, and nobody wants to be the team that broke the chain to fix something that looks like it's "working fine." I've seen Fortune 500 companies push a TLS upgrade six or seven quarters in a row before it actually landed. I've seen mid-market companies solve the same problem in an afternoon. The deciding factor was rarely technical. It was almost always who had the authority to break things temporarily.
This is where email authentication maturity and email transport maturity part ways. A company can publish a p=reject DMARC record and simultaneously have an Exchange server still negotiating TLS 1.0 on port 25. The DMARC record signals sophistication. The TLS version reveals the truth.
The spoofing reality: 18.11% of inbound messages are fake

Cloudflare Radar's email security data also classifies inbound mail as either spoofed or legitimate. In Q1 2026, 18.11% of all inbound mail at Cloudflare-protected mailboxes was classified as a spoof attempt, with 81.89% as legitimate.
Roughly 1 in every 5.5 inbound emails. That number is a direct consequence of the authentication gaps we discussed earlier. Every domain without a DMARC p=reject policy is a potential impersonation target. Every fragile SPF record is an opening for a spoofer to craft a message that looks legitimate to a downstream spam filter.
The 88.99% DMARC pass rate we celebrated at the start of this post only applies to messages from domains that have DMARC configured. The 18.11% spoof rate is what happens in the gap, when attackers exploit the 6.68% of senders with no DMARC policy, or find a way around a misconfigured one.
The financial consequences of that gap aren't hypothetical. The FBI's 2024 Internet Crime Report (IC3), the most authoritative public dataset on cybercrime losses in the United States, reported $2.77 billion in Business Email Compromise losses across 21,442 incidents in 2024 alone. That makes BEC the second most profitable scam in cybercrime by reported losses. Total cybercrime losses reported to IC3 hit $16.6 billion in 2024, a 33% year-over-year increase.
The Verizon 2025 Data Breach Investigations Report puts the global BEC figure even higher, at $6.3 billion. Phishing appears in 57% of all social-engineering incidents, the median BEC loss sits at $50,000 per incident, and in 88% of confirmed BEC cases the payout was a wire transfer. In other words, the damage was typically irreversible by the time it was discovered.
Valimail, using its own monitoring network, tracked 2.53 billion suspicious emails on behalf of its customers during 2025. The company's 2026 State of DMARC Report, published February 12, 2026, explicitly ties the scale of those attacks to the enforcement gap: "most domains with DMARC are not fully protected," and attackers know it. Organizations that stop at p=none get all the mailbox-provider compliance benefits and none of the actual anti-spoofing protection.
When a prospect asks me how to quickly judge whether a supplier takes security seriously, I always give them the same advice. Check their DMARC policy, not their website copy. Not the ISO 27001 badge, not the compliance page, not the security.txt file. Pull up a terminal, run dig txt _dmarc.theirdomain.com, and read what comes back. If it's missing, or if the policy is p=none, you are looking at an organization whose security posture is mostly performance. It takes ten seconds, and it's the single most predictive public signal of whether they've actually thought about email spoofing as a real attack surface.
The ARC paradox: Why 70% of emails lose their authentication when forwarded

One last finding before we get to the implications. We pulled the ARC (Authenticated Received Chain) summary for Q1 2026:
| ARC Status | Share |
|---|---|
| NONE (no ARC header) | 70.07% |
| PASS | 29.25% |
| FAIL | 0.68% |
ARC is the protocol that lets mail forwarders, mailing lists, and intermediate relays preserve the original DMARC result even when they have to modify the message. Without ARC, a forwarded email has no reliable way to prove "this was authenticated when it originally entered the system."
70.07% of all email traffic has no ARC header. So when your email gets forwarded (by a mailing list, by a corporate mail relay, by a "forward to personal account" rule) the original authentication chain is typically lost, and the recipient's mail server has to make a best-guess call about whether to trust it.
Corporate email forwarding is a deliverability minefield for exactly this reason. It's also why your CEO's forwards@domain.com alias breaks every time marketing sends a campaign, and why the gap between authentication maturity and forwarding maturity is one of the clearest signals of how modern an email infrastructure actually is.
What email authentication maturity tells you about a company
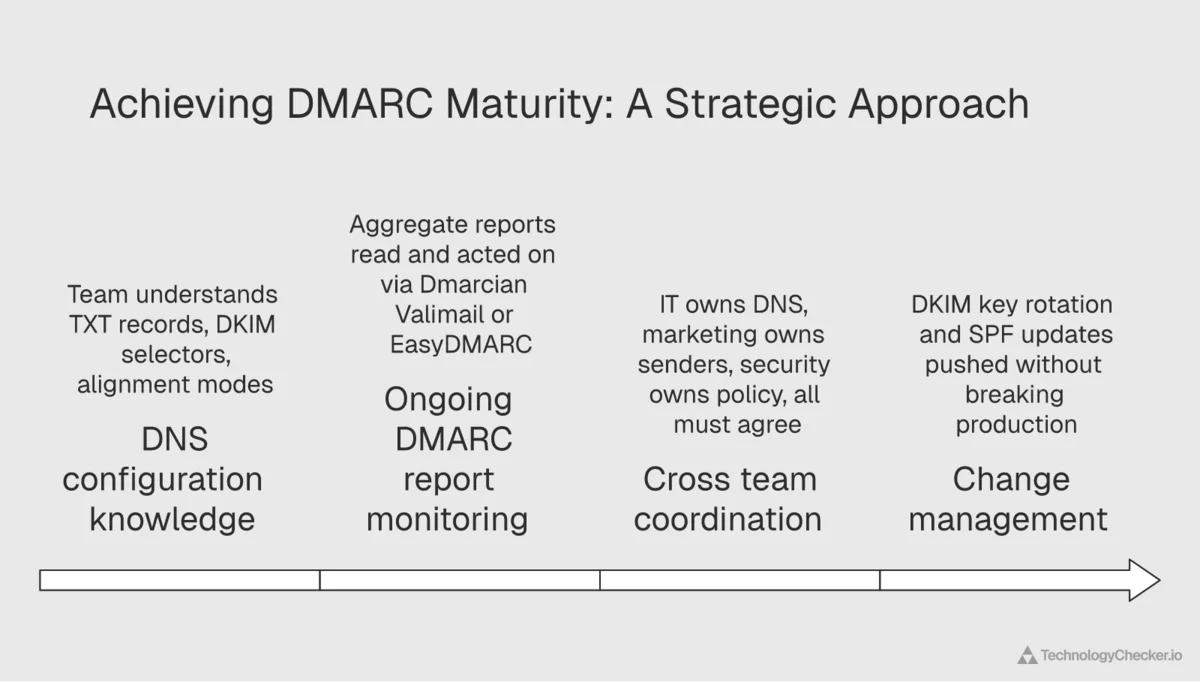
Across the 29.9 million active domains our crawlers scan every month, one pattern repeats: companies that get email authentication right almost always have modern technology stacks across the board.
That isn't a coincidence. Getting DMARC right is mostly an organizational problem, not a technical one. Someone on the team needs to understand TXT records, DKIM selectors, and alignment modes. Someone has to actually read the DMARC aggregate reports that arrive at the rua= address every day, either by hand or through a platform like Dmarcian, Valimail, or EasyDMARC. IT owns the DNS, marketing owns the sending platforms (HubSpot, Marketo, Salesforce), security owns the policies, and all three teams have to agree on what the record says. And when someone rotates a DKIM key or adds a new sender to SPF, somebody else has to remember to update the DNS without breaking production.
Organizations that can pull all that off consistently also tend to have mature technology operations everywhere else. They run modern CRMs. They have real analytics infrastructure. They've built DevOps pipelines. They have the kind of internal alignment that lets them ship technology changes without breaking things.
Organizations that can't? They have v=spf1 ?all records, unsigned DKIM, no DMARC policy, and when we look at the rest of their stack, we usually find an outdated CRM, no marketing automation, and a website built on tech from five years ago.
Email authentication isn't the cause of technology sophistication. It's a symptom of it. But because the symptom is publicly visible in DNS and measurable at scale, it's one of the most reliable signals we've found.
What this means for B2B email outreach teams
If your team does outbound email (sales prospecting, marketing campaigns, account-based outreach) the Q1 2026 data has practical implications.
-
Assume your recipients are enforcing DMARC. With 88.99% global DMARC pass rates and Google and Yahoo both mandating compliance for bulk senders, treat strict DMARC enforcement as the default. Your own SPF, DKIM, and DMARC configuration has to be perfect. No
?allsoft-fails, no missing DKIM signatures, no mismatched alignment. -
Don't rely on SPF alone. The 14.54% global SPF failure rate tells you SPF is fragile. Every forwarding server, mailing list, or relay can break it. If you're not DKIM-signing every outbound message, you're one misconfigured relay away from your deliverability collapsing.
-
Audit your TLS versions. The 50% of email still using TLS 1.0 or 1.1 is both a risk and an opportunity. If your mail server is among them, upgrade now. Modern receiving infrastructure increasingly flags deprecated TLS as suspicious. If your recipients' servers are among them, assume message contents are more exposed than you think.
-
Use email authentication as a qualification signal. A prospect with no DMARC record, a broken SPF chain, or a mail server still accepting TLS 1.0 has immature infrastructure. That's a quality signal for your lead scoring. It's positive for some ICPs (teams selling email security solutions) and negative for others (teams selling enterprise software that needs technical maturity to implement).
-
Don't over-index on BIMI alone. Brand Indicators for Message Identification is the standard that puts your company logo next to authenticated messages in Gmail, Apple Mail, and Yahoo. It technically requires a DMARC policy at
p=quarantineorp=reject, which should make it a fantastic trust signal. The problem is scale. Valimail's 2026 report found BIMI adoption stalled at just 4% globally, meaning the vast majority of legitimately authenticated senders aren't even using it yet. Seeing a BIMI logo is a positive signal. Not seeing one tells you almost nothing. -
Don't forget the human element. The Verizon 2025 DBIR found that nearly 60% of breaches involve a human element (error, manipulation, or misuse). Perfect email authentication doesn't eliminate phishing. It just forces attackers into channels where the human on the keyboard is the final line of defense. That's why the most mature email security programs pair technical authentication (DMARC, SPF, DKIM, ARC) with phishing simulation training. Technology and awareness are complements, not substitutes.
From a single DMARC signal to a full technology profile
Email authentication maturity is one visible signal of how sophisticated a company's technology operations are. It's the tip of the iceberg. Companies that implement DMARC, SPF, and DKIM correctly almost always have modern marketing stacks (HubSpot, Marketo, Salesforce), real analytics infrastructure (Segment, Mixpanel), and mature DevOps practices.
That's the kind of correlated technology signal TechnologyChecker is built to detect. We monitor over 40,000 technologies across 29.9 million active domains, and for every domain in the database we can tell you not just whether they have DMARC, but what's behind it. What marketing automation platform they use. What analytics stack runs on their website. What CRM sits behind their contact forms. What CDN fronts their application. Which authentication vendors they trust.
For sales teams, that means you can go beyond "does this company have DMARC?" to "what does their entire technology stack look like, and who's the decision-maker for each layer?" For marketing teams, your ideal customer profile can be a stack rather than a firmographic guess. For revenue operations, every prospect comes with a technographic fingerprint that explains which of your solutions will fit.
If you want to see the entire technology profile for any domain, you can start with a free lookup at TechnologyChecker.io.
A closing thought, from someone who has been reading DNS records at scale for the better part of a decade. Email authentication maturity is a bit like a good single malt. You can tell a surprising amount about the distillery from a single glass. You don't need to tour the whole operation to know whether they're cutting corners. A DMARC record with proper alignment, a clean SPF include: chain, DKIM signatures that actually verify, TLS 1.3 on the inbound MX. That combination is rare enough that when you see it, you know you're dealing with an engineering culture that takes the invisible stuff seriously. The invisible stuff is usually where the real quality hides.
Methodology and data sources
Primary (first-party) data
All percentages attributed to "Q1 2026" in this post are computed from Cloudflare Radar's email security dataset for the Q1 2026 period (January 1 through March 31, 2026). Year-over-year comparisons are pulled from the identical Q1 2025 window. The data reflects messages processed by Cloudflare Email Security, which handles a substantial share of global business email traffic, so the numbers are representative of real-world inbound mail rather than a sample of published DNS records.
Specific Cloudflare Radar dimensions used:
summary/dmarc,summary/spf,summary/dkim— global pass/fail/none distributionssummary/tlsVersion— encrypted transport version breakdownsummary/spoof,summary/arc— spoofing classification and ARC header presencesummary/spam,summary/malicious,summary/threatCategory— inbound threat classification and detection-signal breakdownsummary/encrypted(from Cloudflare Email Routing) — encrypted vs plaintext transit ratestimeseriesGroups/dmarc— 90-day daily trend data used for directional analysis
All percentages are rounded to two decimal places. "Deprecated" TLS versions refers to RFC 8996, which formally deprecated TLS 1.0 and 1.1 in March 2021. The threatCategory figures are reported by Cloudflare as overlapping percentages (a single message can match multiple categories), so they describe the share of flagged mail carrying each signal rather than a partition that sums to 100%.
June 2026 refresh
This update re-pulled every email-security dimension above for the full month of May 2026 and added month-by-month snapshots for January through May 2026 (each computed over its own calendar-month window) to expose the trajectory that quarter averages hide. The Q1 2026 figures throughout the post are retained unchanged as the published historical baseline; the May data and the month-by-month tables are layered on top. We attempted a per-TLD (top sending domains) breakdown as a sector/geography proxy, but the top/tlds endpoint returned a server-side error on every request during this refresh, so we published the threatCategory breakdown instead rather than a cut we could not verify. Cloudflare's pass rates are message-weighted (dominated by high-volume senders), which is why a single month's pass rate can fall while domain-level adoption — better tracked by the falling "NONE" rate and by third-party domain-weighted enforcement reports — continues to improve.
July 2026 refresh (Q2 close plus year-over-year)
The Q2-close section at the top of this post re-pulled every email/security/summary/* and email/routing/summary/* dimension over three full calendar-quarter windows: Q2 2025 (April 1 to June 30, 2025), Q1 2026, and Q2 2026 (April 1 to June 30, 2026). Every quarterly figure is compared like-for-like. All of these summary endpoints return PERCENTAGE-normalized shares directly (the threat_category endpoint returns OVERLAPPED_PERCENTAGE, where a message can carry multiple signals), so no manual share computation was needed. The full-quarter numbers run calmer than the single-month May pull the June refresh reported (Q2 spoof 24.30% vs May's 31.64%; Q2 deprecated TLS 51.13% vs May's 56.45%; Q2 DMARC pass 87.53% vs May's 85.61%), which is the quarter-average-beats-one-month point the June update made, now demonstrated against a full year rather than asserted.
The most-abused-TLD table uses the one net-new segmentation the API actually supports here: email/security/top/tlds honors a dmarc=FAIL filter (and an arc= filter) but silently ignores malicious=, spoof=, spam=, and encrypted=; those return the baseline sending list unchanged. So rather than present a "biggest senders" list dressed up as "most-abused," we segmented failing mail by TLD and computed each TLD's over-representation against its baseline sending share. The top/tlds endpoint that erred out during the June refresh now resolves cleanly.
August 2026 refresh (July data, plus a revision check)
The July section at the top of this post re-pulled every email/security/summary/* and email/routing/summary/* dimension over three windows: July 2025 (July 1 to 31, 2025), June 2026, and July 2026. July 2025 gives this post its first like-for-like monthly year-over-year comparison, which is a cleaner read than the quarter-versus-quarter view the July refresh used, because it removes the seasonal mix a quarter average bakes in. Every figure in that section is labelled with its window, and no July figure is compared against a Q2 quarter figure as though the two were points on one trend.
Normalization was checked before any figure was computed. The summary/* endpoints return PERCENTAGE shares directly; summary/threat_category returns OVERLAPPED_PERCENTAGE, where one message can carry several signals, so those figures describe the share of flagged mail carrying each signal rather than a partition summing to 100%.
On the revision check. This refresh re-pulled months we had already published, because a parallel review of Cloudflare's certificate transparency data found that series had been revised after publication. Email security shows the same behaviour, though more mildly. Re-querying the identical calendar month returns May 2026 at 84.78% DMARC pass and 9.31% fail, against the 85.61% and 8.79% this post published on June 1. March and April also moved. The direction of every conclusion we drew from May is unchanged, but the figures are not identical to what we printed, and we have annotated the affected passages in place rather than silently swapping the numbers. The practical rule we now apply to this dataset, and recommend to anyone citing it: treat any email-security figure for a month that closed inside the last several weeks as provisional. That includes July's own numbers above.
The most-abused-TLD table carries one further caveat this refresh surfaced. At the Q2 close .vg was the second-largest source of DMARC-failing mail at 11.39%, and we reported that as a rotation in which a small offshore TLD had taken the "most-abused" title from .net. in July 2026 .vg doesn't appear in the top eight at all, while .net is back at 13.10% of failing mail, up from 9.72% across Q2. So the rotation reversed inside a month, which means what read as a spoofing wave was a short campaign rather than a change in where abusive mail originates. If you keyed a blocklist or a suspicion score on that finding, this is the correction. The general lesson is the one this whole refresh keeps repeating: a single window's ranking is a state reading, not a trend. Source: Cloudflare Radar — radar/email/security/top/tlds with dmarc=FAIL, July 2026 and Q2 2026 windows, pulled 2026-08-01.
October 2026 refresh (Q3 data)
The Q3 2026 sections re-pulled every email/security/summary/* and email/routing/summary/* dimension used in this post for three calendar quarters (Q3 2025, Q2 2026, Q3 2026) and for every month from September 2025 to September 2026. The IPv6 split uses email/routing/summary/encrypted with ipVersion=ipv4 and ipVersion=ipv6; an invalid value returns error 2001, so the filter is applied rather than ignored. Mailbox-provider rules were checked at Google's, Yahoo's and Microsoft's own pages on 1 October 2026.
Third-party sources cross-referenced in this analysis
- Valimail 2026 State of DMARC Report (published February 12, 2026): 78% awareness vs. 42% enforcement gap, 2.53B suspicious emails tracked in 2025, 4% BIMI adoption, industry enforcement ranges.
- Red Sift / EasyDMARC 2026 Adoption Report: 2.3 million organizations adopted DMARC year-over-year, 14.9% of 73.3M sampled domains at p=none minimum, 2.5% (~1.8M) at p=reject, regional enforcement rates.
- EasyDMARC 2026 DMARC Adoption & Enforcement Report: analysis of 1.8M domains alongside Fortune 500 and Inc. 5000.
- FBI 2024 Internet Crime Report (IC3): $2.77B in BEC losses across 21,442 incidents in 2024, $16.6B total cybercrime losses, 33% YoY increase.
- Verizon 2025 Data Breach Investigations Report (DBIR): $6.3B in BEC losses, $50K median, 88% wire transfer, 57% phishing in social engineering, 60% of breaches involve human element.
- Proofpoint 2024-2025 Email Threat Analysis: telemetry covering 2.8 trillion scanned emails across 230,000 organizations.
- Dmarcian: Understanding Gmail and Yahoo DMARC Requirements: timeline and scope of the October 2023 announcement and the February 2024 enforcement start.
- Google Email Encryption in Transit Transparency Report: corroborating public dataset on Gmail TLS encryption rates.
- PCI Security Standards Council: Migrating from SSL and Early TLS: June 30, 2018 deadline for TLS 1.0 deprecation under PCI DSS v3.2.
Update history
Added a Q3 2026 analysis, a January-to-September monthly table, an answer on whether DMARC is mandatory, and a split of routed email by IP version: in September, IPv6 mail was 44.26% encrypted against 91.95% over IPv4, which explains most of the fall in encryption in transit. DMARC pass averaged 89.12% and SPF fail 16.00% in Q3. Re-pulled July and August reproduced within 0.05 points except the TLS version split.
SPF fail reached 15.73% and the title changed, grading the July prediction that a bad month would
force it. Sized a large Cloudflare revision across email/security/*: June spoof fell 8.74 points
(23.56% to 14.82%) and June malicious 9.26 points, which moves the spoof wave's break from July to June.
Confirmed the revision is recent-window only, since July 2025 reproduces to two decimals, and that
email/routing/* did not move at all. Encryption in transit fell again to 76.03% and is no longer
being reported as provisional.
Updated September 3, 2026 with August data. The September stamp says when we refreshed; the data below covers August 2026. Two things happened this month, and the second one matters more than the first.
The small one: this post's title changed. SPF now fails on 15.73% of messages, and the headline had been carrying 14.5% since Q1. Last month I wrote that SPF fail was "volatile enough that a bad month would force the title to change" and that July hadn't done it. August did.
The large one: Cloudflare has revised the spoofing and malicious-mail figures this post has built its threat narrative on since the Q2 close, and the revisions are big. June spoof was published here at 23.56% and now reads 14.82%. June malicious was 18.99% and now reads 9.73%. July moved too. A month that closed twelve months ago reproduces to two decimals, so this is the recent-window revision behaviour, not a rewrite of history — but it lands squarely on the months we were narrating. The corrected series says the spoof wave broke in June, a month earlier and more sharply than we reported, and that spoof has since returned to the same 14–15% band it occupied in late 2025 rather than settling at a new higher baseline. Malicious mail is the metric that genuinely did not come back down: 10.39% in August against 5.88% a year ago.
Updated August 1, 2026 with July data. The August stamp says when we refreshed; the data below covers July 2026, one closed calendar month, read against June 2026 and against July 2025 like for like. Three things moved. DMARC pass climbed to 89.37%, its best month since February, while mail from domains publishing no policy at all fell to 5.44%. The hostile-inbound trend the Q2 update called "the new baseline" broke: spoof attempts fell from 23.56% in June to 17.67%, and malicious-classified mail from 18.99% to 12.91%, the sharpest one-month drops in anything we've pulled. Encryption in transit kept sliding, to 80.77%, down 13.65 points on July 2025. Two corrections also came out of this pass: Cloudflare has revised three months we published, and the .vg spoofing wave we reported at the Q2 close turns out to have been a single month. Both are documented below.
Updated July 2, 2026 for the Q2 close. We re-pulled every Cloudflare Radar email-security dimension for the full second quarter and added the first year-over-year layer this post has carried. The one-line version: adoption kept improving (DMARC "NONE" fell to 5.70%, its lowest in our record), but the inbound threat environment got materially worse over the year. Spoof attempts doubled to 24.30% of inbound mail, malicious-classified mail tripled to 18.74%, and the "Scam" detection signal went from a 1.78% rounding error a year ago to 58.01% of flagged mail. Transport security slipped on both axes: encryption in transit fell to 88.16% and deprecated TLS climbed to 51.13%. The full Q2 scorecard, a year-over-year read on the most-abused sending TLDs, and the three June predictions now settled are in the next section.
Want to see the full technology stack behind any company's email authentication setup? TechnologyChecker.io scans 29.9 million active domains monthly and detects over 40,000 technologies, including which DMARC processors, email security vendors, CRM platforms, and marketing automation tools each company relies on. Start a free lookup to see a complete technographic profile.

CTO
15+ years of experience
David is the CTO of TechnologyChecker, responsible for the engineering and architecture behind the platform's crawling infrastructure.
- MEng Computer Science, University of Edinburgh
- AWS Solutions Architect Professional
- Contributor, Open Source Crawling Frameworks
Never miss our research