Salesforce Statistics: Trends, Insights and Salesforce Market Share 2026
We analyzed 36,143 Salesforce domains and 27,256 companies to reveal market share, migration trends, and company adoption data for 2026.
Published •Updated •53 min read
Salesforce generated $41.5 billion in FY2026 revenue, holds 20.7% of the global CRM market according to IDC (earning $21.6B in CRM revenue alone — more than Microsoft, Oracle, Adobe, and SAP combined), and our analysis of 36,143 domains with Salesforce web-facing components reveals that 31.4% of those deployments belong to companies with 10 or fewer employees. This report breaks down the complete Salesforce statistics picture for 2026, from financial performance to migration patterns across 27,256 enriched companies.
As the Product Marketing Manager at TechnologyChecker.io, I've spent the past quarter leading our research team in analyzing over 36,143 domains running Salesforce CRM web components. The goal: build the most detailed, data-backed picture of Salesforce in 2026. Our analysis combines direct platform detection data, LinkedIn company enrichment across 27,256 businesses, and third-party analytics to surface intelligence you won't find elsewhere.
This report draws from multiple sources: TechnologyChecker's proprietary domain scanning infrastructure, Salesforce's official FY2026 earnings, Gartner CRM market share reports, and aggregated G2 reviews. For live market share data, migration trends, and company-level intelligence, visit our Salesforce technology profile.
What you'll learn in this report:
- Salesforce revenue growth and FY2026 financial performance
- CRM market share and competitive positioning in 2026
- Who actually uses Salesforce: company size, industry, and geography breakdowns
- Customer migration patterns and churn signals
- Technology stack overlap data for 27,256 Salesforce companies
- Actionable recommendations based on real detection data
Executive Summary: Key Findings from Our 2026 Analysis

After analyzing tens of thousands of data points across the Salesforce ecosystem, one thing is clear: Salesforce isn't slowing down. The company's FY2026 earnings show record revenue, and our independent detection data confirms broad adoption across industries and company sizes. Here's what the numbers say.
Critical Salesforce Statistics at a Glance
- $41.5 billion FY2026 revenue, up 10% year-over-year, including $399 million from the Informatica acquisition
- $37.9 billion FY2025 revenue, with $12.4 billion in free cash flow (+31% YoY) and 33% non-GAAP operating margin
- $900 million Data Cloud & AI ARR, up 120% YoY — Salesforce's fastest-growing product line
- 36,143 active domains with Salesforce web-facing components in our tracking database
- 27,256 companies analyzed through LinkedIn enrichment, giving us a detailed company-level view
- 31.4% of detected companies have 1-10 employees, challenging the "enterprise-only" narrative
- 274 companies switched TO Salesforce from Workday, versus 136 switching the other way (a 2:1 ratio)
- Notable customers detected: TCS, IBM, Samsung, McDonald's, Bank of America, FedEx, Siemens, Shell
What does this mean in practice? Salesforce continues to dominate the CRM market by every financial measure. But our web detection data adds a layer most reports miss: the platform's public web footprint is surprisingly weighted toward smaller companies, and the migration math favors Salesforce on most fronts. If you're making a CRM decision in 2026, this data should factor into your evaluation.
Methodology: How We Conducted This Analysis
Data Sources
- TechnologyChecker.io proprietary detection — Our crawlers scan 29.6 million domains monthly, detecting Salesforce web components including Experience Cloud portals, Pardot tracking pixels, Service Cloud chat widgets, and Salesforce-hosted subdomains. This yielded 36,143 domains with active Salesforce CRM signals.
- LinkedIn company enrichment — For 27,256 of those domains, we matched them to LinkedIn company profiles to extract industry, employee count, founding year, country, and city data.
- Official Salesforce filings — Revenue, employee count, and forward guidance come from Salesforce's SEC filings and quarterly earnings reports.
- IDC market share data — CRM market share figures come from IDC's 2025 Worldwide Semiannual Software Tracker, the industry standard for CRM vendor rankings. Market size forecasts reference Precedence Research, Fortune Business Insights, Grand View Research, and Mordor Intelligence.
- G2 review aggregation — User sentiment data is drawn from over 18,000 G2 review mentions for Salesforce Sales Cloud.
- Cloudflare Radar — Global AI-crawler traffic, domain-popularity ranking, and agent-readiness signals come from Cloudflare Radar, refreshed for the 28 days ending June 9, 2026. We use this to place Salesforce's Agentforce push in the context of internet-wide AI-agent adoption.
Detection Methodology
Our system detects Salesforce through HTTP headers, JavaScript library fingerprints, DNS records, and HTML patterns. We track both currently active and previously detected domains, giving us migration and churn signals over time.
Limitations to Consider
- Web detection vs. total customer base: Salesforce reports 150,000+ customers globally. Our 36,143 figure tracks web-facing components only. Most Salesforce deployments run entirely behind login screens with no public web footprint. Our data captures the tip of the iceberg, not the full customer base.
- Web-facing market share (0.42%) vs. actual CRM market share (20.7%): Our JSON shows a 0.42% web-facing detection share in the CRM category. This is because server-side CRM platforms like Salesforce are inherently harder to detect than client-side widget tools like Bitrix24 or vcita. Salesforce's real CRM market share is 20.7% globally per IDC's 2025 Worldwide Semiannual Software Tracker, with $21.6 billion in CRM-specific revenue. We'll use both figures throughout this report and clearly label which is which.
- Employee counts come from LinkedIn and may lag actual headcount by 6-12 months.
- Historical domain data before 2015 uses DNS heuristics for approximation.
Part 1: Salesforce Revenue and Financial Performance

Salesforce's financial trajectory tells a story of sustained growth with improving profitability. Let's look at the actual numbers.
FY2026 Full Year Results
According to Salesforce's official Q4 FY2026 earnings release, the company delivered record results:
| Metric | FY2026 | FY2025 | Change |
|---|---|---|---|
| Total Revenue | $41.5 billion | $37.9 billion | +10% YoY |
| Q4 Revenue | $11.2 billion | — | +12% YoY |
| Informatica Contribution | $399 million | — | New |
| Subscription Revenue Growth | ~10% | ~8.7% | Accelerating |
The $41.5 billion figure includes $399 million from the Informatica acquisition, which closed during FY2026. Strip that out and organic growth still landed around 9%, which is respectable for a company of this size.
FY2025 Full Year Results: The Profitability Breakout
FY2025 (ending January 2025) was the year Salesforce proved it could deliver both growth and profitability at scale. According to Salesforce's official FY2025 earnings release:
| Metric | FY2025 | FY2024 | Change |
|---|---|---|---|
| Total Revenue | $37.9 billion | $34.9 billion | +9% YoY |
| Subscription & Support Revenue | $35.7 billion | — | +10% YoY |
| GAAP Operating Income | $7.2 billion | — | — |
| GAAP Operating Margin | 19.0% | — | — |
| Non-GAAP Operating Margin | 33.0% | — | — |
| Net Income | $6.2 billion | — | — |
| GAAP Diluted EPS | $6.36 | — | — |
| Non-GAAP Diluted EPS | $10.20 | — | — |
| Operating Cash Flow | $13.1 billion | — | +28% YoY |
| Free Cash Flow | $12.4 billion | — | +31% YoY |
Those free cash flow numbers are staggering. $12.4 billion in free cash flow — up 31% year-over-year — means Salesforce is now generating more cash than most enterprise software companies earn in total revenue. For context, that's more free cash flow than Adobe, ServiceNow, and Workday combined.
Q4 FY2025 alone delivered $10.0 billion in revenue (up 8% YoY), with GAAP operating margin of 18.2% and non-GAAP operating margin of 33.1%.
Balance Sheet and Capital Returns
| Metric | Value | Context |
|---|---|---|
| Cash & Equivalents | $8.85 billion | Strong liquidity position |
| Total RPO | $63.4 billion | +11% YoY — contracted future revenue |
| Current RPO | $30.2 billion | +9% YoY — revenue expected within 12 months |
| Share Repurchases (FY2025) | $7.8 billion | Aggressive buyback program |
| Dividends (FY2025) | $1.5 billion | — |
| Total Returned to Shareholders | $9.3 billion | $21B since program inception |
The $63.4 billion in remaining performance obligation (RPO) is a forward indicator that gets overlooked. It represents contracted revenue that hasn't been recognized yet — essentially Salesforce's backlog. Growing at 11% YoY, it tells you that customers aren't just renewing but expanding their commitments.
As Marc Benioff, CEO, stated: "No company is positioned to lead customers through the digital labor revolution like we are." Amy Weaver, President and CFO, added: "Our capital return program delivered $21 billion in value to shareholders since inception."
AI and Data Cloud: The Growth Catalyst
The FY2025 earnings also revealed Salesforce's fastest-growing product metrics:
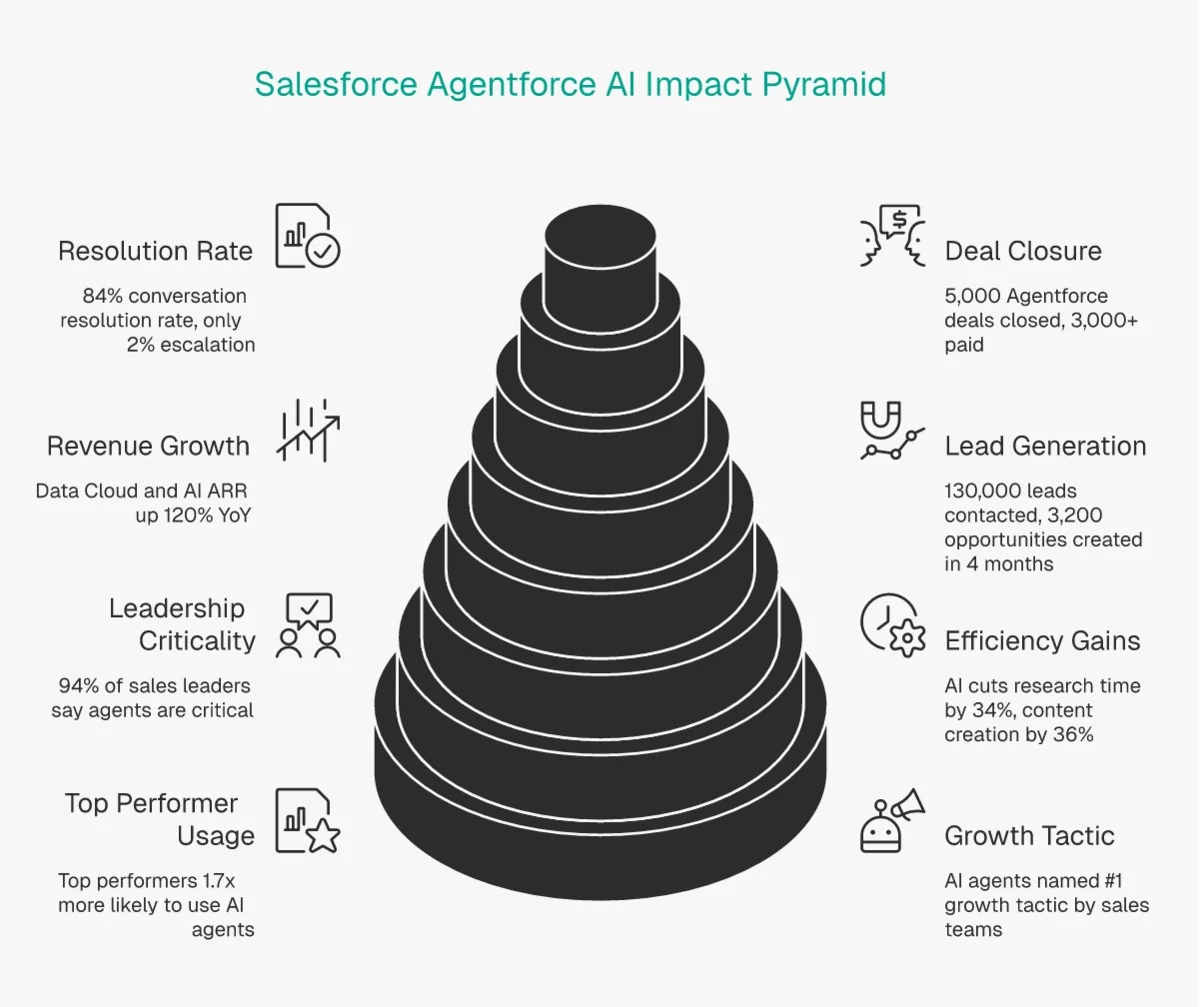
- Data Cloud & AI ARR: $900 million, up 120% year-over-year
- Agentforce deals closed (since October 2024 launch): 5,000 total, with 3,000+ paid
- Data Cloud records processed: 50+ trillion, doubled year-over-year
- Fortune 100 penetration: Nearly 50% are now AI & Data Cloud customers
- Agentforce on help.salesforce.com: 380,000 conversations handled, 84% resolution rate, only 2% escalation to human agents
That 84% AI resolution rate is the stat that should get your attention. If Salesforce's own support operation can deflect 84% of conversations with Agentforce, the ROI case for AI agents in customer-facing workflows is already proven at production scale.
Revenue Growth Over the Past Decade
Here's the full growth trajectory showing how Salesforce scaled from $5B to $41B+ in a decade:
| Fiscal Year | Annual Revenue | YoY Growth | Context |
|---|---|---|---|
| FY2015 | ~$5.4 billion | — | Pre-acquisition era |
| FY2018 | ~$10.5 billion | ~25% | Crossed $10B milestone |
| FY2020 | ~$17.1 billion | ~29% | Pre-pandemic momentum |
| FY2022 | ~$26.5 billion | ~25% | Post-Slack acquisition |
| FY2024 | ~$34.9 billion | ~11% | Growth normalization |
| FY2025 | $37.9 billion | +9% | Profitability pivot — 33% non-GAAP margin, $12.4B FCF |
| FY2026 | $41.5 billion | +10% | Agentforce ramp-up |
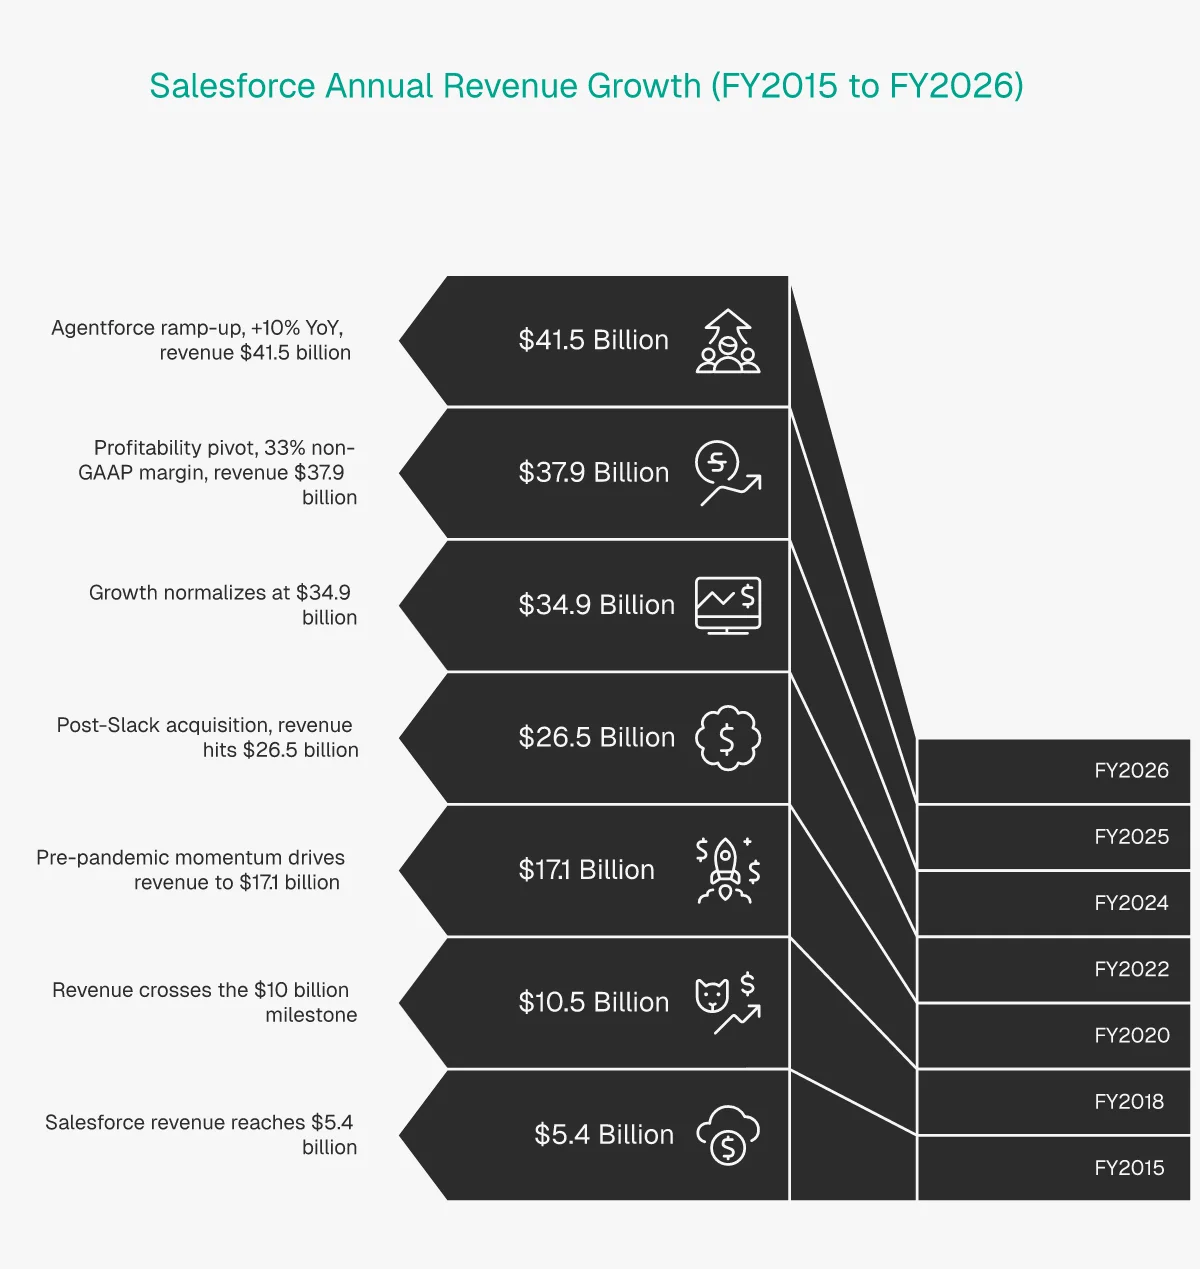
The pattern here is worth noting. Salesforce's hyper-growth years (25-30% YoY) are behind it, but the company has shifted toward sustained double-digit growth with much stronger margins. FY2025's 33% non-GAAP operating margin and $12.4 billion in free cash flow would have been unthinkable even two years prior. That shift matters for customers: it signals a platform focused on deepening value rather than land-grabbing at all costs.
Profitability Pivot: The Margin Story
The revenue numbers only tell half the story. Between 2022 and 2026, Salesforce underwent a significant profitability transformation. In early 2023, activist investor pressure led to workforce reductions and a renewed focus on operating margins. The FY2025 results are the clearest proof that the pivot worked: GAAP operating margin hit 19%, non-GAAP hit 33%, and free cash flow surged 31%.
Subscription and support revenue at $35.7 billion (FY2025) makes up 94% of total revenue and grew 10% YoY — faster than the overall 9% revenue growth. This is the healthy pattern for a SaaS company: recurring subscription revenue is higher-margin and more predictable than one-time consulting fees. For CRM buyers, this means Salesforce is investing in product capabilities (self-service, AI automation, low-code configuration) that reduce your dependence on expensive implementation consultants.
Quarterly Revenue Trajectory
The quarterly numbers reveal seasonality and acceleration patterns worth understanding:
| Quarter | Revenue | YoY Growth | Key Driver |
|---|---|---|---|
| Q1 FY2026 | ~$9.8B | ~9% | Organic subscription growth |
| Q2 FY2026 | ~$10.0B | ~9% | Steady enterprise renewals |
| Q3 FY2026 | ~$10.5B | ~10% | Agentforce GA + Informatica |
| Q4 FY2026 | $11.2B | +12% | Year-end enterprise deals + AI upsells |
Q4 at $11.2 billion and 12% growth is the standout. Year-end is always Salesforce's strongest quarter as enterprise contracts close before fiscal year boundaries, but the 12% growth rate exceeded consensus analyst expectations. The Agentforce general availability release in late 2025 contributed meaningfully to new deal sizes as companies bundled AI capabilities into their renewals.
Why This Matters for CRM Buyers
Revenue growth correlates directly with R&D investment. Salesforce is pouring billions into AI (Agentforce, Einstein), data integration (Informatica), and platform capabilities. If you're evaluating CRMs and worried about long-term platform investment, Salesforce's financials are the strongest signal of continued product development. According to Reuters, Salesforce also guided for continued double-digit growth into FY2027, which means the investment pipeline isn't slowing.
The company's shift toward profitability also reduces a common buyer concern: that Salesforce is a "growth at all costs" company that might deprioritize product stability. That narrative no longer holds. Salesforce in 2026 is a mature, profitable enterprise software company with $41.5 billion in revenue and expanding margins. Your CRM investment is on stable ground.
Part 2: Salesforce's CRM Market Position in 2026
Salesforce's market position requires two different lenses: its actual CRM market share based on industry research, and its web-facing detection footprint in our data. Both tell a useful story.
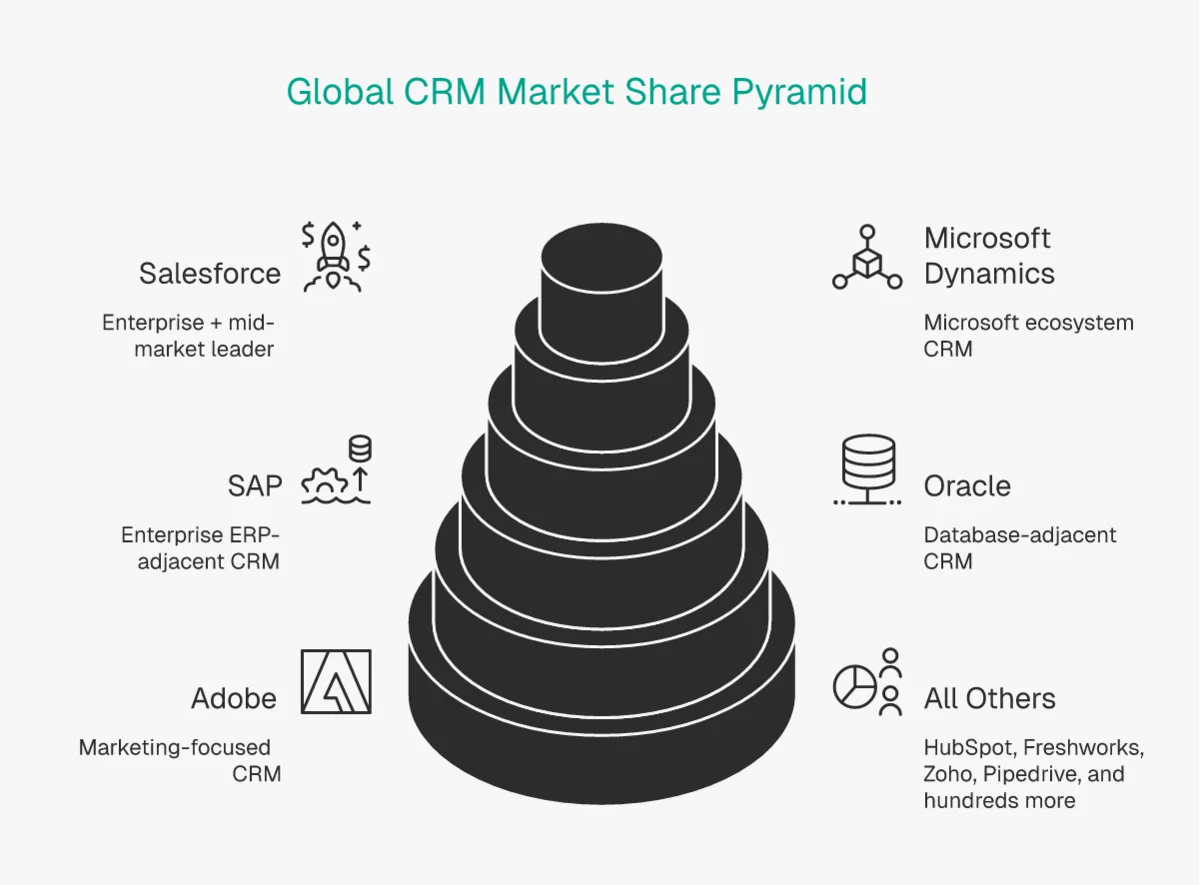
Global CRM Market Share (IDC 2024 Data)
According to IDC's 2025 Worldwide Semiannual Software Tracker, Salesforce held a 20.7% share of the global CRM market in 2024 — earning over $21.6 billion in CRM-specific revenue. That's more than Microsoft, Oracle, Adobe, and SAP combined. IDC has ranked Salesforce the #1 CRM provider for 12 consecutive years.
It's worth noting that Salesforce's share dipped from 21.7% in the prior year to 20.7%. Not because Salesforce shrank — CRM revenue actually grew 9.5% — but because the overall CRM market expanded 12.8%. Smaller vendors collectively gained ground, though no single challenger has broken past the ~5% mark.
| CRM Vendor | 2024 Market Share | CRM Revenue (2024) | Positioning |
|---|---|---|---|
| Salesforce | 20.7% | $21.6B | Enterprise + mid-market leader |
| Microsoft Dynamics | ~5.2% | ~$5.45B | Enterprise, Microsoft ecosystem |
| Oracle | ~4.4% | — | Enterprise, database-adjacent |
| SAP | ~3.5% | — | Enterprise ERP-adjacent |
| Adobe | ~3.4% | — | Marketing-focused CRM |
| All Others | ~62.8% | — | Highly fragmented |
Source: IDC's 2025 Worldwide Semiannual Software Tracker
Sub-Category and Regional Dominance
IDC's data goes deeper than the headline number. Salesforce is also ranked #1 in:
- Sales — for the 13th consecutive year
- Customer Service — for the 12th consecutive year
- Marketing — for the 6th consecutive year
Regionally, Salesforce claims the top position in North America, Latin America, Western Europe, and Asia-Pacific (including Japan). There isn't a major market or CRM sub-category where Salesforce doesn't lead.
What 20.7% Actually Means
That 20.7% share might sound modest until you realize the CRM market is a $90+ billion industry. Salesforce's $21.6 billion CRM revenue exceeds its four closest competitors combined — Microsoft at $5.45 billion is almost four times smaller. The fragmentation of the "All Others" segment, which includes HubSpot, Zoho CRM, Freshworks, and hundreds of niche players, actually reinforces Salesforce's dominance. As CX Today reported, no single vendor in that fragmented group exceeds 3% market share individually.
Web-Facing Detection: A Different View
Our TechnologyChecker detection data shows a different picture because of how CRM technology works. Most Salesforce deployments run entirely server-side. We detect web-facing components like Experience Cloud portals, Pardot tracking pixels, and embedded chat widgets.
| CRM Platform | Web-Detected Domains | Web Detection Share | Why This Number |
|---|---|---|---|
| Bitrix24 | 23,128 | 19.22% | Heavy client-side widget usage |
| vcita | 12,034 | 10.00% | Embeds scheduling widgets |
| RentCafe | 5,602 | 4.65% | Property listing portals |
| Zoho CRM | 4,456 | 3.70% | Web forms and chat widgets |
| Salesforce CRM | 36,143 | 0.42% | Mostly server-side deployment |
| ConnectWise | 3,077 | 2.56% | IT service portals |
The 0.42% web detection share doesn't reflect Salesforce's market strength. It reflects the architecture: Salesforce runs behind logins, while platforms like Bitrix24 and vcita inject visible widgets on public websites. Think of our web detection data as capturing Salesforce's public-facing surface area, not its total deployment footprint.
For an independent read on Salesforce's raw web prominence, salesforce.com ranks inside the top 1,000 most-visited domains worldwide in Cloudflare Radar's June 2026 domain ranking — a traffic-popularity signal that sits entirely outside our CRM detection and corroborates the brand's reach.
The takeaway: Use Gartner/IDC market share figures for competitive positioning analysis. Use our web detection data for understanding which companies have public-facing Salesforce components you can identify and target.
CRM Market Size and Growth Forecast
The global CRM market is one of the fastest-growing segments in enterprise software. Here's what the leading research firms project:
| Source | 2025 Market Size | Projected Size | CAGR | Timeframe |
|---|---|---|---|---|
| Precedence Research | $90.1B | $304B | 12.9% | 2026-2035 |
| Fortune Business Insights | $112.9B | $321B | 12.4% | 2026-2034 |
| Grand View Research | — | $163.2B | 14.6% | 2025-2030 |
| Mordor Intelligence | — | $128.9B | 7.9% | 2026-2031 |
The range in these forecasts ($128B to $321B) reflects different market definitions — some include CRM-adjacent categories like customer data platforms and marketing automation, while others stick to core CRM. The consensus: double-digit growth through at least 2030.
Salesforce's total FY2026 revenue of $41.5 billion represents not just the largest CRM vendor, but one controlling roughly a fifth of the entire market. Microsoft Dynamics, the closest named competitor, generates around $5.45 billion in CRM-specific revenue — almost 4x less than Salesforce.
The fragmented "All Others" category at ~63% is misleading at first glance. It includes hundreds of vendors: HubSpot (increasingly competitive in the mid-market), Freshworks (targeting price-sensitive buyers), Creatio (strong in low-code), Pipedrive (SMB-focused), and countless vertical-specific CRMs for industries like real estate, healthcare, and financial services. No single vendor in this group exceeds 3% market share individually, which explains why Salesforce's position remains durable despite the "Salesforce alternative" narrative.
The Share Erosion Question
Here's the nuance most Salesforce statistics articles miss: Salesforce's CRM market share actually declined from 21.7% to 20.7% year-over-year, even as its CRM revenue grew 9.5%. The market itself grew 12.8%. This means smaller vendors — collectively — are eating into the percentage gap, even though none individually threatens Salesforce's lead.
For sales teams using technographic data to target CRM buyers, this market fragmentation is an opportunity. Companies running smaller CRM platforms are potential upgrade candidates, and our Salesforce technology profile tracks exactly those migration patterns.
Part 3: Historical Growth Trends
Our detection database goes back to 2005, giving us nearly 20 years of Salesforce web-component adoption data. The growth curve is not linear, and the inflection points tell an interesting story.
Web Detection Growth: 2005-2025
| Period | Active Domains | Change from Previous | Notable Context |
|---|---|---|---|
| Jul 2005 | 2 | Baseline | First detected |
| Jan 2010 | 146 | +7,200% (5yr) | Early enterprise adoption |
| Jan 2015 | 606 | +315% (5yr) | Force.com/Community Cloud era |
| Jan 2017 | 918 | +51% (2yr) | Lightning Experience launch |
| Jan 2019 | 1,476 | +61% (2yr) | Pre-pandemic baseline |
| Jan 2020 | 1,910 | +29% (1yr) | Pandemic onset |
| Jan 2021 | 3,100 | +62% (1yr) | Digital transformation surge |
| Jan 2022 | 4,508 | +45% (1yr) | Post-Slack acquisition |
| Jan 2023 | 6,188 | +37% (1yr) | Steady enterprise growth |
| Jan 2024 | 8,152 | +32% (1yr) | Pre-spike baseline |
| Dec 2024 | 30,211 | +271% (11mo) | All-time peak |
| Jan 2025 | 28,733 | -5% (1mo) | Holiday normalization |
| Jul 2025 | 25,863 | -10% (6mo) | Current state |
Key Insights from Historical Data
1. The 2024 explosion: 8,152 to 30,211 active domains in one year
This is the most dramatic growth spike in Salesforce's web detection history. Active domains nearly quadrupled during 2024. The likely driver: Salesforce's aggressive push of Experience Cloud, Agentforce web components, and expanded Pardot/Marketing Cloud tracking. Many companies that previously kept Salesforce entirely behind logins started deploying public-facing portals and AI-powered chat widgets.
2. The pandemic accelerator (2020-2021): +62% in a single year
Active domains jumped from 1,910 to 3,100 between January 2020 and January 2021. Digital transformation wasn't just a buzzword during COVID. Companies that had been slow to adopt CRM technology were forced into rapid deployment, and Salesforce captured a significant share of that urgency. As we noted in our CRM switching analysis, pandemic-era decisions often happened on compressed timelines.
3. Current trajectory: stabilizing after the 2024 peak
The decline from 30,211 (December 2024) to 25,863 (July 2025) looks concerning at first glance. But context matters. December numbers typically spike due to year-end portal launches and marketing campaigns. The current 25,863 active domains still represent a 217% increase over January 2024's 8,152. The plateau likely reflects a normalization, not a retreat.
Year-Over-Year Growth Rate Trends
Let's calculate the annual growth rates from our January snapshots to see the acceleration and deceleration pattern clearly:
| Period | Jan Active Domains | YoY Growth Rate | Phase |
|---|---|---|---|
| 2015 to 2017 | 606 → 918 | +51% (2yr) | Steady early growth |
| 2017 to 2019 | 918 → 1,476 | +61% (2yr) | Lightning Experience adoption |
| 2019 to 2020 | 1,476 → 1,910 | +29% | Pre-pandemic baseline |
| 2020 to 2021 | 1,910 → 3,100 | +62% | Pandemic digital rush |
| 2021 to 2022 | 3,100 → 4,508 | +45% | Post-Slack momentum |
| 2022 to 2023 | 4,508 → 6,188 | +37% | Steady enterprise growth |
| 2023 to 2024 | 6,188 → 8,152 | +32% | Organic growth |
| 2024 to 2025 | 8,152 → 28,733 | +252% | Agentforce + Experience Cloud surge |
The 252% jump from January 2024 to January 2025 is an outlier. Nothing in Salesforce's prior history even approaches this growth rate. Two factors explain it: first, Salesforce's aggressive push of Experience Cloud portals as a digital engagement strategy for enterprises; second, Agentforce's launch in late 2024 created a wave of AI-powered web components (chatbots, lead qualification widgets, service agents) that our crawlers detect as new Salesforce instances.
The question is whether this growth sustains. The pullback to 25,863 in July 2025 suggests some of the late-2024 deployments were experimental or seasonal. But even if the count stabilizes around 25,000-26,000, that's still triple the January 2024 baseline. The structural shift is real, even if the peak was inflated by short-term factors.
Total Domains vs. Active Domains
One subtle data point: in July 2025, total domains (25,863) equals active domains (25,863). Earlier periods showed a persistent gap between the two (for example, December 2024 had 30,211 active vs. 33,509 total). This convergence suggests the cleanup of legacy and abandoned Salesforce deployments has caught up with current detections. In practical terms, the current active count is a cleaner, more reliable number than the peak.
Part 4: Who Actually Uses Salesforce? (Company Analysis)

At TechnologyChecker.io, we went beyond surface-level salesforce statistics. Using our proprietary technology detection system combined with LinkedIn company data enrichment, we analyzed 27,256 Salesforce domains to understand the real businesses behind the installations. You can explore the full dataset on our Salesforce technology profile page.
Company Size Distribution
| Employee Range | Company Count | Percentage | What This Tells Us |
|---|---|---|---|
| 1-10 employees | 8,435 | 31.38% | Largest segment: micro-businesses |
| 11-50 employees | 5,791 | 21.54% | Growing small businesses |
| 51-200 employees | 5,926 | 22.05% | Mid-market sweet spot |
| 201-500 employees | 2,316 | 8.62% | Upper mid-market |
| 501-1,000 employees | 1,380 | 5.13% | Lower enterprise |
| 1,001-5,000 employees | 1,836 | 6.83% | Mid-enterprise |
| 5,001-10,000 employees | 447 | 1.66% | Large enterprise |
| 10,001+ employees | 748 | 2.78% | Global enterprises |
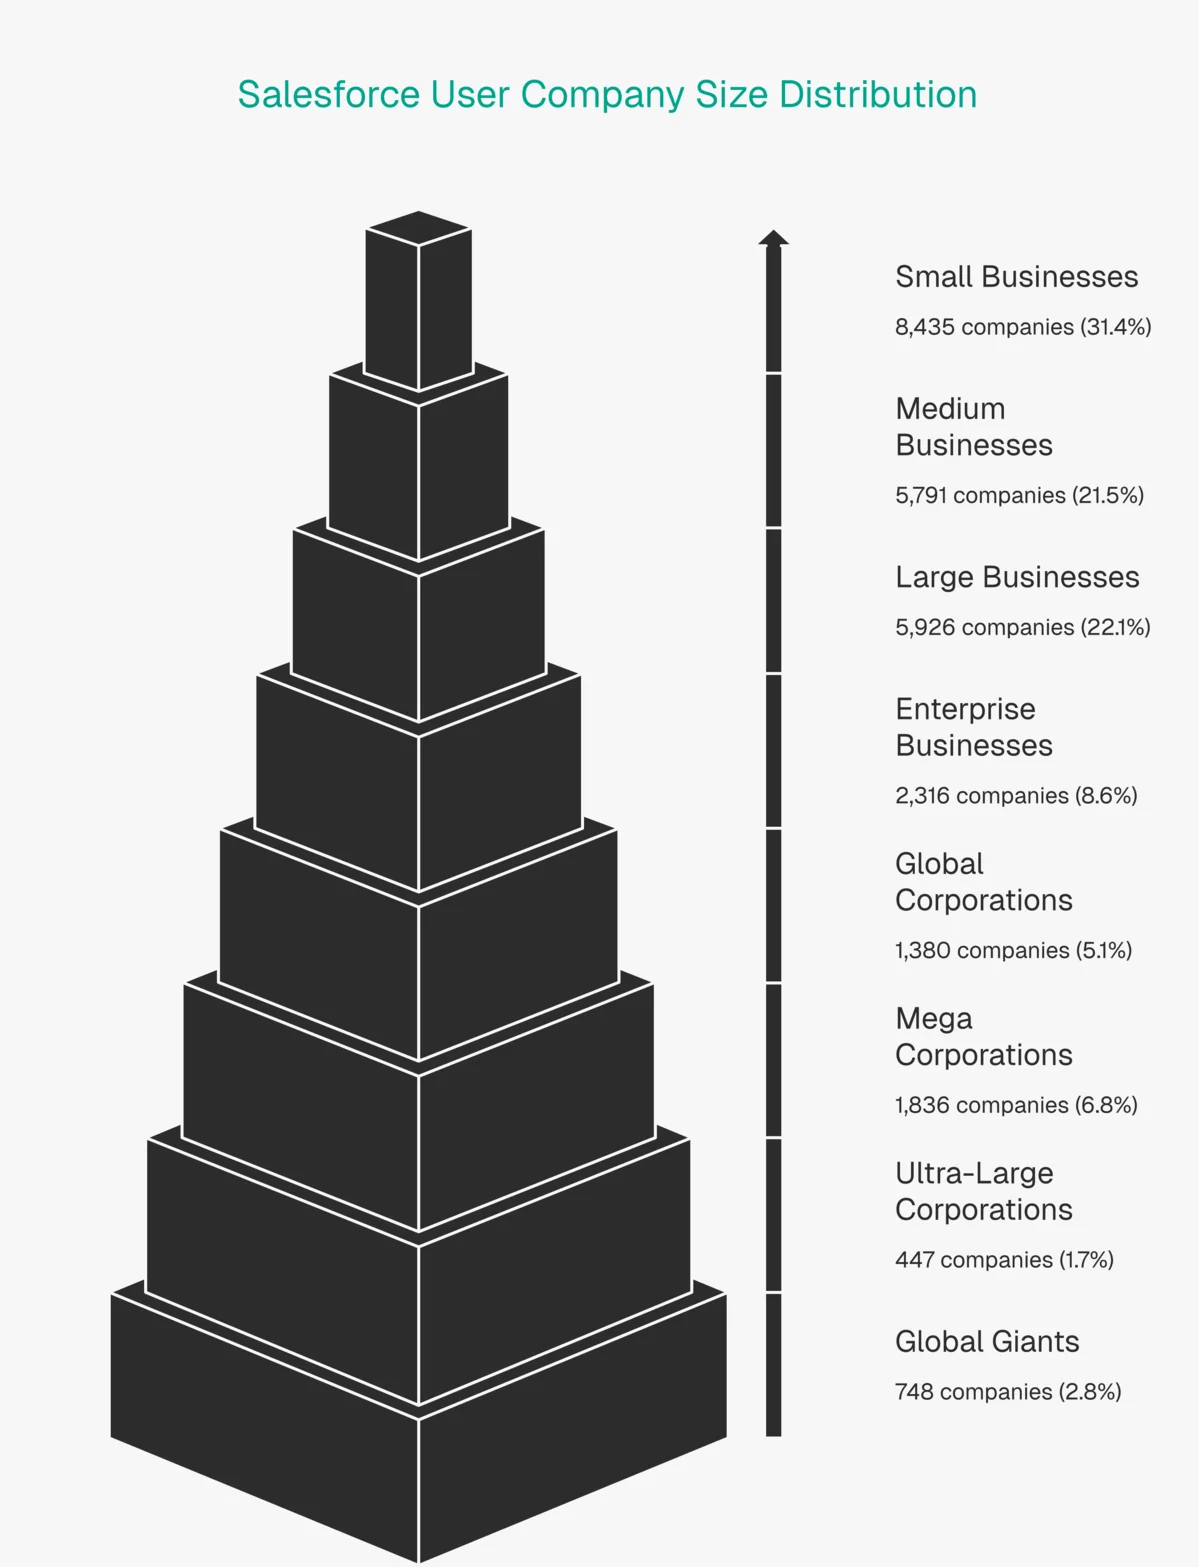
The surprise: Nearly a third of all detected Salesforce deployments belong to companies with 10 or fewer employees. That challenges the conventional wisdom that Salesforce is "too expensive" or "too complex" for small businesses. Salesforce's Starter Suite at $25/user/month has clearly found traction.
But don't overlook the mid-market. Companies with 51-200 employees make up 22.05%, practically tied with the 1-10 segment. This is the sweet spot where companies are large enough to need a proper CRM but small enough that Salesforce's out-of-box features are sufficient without heavy customization.
The 2.78% enterprise segment (10,001+ employees) is small by percentage but includes global brands like IBM, TCS, Accenture, and Samsung. Their presence validates the platform for mid-market buyers doing competitive due diligence.
Industry Distribution
| Rank | Industry | Company Count | Percentage |
|---|---|---|---|
| 1 | Software Development | 2,617 | 10.09% |
| 2 | IT Services and IT Consulting | 1,946 | 7.50% |
| 3 | Financial Services | 1,622 | 6.25% |
| 4 | Technology, Information and Internet | 843 | 3.25% |
| 5 | Business Consulting and Services | 745 | 2.87% |
| 6 | Real Estate | 596 | 2.30% |
| 7 | Advertising Services | 565 | 2.18% |
| 8 | Hospitals and Health Care | 535 | 2.06% |
| 9 | Non-profit Organizations | 529 | 2.04% |
| 10 | Construction | 514 | 1.98% |
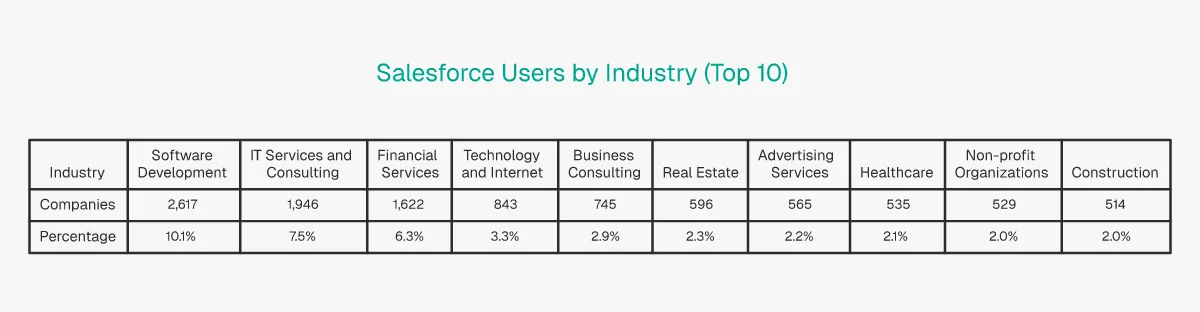
No single industry exceeds 11%, and that's actually a strength signal. Salesforce is a genuinely horizontal platform. The tech-heavy skew in the top three (Software Development, IT Services, Technology) reflects the fact that tech companies are more likely to deploy web-facing CRM components. Financial Services at 6.25% includes major names like Bank of America, JP Morgan Chase, and Citigroup from our detected companies list.
Healthcare (2.06%) and Non-profit (2.04%) are worth highlighting. Both industries have specific compliance requirements (HIPAA, nonprofit pricing), and Salesforce has tailored offerings for each. Our marketing automation market share report found similar cross-industry patterns for adjacent platforms.
Geographic Distribution
| Rank | Country | Company Count | Percentage |
|---|---|---|---|
| 1 | United States | 15,432 | 57.6% |
| 2 | United Kingdom | 1,735 | 6.5% |
| 3 | Canada | 1,001 | 3.7% |
| 4 | Germany | 787 | 2.9% |
| 5 | France | 573 | 2.1% |
| 6 | Australia | 544 | 2.0% |
| 7 | India | 528 | 2.0% |
| 8 | Spain | 517 | 1.9% |
| 9 | Japan | 439 | 1.6% |
| 10 | Italy | 337 | 1.3% |
| 11 | Switzerland | 283 | 1.1% |
| 12 | Netherlands | 273 | 1.0% |
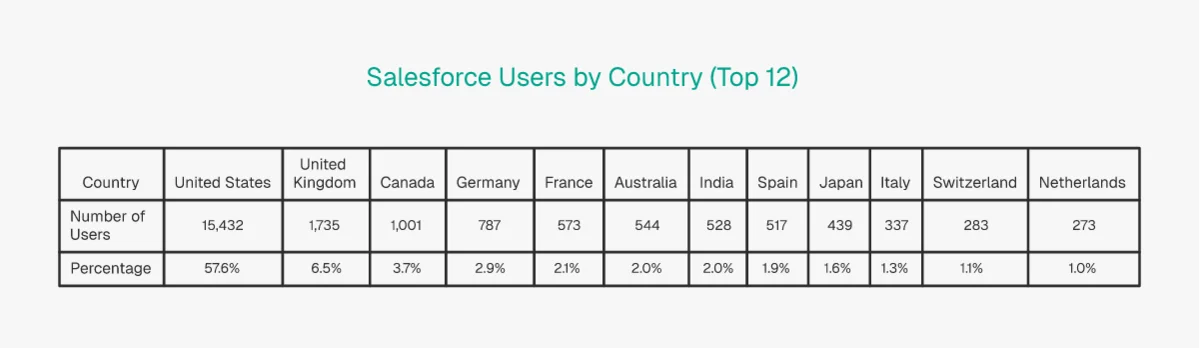
The US dominates with 57.6% of detected web deployments. That's expected given Salesforce's San Francisco headquarters and its historical strength in the American market. But the European presence is notable: the UK, Germany, France, Spain, Italy, Switzerland, and the Netherlands together account for roughly 17% of detected domains. That's a real foothold.
India at 2.0% might seem low, but it includes major IT services firms like TCS, Infosys, Wipro, and HCLTech, which are Salesforce implementation partners with massive Salesforce deployments of their own.
Company Age Analysis
| Founding Decade | Company Count | Percentage | Profile |
|---|---|---|---|
| 2010s | 6,658 | 31.84% | Cloud-native startups and scale-ups |
| 2000s | 4,347 | 20.79% | Web-era businesses |
| 1990s | 2,609 | 12.48% | Dot-com survivors |
| Pre-1960 | 2,034 | 9.73% | Legacy enterprises |
| 2020s | 1,977 | 9.45% | Post-pandemic founders |
| 1980s | 1,683 | 8.05% | Established mid-market |
| 1970s | 984 | 4.71% | Industrial-era companies |
| 1960s | 619 | 2.96% | Traditional corporates |
Companies founded in the 2010s make up the largest segment at 31.84%. This makes sense: the 2010s were Salesforce's aggressive growth decade, and companies born in the cloud era naturally gravitated toward cloud CRM. The Pre-1960 segment at 9.73% includes legacy enterprises like Siemens (1847), Shell (1833), and GE (1892), proving that even the oldest companies find value in Salesforce's web-facing products.
Ideal Customer Profile
Based on our enrichment analysis, the typical Salesforce CRM customer looks like this:
| Attribute | Value |
|---|---|
| Company Size | 1-10 employees |
| Location | US, UK, or Canada |
| City | New York, Mumbai, London, Chicago |
| Founded | 2010-2019 |
| Company Age | ~7-15 years old |
This ICP data is gold for sales teams. If you're selling to Salesforce users (consulting, integrations, complementary tools), your best prospects are small, relatively young companies in major metros across the English-speaking world plus India. For a deeper look at how to use this kind of technographic data in your outreach, our technology lookup software industry statistics report covers the methodology.
Cross-Referencing Size, Industry, and Geography
When you overlay the size, industry, and geography data, a clearer picture of the Salesforce customer emerges. The "typical" detected Salesforce company is a 1-50 person software or IT services company in the US, founded in the 2010s. That's Salesforce's bread-and-butter web footprint.
But the high-value segment looks different. The 748 companies with 10,001+ employees are disproportionately in IT Services, Financial Services, and Professional Services. They're headquartered in the US, UK, India, and Germany. These companies generate the majority of Salesforce's subscription revenue even though they represent less than 3% of detected domains.
For B2B sales teams, this creates two distinct prospecting strategies:
- Volume play: Target the 1-50 employee segment (52.92% of all companies) with mid-ticket offerings. These businesses are accessible, make decisions quickly, and are concentrated in Software Development and IT Services.
- Enterprise play: Target the 1,001+ employee segment (11.27% of all companies) with high-ticket solutions. These are longer sales cycles but dramatically higher deal values, and they're clustered in Financial Services, IT Consulting, and Professional Services.
The Shopify analytics report we published showed a similar bifurcation in the e-commerce space. Platform data consistently reveals that the "average" customer profile and the "high-value" customer profile are very different animals.
Part 5: Customer Migration Trends

Understanding migration patterns tells you more about platform satisfaction than any marketing claim. Our detection data tracks when domains add or remove Salesforce web components over time, giving us real switching signals.
Switching TO Salesforce (Where They Came From)
| Platform | Total Switches | Last 1 Year | Last 3 Years | Last 5 Years |
|---|---|---|---|---|
| Workday | 274 | 97 | 203 | 263 |
| Zoho CRM | 57 | 17 | 33 | 46 |
| vcita | 47 | 4 | 10 | 20 |
| ConnectWise | 32 | 13 | 32 | 32 |
| Bitrix24 | 20 | 3 | 10 | 17 |
The Workday-to-Salesforce flow is by far the largest migration corridor: 274 total switches, with 97 happening in the last year alone. This likely reflects companies consolidating their tech stacks. Workday is primarily an HR/finance platform, and many organizations decide to bring customer-facing operations under Salesforce's umbrella rather than stretching Workday beyond its core strength.
Zoho CRM's 57 total switches suggest a "graduate to Salesforce" pattern. Companies start with Zoho's lower-cost CRM and migrate to Salesforce when they hit scale or need deeper customization. This aligns with what we see in Zoho's pricing-conscious customer base.
Switching FROM Salesforce (Where They Went)
| Platform | Total Switches | Last 1 Year | Last 3 Years | Last 5 Years |
|---|---|---|---|---|
| Workday | 136 | 46 | 93 | 120 |
| Zoho CRM | 88 | 54 | 62 | 84 |
| ConnectWise | 51 | 7 | 48 | 49 |
| Bitrix24 | 13 | 5 | 7 | 10 |
| vcita | 8 | 2 | 4 | 5 |
Here's the interesting part. Zoho CRM receives more companies FROM Salesforce (88) than it sends TO Salesforce (57). That's a net loss for Salesforce on the Zoho corridor. The last 1-year number is even more skewed: 54 companies switched from Salesforce to Zoho in the past year, versus only 17 going the other direction. Zoho's aggressive pricing and improved feature set are clearly pulling cost-sensitive customers away.
ConnectWise also shows a net outflow from Salesforce (51 outbound vs. 32 inbound), suggesting some IT services companies find ConnectWise's specialized PSA/RMM tools a better fit than Salesforce's general-purpose CRM.
Net Migration Analysis
The math:
- Total switched TO Salesforce (all time): 430 domains
- Total switched FROM Salesforce (all time): 296 domains
- Net gain: +134 domains (1.45:1 ratio in favor of Salesforce)
By platform:
| Platform | To Salesforce | From Salesforce | Net | Ratio |
|---|---|---|---|---|
| Workday | 274 | 136 | +138 | 2.01:1 |
| Zoho CRM | 57 | 88 | -31 | 0.65:1 |
| vcita | 47 | 8 | +39 | 5.88:1 |
| ConnectWise | 32 | 51 | -19 | 0.63:1 |
| Bitrix24 | 20 | 13 | +7 | 1.54:1 |
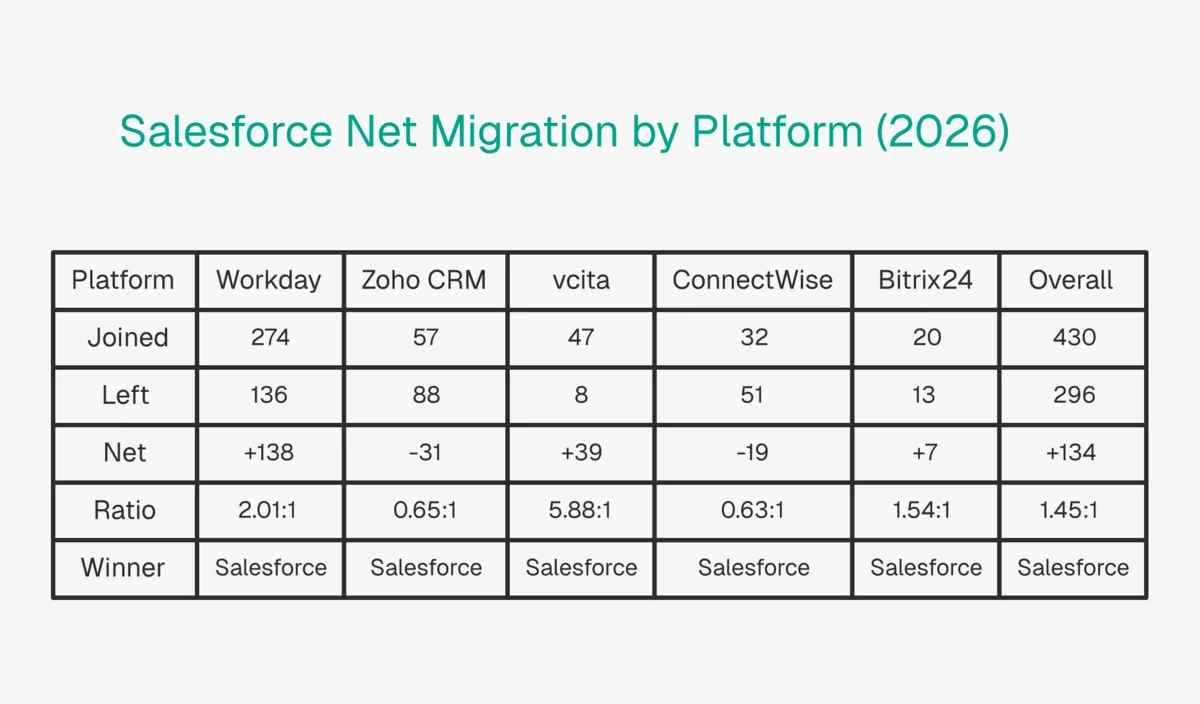
The overall 1.45:1 ratio means Salesforce gains more companies than it loses, but the advantage is modest. The Workday corridor is the clear bright spot (2.01:1), while the Zoho CRM corridor is a concern (0.65:1). As we covered in Part 2, Salesforce's actual market share is much larger than what web detection captures, so these migration numbers represent the most visible switchers, not the full picture.
Previously-used count context: Our database contains 35,243 domains that previously had Salesforce components but no longer do. That's nearly as many as the 36,143 currently active. High churn is typical for CRM platforms because companies frequently redesign websites, switch web portal tools, or consolidate tracking pixels without actually abandoning the core CRM.
What Migration Data Means for Sales Teams
If you sell to CRM users, migration corridors are your most actionable intelligence. A company that just switched from Workday to Salesforce is in "new platform" mode. They're evaluating complementary tools, hiring implementation consultants, and budgeting for integrations. That's a 3-6 month window of heightened buying activity.
On the flip side, companies switching FROM Salesforce to Zoho CRM are cost-consolidating. They're unlikely to add expensive new tools, but they may need migration services, data cleanup, and training on the new platform.
The 35,243 previously-used domains are a gold mine for Salesforce competitors. These companies had Salesforce web components at some point and removed them. Some legitimately churned, others just redesigned their website. But the signal is there: these are companies with CRM budgets, CRM experience, and (potentially) CRM dissatisfaction. A smart outbound motion would cross-reference this list with current CRM detection to find companies that dropped Salesforce but haven't yet adopted a replacement.
Our CRM category data at /category/crm gives you a full view of the competitive field for building these kinds of prospecting lists.
Part 6: Technology Stack and Third-Party Integrations

What other technologies do Salesforce companies actually run? Our co-occurrence analysis across 27,256 enriched companies reveals clear patterns about how Salesforce fits into the broader tech stack.
Web Analytics Technologies
| Technology | Overlap Count | Adoption Rate | Purpose |
|---|---|---|---|
| Google Tag Manager | 22,032 | 80.84% | Tag orchestration |
| Google Analytics | 21,584 | 79.19% | Web analytics (legacy) |
| Google Analytics 4 | 16,487 | 60.49% | Web analytics (current) |
| Facebook Pixel | 6,882 | 25.25% | Ad conversion tracking |
| LinkedIn Insights | 6,491 | 23.82% | B2B ad tracking |
Over 80% of Salesforce companies use Google Tag Manager, and nearly 80% run Google Analytics. The GA4 migration data is interesting: 60.49% have adopted GA4, while 79.19% still have legacy GA code. That means roughly 19% haven't completed the migration, even though Google sunset Universal Analytics in 2024. Our GA4 migration insights report covers this lag in detail.
The LinkedIn Insights overlap at 23.82% is a strong B2B signal. Nearly a quarter of Salesforce companies invest in LinkedIn advertising, consistent with Salesforce's B2B customer base.
Cloud and Infrastructure
| Technology | Overlap Count | Adoption Rate | Purpose |
|---|---|---|---|
| Cloudflare | 14,309 | 52.50% | CDN / DNS / security |
| Amazon (AWS) | 13,521 | 49.61% | Cloud hosting |
| Microsoft Azure DNS | 11,502 | 42.20% | Cloud hosting / DNS |
| Nginx | 11,359 | 41.68% | Web server |
| CloudFront | 6,700 | 24.58% | CDN (AWS) |
The near-even split between AWS (49.61%) and Azure (42.20%) is telling. Despite Salesforce's own infrastructure running on AWS (their strategic partnership started in 2016), Azure has a strong presence among Salesforce customers. Microsoft's enterprise relationships clearly extend beyond Dynamics CRM.
Email and Collaboration
| Technology | Overlap Count | Adoption Rate | Purpose |
|---|---|---|---|
| Slack | 17,549 | 64.39% | Team messaging |
| Microsoft Exchange Online | 13,725 | 50.36% | |
| Office 365 Mail | 13,029 | 47.80% | Email suite |
| Google Apps for Business | 9,062 | 33.25% | Email / productivity |
Slack at 64.39% overlap is the standout figure. Salesforce acquired Slack in July 2021 for $27.7 billion, and the integration is clearly working. Nearly two-thirds of companies with Salesforce web components also use Slack. Microsoft's email products (Exchange at 50.36%, Office 365 at 47.80%) still dominate, but Google Workspace has a notable 33.25% presence.
JavaScript and Frontend
| Technology | Overlap Count | Adoption Rate | Purpose |
|---|---|---|---|
| jQuery | 23,257 | 85.33% | DOM manipulation |
| Font Awesome | 13,347 | 48.97% | Icon library |
| React | 10,386 | 38.11% | UI framework |
| Lodash | 6,886 | 25.27% | JavaScript utility library |
| Webpack | 6,590 | 24.18% | Module bundler |
jQuery at 85.33% isn't surprising — it ships with many Salesforce web components by default. React at 38.11% is more meaningful: it indicates a substantial portion of Salesforce companies are building custom web applications alongside their CRM deployment.
Marketing Automation Technologies
| Technology | Overlap Count | Adoption Rate | Purpose |
|---|---|---|---|
| Google Conversion Linker | 9,570 | 35.11% | Ad conversion tracking |
| Facebook SDK | 7,975 | 29.26% | Meta advertising |
| Google AdWords Conversion | 7,805 | 28.64% | Google Ads conversion |
| Google Remarketing | 7,622 | 27.97% | Retargeting campaigns |
| Facebook Custom Audiences | 6,699 | 24.58% | Audience targeting |
The marketing automation overlap paints a clear picture: Salesforce companies invest heavily in paid advertising. Google Conversion Linker at 35.11% and Google AdWords Conversion at 28.64% mean roughly a third of Salesforce companies run active Google Ads campaigns. Facebook SDK at 29.26% shows Meta advertising is nearly as prevalent.
This has direct implications for Salesforce's own marketing products. Despite offering Marketing Cloud and Pardot, Salesforce companies still rely heavily on Google and Meta's native tracking pixels. That suggests either these companies use Marketing Cloud for email/journey orchestration while keeping ad tracking in-platform, or that many Salesforce CRM users haven't adopted Salesforce's marketing suite at all.
What the Tech Stack Tells Us
Four patterns stand out from this data. First, Salesforce companies run Google-heavy analytics stacks. If you're selling analytics tools to Salesforce users, you're competing with an entrenched Google ecosystem where 80%+ already use GTM and GA.
Second, the Slack integration has achieved remarkable penetration at 64.39%. Salesforce's most expensive acquisition ($27.7 billion for Slack) is delivering measurable co-adoption. This is the data point that justifies the acquisition price tag: nearly two-thirds of Salesforce companies now use Slack.
Third, the AWS/Azure split suggests Salesforce companies aren't locked into one cloud provider, creating opportunities for multi-cloud tooling vendors. Despite Salesforce's own infrastructure partnership with AWS, Azure maintains a 42.20% presence among Salesforce customers.
Fourth, the marketing automation overlap data reveals that Salesforce companies are active digital advertisers. If you sell ad-tech, conversion optimization, or attribution tools, the Salesforce customer base has above-average engagement with paid advertising platforms.
Part 7: Notable Companies Using Salesforce

These aren't self-reported customer logos. Our detection data confirms these companies have active Salesforce web-facing components on their public domains.
Verified Enterprise Adopters
| Company | Industry | Country | Employees | Founded |
|---|---|---|---|---|
| Tata Consultancy Services | IT Services | India | 10,001+ | 1968 |
| Accenture | Business Consulting | Ireland | 10,001+ | 1989 |
| Deloitte | Business Consulting | United States | 10,001+ | 1900 |
| McDonald's | Restaurants | United States | 10,001+ | 1955 |
| IBM | IT Services | United States | 10,001+ | 1911 |
| Siemens | Manufacturing | Germany | 10,001+ | 1847 |
| PwC | Professional Services | United Kingdom | 10,001+ | 1998 |
| Bank of America | Banking | United States | 10,001+ | 1998 |
| Samsung | Electronics Manufacturing | South Korea | 10,001+ | 1938 |
| FedEx | Transportation | United States | 10,001+ | 1973 |
| JP Morgan Chase | Financial Services | United States | 10,001+ | — |
| Shell | Oil and Gas | United Kingdom | 10,001+ | 1833 |
| UPS | Transportation | United States | 10,001+ | 1907 |
| General Electric | Industrial Manufacturing | United States | 10,001+ | 1892 |
| Target | Retail | United States | 10,001+ | 1962 |
| DHL Express | Transportation/Logistics | Germany | 10,001+ | 1969 |
| Saudi Aramco | Oil and Gas | Saudi Arabia | 10,001+ | 1985 |
| Government of Canada | Government | Canada | 10,001+ | 1867 |
What These Brands Tell Us
The diversity is the story here. This isn't a list dominated by tech companies. You've got logistics (FedEx, UPS, DHL), banking (Bank of America, JP Morgan Chase), financial services like companies using American Express, manufacturing (Siemens, Samsung, GE), energy (Shell, Saudi Aramco), and government (Government of Canada, USPS).
Several patterns emerge. IT consulting firms like TCS, Accenture, Infosys, Cognizant, Wipro, HCLTech, and Capgemini dominate the list because they're both Salesforce customers and Salesforce implementation partners. They use Salesforce internally while also building Salesforce solutions for their own clients.
The presence of companies founded before 1900 (Siemens in 1847, Shell in 1833, GE in 1892) demonstrates that even legacy enterprises with deeply entrenched systems find value in Salesforce's web-facing products, whether for customer portals, support widgets, or digital community platforms.
Geographic Spread of Enterprise Adopters
The geographic distribution of these notable companies is worth analyzing. US companies dominate the list (Deloitte, McDonald's, IBM, Cognizant, Bank of America, JP Morgan Chase, FedEx, UPS, Target, GE, USPS, HP), but the international presence is strong: India (TCS, Infosys, Wipro, ICICI Bank), Germany (Siemens, DHL), UK (PwC, Shell), France (Capgemini), Ireland (Accenture), South Korea (Samsung), Saudi Arabia (Saudi Aramco), Switzerland (Adecco), and Canada (Government of Canada).
This global enterprise footprint confirms what we saw in the geographic distribution data in Part 4: while the US dominates Salesforce adoption overall, European and Asian enterprises are significant customers. For sales teams targeting multinational companies, Salesforce adoption is a qualifying signal regardless of the company's home country.
Industry Patterns Among Notable Companies
IT Services and Consulting firms account for the largest cluster: TCS, Accenture, Deloitte, Infosys, Cognizant, IBM, Capgemini, PwC, Wipro, HCLTech, and Concentrix. That's 11 out of 30 notable companies, or 37%. This over-representation makes sense: these firms are both Salesforce users and Salesforce implementation partners. They operate Salesforce internally for their own sales operations while simultaneously running Salesforce consulting practices.
Financial Services (Bank of America, JP Morgan Chase, Citigroup, ICICI Bank, Allianz) and Transportation/Logistics (DHL, FedEx, UPS) form the next two clusters. The Financial Services presence is consistent with the 6.25% industry share we found in Part 4, while Transportation companies likely use Salesforce for customer communication portals and tracking interfaces.
Part 8: AI and Agentforce — The New Growth Engine

AI is the story of Salesforce in 2026, and the data backs up the hype. Let's look at what's actually happening with Agentforce and Einstein AI.
Agentforce by the Numbers
According to Salesforce's 2026 State of Sales report, AI adoption among sales teams is accelerating:
- Sales teams named AI and AI agents their #1 growth tactic for 2026
- Top performers are 1.7x more likely to use AI agents than struggling teams
- AI agents are expected to cut research time by 34% and content creation by 36%
- 94% of sales leaders with agents say they're critical for meeting business demands
- In four months, agents contacted 130,000 leads and created 3,200 opportunities at one company
"We want to kill the busywork so our teams can focus on what actually moves deals forward: building relationships and driving success." — Adam Alfano, EVP of Sales at Salesforce
Salesforce's $3.6B Bet on Fin (Formerly Intercom)
The clearest signal of how seriously Salesforce takes agentic AI landed on June 15, 2026, when it signed a definitive agreement to acquire Fin — the company formerly known as Intercom — for approximately $3.6 billion. Fin's AI Agent resolves customer queries end-to-end across live chat, email, WhatsApp, SMS, phone, and Slack, powered by its proprietary Apex model. Salesforce says the agent resolves an average of 76% of support volume without human escalation, and the deal brings 30,000+ business customers plus Fin's AI team into the Agentforce fold. The transaction is expected to close in Q4 of Salesforce's fiscal year 2027.
The logic is consolidation, not diversification. Agentforce reached $1.2 billion in ARR in Q1 FY27, up 205% year-over-year, and Fin's packaged, fast-to-deploy support agents fill the one gap in that lineup: out-of-the-box deployments for SMB and commercial teams that don't want to build a custom agent. Stack that against the 84% resolution rate Salesforce already reports on its own Agentforce-powered help desk, and the company is assembling an end-to-end service-agent platform.
There's a first-party angle, too. We track the company Salesforce is buying on our Intercom technology profile: 28,419 active domains running Intercom/Fin and a 3.59% share of the live chat market (#6 of 50 tracked tools). Most of that base is exactly the segment Salesforce is targeting — 57.7% of Intercom customers have 1-10 employees. If the deal closes, watch whether those 28,000+ Fin deployments start co-occurring with Salesforce web components in our detection data, the same way Slack adoption tracked the 2021 acquisition (64.39% overlap today, Part 6).
What 42% Tool Overload Tells Us
According to Salesforce's sales statistics page, 42% of sales reps feel overwhelmed by too many tools. That stat explains the Agentforce value proposition: instead of adding another tool to the stack, embed AI agents directly into the CRM workflow. When nearly half your sales team says they have too many tools, the winning move is consolidation, not another point solution.
How This Connects to Our Detection Data
The 2024 spike in Salesforce web detection (Part 3) aligns with Agentforce's launch timeline. Many of the new web-facing components we detected in late 2024 were AI-powered chat widgets, service agents, and lead qualification bots. Companies that previously kept Salesforce behind login walls are now exposing AI-driven interfaces to the public web, which is exactly what our crawlers pick up.
This has real implications for sales intelligence. If you're using technographic data to identify prospects, Salesforce Agentforce deployments are a new signal of a company's AI investment maturity. Companies deploying Agentforce on their public website are early AI adopters, and that's a qualifying signal for selling AI-adjacent products and services.
How Does Agentforce Fit the Broader Agentic Web?
Salesforce's entire Agentforce bet rests on one assumption: AI agents become a primary way customers and software interact with the web. Cloudflare Radar's global crawl data shows that shift is already underway, and reveals exactly how much room it still has to run.
In the 28 days ending June 9, 2026, 51.8% of AI crawler requests were for model training, versus 34.9% mixed-purpose and just 10.0% for live search, per Cloudflare Radar's AI bots dataset. The crawler population is consolidating around a handful of operators, too: Googlebot (26.7%), Meta-ExternalAgent (12.5%), and ClaudeBot (12.3%) together drive over half of measured AI crawler traffic, with GPTBot (9.9%) close behind.
The more revealing number is the gap between reading the web and acting on it. Across the Technology-category domains Cloudflare scans, about 75% now publish AI-crawler rules in robots.txt (34,616 of 46,297 domains), yet only 4% serve agent-friendly markdown and fewer than 0.4% expose a machine-actionable agent interface like an MCP server card or agent-skill manifest (161 and 197 domains respectively). The web has learned to talk to crawlers; almost none of it is ready to transact with agents.
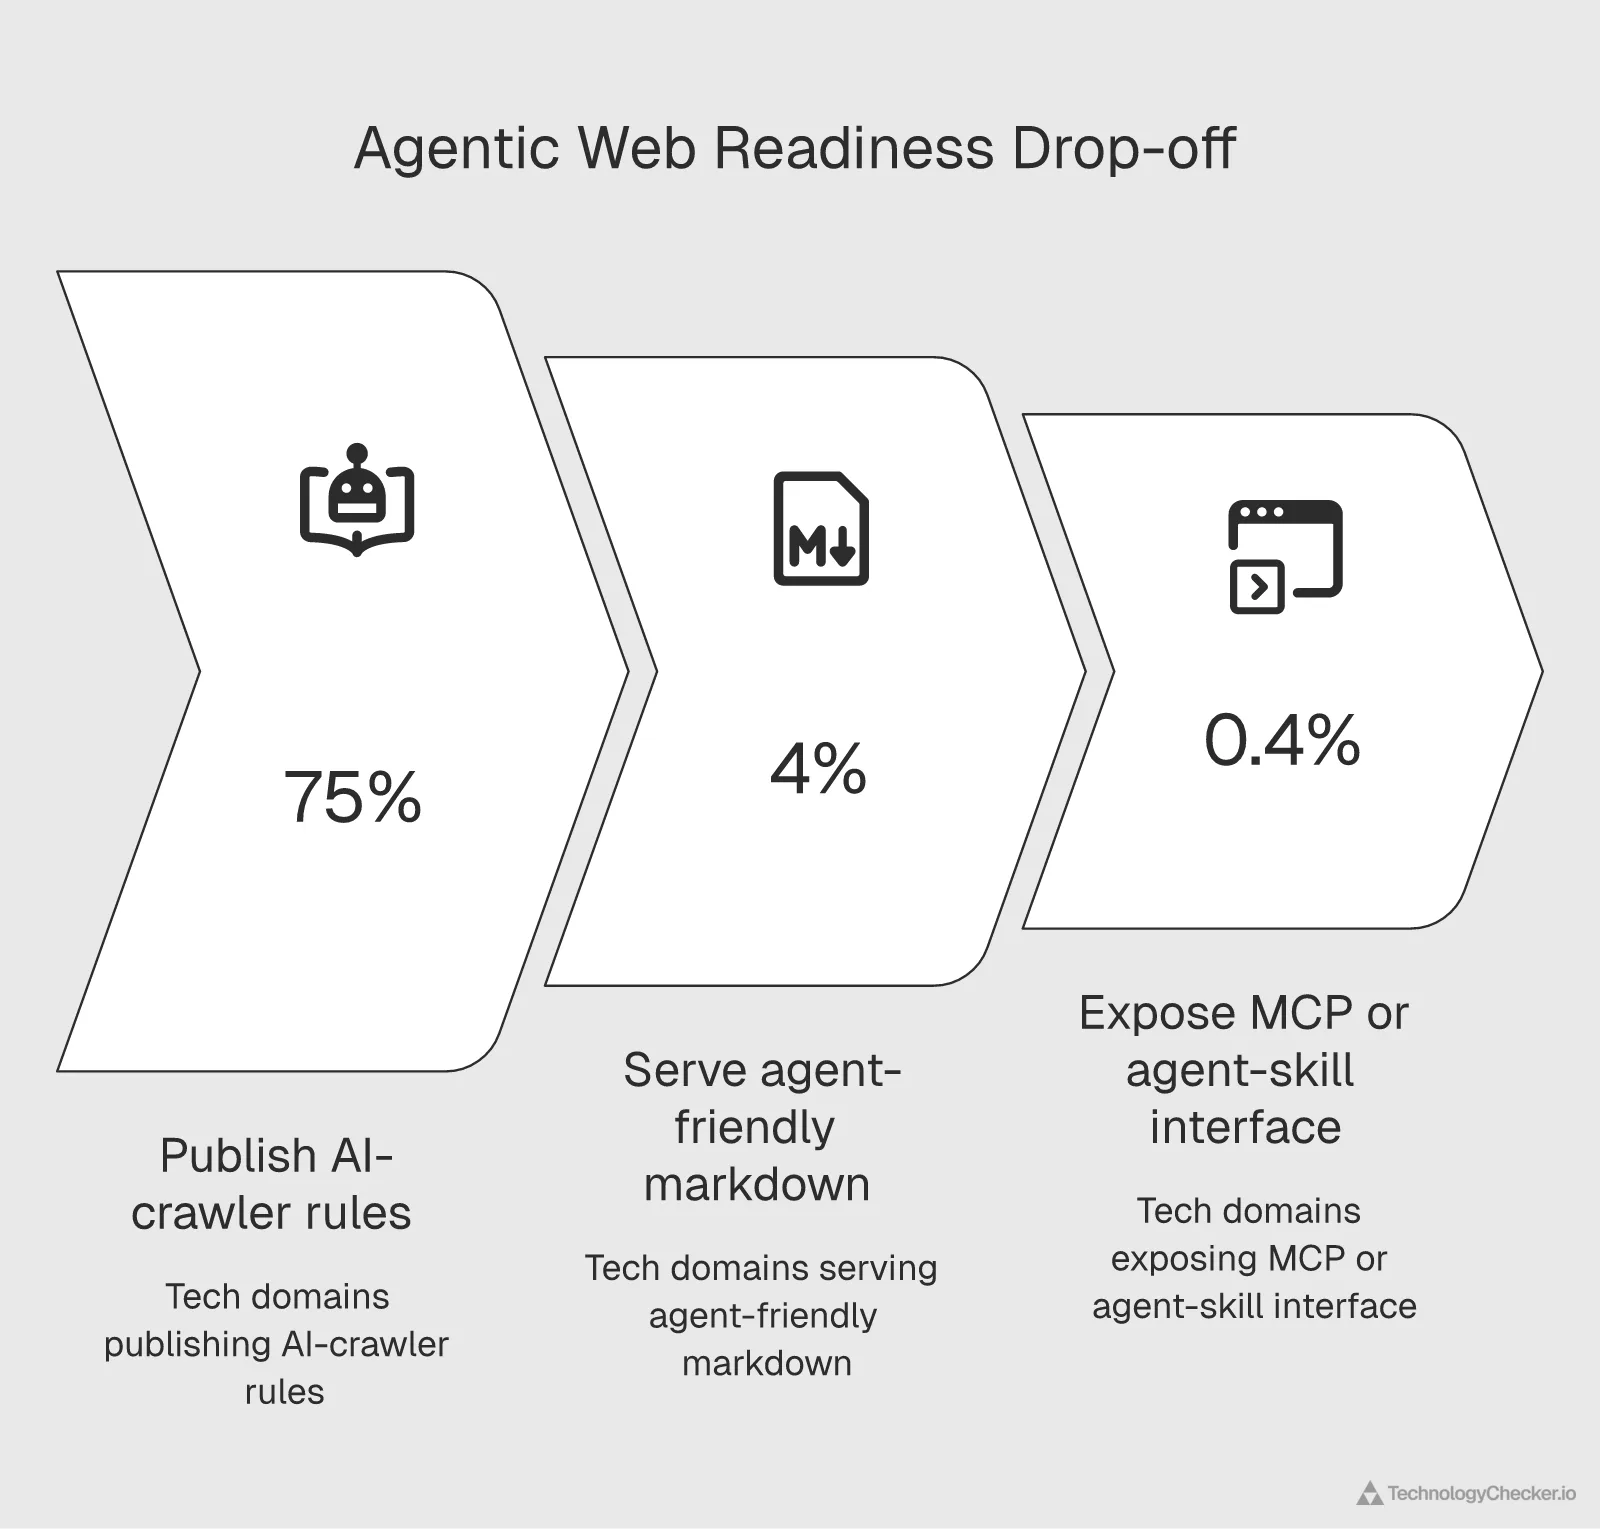
That gap is precisely the product Salesforce is selling. When Agentforce deploys a service agent or lead-qualification bot on a customer's public site, it adds the agent-native surface that fewer than 1% of sites currently have, which is also why our crawlers registered the 2024 detection spike in Part 3. Companies shipping Agentforce widgets aren't just turning on a feature; they're early to an internet-wide transition still in its first innings.
Source: Cloudflare Radar —
radar/ai/botsandradar/agent_readiness(radar.cloudflare.com), 28 days ending 2026-06-09.
Salesforce Employee Count and Workforce
Salesforce's workforce has gone through significant changes since 2022. After peaking at roughly 79,000 employees in early 2023, the company reduced headcount through multiple rounds of layoffs as part of its profitability pivot. Current salesforce employee count estimates place the workforce at approximately 72,000-73,000 as of early 2026.
The workforce reduction didn't slow product development. Instead, Salesforce redirected investment toward AI engineering talent and acquired Informatica's workforce for data integration capabilities. The net result: a leaner company with higher revenue per employee.
For the Salesforce ecosystem, this matters because partner reliance is increasing. With fewer internal professional services staff, Salesforce depends more heavily on system integrators like Accenture, Deloitte, TCS, and Cognizant (all detected in our notable companies list) for implementation work. If you're in the Salesforce consulting business, the opportunity is growing even as Salesforce's direct headcount stabilizes.
Salesforce Employees by Country
Salesforce maintains a global workforce distributed across multiple regions. While the company doesn't break out employee counts by country in granular detail, public reporting and LinkedIn data indicate the largest concentrations are in:
- United States — San Francisco headquarters plus offices in Indianapolis, Atlanta, New York, and Seattle
- India — Hyderabad and Bangalore serve as major engineering and support centers
- United Kingdom — London office handles EMEA operations
- Japan — Strong presence due to the Japanese CRM market's growth
- Canada, Australia, Germany — Regional offices supporting local customers
The India presence is notable because it connects to our detection data. Indian IT services companies (TCS, Infosys, Wipro, HCLTech) are both Salesforce implementation partners and direct employers of Salesforce-skilled engineers. The overlap between Salesforce's own India workforce and the Indian IT services ecosystem creates a self-reinforcing talent pool.
AppExchange and Ecosystem Statistics
The Salesforce ecosystem extends far beyond the core CRM product. The AppExchange marketplace hosts over 9,000 third-party applications, making it one of the largest enterprise app ecosystems. Categories span analytics, marketing automation, project management, finance, HR, and industry-specific solutions.
The ecosystem generates substantial revenue for partners. Salesforce reports that its partner ecosystem has generated over $1.2 trillion in economic impact since inception, with independent software vendors, consulting firms, and system integrators all participating. For companies evaluating Salesforce, the AppExchange depth means you're unlikely to hit a use case that doesn't have at least one pre-built solution available.
This ecosystem lock-in effect also shows up in our migration data from Part 5. Companies with deep AppExchange investments face higher switching costs: migrating off Salesforce means replacing not just the CRM, but all the third-party integrations built on top of it.
Part 9: What Users Actually Say (Salesforce Reviews Analysis)

We analyzed aggregated review data from G2 to understand real user sentiment. The total review mentions across categories exceed 18,000, giving us a statistically meaningful sample.
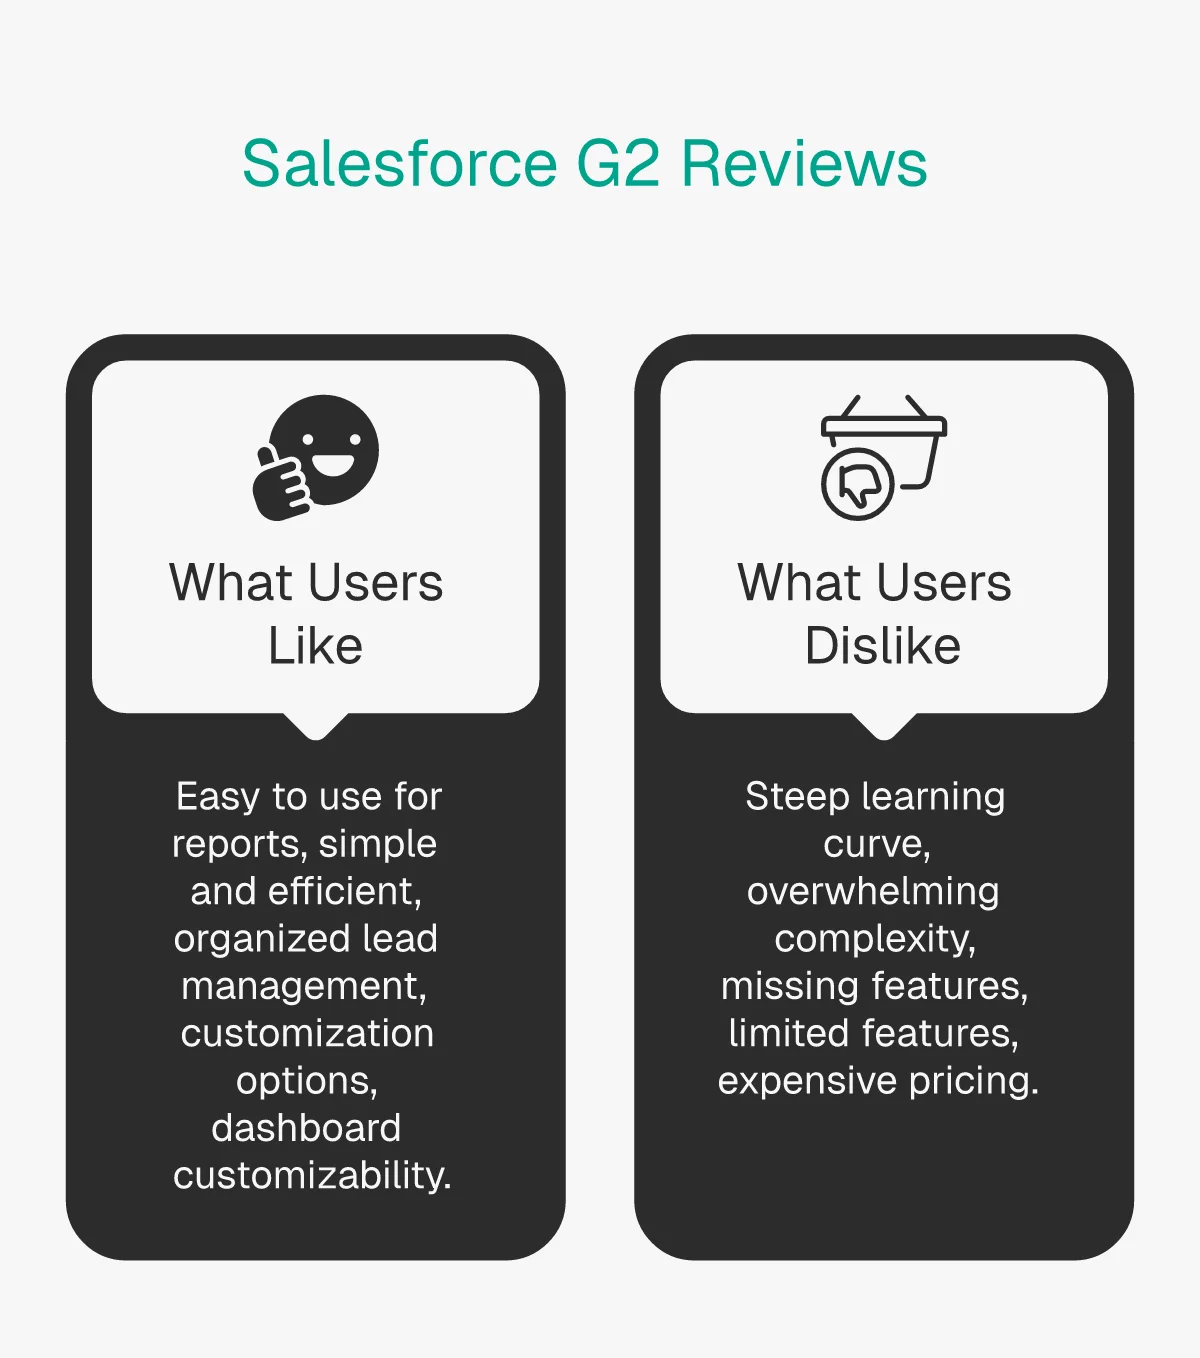
Top Praised Features
| Rank | What Users Like | Mentions |
|---|---|---|
| 1 | Easy to use for reports and day-to-day sales planning | 3,614 |
| 2 | Simple and efficient for sales calls and team management | 3,138 |
| 3 | Organized lead management with user-friendly interface | 2,004 |
| 4 | Customization options tailored to business needs | 1,634 |
| 5 | Dashboard and workflow customizability | 1,617 |
Top Complaints
| Rank | What Users Dislike | Mentions |
|---|---|---|
| 1 | Steep learning curve with complex configuration and setup | 1,784 |
| 2 | Overwhelming complexity requiring training, causing data clutter | 1,374 |
| 3 | Missing features that hinder operations and workflows | 1,135 |
| 4 | Limited features with need for improvements and faster updates | 1,104 |
| 5 | Expensive pricing compared to competitors, costly with scale | 1,094 |
What the Sentiment Data Reveals
The praise-to-complaint ratio is favorable: the top praise category ("easy to use") has more than double the mentions of the top complaint ("steep learning curve"). That's a contradiction worth unpacking. Salesforce is simultaneously perceived as easy to use for daily tasks and difficult to set up initially. The learning curve complaint concentrates on configuration and initial setup. Once configured, daily usage satisfaction is high.
Pricing complaints (1,094 mentions) align with the Zoho CRM migration data from Part 5. Companies leaving Salesforce for Zoho are likely the ones hitting the cost ceiling. When Enterprise edition runs $175/user/month and Unlimited hits $350, the per-seat cost adds up fast for growing teams.
The "missing features" complaints (1,135 + 1,104 mentions combined) may seem contradictory for a platform with 9,000+ AppExchange apps. But these complaints typically refer to out-of-box functionality. Users want features included in their pricing tier rather than requiring additional add-ons or AppExchange purchases.
How Sentiment Aligns with Migration Data
Cross-referencing the G2 reviews with our migration data from Part 5 reveals consistent patterns. The pricing complaint (1,094 mentions) maps directly to the Salesforce-to-Zoho CRM migration corridor. Zoho's most expensive plan costs a fraction of Salesforce Enterprise, and 88 companies in our dataset made that exact switch. When users say "expensive compared to competitors," Zoho is likely the competitor they have in mind.
The learning curve complaint (1,784 mentions) doesn't generate as much migration because switching CRMs is itself a learning curve nightmare. Companies frustrated with Salesforce's complexity often can't justify the cost and disruption of migrating to a different platform. They're stuck. That's a different kind of lock-in: not technical integration lock-in, but organizational knowledge lock-in. Your team spent six months learning Salesforce; starting over with a new CRM means losing that investment.
The Customization Paradox
There's a subtle tension in the review data. Users praise customization (1,634 + 1,617 mentions, ranked #4 and #5 in praise) while simultaneously complaining about complexity (1,374 mentions, #2 complaint). This is the customization paradox: the same flexibility that lets you build exactly what you need also creates the complexity that overwhelms new users.
Salesforce is aware of this. The Lightning Experience redesign, the introduction of Flow Builder for low-code automation, and the Starter Suite for simpler use cases all target the complexity problem. But the G2 data suggests these efforts haven't fully resolved the tension for existing users, especially those on older Salesforce configurations that predate the simplification features.
For companies evaluating Salesforce, the advice is straightforward: plan for a 3-6 month ramp-up period, invest in admin training (not just end-user training), and start with out-of-box configurations before customizing. The companies that love Salesforce (the 3,614 who call it "easy to use") are typically the ones that did setup right the first time.
Part 10: What You Can Do With This Data

Raw statistics are only useful if you know what to do with them. Here's how different readers can act on this Salesforce data.
If you're evaluating Salesforce
- Benchmark against your company profile. Use the company size (Part 4) and industry distribution data to see if companies like yours are on the platform. If you're a 50-200 person financial services company, you're in Salesforce's sweet spot (22.05% of companies are your size, 6.25% are in your industry).
- Factor in total cost, not just list price. The G2 pricing complaints (1,094 mentions in Part 9) are real. Budget for implementation, training, and the add-ons you'll inevitably need. Salesforce Starter Suite at $25/user/month is the entry point, but most mid-market companies land on Enterprise at $175/user/month.
- Check the migration corridors. If you're considering switching from Zoho CRM, you'd be joining a well-worn path (57 companies made that move). If you're on Workday, the migration is even more common (274 total switches). Use the Salesforce technology profile to see live migration data.
If you're already using Salesforce
- Audit your tech stack against the norms. If you're not running Google Tag Manager (80.84% of Salesforce companies do) or haven't adopted GA4 yet (60.49% have), you're behind the curve. The tech stack data in Part 6 is your benchmark.
- Evaluate your Slack integration. With 64.39% of Salesforce companies running Slack, the integration has become table stakes. If you're still on a separate messaging platform, you may be missing workflow efficiency gains.
- Watch the Agentforce data. As noted in Part 8, 94% of sales leaders with AI agents say they're critical. If you haven't explored Agentforce yet, the window for early-adopter advantage is closing.
If you sell products or services to Salesforce users
- Target the ICP. Our data shows the typical Salesforce company has 1-10 employees, is in the US/UK/Canada, located in New York/Mumbai/London/Chicago, and was founded 2010-2019. That's your prospect list starting point.
- Time your outreach to migration signals. Companies switching CRMs are in buying mode for adjacent tools (analytics, integrations, consulting). Monitor the Salesforce technology profile for real-time churn and adoption signals.
- Focus on Software Development and IT Services verticals. These two industries make up 17.59% of all Salesforce companies. If your product serves tech companies, you have strong overlap with the Salesforce user base.
If you compete with Salesforce
- Target the Zoho CRM corridor. Salesforce is losing more companies to Zoho CRM than it gains (0.65:1 ratio). Price-sensitive customers in the 1-10 employee segment are the most vulnerable to switching, as we covered in our CRM switching report.
- Emphasize simplicity. The top two G2 complaints about Salesforce are learning curve and complexity. If your CRM is genuinely easier to configure, that message resonates with 3,158 reviewers who expressed those pain points.
- Watch the 35,243 previously-used domains. Our database tracks companies that dropped Salesforce web components. These are your warmest prospects. Explore the data on our CRM category page.
Frequently Asked Questions
How many companies use Salesforce worldwide?
Salesforce reports over 150,000 customers globally. Our TechnologyChecker.io detection data tracks 36,143 domains with Salesforce web-facing components, enriched with company data for 27,256 of them. The gap between 150,000 and 36,143 reflects that most Salesforce deployments run entirely behind logins with no public web footprint. According to Girikon's analysis, the 150,000 figure includes companies across all Salesforce products, from Sales Cloud to Marketing Cloud to Service Cloud. For live company data, check our Salesforce technology profile.
What is Salesforce's revenue in 2026?
Salesforce reported FY2026 revenue of $41.5 billion, up 10% year-over-year. This includes a $399 million contribution from the Informatica acquisition. Q4 FY2026 alone generated $11.2 billion, growing 12% year-over-year. For context, Salesforce generated just $5.4 billion in FY2015, meaning revenue grew nearly 8x over a decade. See Part 1 for the full financial breakdown, quarterly trajectory, and profitability analysis.
What is Salesforce's market share in 2026?
Salesforce holds approximately 20.7-21.7% of the global CRM market according to Gartner and IDC estimates, making it the clear #1 CRM platform with more market share than its next four competitors combined. Microsoft Dynamics holds roughly 5.9%, SAP about 4.8%, and Oracle around 4.4%. Our web detection data shows a different number (0.42%), but as explained in Part 2 and the Methodology section, that reflects Salesforce's server-side architecture rather than its actual market dominance.
What industries use Salesforce the most?
Based on our analysis of 27,256 enriched companies, Software Development leads at 10.09%, followed by IT Services and IT Consulting (7.50%) and Financial Services (6.25%). Technology, Information and Internet adds another 3.25%, while Business Consulting rounds out the top five at 2.87%. The full top 10 is covered in Part 4, including Healthcare (2.06%), Non-profit (2.04%), Real Estate (2.30%), and Construction (1.98%). No single industry exceeds 11%, confirming Salesforce as a horizontal platform rather than an industry-specific tool.
Is Salesforce good for small businesses?
Our data shows 31.4% of companies with detected Salesforce web components have just 1-10 employees, making micro-businesses the single largest segment. Salesforce Starter Suite at $25/user/month targets small businesses directly, and Pro Suite at $100/user/month covers most growing team needs. However, the G2 review data in Part 9 shows learning curve complaints are the #1 user frustration (1,784 mentions). Small businesses should budget for a 2-3 month setup period, consider starting with Starter Suite before upgrading, and take advantage of Salesforce's Trailhead training platform.
Does McDonald's use Salesforce?
Yes. Our domain-level detection confirms Salesforce web components on mcdonalds.com. McDonald's, with over 40,000 locations worldwide, uses Salesforce for sustainability tracking and customer engagement through its partnerships with Salesforce and Cognizant. The company tracks sustainability goals across its supply chain using Salesforce-connected applications. See Part 7 for the full list of 18 verified enterprise adopters including IBM, Samsung, Siemens, and Bank of America.
Which Fortune 500 companies use Salesforce?
Our detection data confirms IBM, Samsung, Bank of America, FedEx, UPS, Target, General Electric, Siemens, JP Morgan Chase, Shell, HP, and Citigroup among others. Salesforce claims 90% of Fortune 500 companies as customers. Our data captures a subset: companies with public web-facing Salesforce components, not every company using Salesforce behind login screens. The full verified list with industry, country, and employee data is in Part 7.
What is going to replace Salesforce?
No single platform is replacing Salesforce. Our migration data (Part 5) shows Salesforce still gains more companies than it loses overall (1.45:1 ratio). The biggest outflow goes to Zoho CRM for cost-sensitive businesses (88 total switches from Salesforce to Zoho, with 54 in the last year alone). Other alternatives include HubSpot, Microsoft Dynamics, Freshworks, and Creatio, but none is taking significant market share from Salesforce at scale. At $41.5 billion in annual revenue and 21% CRM market share, Salesforce's position is more fortified in 2026 than it was five years ago.
How much does Salesforce cost per user?
Salesforce Sales Cloud pricing starts at $25/user/month for Starter Suite and scales to $500/user/month for Einstein 1 Sales. Here's the full breakdown: Starter Suite ($25), Pro Suite ($100), Enterprise ($175), Unlimited ($350), and Einstein 1 Sales ($500). Most mid-market companies land on the Enterprise tier at $175. G2 reviewers cite pricing as their #5 complaint (1,094 mentions), and the total cost of ownership typically runs 2-3x the license fee when you factor in implementation, training, and AppExchange add-ons.
Does Salesforce integrate with Slack?
Yes, and the integration is deeply embedded. Salesforce acquired Slack in July 2021 for $27.7 billion. Our tech stack overlap data in Part 6 confirms the integration is widely adopted: 64.39% of companies with Salesforce web components also use Slack. That's the highest collaboration tool overlap in our dataset, surpassing Microsoft Exchange Online (50.36%) and Google Apps for Business (33.25%). The Slack-Salesforce integration enables CRM notifications, deal collaboration, and customer data queries directly within Slack channels.
Did Salesforce acquire Intercom (now Fin)?
Yes. On June 15, 2026, Salesforce signed a definitive agreement to acquire Fin — the customer-service company formerly known as Intercom — for approximately $3.6 billion. Intercom rebranded to Fin in 2026 after roughly 15 years under the Intercom name. Salesforce plans to fold Fin's AI Agent, which it says resolves about 76% of support volume end-to-end for 30,000+ companies, into its Agentforce platform. The deal is expected to close in Q4 of Salesforce's fiscal year 2027, so Fin operates independently until then. Our Intercom technology profile tracks the 28,419 companies still running the platform.
Conclusion: Salesforce's Position in 2026
The data paints a clear picture. Salesforce enters 2026 from a position of financial strength ($41.5B revenue, 10% growth), market dominance (~21% CRM share), and AI momentum (Agentforce). But the numbers also reveal nuances that headline statistics miss.
The Numbers Tell the Story
- $41.5 billion FY2026 revenue — record performance with improving margins
- 36,143 active web-detected domains — growing from just 8,152 twelve months prior
- 31.4% micro-business adoption — the "enterprise-only" label is outdated
- 1.45:1 overall migration ratio — net positive, but Zoho CRM is gaining ground
- 64.39% Slack overlap — the $27.7B acquisition is delivering measurable co-adoption
- 35,243 previously-used domains — churn is real, but web component churn doesn't equal CRM abandonment
Why Salesforce Keeps Winning
- Ecosystem lock-in through breadth. With 9,000+ AppExchange apps, $27.7B invested in Slack, and the Informatica acquisition expanding data capabilities, the switching cost for entrenched Salesforce customers is enormous.
- AI timing. Agentforce arrived exactly when enterprise buyers started demanding production-ready AI for sales workflows. Being first with a CRM-native AI agent platform gives Salesforce a positioning advantage that's hard to replicate.
- Platform flexibility across company sizes. The data from Part 4 shows Salesforce isn't just for enterprises. The 31.4% micro-business segment proves the platform serves companies across the size spectrum.
What to Watch Next
The Zoho CRM migration corridor deserves close monitoring. Salesforce is losing more companies to Zoho than it gains (0.65:1 ratio), and the trend accelerated in the last 12 months (54 outbound vs. 17 inbound). If cost-sensitive customers continue leaving at this rate, it could erode Salesforce's small-business positioning, the very segment where our data shows the highest adoption concentration (31.4% with 1-10 employees).
The Agentforce adoption curve is the second metric to track. Our web detection data showed a 271% spike in active domains during 2024, much of it driven by new AI widget deployments. Whether that growth sustains or flattens will determine whether Salesforce's AI investment translates into lasting customer acquisition or a one-time deployment wave.
Third, the Informatica integration timeline will affect Salesforce's data capabilities. As companies increasingly prioritize data quality and governance for AI training, Informatica's data management tools within the Salesforce ecosystem could become a differentiator for enterprise buyers.
How We'll Update This Report
We'll refresh this salesforce statistics report quarterly as new data becomes available. Our domain scanning infrastructure updates monthly, financial data refreshes each earnings cycle, and migration patterns accumulate continuously. Bookmark the Salesforce technology profile for real-time data between report updates, or browse the full CRM category on TechnologyChecker.io for competitive market insights.
For sales teams, marketing leaders, and CRM evaluators, the bottom line is this: Salesforce in 2026 is a $41.5 billion platform with dominant market share, accelerating AI capabilities, and a customer base that spans from 1-person startups to the Government of Canada. The data doesn't suggest that changes anytime soon.
This report is based on data collected through March 2026. We update our technology detection data monthly across 29.6 million domains. For questions about methodology or data access, contact our team.
Sophie Clarke
Product Marketing Manager

