Web Traffic Statistics Q2 2026: We Analyzed Billions of Requests - Here Are the 15 Numbers That Matter (July 2026 Update)
Our Q2 2026 refresh of Cloudflare Radar web traffic data, with year-over-year comparisons to Q2 2025. 33.2% of all HTTP requests are now bots, up from 30.4% a year ago. ECDSA certificates crossed RSA (50.3% of new certs, nearly double last year's 26.5%), Googlebot's share of AI-bot traffic more than halved as ClaudeBot rose to #2, UDP now drives 82.6% of network-layer attacks, and compromised-credential logins fell to 57.4%. All-traffic shows desktop leading, but human-only traffic is still mobile-majority. Here are the numbers that matter.
Published •Updated •42 min read

We analyzed Q2 2026 web traffic statistics from Cloudflare Radar's global network (81 million HTTP requests per second, 330 cities, 125+ countries) and refreshed every metric for the full April–June quarter, with year-over-year comparisons back to Q2 2025. Nearly one in three requests is now a bot (33.2%, up from 30.4% a year ago). ECDSA certificates crossed RSA to become the majority public-key algorithm, Googlebot's share of AI-bot traffic more than halved year over year as ClaudeBot climbed to #2, and the share of login attempts using leaked credentials fell to 57.4%. These numbers define the internet right now.
Key findings — Q2 2026 close (April 1 – June 30, 2026; year-over-year vs Q2 2025):
- 33.2% of all HTTP requests are bots — up from 30.5% in Q1 and 30.4% a year ago, still on track to pass human traffic by 2027
- Googlebot's grip on AI-bot traffic more than halved YoY, from 57.2% (Q2 2025) to 27.5%, as ClaudeBot (13.9%) rose to the #2 crawler and Bytespider tripled its share
- ECDSA crossed RSA at 50.3% of new certificates logged in Certificate Transparency, nearly double its 26.5% share a year ago
- UDP now drives 82.6% of network-layer (L3) attacks, up from 49.8% a year ago, as volumetric floods displace TCP-based attacks
- 57.4% of inspected login attempts use compromised credentials, down from 63.5% in Q1 and 60.1% a year ago (these are the logins Cloudflare checks, ~88% automated)
- All-traffic shows desktop leading at 59.6%, but human-only traffic is mobile-majority at 54.9% — the gap is the bot signal, since automated traffic classifies as desktop
- 93.9% of web traffic uses modern TLS (1.3 + QUIC), up 3.2 points YoY, while TLS 1.2 has slipped to 6.1%
- WAF holds the L7 mitigation lead at 50.8%, having overtaken DDoS-specific rules (49.1% a year ago) over the past year
Web Traffic Statistics in Q2 2026: The Full-Quarter Numbers
Q2 2026 is closed, so this refresh moves off the rolling monthly snapshots and re-pulls every metric for the full calendar quarter (April 1 – June 30, 2026), with a like-for-like comparison against the same quarter of 2025. That year-over-year frame is the part that pays off: a single month tells you where a metric sits, but a Q2-over-Q2 read tells you what actually moved on the internet in a year.
From where I sit running our crawling infrastructure in Edinburgh, three of these year-over-year shifts changed how we operate. The bot share crossed a third of all requests, which re-set our rate-limit budgets. The AI-bot leaderboard reordered around us: Googlebot's share of that traffic more than halved while ClaudeBot climbed to second, so our per-crawler handling had to follow. And ECDSA finally became the majority certificate algorithm, exactly the kind of quiet infrastructure milestone this report exists to catch.
The 15 numbers, with quarter-over-quarter and year-over-year deltas
Every figure below is a single Cloudflare Radar pull for three windows (Q2 2025, Q1 2026, and Q2 2026), so each row carries both a quarter-over-quarter and a year-over-year delta. Bold marks the metrics that moved most decisively over the year.
| # | Metric (share of…) | Q2 2025 | Q1 2026 | Q2 2026 | YoY Δ |
|---|---|---|---|---|---|
| 1 | Bots, of all HTTP requests | 30.4% | 30.5% | 33.2% | +2.8 pt |
| 2 | AI crawlers, of bot traffic | 19.2% | 21.7% | 19.1% | -0.2 pt |
| 3 | Search-engine crawlers, of bot traffic | 40.3% | 32.3% | 29.6% | -10.7 pt |
| 4 | Googlebot, of AI-bot traffic | 57.2% | 35.2% | 27.5% | -29.7 pt |
| 5 | ClaudeBot, of AI-bot traffic | 8.3% | 11.3% | 13.9% | +5.6 pt |
| 6 | Compromised logins, of inspected attempts | 60.1% | 63.5% | 57.4% | -2.8 pt |
| 7 | Link phishing, of malicious email | 55.0% | 69.7% | 75.8% | +20.8 pt |
| 8 | WAF, of L7 attack mitigations | 47.6% | 51.5% | 50.8% | +3.2 pt |
| 9 | UDP, of L3 attacks | 49.8% | 70.3% | 82.6% | +32.8 pt |
| 10 | Modern TLS (1.3 + QUIC), of web traffic | 90.7% | 93.5% | 93.9% | +3.2 pt |
| 11 | HTTP/3, of requests | 20.5% | 21.6% | 21.0% | +0.5 pt |
| 12 | IPv6 (AAAA), of DNS queries | 17.7% | 20.5% | 21.2% | +3.5 pt |
| 13 | ECDSA, of new certificates | 26.5% | 43.1% | 50.3% | +23.8 pt |
| 14 | Let's Encrypt, of certs logged in CT | 68.4% | 54.4% | 56.7% | -11.7 pt |
| 15 | TLS 1.2 (legacy), of web traffic | 8.9% | 6.5% | 6.1% | -2.8 pt |
Source: Cloudflare Radar API — http/summary, bots/summary, ai/bots/summary, leaked_credential_checks/summary, email/security/summary, attacks/layer3 and layer7/summary, dns/summary, and ct/summary, each queried for Q2 2025 (Apr 1 – Jun 30, 2025), Q1 2026, and Q2 2026 (Apr 1 – Jun 30, 2026) on July 2, 2026. Certificate shares are computed from raw issuance counts. The Q1 figures here are calendar-quarter, so they differ slightly from the rolling 30-day "Q1" baseline used in the original sections below.
Bots crossed a third of all requests, and they explain the "desktop" mirage
Bot traffic reached 33.2% of all HTTP requests in Q2 2026, up from 30.5% in Q1 and off a 30.4% floor a year ago. That is the cleanest "nearly one in three requests is a bot" the data has shown, and the quarter-over-quarter jump (+2.7 points) is the sharpest single-quarter move in the series.
That rising bot share also resolves a number that would otherwise mislead you. Cloudflare's all-traffic device split shows desktop leading at 59.6% and rising +3.5 points year over year, which reads like a reversal of the mobile-first decade. It isn't. Filter the same quarter to human traffic only and the order flips: mobile leads at 54.9%, desktop at 45.1%. The all-traffic "desktop" majority is largely automated traffic, which Cloudflare classifies as desktop, so the desktop rise and the bot rise are the same story told twice. When you cite a device split, name the population. The honest human-only number is still mobile-majority, even though it eased about two points from Q2 2025's 57.3%.
| Device split, Q2 2026 | Desktop | Mobile |
|---|---|---|
| All traffic (bot-inclusive) | 59.6% | 40.3% |
| Human traffic only | 45.1% | 54.9% |
The AI-bot leaderboard reordered: Googlebot's share halved, ClaudeBot took #2
The single biggest year-over-year move in this report is who is doing the AI-era crawling. In Q2 2025, Googlebot accounted for 57.2% of all AI-bot traffic, an outright majority. A year later that share has more than halved to 27.5%. It didn't fall because Google crawls less; it fell because everyone else crawls far more.
| AI-bot user agent | Q2 2025 | Q1 2026 | Q2 2026 | YoY Δ |
|---|---|---|---|---|
| Googlebot | 57.2% | 35.2% | 27.5% | -29.7 pt |
| ClaudeBot | 8.3% | 11.3% | 13.9% | +5.6 pt |
| Meta-ExternalAgent | 6.3% | 13.9% | 12.7% | +6.4 pt |
| GPTBot | 11.4% | 12.5% | 10.2% | -1.2 pt |
| Bingbot | 7.0% | 9.2% | 8.1% | +1.1 pt |
| Bytespider | 2.4% | 3.5% | 7.9% | +5.5 pt |
| Applebot | 0.9% | 3.6% | 7.4% | +6.4 pt |
| Amazonbot | 3.8% | 4.9% | 5.1% | +1.3 pt |
Anthropic's ClaudeBot is now the #2 AI-bot user agent at 13.9%, up from eighth place a year ago, and with Claude-SearchBot (2.1%) the two Anthropic agents together clear 16%. Bytespider (ByteDance) and Applebot each roughly quadrupled their year-ago share. The durable read: the crawler field that was Google-dominant in 2025 is now genuinely multipolar, and "the fastest riser" changes almost every quarter, which is why we stopped making single-month projections after Applebot's spike-and-reversal earlier this year.
On the defensive side, the robots.txt picture held its shape but the counts drifted up. As of the Q2-close snapshot, GPTBot remains the most-disallowed AI crawler (690 domains), followed by ClaudeBot (594), Google-Extended (558), CCBot (554), and Bytespider (467), with PerplexityBot (415) now firmly inside the most-blocked group. Blocking is rising in absolute terms, but there is still no step-change toward wholesale exclusion.
ECDSA crossed RSA for the full quarter, and the CA mix diversified
For the first full calendar quarter, ECDSA became the majority public-key algorithm among newly issued certificates logged in Certificate Transparency: 50.3%, up from 43.1% in Q1 and just 26.5% a year ago. ECDSA nearly doubled its share in twelve months. The driver is automated, ECDSA-default issuance across the managed CA layer, and the CA mix itself shifted underneath it:
| Certificate authority (owner) | Share of certs logged in CT, Q2 2026 |
|---|---|
| Let's Encrypt (ISRG) | 56.7% |
| Google Trust Services | 13.4% |
| Sectigo | 11.8% |
| Amazon | 6.5% |
| GoDaddy | 5.0% |
| DigiCert | 4.2% |
Let's Encrypt still issues a clear majority of everything logged in CT, but its share has slipped from 68.4% a year ago to 56.7% as Google Trust Services and other automated CAs expanded. So the "free-and-automated CA won" story from 2025 is now two stories: automation won decisively, but it is no longer Let's Encrypt alone. The ECDSA-first default is spreading across several issuers at once.
Attacks went volumetric: UDP now drives 82.6% of L3, WAF holds the L7 line
The network-layer attack mix swung hard toward volumetric floods over the year. UDP now accounts for 82.6% of L3 attacks, up from 49.8% in Q2 2025, a 32.8-point year-over-year swing, with TCP-based attacks falling from near-parity (49.1%) to 17.0%. At the application layer, WAF holds the mitigation lead it took from DDoS-specific rules over the past year (50.8% versus 44.1%, reversing a DDoS-rules lead of 49.1% in Q2 2025). The operational reading is unchanged from our monthly updates: keep both layers tuned. The L7 lead has changed hands more than once, and the L3 story is that raw volume is back in fashion.
Email threats all rose year over year: direction solid, magnitudes approximate
Every major malicious-email category is materially higher than a year ago. Link-based phishing reached 75.8% of malicious email (up from 55.0% in Q2 2025), scam flags rose from 1.8% to 58.0%, and identity-deception and brand-impersonation each cleared 57%.
| Malicious-email category | Q2 2025 | Q1 2026 | Q2 2026 |
|---|---|---|---|
| Link-based phishing | 55.0% | 69.7% | 75.8% |
| Identity deception | 34.6% | 55.5% | 58.8% |
| Scam | 1.8% | 35.1% | 58.0% |
| Brand impersonation | 28.8% | 53.4% | 57.4% |
| Domain-age abuse | 20.4% | 33.1% | 45.6% |
Two honest caveats travel with this table. These categories overlap (one message can be flagged Link, Scam, and Brand-impersonation at once), so the column never sums to a meaningful total and should not be pie-charted. And a uniform, across-the-board rise of this magnitude can reflect classifier recalibration as much as a genuine surge in attack volume. Treat the direction as solid and the exact magnitudes as approximate. Either way, the year-over-year floor rose everywhere, so budgets sized off 2025's email numbers are now low.
What Q2 confirmed, and what we're watching for Q3
Q2 confirmed three trajectories and complicated one. Confirmed: the bot share keeps climbing toward the 2027 human/bot crossover; ECDSA is now the default certificate algorithm; and volumetric UDP attacks are resurgent. Complicated: "mobile lost to desktop" is false once you remove bots, since the honest human split is still mobile-majority. Into Q3 we are watching whether ClaudeBot holds #2 or Googlebot's share stabilizes, whether ECDSA extends its new majority, and whether the human mobile share keeps easing or steadies.
The sections below preserve the original Q1 2026 baseline and the April and May monthly-update layers, the longitudinal record behind the quarter-close numbers above. The methodology, scope, and reading frame are unchanged; only the full-quarter data and the year-over-year comparison are new.
What Changed in Q1 2026 Web Traffic Statistics Through May 2026?
According to Cloudflare Radar, bot traffic rose to 32.58% of all HTTP requests in May 2026 (up from 31.19% in Q1), ECDSA certificate issuance crossed RSA for the first time (50.21% vs 49.79%), and WAF reclaimed the application-layer mitigation lead after April's brief reversal. We re-pulled every metric in this report for the full month of May 2026 to see which Q1 trajectories held, which reversed, and which accelerated. Updated June 1, 2026.
From where I sit running our crawling infrastructure in Edinburgh, the May numbers map directly to operational reality. When a crawler like Bytespider scales this fast — it nearly doubled its share of AI crawler traffic in a single month — we re-tune our classification thresholds within 48 hours of seeing the pattern shift. Our rate-limit budgets felt the bot share climb the same week Cloudflare's data registered it — these aren't abstract telemetry shifts to us, they're tickets in our queue. For the operator-by-operator and country-by-country view of that climb, see our bot traffic statistics.
The headline: bot traffic kept climbing, but April's two reversals reversed back. WAF retook the #1 L7 mitigation slot from DDoS rules, ECDSA finally overtook RSA among newly issued certificates, and the AI-crawler leaderboard reshuffled — Bytespider surged into the top four while Applebot, April's fastest riser, gave back almost all of its gains.
Which Cloudflare Radar Metrics Changed Most Between Q1 2026 and May 2026?
| Metric | Q1 2026 | May 2026 | Δ | Direction |
|---|---|---|---|---|
| Bot share of HTTP traffic | 31.19% | 32.58% | +1.39 pt | Confirmed climb |
| AI Crawler share of bots | 22.0% | 20.3% | -1.7 pt | Eased and held |
| AI Search share of bots | 5.5% | 6.5% | +1.0 pt | Higher |
| Combined AI traffic share of bots | 27.5% | 26.7% | -0.8 pt | Mix shift, not retreat |
| Applebot (% of AI crawlers) | 7.15% | 7.01% | -0.14 pt | Surge reversed |
| Bytespider (% of AI crawlers) | 3.83% | 10.25% | +6.42 pt | Surged to #4 |
| GPTBot (% of AI crawlers) | 11.05% | 11.48% | +0.43 pt | Reclaimed lead vs ClaudeBot |
| Compromised login rate | 60.25% | 56.96% | -3.29 pt | Third straight decline |
| Link-based phishing | 70.5% | 79.58% | +9.1 pt | Sharp escalation |
| Scam email category | 39.6% | 67.21% | +27.6 pt | Sharp escalation |
| UDP share of L3 attacks | 78.0% | 85.24% | +7.2 pt | More dominant |
| WAF mitigation share (L7) | 51.9% | 50.95% | -0.95 pt | Retook #1 |
| DDoS rules mitigation share (L7) | 43.2% | 44.22% | +1.0 pt | Back to #2 |
| ECDSA share of new certs | 44.9% | 50.21% | +5.3 pt | Crossed RSA |
| Let's Encrypt total CA share | 43.3% | 41.1% | -2.2 pt | Slight pullback |
| HTTP/3 share of requests | 21.1% | 21.20% | +0.1 pt | Plateau persists |
| Modern TLS (1.3 + QUIC) | 93.7% | 93.9% | +0.2 pt | Steady |
Which Q1 2026 Narratives Did May Reverse, Confirm, or Extend?
1. The WAF-vs-DDoS-rules story flipped back. In Q1 we wrote that WAF had quietly overtaken DDoS-specific rules as the primary L7 mitigation layer (51.9% vs 43.2%). April reversed that — DDoS rules handled 49.3% versus WAF's 45.9%. In May the gap flipped a third time: WAF reclaimed the lead at 50.95% versus DDoS rules at 44.22%. The honest read across three months is that neither layer "won" — application-layer attack mix swings month to month between volumetric floods (DDoS rules) and signature-detectable exploits (WAF). The April advice still holds: keep both layers tuned rather than deprecating either based on a single month.
2. AI crawler share eased and then held. The AI Crawler bot category fell from 22.0% (Q1) to 19.9% (April) and settled at 20.3% in May, while AI Search bots held around 6.5%. Combined AI-related traffic landed at 26.7% of all bot traffic — within a point of Q1. The category isn't retreating; the bigger May story is inside it. Bytespider nearly doubled to 10.25% of AI crawler traffic and is now the #4 crawler, while GPTBot (11.48%) reclaimed a clear lead over ClaudeBot (9.73%).
3. Email phishing escalated again — and the whole threat profile rose with it. Link-based phishing climbed from 75.9% (April) to 79.58% of malicious email, and the scam category jumped from 45.5% to 67.21%. Identity-deception and brand-impersonation flags rose by roughly 12 points each in the same window. A caveat worth stating plainly: these categories overlap (one message can trip several), and a uniform across-the-board rise of this size can reflect classifier recalibration as much as a genuine attack wave. Either way, if you're sizing email-security budgets off the Q1 numbers in this report, your Q2 inbox is materially noisier.
Which Q1 2026 Findings Held Through May? The Bytespider Story
Here's where we'll tell on ourselves. In the April update we projected that Applebot — then the fastest-rising crawler — would become a top-three AI crawler in May. It didn't. Applebot eased back to 7.01% of AI crawler traffic, round-tripping almost exactly to its Q1 level (7.15%). The crawler that actually surged was ByteDance's Bytespider, which jumped from 5.73% (April) to 10.25% in May to claim the #4 spot. GPTBot (11.48%) reclaimed a clear lead over ClaudeBot (9.73%) after the two ran neck-and-neck earlier in the year. The durable Q1 finding still holds: the crawler ecosystem that looked OpenAI-dominant in 2024 now has Google, Meta, ByteDance, OpenAI, and Anthropic as serious volume players — but which one is "the riser" changes almost monthly, and single-month projections are a bad bet.
How Does the May 2026 Update Affect Q1 2026 Findings?
The 15 numbers in the Q1 sections below are still the right baseline for understanding the trajectory into Q2. Where the May figures move the picture meaningfully, we've added inline notes alongside the original Q1 tables. The methodology, scope, and reading frame haven't changed — only the latest data point has.
I run TechnologyChecker's crawling infrastructure from Edinburgh. We scan 50 million domains a month and feel the downstream effects of every trend in this briefing firsthand. When AI crawlers spike, our rate-limit budgets get eaten. When bot traffic shifts, our detection accuracy gets tested in real time. When credential stuffing climbs, the websites we monitor become targets. These aren't abstract numbers to us. They're operational reality.
How We Conducted This Research
Data source: Cloudflare Radar API — HTTP analytics, bot intelligence, AI insights, robots.txt analysis, credential leak detection, email security analytics, attack analytics (L3/L7), DNS query distribution from 1.1.1.1 resolver, and Certificate Transparency logs.
Scale: Cloudflare processes over 81 million HTTP requests per second across 330 cities in 125+ countries. This telemetry represents a significant cross-section of global internet traffic — not a sample or estimate.
Timeframe: The Q1 2026 baseline covers March 11 through April 10, 2026 (30 days), with month-over-month comparisons against the preceding 30-day control period (February 9 through March 11, 2026). The June 2026 update re-pulled every metric for the full calendar month of May 2026 (May 1–31), and the robots.txt blocking counts reflect the June 1, 2026 snapshot.
Method: We queried nine Cloudflare Radar API endpoints, cross-referenced the results with our own crawling data from 50M+ domain scans per month, and supplemented with third-party research for external validation where noted.
Limitations: Cloudflare's data reflects traffic routed through its network. Sites not using Cloudflare aren't represented. Bot classification depends on Cloudflare's detection models, which may differ from other providers' methodologies. DNS data comes from 1.1.1.1 resolver users, skewing toward privacy-conscious populations.
Q1 2026 Web Traffic Statistics at a Glance
The 15 web traffic statistics that matter in 2026:
- 31.2% of all HTTP requests are bots (up from 30.9% last month)
- 22% of bot traffic is now AI crawlers — the fastest-growing category
- Applebot surged 140% in Q1 (2.97% to 7.15% of AI traffic) — though that spike reversed by May, easing back to 7.01% (see the June update notes above)
- GPTBot is the most-blocked AI crawler — disallowed by 476 of 4,055 domains analyzed
- Meta-ExternalAgent is the #2 AI crawler at 16.3%, overtaking both GPTBot and ClaudeBot
- 60.3% of login attempts use compromised credentials (down from 63.5% last month)
- 70.5% of malicious email contains link-based phishing
- 51.9% of L7 attacks are mitigated by WAF, now surpassing DDoS rules (43.2%)
- UDP dominates L3 attacks at 78%, with TCP at 21.3%
- 93.7% of web traffic uses modern TLS (TLS 1.3 + QUIC)
- HTTP/3 holds at 21.1% — steady but not growing this month
- 20.4% of DNS queries are IPv6 (AAAA records)
- ECDSA certificates hit 44.9%, closing the gap on RSA (55.1%)
- Let's Encrypt (R13 + R12 + E8) issues 43.3% of all certificates — more than any other CA family
- TLS 1.2 is down to 6.3% of web traffic, effectively a legacy protocol
For context: 5.65 billion people now connect to the internet — 68.7% of the global population — according to DemandSage. The infrastructure serving those users is what this report measures.
The Bot Traffic Reality: 31.2% of All Requests
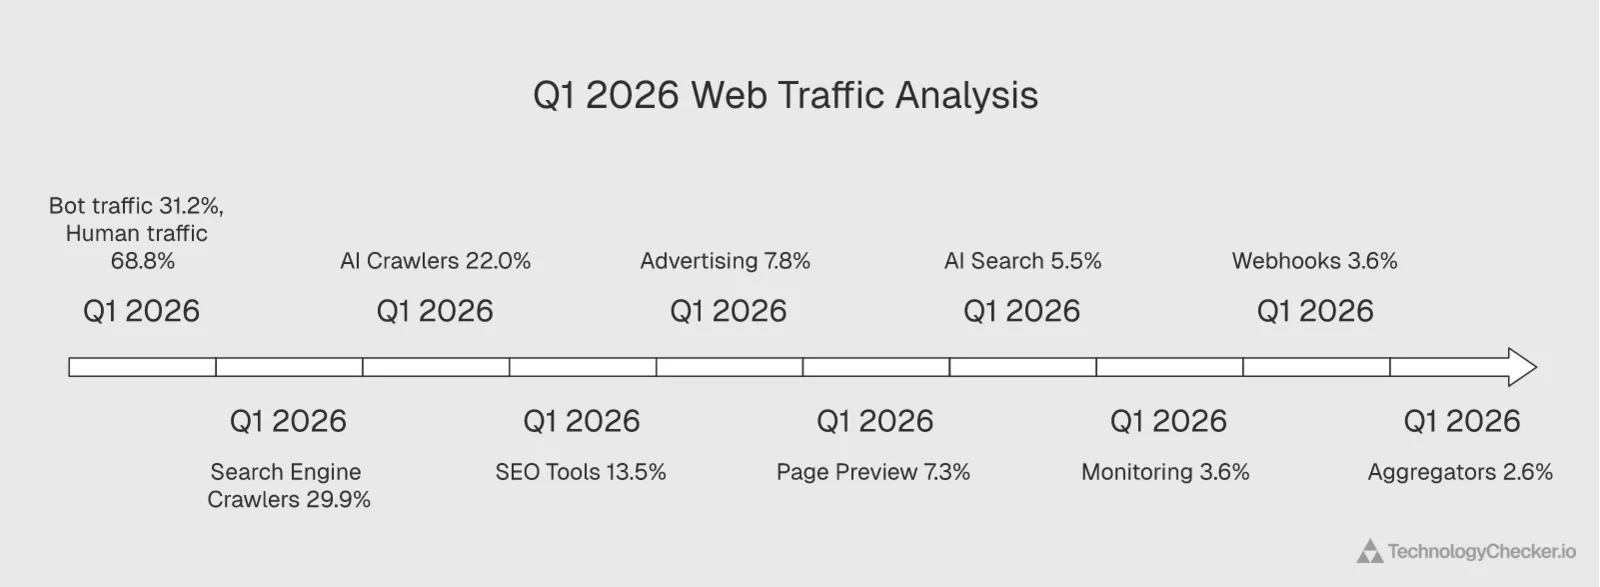
Nearly one in three HTTP requests hitting websites right now is non-human. According to Cloudflare Radar's HTTP analytics, 31.2% of all requests in the past 30 days were classified as bot traffic — up from 30.9% in the prior period.
| Traffic class | Current period | Previous period | Change |
|---|---|---|---|
| Bot | 31.19% | 30.93% | +0.26 pts |
| Human | 68.81% | 69.07% | -0.26 pts |
That 0.26-point shift looks small in isolation. It's not. Extrapolated across Cloudflare's 81 million requests per second, it means roughly 210,000 additional bot requests per second compared to last month.
May 2026 update: Bot share climbed again in May to 32.58%, with humans at 67.42% — up 1.39 points from Q1 across two months. The human/bot crossover Cloudflare's CEO flagged for 2027 stays on schedule; the Q1-to-May pace adds on the order of 1.1 million more bot requests per second to Cloudflare's network.
Bot category breakdown
Within that 31.2%, the composition tells the real story:
| Bot category | Share of bot traffic |
|---|---|
| Search Engine Crawlers | 29.9% |
| AI Crawlers | 22.0% |
| SEO Tools | 13.5% |
| Advertising & Marketing | 7.8% |
| Page Preview | 7.3% |
| AI Search | 5.5% |
| Monitoring & Analytics | 3.6% |
| Webhooks | 3.6% |
| Aggregators | 2.6% |
AI crawlers are now the second-largest bot category, behind only traditional search engine crawlers. Combined with AI Search bots (5.5%), AI-related traffic accounts for 27.5% of all bot traffic. That share grows every month.
May 2026 update: The AI Crawler category settled at 20.3% in May — down from Q1's 22.0% but up from April's 19.9% — with AI Search bots at 6.5%. Combined AI traffic share of bots was 26.7%, within a point of Q1. Search Engine Crawlers held at 30.5%. The category isn't retreating; the real movement is inside it, where Bytespider surged into the top four (see the user-agent table below).
Why this matters: If you're running a web application and not accounting for bot traffic in your analytics, capacity planning, and security posture, you're making decisions based on data that's at least 30% noise. Your "users" metric is inflated. Your server costs include bots you may not want to serve. And your conversion funnel math is wrong.
What to do with this insight: Audit your analytics platform for bot filtering. Most tools don't separate bot traffic by default, which means your traffic dashboards overcount real users by roughly a third. For SaaS teams, this directly affects unit economics: if your cost-per-visit is rising (Contentsquare reports it's up 9% year over year and 30% over three years), part of that increase is bots consuming resources meant for humans.
External context: According to TechCrunch, Cloudflare's CEO has stated that online bot traffic will exceed human traffic by 2027. Our month-over-month data confirms this trajectory is on track.
The bot traffic trajectory: 2019 to 2026
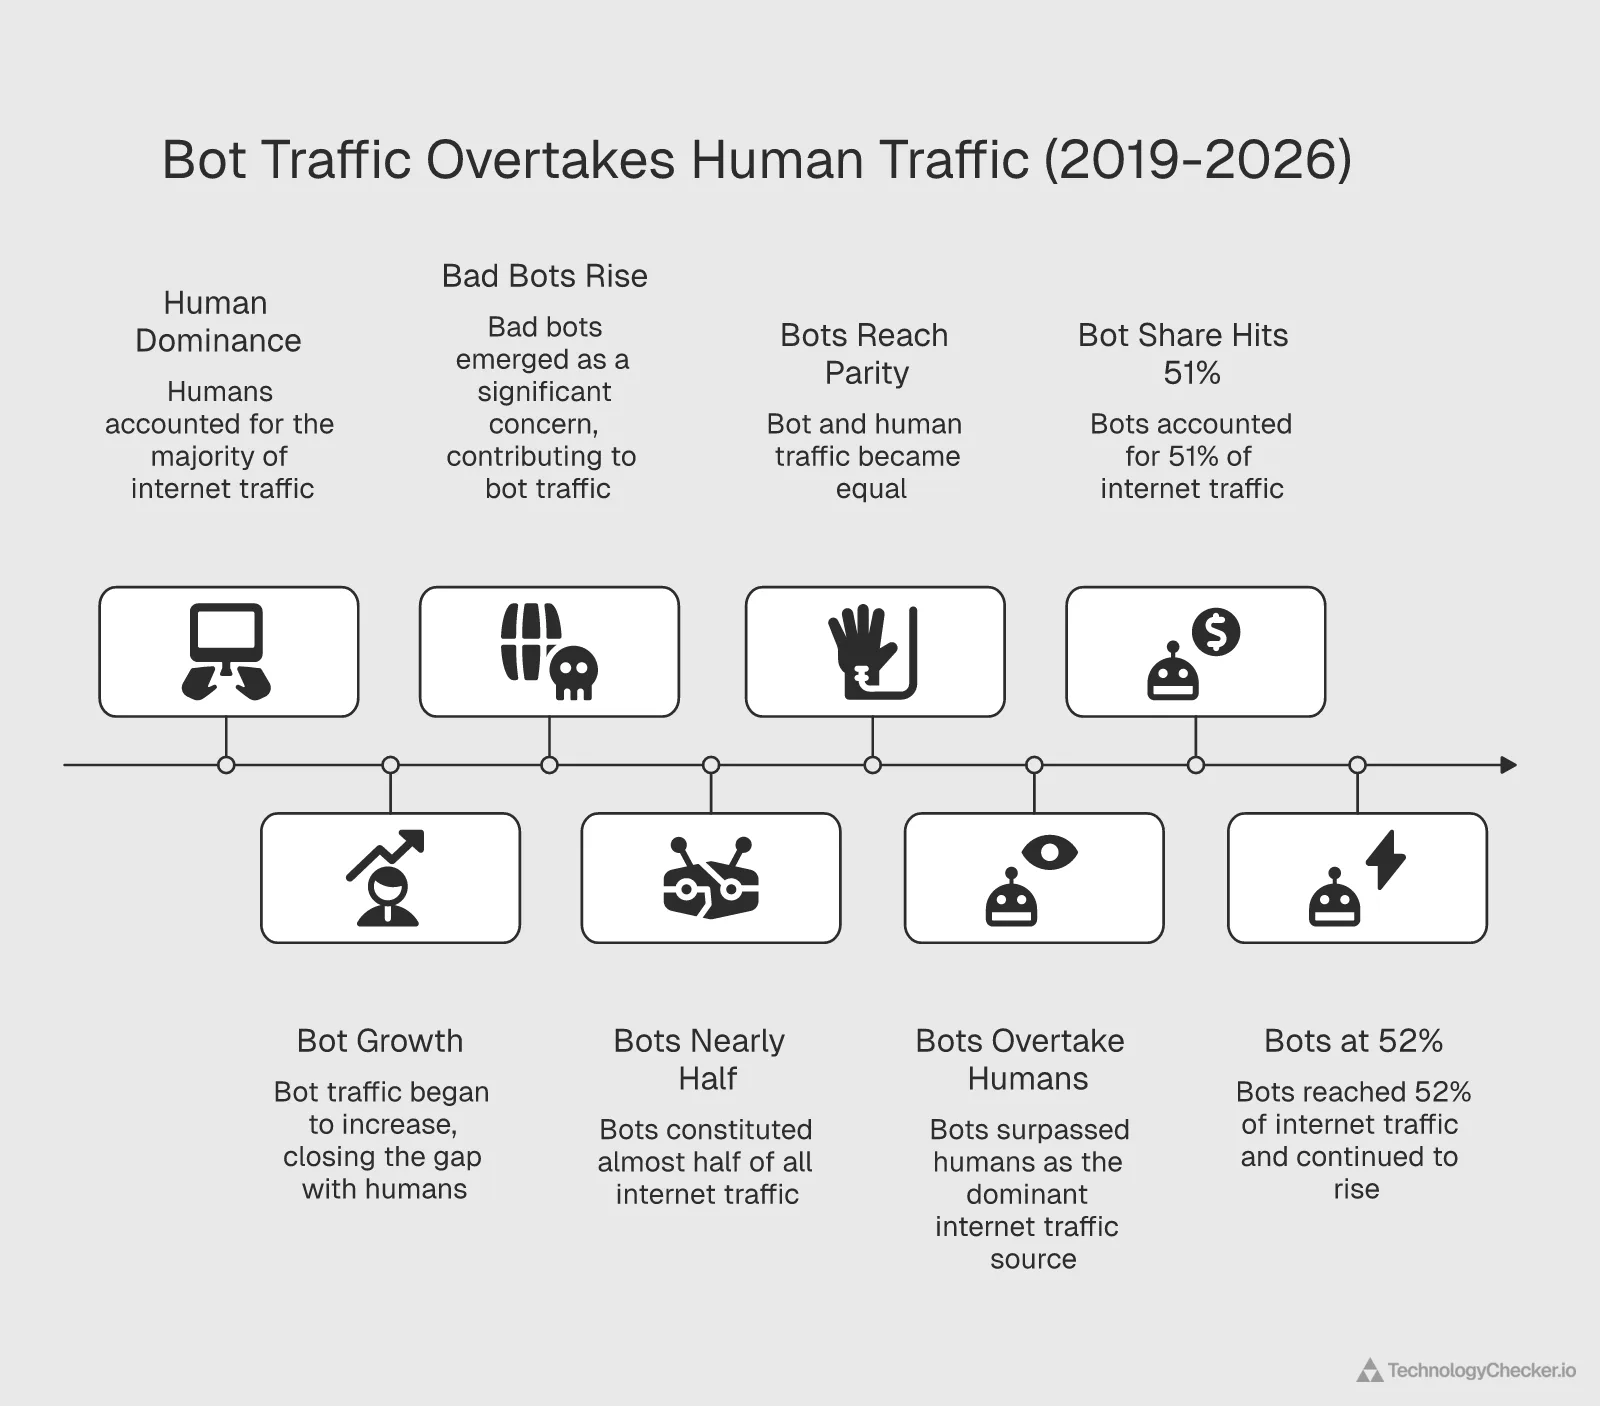
This isn't a sudden shift. Bot traffic has been climbing steadily for seven years. According to HUMAN Security's 2026 State of AI Traffic report, bots now account for 51-52% of all global web traffic, having crossed the 50% threshold for the first time in 2024. AI bot traffic specifically grew 187% from January to December 2025, while human traffic grew just 3.1%.

The composition of that bot traffic is also changing. Training crawlers declined from 90% to 74% of all AI-driven traffic during 2025, while scraper bots rose from 10% to 24%, and a new category — agentic bots performing autonomous tasks — emerged at 1.7%. HUMAN Security reports that OpenAI's bots alone account for approximately 69% of all AI-driven traffic by volume.
AI Crawlers Now 22% of Bot Traffic and Growing Fast
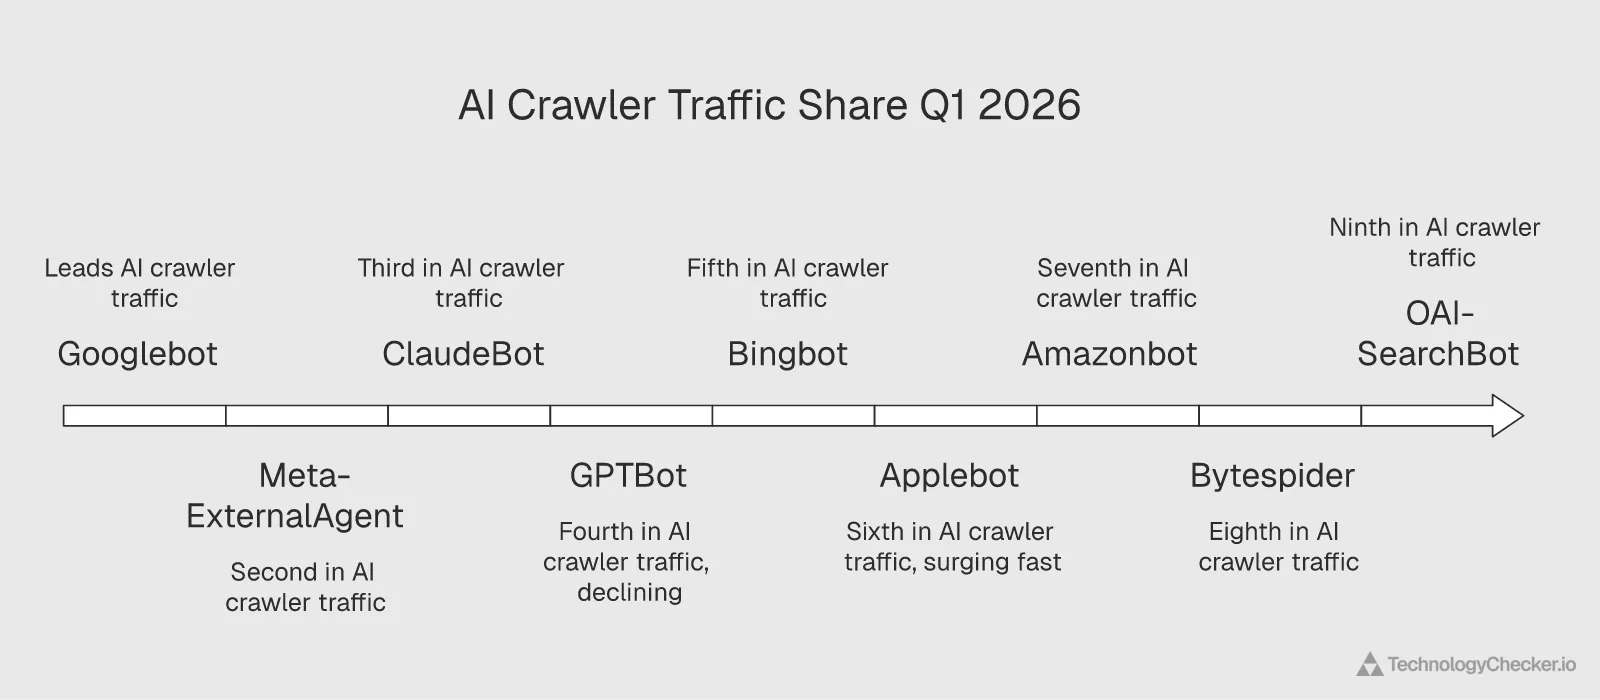
AI crawlers are the fastest-growing bot category on the internet. They've risen from a negligible share two years ago to 22% of all bot traffic in Q1 2026, overtaking SEO tools, advertising bots, and every other category except traditional search engines.
Here's the full AI crawler user agent breakdown with month-over-month trends:
| AI crawler | Current share | Previous month | Change |
|---|---|---|---|
| Googlebot | 31.73% | 34.76% | -3.04 pts |
| Meta-ExternalAgent | 16.29% | 15.21% | +1.08 pts |
| ClaudeBot | 11.78% | 10.95% | +0.83 pts |
| GPTBot | 11.05% | 12.13% | -1.08 pts |
| Bingbot | 7.99% | 9.31% | -1.32 pts |
| Applebot | 7.15% | 2.97% | +4.17 pts |
| Amazonbot | 4.21% | 5.30% | -1.09 pts |
| Bytespider | 3.83% | 3.29% | +0.54 pts |
| OAI-SearchBot | 2.13% | 2.58% | -0.45 pts |
May 2026 update — the leaderboard reshuffled: Bytespider surged to 10.25% (+4.5 pts from April) to become the #4 crawler, GPTBot recovered to 11.48% and reclaimed a clear lead over ClaudeBot (9.73%), and Applebot gave back its April spike, easing to 7.01%. Googlebot (27.26%) and Meta-ExternalAgent (13.23%) hold #1 and #2. The April projection that Applebot would crack the top three did not pan out — Bytespider took the riser crown instead, and the two Anthropic agents (ClaudeBot 9.73% + Claude-SearchBot 2.22%) now sit just behind GPTBot.
Meta-ExternalAgent quietly became the #2 AI crawler. It's been climbing steadily and now sits at 16.29%, ahead of both ClaudeBot (11.78%) and GPTBot (11.05%). Meta's AI ambitions — Llama model training, AI-powered features across Instagram, WhatsApp, and Facebook — require enormous volumes of web data. This crawler is doing the heavy lifting.
GPTBot is declining in share even as it remains the most-blocked. GPTBot dropped from 12.13% to 11.05% while still being disallowed by more domains than any other AI crawler. That's a meaningful tension: OpenAI's crawler faces the most resistance but is also losing relative share to faster-growing competitors.
What to do with this insight: Review your robots.txt and rate-limiting rules for AI crawlers quarterly, not annually. The crawler environment changes too fast for a set-and-forget approach. We published a detailed breakdown in our AI crawlers blocking report covering which crawlers to watch and how to configure access.
External context: According to SEOmator, AI search traffic went up 527% in a year, and roughly 60% of searches now yield no clicks. The crawling we're seeing at the infrastructure level is the supply side of that equation: AI systems consuming web content at scale to power zero-click answers.
Applebot Surge and the Most-Blocked AI Crawlers

Applebot surged 140% in a single month, jumping from 2.97% to 7.15% of AI crawler traffic. That kind of crawling acceleration typically signals a product launch or a major feature expansion.
The Applebot spike
This wasn't a gradual climb. Applebot vaulted past Amazonbot, Bytespider, and OAI-SearchBot in a single 30-day period. Given Apple's ongoing investment in Apple Intelligence and on-device AI features that need web-sourced training data, this surge makes sense. Safari's AI-powered summaries, Siri's expanding web answers, and Apple's partnership with OpenAI all require fresh, high-quality web content.
If you're a content publisher and haven't reviewed your robots.txt rules for Applebot recently, now's the time. Unlike GPTBot (which many sites have already evaluated), Applebot flew under the radar for most of 2025. That window is closing.
May 2026 update — the surge reversed. Applebot's climb did not hold. In May it eased to 7.01% of AI crawler traffic, round-tripping almost exactly to its Q1 level (7.15%) and slipping back behind Bingbot (8.45%). Our April projection that Applebot would become a top-three crawler in May was wrong. The crawler that actually surged was ByteDance's Bytespider, which jumped to 10.25% and took the #4 spot. The lesson stands: single-month crawler spikes are a poor basis for projection.
Who's blocking whom: the robots.txt arms race
According to Cloudflare Radar's robots.txt analysis of 4,055 domains, the most-disallowed AI crawlers are:
| AI crawler | Domains blocking | Fully blocked | Partially blocked |
|---|---|---|---|
| GPTBot | 476 (11.7%) | 365 | 111 |
| CCBot | 426 (10.5%) | 361 | 65 |
| ClaudeBot | 407 (10.0%) | 324 | 83 |
| Google-Extended | 378 (9.3%) | 299 | 79 |
| Bytespider | 350 (8.6%) | 306 | 44 |
GPTBot is blocked by 11.7% of analyzed domains — the highest of any AI crawler. But the gap is narrowing. All five major AI crawlers are now blocked by roughly 9-12% of websites.
The ratio of full to partial blocking tells a deeper story. Bytespider has the highest full-block rate (87.4% of its blocks are full disallows), suggesting that site operators who block ByteDance's crawler tend to block it entirely. GPTBot sees more partial blocking (23.3%), meaning some publishers allow OpenAI to crawl specific paths while restricting others.
What to do with this insight: Check whether your robots.txt distinguishes between AI training crawlers and AI search crawlers. Blocking GPTBot also blocks OAI-SearchBot from indexing your content for ChatGPT Search, which could mean losing a growing traffic source. Consider partial rules that allow search access while restricting training data collection.
External context: According to Digital Bloom's 2026 organic traffic report, 60% of searches ended without a click, and mobile zero-click behavior reached 77%. For publishers already losing organic clicks, blocking AI crawlers entirely may accelerate traffic decline by removing visibility from AI-powered search results.
Security Metrics: Credential Stuffing and Phishing Trends

Six out of every ten login attempts on the internet use passwords that have already been exposed in data breaches. According to Cloudflare Radar's credential leak detection, 60.3% of all HTTP authentication requests in the past 30 days used credentials from known breach databases.
| Status | Current period | Previous period | Change |
|---|---|---|---|
| Compromised | 60.25% | 63.51% | -3.26 pts |
| Clean | 39.75% | 36.49% | +3.26 pts |
The good news: the compromised rate dropped 3.26 percentage points month-over-month, the first meaningful improvement we've seen. The bad news: malicious login attempts using leaked credentials remain the norm, not the exception. This is credential stuffing at industrial scale.
May 2026 update: Compromised credentials fell more sharply in May to 56.96% — a 2.55-point drop and the third consecutive month of improvement, the steepest of the three. Three months of decline is a trend, not noise. The most plausible explanation is the rolling effect of passkey defaults shipping across major identity providers. Even so, with more than half of all login attempts still using leaked credentials, credential stuffing remains the operational baseline, not a fringe attack pattern.
Why this matters: If you're running a login form without rate limiting, bot detection, or compromised credential checking, these numbers are your wake-up call. The majority of authentication traffic hitting your application isn't humans trying to log in. It's automated tools cycling through leaked databases.
Email threat breakdown
Cloudflare Radar Email Security Analytics show the top threat categories in malicious email for Q1 2026:
| Threat type | % of malicious email |
|---|---|
| Link-based phishing | 70.5% |
| Domain age abuse | 53.2% |
| Identity deception | 52.9% |
| Brand impersonation | 50.9% |
| Scam | 39.6% |
| Credential harvesting | 6.9% |
Percentages overlap because a single malicious message can trigger multiple threat categories. Seven out of ten malicious emails contain a deceptive link. More than half exploit newly registered domains or impersonate a known identity or brand.
May 2026 update — the email threat profile escalated further:
Threat type Q1 2026 May 2026 Δ Link-based phishing 70.5% 79.58% +9.1 pts Scam 39.6% 67.21% +27.6 pts Identity deception 52.9% 64.67% +11.8 pts Brand impersonation 50.9% 63.72% +12.8 pts Domain age abuse 53.2% 51.04% -2.2 pts Nearly every threat category rose together between Q1 and May, with link phishing crossing 79% and scam flags up more than 27 points. One honest caveat: these categories overlap (a single message can trip several), so a uniform across-the-board jump of this magnitude can reflect classifier recalibration as much as a real surge in attack volume. Treat the direction as solid and the exact magnitudes as approximate. Either way, your Q2 inbox is materially noisier than Q1's, and the link-phishing assumption in particular is worth re-checking before you size security-awareness budgets off the Q1 numbers.
These numbers validate what our email authentication analysis revealed: email infrastructure has a systemic security gap. We found that 50.12% of encrypted email traffic still uses deprecated TLS 1.0 or 1.1. Combined with the phishing rates above, email remains the weakest link in most organizations' security posture.
DDoS and application attack shifts
At the network layer, UDP flood attacks dominate L3 DDoS at 78%, with TCP at 21.3%. UDP's connectionless nature makes it the path of least resistance for volumetric attacks — spoofed source IPs and amplification through open resolvers without completing a handshake.
At the application layer, a quiet but significant shift: WAF now mitigates more L7 attacks than DDoS-specific rules. WAF handles 51.9% of application-layer mitigations versus 43.2% for DDoS rules. This reflects the evolution of attacks from pure volumetric floods to more sophisticated exploits — SQL injection, XSS, and API abuse that require signature-based detection.
What to do with this insight: Prioritize WAF configuration over pure rate limiting for application-layer defense. If your security stack relies primarily on DDoS mitigation, you're defending against last year's attack profile. The attack surface has shifted to application logic exploits.
May 2026 update — WAF retook the L7 lead; UDP got more dominant at L3: L3 UDP attacks climbed again to 85.24% of L3 volume (up ~5 points from April). At L7 the mitigation mix flipped back to Q1's order — WAF reclaimed #1 at 50.95% while DDoS rules eased to 44.22%.
L7 mitigation Q1 2026 April 2026 May 2026 WAF 51.9% 45.9% 50.95% DDoS rules 43.2% 49.3% 44.22% Access rules — 2.0% 2.52% IP reputation — 2.1% 1.78% Translation: the volumetric application-layer wave that favored DDoS rules in April receded in May, and signature-detectable exploits — WAF's domain — were back on top. The lead has now changed hands three times across Q1 → April → May, which is itself the takeaway: keep both layers tuned and don't deprecate either on a single month's read.
Protocol Adoption: TLS 1.3, HTTP/3, and IPv6 in 2026

Modern TLS now carries 93.7% of all web traffic — effectively the standard for the browseable internet.
TLS version distribution
| Protocol | Current share |
|---|---|
| TLS 1.3 | 71.6% |
| TLS QUIC | 22.2% |
| TLS 1.2 | 6.3% |
| TLS 1.0 | 0.015% |
| TLS 1.1 | 0.002% |
TLS 1.2 is down to 6.3% and dropping. TLS 1.0 and 1.1 are essentially extinct for web traffic at 0.017% combined. This is the web. Email is a different story entirely — our DMARC adoption statistics analysis found that 50.12% of encrypted email traffic still uses deprecated TLS 1.0 or 1.1. If you want a single metric that captures the gap between "the internet we browse" and "the internet that delivers our mail," TLS version distribution is it.
HTTP version adoption
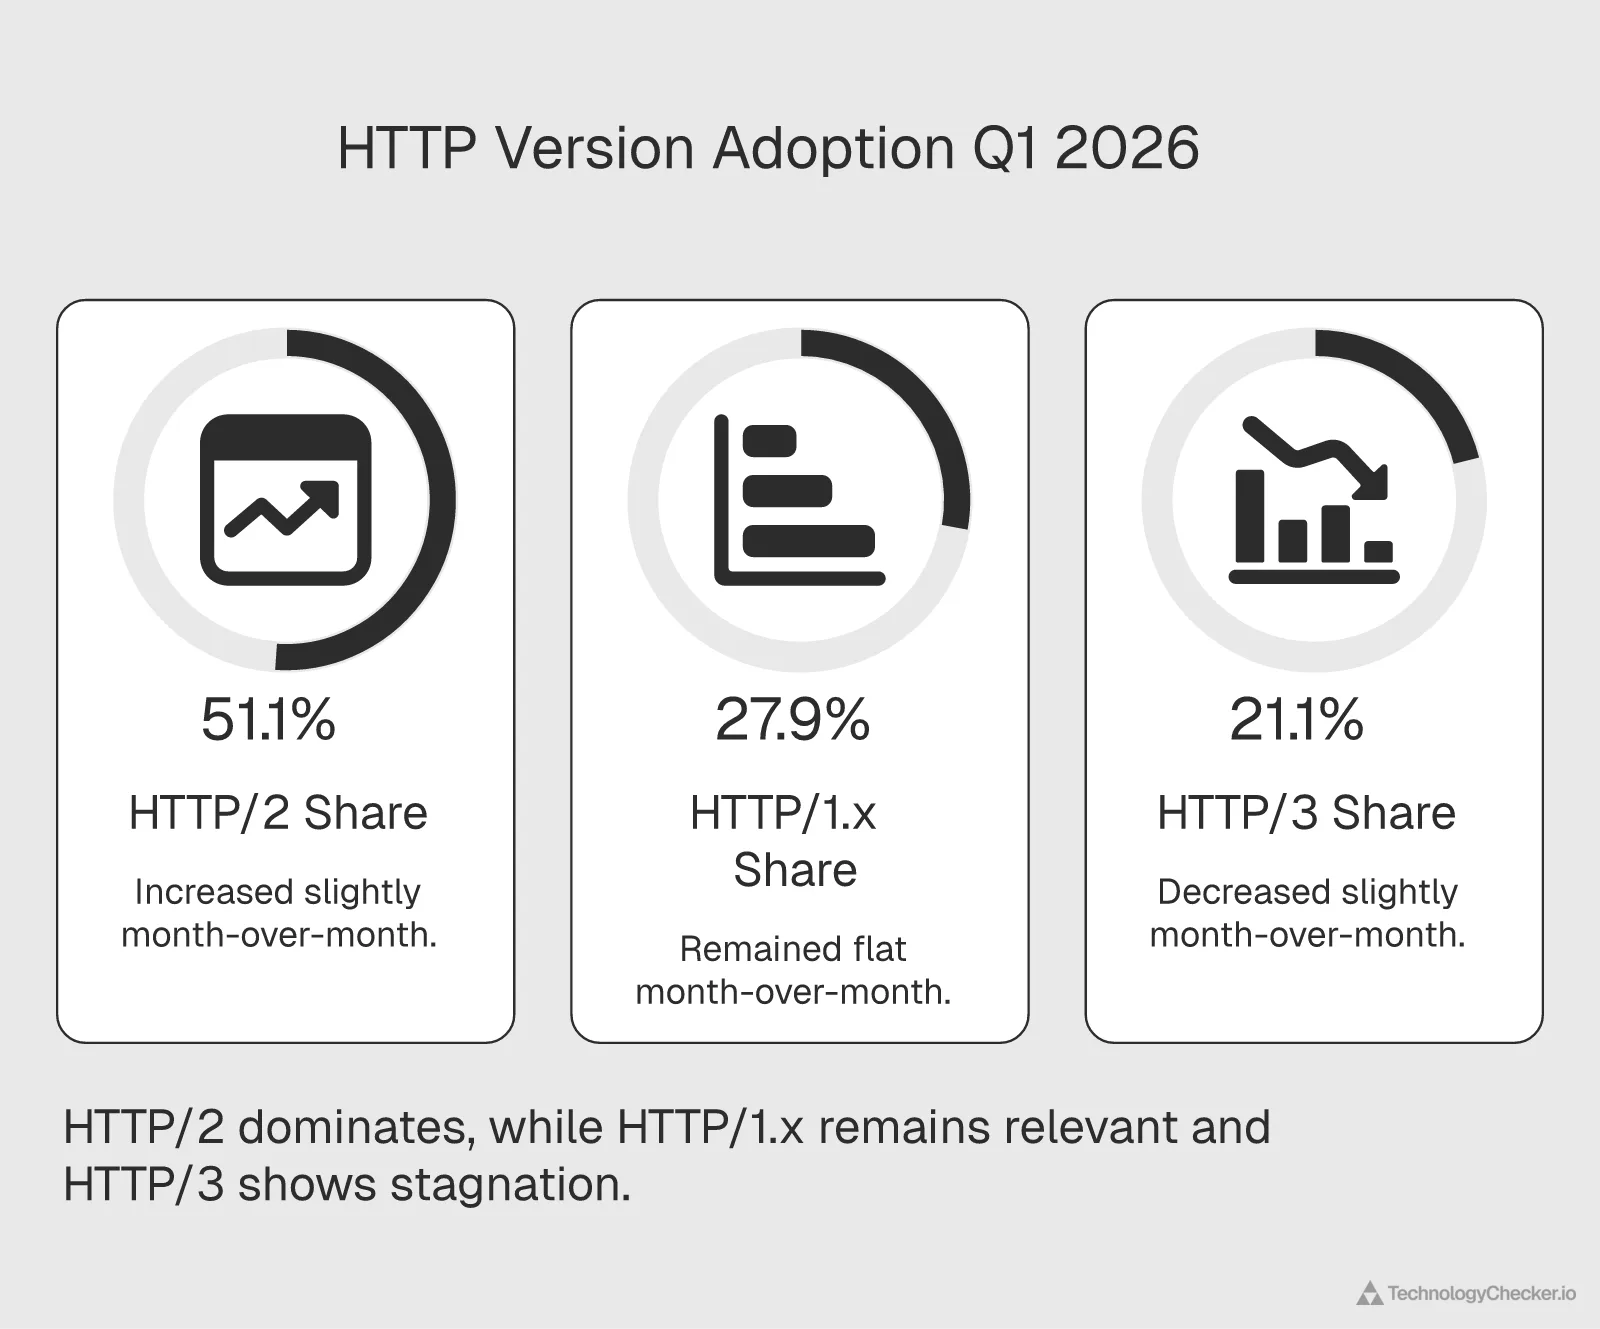
| HTTP version | Current | Previous month | Change |
|---|---|---|---|
| HTTP/2 | 51.1% | 50.5% | +0.52 pts |
| HTTP/1.x | 27.9% | 27.9% | flat |
| HTTP/3 | 21.1% | 21.6% | -0.50 pts |
HTTP/3 dipped slightly this month, from 21.6% to 21.1%. HTTP/2 picked up the share. This isn't cause for alarm — HTTP/3 adoption fluctuates based on CDN rollouts and client updates — but it does suggest the protocol has hit a temporary plateau around the 21% mark. For a deeper dive into these trends, see our HTTP protocol adoption trends analysis.
May 2026 update: The plateau extended into a fourth consecutive month — HTTP/2 51.1%, HTTP/1.x 27.7%, HTTP/3 21.2%. HTTP/3 has now held within a 0.6-point band for four straight months. Whatever breaks the protocol toward 30% still has not arrived.
The jump to 30% will likely require broader server-side adoption beyond Cloudflare, Google, and the major CDNs. AWS CloudFront and major hosting providers are the next catalysts.
DNS query distribution
From Cloudflare's 1.1.1.1 resolver data:
| Query type | Share |
|---|---|
| A (IPv4) | 60.4% |
| AAAA (IPv6) | 20.4% |
| HTTPS | 7.4% |
| ANY | 4.3% |
| PTR | 4.1% |
IPv6 DNS queries represent 1 in 5 lookups. That's meaningful adoption but still well behind IPv4's 3:1 dominance. The HTTPS record type at 7.4% is worth watching — it lets clients discover HTTPS support and HTTP/3 availability directly from DNS, cutting connection setup time.
What to do with this insight: If you haven't migrated to TLS 1.3 yet, you're in a 6.3% minority. Most CDNs and modern hosting platforms handle TLS 1.3 by default. The bigger question is HTTP/3: enabling it requires QUIC support on your origin or CDN. For Cloudflare technology profile users, it's a toggle. For self-hosted infrastructure, it's a more involved upgrade.
External context: According to Network World, global internet traffic surged 17% year over year, with post-quantum cryptography adoption accelerating alongside the TLS 1.3 migration we're tracking here.
Certificate Trends and Let's Encrypt Dominance

ECDSA certificates now account for 44.9% of all SSL/TLS certificates issued globally, closing the gap with RSA to just 10.2 percentage points.
Public key algorithm distribution
| Algorithm | Share of certificates issued |
|---|---|
| RSA | 55.1% |
| ECDSA | 44.9% |
ECDSA offers smaller key sizes, faster handshakes, and equivalent security. The technical case has been settled for years. The remaining RSA majority is largely inertia: legacy systems and certificate management platforms that default to RSA key generation.
May 2026 update — ECDSA crossed RSA: It happened. In May, ECDSA became the majority public-key algorithm among newly issued certificates for the first time.
Algorithm Q1 2026 April 2026 May 2026 ECDSA 44.9% 49.0% 50.21% RSA 55.1% 51.0% 49.79% The crossover the April update projected for Q2 landed in May. The swing continues to come from ECDSA-default issuance across managed platforms — Let's Encrypt's ECDSA intermediates plus a fast-growing ZeroSSL ECC line are now issuing at parity with the legacy RSA intermediates. A 0.4-point lead is a crossover, not a rout: RSA isn't disappearing, but ECDSA-first is now the default behavior of the automated CA layer.
Top certificate authorities
| CA | Share |
|---|---|
| R13 (Let's Encrypt) | 16.7% |
| R12 (Let's Encrypt) | 16.6% |
| WE1 (WE Encrypt) | 13.1% |
| E8 (Let's Encrypt ECDSA) | 10.0% |
Let's Encrypt intermediates (R13 + R12 + E8) collectively issue 43.3% of all certificates logged in Certificate Transparency. That's a remarkable market position for a free, automated CA. The E8 intermediate, which issues ECDSA-only certificates, accounts for 10% on its own — evidence that ECDSA adoption is being driven partly by Let's Encrypt's default configurations.
For more on how certificate issuance patterns affect technology detection and security posture, see our certificate transparency report.
What to do with this insight: If you're still generating RSA certificates manually, switch to ECDSA through your CA or certificate manager. ECDSA's smaller key sizes reduce TLS handshake latency measurably — a benefit for both user experience and search rankings. Let's Encrypt's ACME protocol automates renewal entirely, eliminating certificate expiration as a failure mode.
What These 2026 Web Traffic Statistics Mean for SaaS Teams
The web traffic statistics in this report point to three operational shifts that B2B SaaS teams should account for in 2026.
Your traffic numbers are inflated
With 31.2% of all traffic being bots, your analytics dashboards almost certainly overcount real users. Contentsquare reports that 59% of sites saw traffic decline in 2025, while cost per visit rose 9% year over year. Part of that rising cost is bots consuming resources meant for humans. If you haven't implemented bot filtering in your analytics and capacity planning, your unit economics are off by roughly a third.
AI is reshaping traffic sources
Contentsquare tracked a 632% increase in AI-referred traffic year over year, though it still represents just 0.2% of total traffic. That share is tiny now, but the crawling activity we're measuring at the infrastructure level — AI crawlers at 22% of bot traffic and rising — is the leading indicator. These crawlers are building the knowledge bases that will power the next generation of AI-driven referral traffic.
For more on how AI is reshaping technology adoption patterns, see our AI adoption trends analysis.
Security posture needs to catch up with traffic reality
60% of login attempts using leaked credentials. 70% of malicious email containing phishing links. WAF overtaking DDoS rules as the primary application defense layer. These aren't future risks. They're current operational conditions. If your security stack was configured more than six months ago, the attack profile has already changed.
Our cloud provider traffic analysis shows how infrastructure choices affect exposure to these threats, and our internet outage report covers the connectivity disruptions that compound security risks.
2026 Web Traffic Benchmarks at a Glance
| Benchmark | Value | Source | Notes |
|---|---|---|---|
| Bot traffic share | 33.2% | Our Cloudflare Radar data | Q2 2026; up from 30.5% in Q1 and 30.4% a year ago |
| AI crawler share of bots | 19.1% | Our Cloudflare Radar data | Q2 2026; second-largest bot category behind search crawlers |
| Credential stuffing rate | 57.4% | Our Cloudflare Radar data | Q2 2026; down from 63.5% in Q1, of logins Cloudflare inspects |
| Modern TLS adoption | 93.9% | Our Cloudflare Radar data | Q2 2026; TLS 1.3 + QUIC combined, up 3.2 pt YoY |
| HTTP/3 adoption | 21.0% | Our Cloudflare Radar data | Q2 2026; range-bound near 21% for over a year |
| ECDSA share of new certs | 50.3% | Our Cloudflare Radar data | Q2 2026; crossed RSA, nearly double its 26.5% share a year ago |
| Let's Encrypt certificate share | 56.7% | Our Cloudflare Radar data | Q2 2026; owner-level, all ISRG intermediates (down from 68.4% YoY) |
| Mobile traffic share | 63.05% | DemandSage | Mobile-first continues |
| Organic search traffic share | 53% | DemandSage | Still the dominant source |
| Zero-click search rate | 60% | Digital Bloom / Semrush | 77% on mobile |
| AI-referred traffic growth | +632% YoY | Contentsquare | Still only 0.2% of total |
| Global internet users | 5.65B (68.7%) | DemandSage | Up 1.8% from 2024 |
| Most visited website | Google (~95B visits/mo) | Visual Capitalist | YouTube second |
| Web analytics market size | $5.2B (2026) | Piwik Pro | CAGR 17.6% through 2032 |
| AI-referred bounce rate | 53.6% | Contentsquare | Just behind social/paid |
| Mobile bounce rate increase | +54% in 2025 | Figma | Half of mobile users exit after one page |
Frequently Asked Questions
How much of web traffic is bots in 2026?
As of our Q2 2026 refresh (April–June) of Cloudflare Radar data, 33.2% of all HTTP requests are classified as bot traffic, up from 30.5% in Q1 2026 and 30.4% a year earlier. That is the cleanest "nearly one in three requests" the data has shown. Within bot traffic, AI crawlers are 19.1% and search-engine crawlers 29.6%; combined with AI-search and AI-assistant bots, AI-related activity is roughly 30% of all bots. Cloudflare's CEO has publicly stated that bot traffic will exceed human traffic by 2027, and the quarter-over-quarter jump of 2.7 points keeps that trajectory on schedule.
Which AI crawler is growing fastest in 2026?
It changes every quarter, which is the real answer, but the bigger 2026 story is the crawler whose share is falling. Googlebot's share of AI-bot traffic more than halved year over year, from 57.2% (Q2 2025) to 27.5% (Q2 2026), as the field diversified. Anthropic's ClaudeBot rose to #2 at 13.9% (from 8.3% a year ago), and ByteDance's Bytespider and Apple's Applebot each roughly quadrupled their share. Earlier in the year Applebot spiked and then reversed, which is the standing lesson here: single-quarter crawler spikes are a poor basis for projection.
Is desktop or mobile winning web traffic in 2026?
It depends entirely on whether you count bots. Cloudflare's all-traffic device split shows desktop leading at 59.6% in Q2 2026 and rising year over year, but that number is bot-inflated, because automated traffic classifies as desktop. Filter to human traffic only and mobile leads at 54.9%, with desktop at 45.1%. So mobile still wins among real people (though its human share eased about two points from Q2 2025), while the "desktop is winning" headline is really the bot-traffic story in disguise. Always name the population when you cite a device split.
Did ECDSA overtake RSA for SSL certificates in 2026?
Yes. In Q2 2026, ECDSA reached 50.3% of newly issued certificates logged in Certificate Transparency, overtaking RSA (49.7%) for the first full quarter. ECDSA's share has nearly doubled year over year, from 26.5% in Q2 2025. The shift is driven by automated, ECDSA-default issuance across the managed CA layer. Let's Encrypt still issues the majority of logged certificates (56.7%), though its share has slipped from 68.4% a year ago as Google Trust Services and other automated CAs expanded. ECDSA offers smaller keys and faster handshakes at equivalent security, so the remaining RSA share is mostly legacy inertia.
Which company's bot crawls the web the most in 2026?
Google's crawler is still the single busiest, but only just. Googlebot accounts for 27.5% of AI-bot traffic in Q2 2026, down from an outright 57.2% majority a year earlier. Behind it, Anthropic's ClaudeBot (13.9%), Meta's Meta-ExternalAgent (12.7%), and OpenAI's GPTBot (10.2%) now split most of the rest, with ByteDance's Bytespider and Apple's Applebot close behind. On the blocking side, GPTBot remains the most-disallowed crawler in robots.txt files (690 domains at the Q2 close), followed by ClaudeBot and Google-Extended.
What are the top 10 most visited websites in the world in 2026?
According to Visual Capitalist, Google remains the most visited website in the world in 2026, with nearly 95 billion monthly visits. YouTube ranks second, reinforcing Alphabet's dominance over global internet traffic. DemandSage places Google's monthly visits even higher at approximately 105 billion. The concentration of traffic at the top means these platforms are also the primary targets for the bot traffic and credential stuffing attacks we track — our Q2 2026 finding that 33.2% of requests are bots and 57.4% of inspected login attempts use leaked credentials applies disproportionately to high-traffic properties.
What are the top 20 most visited websites in the world?
According to Visual Capitalist's 2026 rankings, Google, YouTube, and Facebook hold the top three positions globally, collectively attracting hundreds of billions of monthly visits. ALM Corp reports that the top 20 most visited websites in the United States alone drive over 50 billion monthly visits collectively. From our infrastructure perspective, this extreme concentration of attention makes these platforms prime targets for the security threats we measure: credential stuffing (57.4% of inspected login attempts in Q2 2026), link-based phishing (75.8% of malicious email), and growing AI crawler activity.
What We're Watching Next Month

Applebot trajectory. A 140% month-over-month surge demands follow-up. If Applebot sustains this crawling volume, it will overtake Bingbot and potentially challenge GPTBot's share within two months. This likely signals a major Apple Intelligence feature launch — possibly Siri web answers or Safari AI summaries.
April 2026 outcome — confirmed. Applebot rose to 9.23%, passing Bingbot and closing on GPTBot.
May 2026 outcome — reversed. The surge didn't hold. Applebot fell back to 7.01% (roughly its Q1 level) and slipped behind Bingbot (8.45%) again. May's real riser was Bytespider, jumping to 10.25% to take the #4 crawler spot. Our two-month projection was right; the third month wasn't — a reminder that crawler share is volatile.
AI crawler blocking rates. With GPTBot, CCBot, and ClaudeBot all blocked by roughly 10% of domains, we're approaching a tipping point. Will the blocking rate plateau, or will high-profile publisher lawsuits push it toward 20%? The next 90 days will tell.
April 2026 outcome — partially confirmed. GPTBot remained the most-disallowed AI user-agent, with CCBot, ClaudeBot, Google-Extended and Bytespider clustered behind it in the same order as Q1.
May 2026 outcome — ranking holds, rate keeps drifting up. As of June 1, GPTBot is disallowed by 529 of 4,072 analyzed domains (13.0%), with CCBot (463), ClaudeBot (457), Google-Extended (417), and Bytespider (395) behind it in the unchanged order. The blocking rate is creeping up — GPTBot is now blocked by ~13% of domains versus ~11.7% in Q1 — but there's still no step-change toward 20%.
Credential stuffing direction. The 3.26-point drop in compromised credentials is the first meaningful improvement we've seen. Is this a trend or noise? If passkey adoption continues to accelerate across major identity providers, this number should decline further.
April 2026 outcome — trend, not noise. Compromised credential rate fell again to 59.51% (-0.74 pts). Two consecutive months of decline.
May 2026 outcome — trend confirmed. The rate fell again to 56.96% (-2.55 pts), a third consecutive monthly decline and the steepest of the three. The direction is now firmly established, though compromised credentials remain the majority of login attempts.
HTTP/3 at 21%. The protocol has stalled at this level for two consecutive months. The next catalyst is likely server-side adoption by AWS CloudFront and major hosting providers beyond Cloudflare and Google.
April 2026 outcome — plateau extended to three months. HTTP/3 at 21.0% in April. No catalyst arrived.
May 2026 outcome — plateau now four months. HTTP/3 at 21.2% in May, still range-bound within 0.6 points. Still no catalyst. Watching CloudFront and Akamai posture into the second half of 2026.
AI-referred traffic quality. Contentsquare reports 53.6% of AI-referred traffic is bouncing. As AI search platforms mature and crawling volumes increase, we'll track whether AI-referred traffic converts better or continues to bounce at rates close to paid social.
What May 2026 resolved
WAF retook the L7 lead. The tiebreaker went to WAF: 50.95% versus DDoS rules' 44.22%. Across Q1 → April → May the lead changed hands three times, so the durable takeaway is "keep both layers tuned," not "one won."
ECDSA crossed RSA. May was the first month ECDSA majority-issued new certificates (50.21% vs 49.79%). The milestone the April update projected for Q2 landed.
Email phishing escalated again. Link phishing reached 79.58% and scam flags jumped to 67.21%. But the across-the-board, overlapping rise across nearly every threat category warrants the classifier-recalibration caveat noted earlier — so we're treating the magnitudes as approximate while the direction is clear.
What we're watching for the next update
Does ECDSA hold its new majority? A 0.4-point lead is a crossover, not a rout. We'll watch whether ECDSA extends the gap or RSA claws back.
Bytespider vs Applebot. May's riser was Bytespider, not April's Applebot — which round-tripped to its starting point. We'll track whether Bytespider sustains its #4 position or follows Applebot's reversal.
Bot share toward the 2027 crossover. At 32.6% and climbing roughly a point a quarter, the human/bot crossover Cloudflare's CEO flagged for 2027 stays on schedule. We'll keep marking the pace.
This briefing covers the internet at the macro level — traffic flows, security threats, protocol shifts, and 2026 internet traffic statistics that affect every business online. We update this analysis monthly using the same Cloudflare Radar methodology.
For company-level technology intelligence — which specific companies use which technologies, who's adopting, who's churning, and who to contact — explore TechnologyChecker.io.
Methodology
All data in this briefing was sourced from the Cloudflare Radar API (radar.cloudflare.com). The following endpoints were queried:
- HTTP Analytics (get_http_data): bot classification, TLS versions, HTTP versions
- Bot Intelligence (get_bots_data): bot category distribution
- AI Insights (get_ai_data): AI crawler user agent distribution
- Robots.txt Analysis (get_robots_txt_data): crawler blocking rules across 4,055 domains
- Credential Leak Detection (get_leaked_credentials_data): compromised vs. clean authentication requests
- Email Security Analytics (get_email_security_data): email threat categories
- Attack Analytics (get_l3_attack_data, get_l7_attack_data): DDoS and application attack trends
- DNS Analytics (get_dns_queries_data): query type distribution from 1.1.1.1 resolver
- Certificate Transparency (get_certificate_transparency_data): public key algorithms and CA distribution
Time periods: The Q1 2026 baseline covers March 11 through April 10, 2026 (30 days), with month-over-month comparisons against the preceding 30-day control period (February 9 through March 11, 2026). The June 2026 update re-queried every endpoint for the full calendar month of May 2026 (May 1–31, 2026); robots.txt blocking counts reflect the June 1, 2026 snapshot of 4,072 parsed files. The July 2026 update re-pulled every metric for the full Q2 2026 calendar quarter (April 1 – June 30, 2026) alongside the same quarter of 2025 (April 1 – June 30, 2025) for year-over-year comparison, with robots.txt counts from the Q2-close snapshot; certificate-algorithm and CA-owner shares are computed from raw Certificate Transparency issuance counts. All percentages are normalized by Cloudflare Radar's standard methodology.
Geographic scope: Global (no location filters applied).
Data source: Cloudflare Radar API (radar.cloudflare.com) Analysis and insights by TechnologyChecker.io
David Thomson
CTO

