We analyzed HTTP protocol adoption in 2026: 27.8% of the web still runs HTTP/1.x (July 2026 Update)
At the Q2 2026 close HTTP/1.x holds 27.8%, HTTP/2 leads at 51.2%, and HTTP/3's plateau is now a full year old (20.5% to 21.0% year over year). Our Cloudflare Radar refresh adds the year-over-year picture: post-quantum crypto crossed the majority of requests (28.9% to 54.2%) while barely reaching origins (9.6%), the Russia anomaly reverted exactly as predicted, and the Netherlands overtook Singapore as the HTTP/1.x leader.
Published •Updated •70 min read

HTTP/1.x still carries 27.84% of all web requests in Q1 2026. The protocol was finalized in 1999. It's been superseded twice. And it's still here.
HTTP/2 sits at 51.04%. HTTP/3 at 21.11%. I pulled 30 days of Cloudflare Radar data (March 10 through April 9, 2026), cross-referenced it against HTTP Archive's 2024 Web Almanac, Qualys SSL Labs, and a peer-reviewed paper from the 2024 ACM Web Conference. The "HTTP/3 is rapidly taking over" narrative doesn't match what's actually running on the wire. The reason isn't laziness. It isn't cost. It's physics.
What we found after cross-referencing Cloudflare Radar against HTTP Archive, W3Techs, SSL Labs, and academic research:
- July 2026 update (Q2 close): the full quarter extends the equilibrium to a full year (it was five months old at the June update). HTTP/2 51.16%, HTTP/1.x 27.80%, HTTP/3 21.04% (up just 0.54 points from 20.50% in Q2 2025). The year-over-year milestone is post-quantum: PQ key exchange crossed the majority of requests (28.96% to 54.15%) while reaching only 9.58% of origins, and the Russia anomaly reverted exactly as predicted. See the Q2 2026 close section.
- June 2026 update — through full-month May data, the three-protocol split barely moved (HTTP/2 51.08%, HTTP/1.x 27.72%, HTTP/3 21.20%), making the HTTP/3 plateau five months old. China's HTTP/1.x climbed a third straight month to 48.55% (confirming our April call), Russia threw an 8-point one-month anomaly we treat as a routing artifact, and post-quantum support (53.71%) pulled further ahead of HTTP/3. See the new month-by-month breakdown.
- HTTP/1.x holds 27.84% of global web requests at the request level, for a protocol finalized in 1999 that refuses to die
- HTTP Archive's 2024 Web Almanac shows only 15% HTTP/1.1 in clean browser crawls. The 12.84 percentage point gap is bot and server-to-server traffic
- HTTP/2 is the quiet consolidator at 51.04%, up 0.58 points month over month
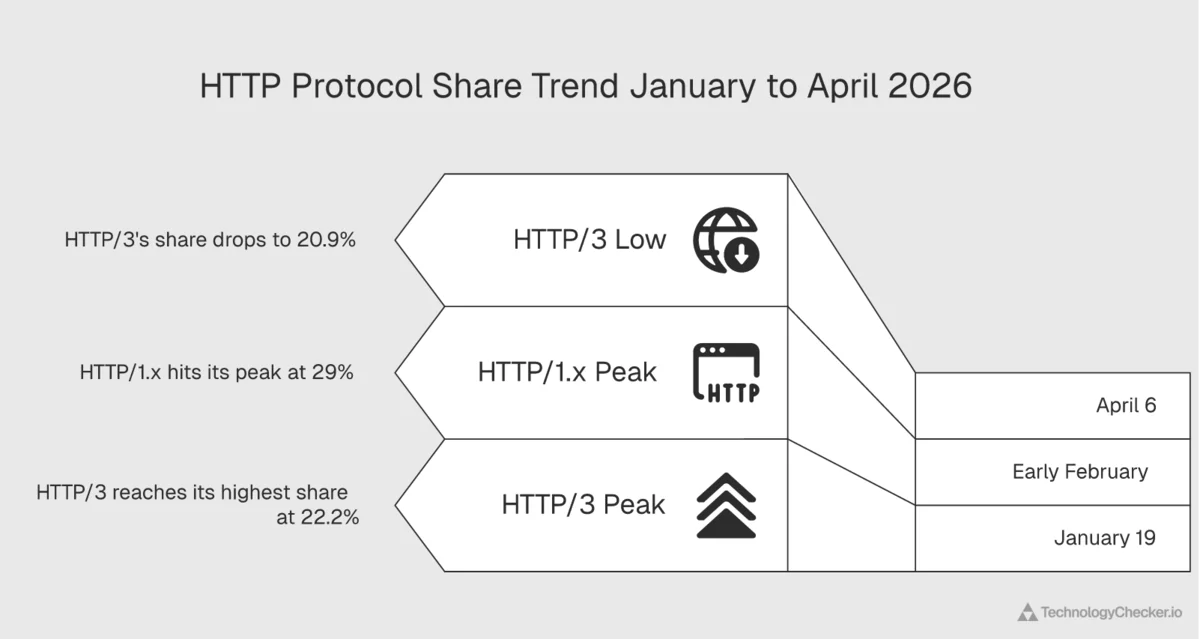
- HTTP/3 has actually declined from 22.16% (Jan 19 peak) to 20.88% in early April. Cloudflare's own data shows HTTP/3 was at 28% in May 2023. The arc inverted
- A 2024 ACM Web Conference paper shows QUIC suffers up to 45.2% data rate reduction vs HTTP/2 above 500 Mbps. That's the structural explanation for the plateau
- W3Techs reports 38.8% of websites "support" HTTP/3, but only 21.11% of requests actually use it. The gap is
alt-svcheaders no browser ever follows up on- 94.65% of web requests are encrypted. Qualys SSL Labs reports 75.3% of top websites support TLS 1.3. The encryption war is over
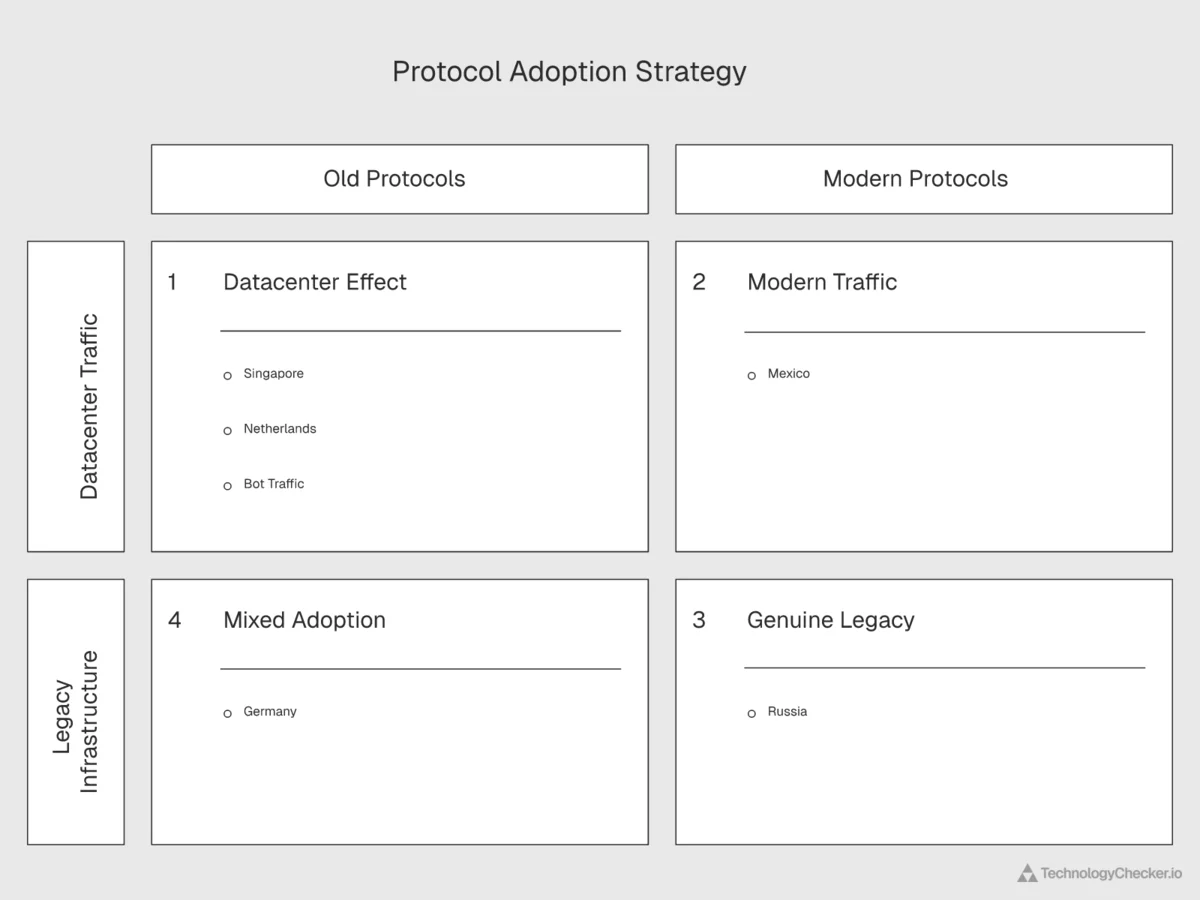
- Singapore (52.24%) and Netherlands (50.99%) have the highest HTTP/1.x share. Not because they're legacy markets
- Russia is the genuine laggard: 37.19% HTTP/1.x combined with 13.68% TLS 1.2, more than double the global TLS 1.2 share
- 31.08% of all internet requests come from bots. Bots keep HTTP/1.x alive more than any legacy CMS
Before I get into the numbers, a quick note on where I'm coming from. I spent five years at Google on the Search team working on crawling and indexing infrastructure. Running a crawler at scale teaches you quickly that the HTTP version on the wire is rarely the HTTP version you would choose if you got to redesign things. I now run engineering at TechnologyChecker from Edinburgh, where our detection systems fingerprint the HTTP, TLS, and server technology of 29.9 million active domains every month. When I look at Cloudflare Radar's Q1 2026 data — now extended through full-month May — I'm reading it against a decade of my own operational experience with what actually happens inside crawlers, CDNs, and API gateways.
The data tells a more complicated story than the one you'll read in most 2026 protocol adoption posts. HTTP/2 is winning the consolidation fight. HTTP/3 has plateaued, and the reason is measurable, not vibes-based. HTTP/1.x is sticky for reasons that have nothing to do with lazy sysadmins. Cloudflare's own documentation frames HTTP/3 as the future, and the RFC 9114 specification has been stable since 2022. But stable specs don't automatically translate to traffic, and nothing in the actual Q1 2026 measurements suggests HTTP/3 is on an accelerating curve.
Here's what the protocol data reveals when you read it closely, and when you compare it against three other independent sources.
Updated July 2, 2026 for the Q2 close. Q2 has finished, and for the first time I can put a clean year against the plateau: Q2 2025 versus Q2 2026, the same three months a year apart. Two things stand out. First, the HTTP/3 plateau isn't five months old anymore, it's a full year old. HTTP/3 was 20.50% of requests in Q2 2025 and 21.04% in Q2 2026, a move of half a percentage point across twelve months. Second, the protocol transition that actually moved is the one nobody writes about: post-quantum key exchange went from a minority to a majority of requests in a year, while HTTP/3 sat still. If you want the one-sentence version of 2026's protocol story, it's that the invisible migration lapped the visible one.
Where HTTP Protocol Adoption Stands at the Q2 2026 Close, With the Year-Over-Year Picture
Here's the full protocol picture across three windows: Q2 2025 (the year-ago seasonal baseline), Q1 2026 (last quarter), and Q2 2026 (the close). The year-over-year column is the one the earlier editions of this post, which only ran back to January 2026, couldn't show.
| Metric | Q2 2025 | Q1 2026 | Q2 2026 | YoY (Q2→Q2) |
|---|---|---|---|---|
| HTTP/2 share | 50.18% | 50.33% | 51.16% | +0.98 pt |
| HTTP/1.x share | 29.32% | 28.11% | 27.80% | −1.52 pt |
| HTTP/3 share | 20.50% | 21.56% | 21.04% | +0.54 pt (flat) |
| HTTPS share | 93.29% | 94.29% | 94.56% | +1.27 pt |
| TLS 1.3 share | 68.74% | 70.70% | 71.71% | +2.97 pt |
| TLS 1.2 share | 8.92% | 6.50% | 6.07% | −2.85 pt |
| Modern TLS (1.3 + QUIC) | 90.68% | 93.48% | 93.91% | +3.23 pt |
| Post-quantum requests | 28.96% | 50.49% | 54.15% | +25.19 pt |
| Post-quantum origins (X25519MLKEM768) | 1.56% | 9.42% | 9.58% | +8.03 pt |
| Bot share of requests | 30.39% | 30.54% | 33.21% | +2.83 pt |
| IPv6 share | 29.58% | 29.43% | 29.57% | Flat |
Source: Cloudflare Radar — http/summary/{http_version, tls_version, http_protocol, post_quantum, bot_class, ip_version} and post_quantum/origin/summary/key_agreement, Q2 2025 / Q1 2026 / Q2 2026, pulled 2026-07-02.
The HTTP/3 plateau is a full year old now, not five months
The headline of the June refresh was that HTTP/3 had held near 21% for five straight months. The Q2 close turns that into a full year. HTTP/3 was 20.50% of requests in Q2 2025 and 21.04% in Q2 2026. That is the flattest twelve-month stretch in the protocol's published history, and it settles a question the monthly data could only hint at. This isn't a pause between moves. It's the equilibrium. Over the same year HTTP/2 gained about a point (50.18% to 51.16%) and HTTP/1.x lost about a point and a half (29.32% to 27.80%). The share that actually moved traded between HTTP/2 and HTTP/1.x, exactly the see-saw the monthly section identified, and HTTP/3 wasn't part of it. A year of data says what five months could only suggest: HTTP/2 is the protocol eating share, and it's eating it from the old end, not the new one.
I want to be precise about what "flat" means here, because it's easy to over-read. HTTP/3 didn't fail. It's a genuinely better protocol on the networks where it wins, and its 21% is real, sticky share. What the year of data rules out is the "HTTP/3 is on an accelerating curve to dominance" story that most 2024 forecasts told. On the wire, across a full year, that curve is a flat line.
Post-quantum crossed the majority on the client side, and barely reached origins
This is the number that reframes the whole post. A year ago, 28.96% of requests used a post-quantum-capable key exchange (the X25519MLKEM768 hybrid). At the Q2 2026 close it's 54.15%. Post-quantum key exchange went from a minority to a clear majority of web requests in twelve months, while HTTP/3 moved half a point. That is the contrast I kept flagging in the June update, now sized against a full year: the transition that ships invisibly inside a TLS-library upgrade (you bump OpenSSL, you get post-quantum) moves far faster than the one that needs coordinated changes across the transport, crypto, and application layers. Post-quantum added twenty-five points of share in the same year HTTP/3 added half a point.
The net-new cut this quarter is the other side of that handshake. The 54% figure is the client-to-edge leg, where Cloudflare terminates TLS. When I pulled the origin-facing leg, the one measuring what Cloudflare negotiates with the origin servers behind it, post-quantum support sits at just 9.58% of origins. A year ago it was 1.56%, so it has grown roughly six-fold, but it plateaued this quarter (9.42% in Q1, 9.58% in Q2) and it's a long way behind the client side. The asymmetry is the story. The browser-to-edge internet is already majority post-quantum because a handful of large edges flipped it on for everyone. The edge-to-origin internet, which depends on millions of individual origin operators upgrading their own TLS stacks, is stuck below 10%. It's the same two-sided-market shape that keeps DNSSEC and HTTP/3 low: one side moves with a config flag, the other needs a fleet to act.
Source: Cloudflare Radar — http/summary/post_quantum (client) and post_quantum/origin/summary/key_agreement (origin, X25519MLKEM768), Q2 2025 / Q2 2026, pulled 2026-07-02.
TLS kept modernizing while HTTP/3 stood still
The clean contrast to the HTTP/3 plateau is TLS, which moved steadily all year. TLS 1.3 rose from 68.74% to 71.71% of requests, TLS 1.2 fell from 8.92% to 6.07%, and the truly deprecated versions all but vanished: TLS 1.0 dropped from 0.393% to 0.014%, and TLS 1.0 and 1.1 combined now account for 0.017% of requests, which rounds to nothing. Modern TLS (1.3 plus QUIC) reached 93.91%. This is what a healthy, if unglamorous, protocol migration looks like: slow, monotonic, and driven by library defaults rather than roadmaps. The reason TLS 1.3 could climb while HTTP/3 couldn't is the same reason post-quantum could. TLS version lives in the handshake, upgradeable with a package bump, while HTTP/3 needs every layer to move in lockstep.
The Russia anomaly reverted, exactly as the framework predicted
The June update ended on a cliffhanger I promised to resolve. Russia had shed eight points of HTTP/1.x and three points of TLS 1.2 in a single month (May), and I refused to call it modernization, arguing that when the HTTP signal and the TLS signal swing hard together in thirty days, it's the traffic mix routing through Cloudflare that changed, not the servers. I said if June reverted it was an artifact, and if June held it was real. June reverted. Russia's HTTP/1.x snapped back to 38.99% in June, right where it sat before the May dip. The two-signal framework called it correctly: the one-month swing was a routing artifact, not a fleet upgrade, and anyone who had written "Russia is modernizing" into a plan off the May number would have been wrong a month later.
There's a more interesting second half to this, though, and it only shows up in the year-over-year cut. Russia's TLS 1.2 share did not bounce back. It was 20.33% in Q2 2025 and 10.08% in Q2 2026, and it held near 11% in June rather than returning to 20%. So while the dramatic one-month HTTP move was noise, Russia's TLS stack genuinely modernized over the year, cutting its TLS 1.2 share in half. That's the distinction the framework is built to draw: the eight-point one-month HTTP swing was an artifact; the ten-point year-long TLS decline is a trend. Infrastructure doesn't refresh eight points in a month, but it can refresh ten points in a year. Russia also consolidated onto HTTP/2 over the year (40.02% to 54.77%), pulling away from both HTTP/1.x and HTTP/3, whose share there fell from 19.99% to 12.03%.
Country year-over-year: the Netherlands took the HTTP/1.x crown from Singapore
The country picture over a full year confirms the bandwidth-regime thesis and hands the HTTP/1.x leaderboard a new number one.
| Country | HTTP/1.x Q2 2025 | HTTP/1.x Q2 2026 | HTTP/3 Q2 2025 | HTTP/3 Q2 2026 | Read |
|---|---|---|---|---|---|
| Netherlands | 49.23% | 52.58% | 11.96% | 10.32% | New HTTP/1.x #1 |
| Singapore | 54.51% | 50.31% | 5.73% | 8.49% | Ceded the top spot |
| China | 48.10% | 47.79% | 17.48% | 14.58% | Flat-high all year |
| United States | 36.12% | 34.87% | 15.89% | 15.24% | Eased |
| France | 22.02% | 31.19% | 23.03% | 21.92% | Volatile (datacenter mix) |
| Brazil | 20.37% | 23.46% | 30.19% | 28.26% | HTTP/3 eased |
| India | 16.36% | 18.17% | 24.32% | 30.26% | HTTP/3 +5.9 pt |
| Italy | 15.84% | 15.03% | 28.37% | 30.36% | Still the HTTP/3 leader |
Source: Cloudflare Radar — http/summary/http_version with location filter, Q2 2025 / Q2 2026, pulled 2026-07-02.
Two moves are worth naming. The Netherlands overtook Singapore as the highest-HTTP/1.x country in the sample: Dutch HTTP/1.x rose to 52.58% while Singapore's eased to 50.31%, and the two crossed over the year. Both are still the same datacenter-paradox story the post is built on (high HTTP/1.x sitting on modern TLS, so it's server-to-server and bot traffic, not legacy websites), but the crown changed hands. On the other end, India's HTTP/3 climbed nearly six points to 30.26%, joining Italy above the 30% mark and reinforcing that HTTP/3 grows exactly where the bandwidth regime keeps it in its favorable zone.
France deserves a caution flag rather than a headline. Year over year its HTTP/1.x is up nine points (22.02% to 31.19%), which looks like it contradicts the June update's "France is declining" read. Both are true, and the contradiction is the lesson: France ran 22% a year ago, spiked to 37.5% in Q1 2026, and has been falling back through the spring toward 31%. It's a datacenter country whose HTTP/1.x share swings with whatever server-to-server traffic happens to route through French cloud regions that quarter. The within-year decline and the year-over-year rise aren't in conflict; they're both symptoms of a number that bounces. It's the single best argument in the dataset for why I keep insisting country HTTP/1.x is a noisy signal you should never read in isolation.
Everything below this point is the earlier record, preserved in full: the June 2026 refresh (the month-by-month January–May series, the country moves, and the three predictions it posed) directly following, then the original Q1 2026 baseline, the 90-day trend, the country and TLS deep dives, and the methodology. Nothing there was rewritten; the Q2 close is layered on top.
How Did HTTP Protocol Adoption Evolve Through May 2026?
According to Cloudflare Radar, HTTP/3 held at 21.20% of global web requests in May 2026 — a fractional uptick that keeps the plateau intact into its fifth month — while HTTP/2 sat at 51.08% and HTTP/1.x held its floor at 27.72%. The headline story in May wasn't the global split, which barely moved; it was the country level. China's HTTP/1.x climbed a third straight month to 48.55%, confirming the call we made in April. Russia, the post's designated "genuine legacy anchor," threw an 8-point one-month swing we read as a routing artifact, not modernization. We re-pulled every HTTP, TLS, IP-version, post-quantum, and bot metric for the full calendar month of May 2026 to see which trajectories held. Updated June 1, 2026.
Five months of HTTP/3 stuck near 21% maps directly to what I see across our own crawler infrastructure. We added HTTP/3 support to our scanners in late 2024, and the share of origins that actually negotiate it has climbed from negligible to roughly 1 in 5 — and stopped there. The breakthrough catalyst still hasn't arrived. From the operator side, this isn't a stalled rollout, it's protocol equilibrium: HTTP/2 is doing the work HTTP/3 was supposed to do, and the marginal benefit of QUIC isn't covering its operational cost above 500 Mbps for most origins. May's micro-uptick (+0.13 points vs my clean April pull) is noise inside that equilibrium, not the start of a breakout.
HTTP/3 didn't break out, and it didn't resume its decline either — the plateau is now genuinely flat. The action moved to the country level, and one move (Russia) is large enough that I'll spend a paragraph below explaining why I don't believe it.
Which Cloudflare Radar Metrics Changed Most Between Q1 2026 and May 2026?
May figures below are clean per-calendar-month pulls (May 1–31). The April column carries the published 30-day-window figures from the previous update, so treat sub-0.3-point April→May moves as flat — the methodology note at the foot of the post explains the window difference.
| Metric | Q1 2026 | April 2026 | May 2026 | Net direction |
|---|---|---|---|---|
| HTTP/2 share of requests | 51.04% | 51.33% | 51.08% | Flat — plateau |
| HTTP/1.x share of requests | 27.84% | 27.63% | 27.72% | Floor holds |
| HTTP/3 share of requests | 21.11% | 21.04% | 21.20% | Plateau, 5th month |
| HTTPS share | 94.65% | 94.32% | 94.47% | Saturated |
| TLS 1.3 share | 71.51% | 71.74% | 71.50% | Flat |
| TLS QUIC share | 22.19% | 22.17% | 22.38% | Tracks HTTP/3 |
| TLS 1.2 share | 6.29% | 6.06% | 6.10% | Floor |
| Modern TLS (1.3 + QUIC) | 93.70% | 93.92% | 93.88% | Saturated |
| Bot share of HTTP requests | 31.08% | 32.00% | 32.58% | Rising, 3rd month |
| IPv6 share of requests | ~20% | 29.54% | 29.65% | Holds the jump |
| Post-quantum supported | — | 52.74% | 53.71% | Pulling ahead of HTTP/3 |
| Netherlands HTTP/1.x | 50.99% | 50.89% | 51.74% | Now clearly #1 |
| China HTTP/1.x | 44.43% | 47.07% | 48.55% | Widening, 3rd month |
| Singapore HTTP/1.x | 52.24% | 47.89% | 48.43% | April dip didn't continue |
| France HTTP/1.x | 37.54% | 31.89% | 29.70% | Datacenter shift continues |
| Russia HTTP/1.x | 37.19% | 37.60% | 29.57% | Anomalous −8 pt (see below) |
| Russia TLS 1.2 | 13.68% | 12.40% | 9.00% | Moved with HTTP/1.x |
| Brazil HTTP/1.x | 16.08% | 21.05% | 24.97% | Climbing, mobile-first market |
| India HTTP/3 | 29.13% | 29.46% | 29.81% | Lead holds |
| Italy HTTP/3 | 30.20% | 30.29% | 30.60% | Still #1 |
| Mexico HTTP/1.x | 12.84% | 12.09% | 11.63% | Cleanest profile gets cleaner |
Which April 2026 Narratives Did May Confirm, Reverse, or Extend?
1. The China call held — three straight months up. In April I wrote that "China is plausibly the only major market where HTTP/1.x share trends up through 2026." That was a falsifiable prediction, and May confirmed it: China's HTTP/1.x went 44.43% (Q1) → 47.07% (April) → 48.55% (May), the only major market with a clean three-month upward trend. The Great Firewall's preference for TCP over UDP, plus the later HTTP/3 rollout from Tencent Cloud and Alibaba Cloud, hasn't eased — it's compounding. China now sits within striking distance of the Netherlands at the top of the HTTP/1.x leaderboard, for entirely different structural reasons.
2. The Russia anomaly — a number I don't believe yet. Russia is the post's headline "genuine legacy" country: high HTTP/1.x and high TLS 1.2, both signals pointing at neglected infrastructure. In May, both signals collapsed at once — HTTP/1.x fell from 37.60% to 29.57% (−8.0 pt) and TLS 1.2 from 12.40% to 9.00% (−3.4 pt), while TLS 1.3 jumped from the high-60s to 78.99%. Here's the honest read: Russia's infrastructure did not modernize 8 points in 30 days. When HTTP version and TLS version both swing by implausible amounts in the same month, the two-signal framework this post is built on says the same thing it said about Singapore in April — the mix of traffic routing through Cloudflare changed, not the underlying servers. Sanctions-era Russian routing is volatile, and which networks transit Cloudflare shifts month to month. I'm flagging the move, not banking it. If June reverts, it was an artifact; if June holds, it's the first real signal that Russian infrastructure is being refreshed. I'd rather under-call a real shift by a month than write an artifact into anyone's roadmap.
3. Singapore's April "crack" was a one-month dip, not a trend. In April, Singapore dropped 4.35 points of HTTP/1.x in a single month and I flagged it as probably a routing change rather than modernization. May settled the question: Singapore ticked back up to 48.43% (+0.54), and its TLS 1.3 recovered to 80.28%. The dip didn't compound into a trend, which supports the "traffic-mix artifact" read over the "Singapore is modernizing" read. It's still below its Q1 52.24%, so the country is no longer the single cleanest example of the datacenter paradox — but it didn't fall off a cliff either.
4. France's decline is now a two-month trend. France kept sliding — 37.54% (Q1) → 31.89% (April) → 29.70% (May). Two consecutive months of decline in a datacenter-heavy market reads as a durable re-cut of server-to-server traffic mix, not a blip. Unlike Russia, the France move is gradual enough to be believable as a real shift in what's flowing through French cloud regions.
Which Q1 2026 HTTP Adoption Patterns Held Through May?
HTTP/2 stayed the workhorse at 51.08% of global requests — five months inside a 1.4-point band (49.78% to 51.18%). Italy held the global #1 spot for HTTP/3 at 30.60% (up from 30.29%), and India held second at 29.81%. Both are under-500-Mbps median-bandwidth countries, exactly where the ACM 2024 paper predicts HTTP/3 keeps its performance edge. Mexico stayed the cleanest modernization profile in the dataset — just 11.63% HTTP/1.x against 66.87% HTTP/2. The "fast networks stall HTTP/3, slow networks accelerate it" framing from the original post survives May unchanged. Bot share rose for a third straight month to 32.58%, and the encryption layer stayed saturated at 94.47% HTTPS.
Did Post-Quantum Cryptography Extend Its Lead Over HTTP/3 in May 2026?
Yes, and the gap is now the most underreported story in the dataset. Post-quantum-capable key exchange (typically X25519MLKEM768) reached 53.71% of TLS handshakes in May, up from 52.74% in April — a full point of monthly growth, versus HTTP/3's flat 21%. The post-quantum migration crossed its majority threshold in April and kept climbing in May without any industry coverage, while HTTP/3 adoption has been stuck for five months with near-constant coverage. The contrast is the point: protocol transitions that ship invisibly inside TLS libraries (you upgrade OpenSSL, you get PQ) move far faster than transitions that require coordinated changes across transport, crypto, and application layers (HTTP/3). The easy migration is winning the race nobody is watching.
How Does the May 2026 Update Affect Q1 2026 Findings?
The Q1 numbers in the sections below remain the right baseline for understanding where 2026 started. The full month-by-month progression — and the country-level moves that the quarterly averages smoothed over — now live in a dedicated month-by-month section. Where May meaningfully shifts the picture (the China confirmation, the Russia anomaly, the post-quantum lead), we've updated the inline notes alongside the original Q1 tables. Methodology, scope, and reading frame are unchanged.
Month-by-month: how HTTP protocol adoption moved across 2026
The Q1 figures above are a 90-day average, and the April/May updates are single-month snapshots. Neither shows you the shape of 2026. So we re-cut every month of the year as its own clean calendar-month pull. The monthly view is where the real story lives — it exposes a bot-driven bump the quarterly average smoothed over, and it shows the HTTP/3 plateau as the flattest stretch in the protocol's published history.
| Month | HTTP/2 | HTTP/1.x | HTTP/3 | HTTPS |
|---|---|---|---|---|
| January | 50.15% | 28.45% | 21.40% | 93.88% |
| February | 49.78% | 28.54% | 21.68% | 94.08% |
| March | 50.77% | 27.91% | 21.33% | 94.51% |
| April | 51.18% | 27.75% | 21.07% | 94.41% |
| May | 51.08% | 27.72% | 21.20% | 94.47% |
Three things only show up at monthly resolution.
The February HTTP/1.x bump was real, and it was bots. HTTP/1.x sat at 28.45% in January and 28.54% in February, then fell to a 27.7% floor for the rest of the spring. In the original Q1 post I theorized that early-February's HTTP/1.x spike was scraping traffic ahead of quarterly earnings, since scraping frameworks lean on HTTP/1.1 clients. The monthly re-cut confirms the shape at lower noise: legacy share was genuinely ~0.8 points higher in Jan–Feb than it is now, and it didn't stick. If you'd only seen the Q1 average (27.84%), you'd have missed that the quarter contained a bot-driven bump and a return to floor inside it.
HTTP/2 and HTTP/1.x are the see-saw — not HTTP/2 and HTTP/3. Watch February: HTTP/2 fell to its low of 49.78% in exactly the month HTTP/1.x peaked at 28.54%. As the bot bump faded, HTTP/2 climbed back to ~51%. HTTP/3 barely flinched through all of it. The common framing that "HTTP/3 is taking share from HTTP/2" has it backwards at the monthly level: the share that actually moves month to month trades between HTTP/2 and HTTP/1.x, driven by how much automated traffic is on the wire. HTTP/3's share is set by a slower variable — what fraction of origins and bandwidth regimes keep QUIC in its favorable zone — and that variable hasn't moved in five months.
The HTTP/3 plateau is the flattest stretch in its published history. Across five months, HTTP/3 ranged from 21.07% to 21.68% — a 0.6-point band. Cloudflare's own historical posts show HTTP/3 moving in multi-point swings year to year (28% in May 2023, retreating since). Five months inside 0.6 points isn't a pause between moves. It's the equilibrium itself.
Where HTTP/3 actually lives: the country split the global average hides
The 21.20% global HTTP/3 figure is an average of two very different worlds. Split the May data by country and the bandwidth-regime story from the ACM 2024 paper jumps out: HTTP/3 thrives in mobile-first, sub-500-Mbps markets and stalls in datacenter-heavy, high-bandwidth ones.
| Where HTTP/3 leads (May) | HTTP/3 | Where HTTP/3 lags (May) | HTTP/3 |
|---|---|---|---|
| Italy | 30.60% | Singapore | 9.24% |
| India | 29.81% | Netherlands | 10.40% |
| Brazil | 27.82% | Russia | 11.28% |
| France | 22.47% | China | 14.37% |
| Mexico | 21.49% | United States | 15.39% |
| Japan | 21.24% | Germany | 17.95% |
The leaders are mobile-first markets where the last-mile edge is overwhelmingly modern CDN and median bandwidth sits below the 500 Mbps threshold where QUIC keeps its advantage. The laggards split into two groups: datacenter hubs whose traffic is dominated by server-to-server HTTP/1.1 (Singapore, Netherlands), and structurally constrained markets (Russia, China). Reading a single global HTTP/3 number tells you almost nothing — the 3.3x spread between Italy (30.60%) and Singapore (9.24%) is the actual signal.
David Thomson, CTO, on why one-month country swings are a trap: "The most expensive mistake in protocol analysis is treating a one-month country swing as a trend and writing it into a roadmap. Russia just shed 8 points of HTTP/1.x and 3 points of TLS 1.2 in a single month. My instinct after a decade of running crawl infrastructure — first at Google on the Search team, now fingerprinting 29.9 million active domains from Edinburgh — isn't 'Russia modernized.' It's 'which networks are routing through Cloudflare changed.' Infrastructure doesn't refresh 8 points in 30 days; traffic mix does. The discipline is to flag the move, wait a month, and let June tell you whether it was a fleet upgrade or a routing artifact. I'd rather under-call a real shift by one month than over-call an artifact and have someone build a plan on it. The country numbers I actually trust are the ones that move slowly and in one direction — China's HTTP/1.x climbing three months straight is worth more than any single dramatic swing."
Three generations of HTTP running at the same time
Three generations of HTTP protocol are running in parallel right now. The numbers for the 30 days ending April 9, 2026 are remarkably tight:
| Protocol | Finalized | Q1 2026 Share | MoM Change |
|---|---|---|---|
| HTTP/2 | 2015 (RFC 7540) | 51.04% | +0.58 pp |
| HTTP/1.x | 1997/1999 (RFC 2068 / 2616) | 27.84% | -0.14 pp |
| HTTP/3 | 2022 (RFC 9114) | 21.11% | -0.45 pp |
May 2026 update: HTTP/2 51.08%, HTTP/1.x 27.72%, HTTP/3 21.20%. The three-protocol distribution is again essentially unchanged — and that's now the headline. Five consecutive months inside a sub-1-point band on every protocol is no longer a "trend stabilizing"; it's an equilibrium that has lasted long enough to plan around. HTTPS held flat at 94.47%, and modern TLS (1.3 + QUIC) at 93.88%. If you're waiting for the protocol mix to "settle" before making an infrastructure decision, it already has.
HTTP/2 gained 0.58 percentage points month over month. HTTP/1.x slipped 0.14 points. HTTP/3 actually fell 0.45 points. Those changes are small, but the direction matters. This isn't a market where the newest protocol is accelerating at the expense of the oldest. HTTP/2 is eating share from both ends.
The HTTP/1.x number deserves a moment of context. The protocol was first standardized in 1997 with RFC 2068, then refined in 1999 with RFC 2616. The engineers who wrote it assumed a web of text documents and images. They didn't design for real-time applications, parallel resource loading, or the 100-request-per-page modern web. Yet 27.84% of every request Cloudflare saw in the last 30 days still used it.
Three sources, three different numbers, one story
The most useful thing you can do with any single data source is compare it against a second and third. I pulled two other independent measurements for this post. The numbers don't agree, and that disagreement is itself the insight.
| Source | Methodology | HTTP/1.1 Share | HTTP/2+ Share | HTTP/3 Share |
|---|---|---|---|---|
| Cloudflare Radar (Q1 2026) | Request-level, all traffic | 27.84% | 51.04% | 21.11% |
| HTTP Archive 2024 Web Almanac | Fresh browser crawl, request-level | 15% | 85% | 7-9% (direct) |
| W3Techs (April 2026) | Website-level "support" | 21-22% | 78-79% | 38.8% |
Read this table carefully. Each source gives a different answer because each source measures a different thing.
Cloudflare Radar measures every request that passes through Cloudflare's network. That includes bots, automated monitoring, API traffic, CI/CD runners, and anything that hits an endpoint Cloudflare proxies. It's the closest thing we have to a "true" request-level share, though it inevitably reflects the characteristics of Cloudflare's customer base, which skews heavy on SaaS, hosting, and security.
HTTP Archive takes a fundamentally different approach. The Web Almanac crawls websites using fresh browser profiles to ensure cache-free measurements. They measure 15% HTTP/1.1 at the request level. But their methodology explicitly excludes the non-browser web: bots, scraping tools, API clients, and the entire server-to-server layer.
W3Techs counts websites, not requests. Their April 2026 data shows HTTP/3 at 38.8% "support," but "support" here means the site advertises HTTP/3 via alt-svc headers or DNS HTTPS records. The HTTP Archive team documented this gap in 2024: sites advertise HTTP/3 far more often than browsers actually use it, because HTTP/3 requires "prior discovery through alt-svc headers or DNS records before browsers attempt connections." Many first-visit page loads never negotiate to HTTP/3 at all.
The 12.84 percentage point gap between HTTP Archive's 15% HTTP/1.1 and Cloudflare Radar's 27.84% HTTP/1.1 is the single most interesting number in this entire analysis. I'll come back to it later when I explain the datacenter paradox. That gap isn't noise. It's the measurable footprint of the entire non-browser web: every bot, every curl script, every Python requests call, every Go default client, every CI/CD job, every monitoring probe. HTTP Archive filters them out. Cloudflare Radar captures them.
At scale, Cloudflare handles a substantial portion of global web traffic. According to their own 2024 Application Security report, their network processes tens of millions of HTTP requests per second at peak. A 27.84% HTTP/1.x share represents billions of requests per day still using a 27-year-old protocol. That isn't a rounding error. It's a persistent feature of the internet.
HTTP/2 at 51.04% is the workhorse protocol of 2026. Introduced by Google as SPDY in 2009 and standardized as HTTP/2 in 2015, it brought three real improvements: binary framing, header compression (HPACK), and multiplexing. A single HTTP/2 connection can carry dozens of parallel streams without the head-of-line blocking that plagues HTTP/1.1. When I was at Google, the internal debate around SPDY was whether the multiplexing gains would justify the deployment cost. A decade later, the answer is obvious. At the time, plenty of internal stakeholders thought HTTP/1.1 pipelining was "good enough."
HTTP/3 at 21.11% is the newest and most architecturally ambitious. Instead of running on TCP, HTTP/3 runs on QUIC, a UDP-based protocol with built-in encryption. That shift allows faster connection setup, zero round-trip resumption, and better performance on lossy networks. It's a genuinely better protocol for mobile and high-latency environments. But adoption depends on client, server, and network path all supporting it, and that chain is still incomplete. I'll come back to why it has plateaued in a separate section, because the reason is more interesting than "operational cost."
Every new HTTP version has been additive, not replacing. Modern servers (nginx, Caddy, IIS) and every major CDN support all three simultaneously, with content negotiation during the TLS handshake. The client picks the best version both sides support. Legacy clients fall back to HTTP/1.1, and there are still a lot of legacy clients.
The 90-day trend: HTTP/3 plateaued while HTTP/2 quietly won
Looking at weekly data from January 5 through April 6, 2026, the patterns get interesting.
| Week | HTTP/2 | HTTP/1.x | HTTP/3 |
|---|---|---|---|
| Jan 5 | 50.98% | 27.73% | 21.30% |
| Jan 12 | 50.83% | 27.28% | 21.89% |
| Jan 19 | 49.50% | 28.34% | 22.16% |
| Jan 26 | 49.01% | 28.86% | 22.13% |
| Feb 2 | 48.84% | 29.27% | 21.89% |
| Feb 9 | 49.80% | 28.52% | 21.68% |
| Feb 16 | 50.07% | 28.20% | 21.73% |
| Feb 23 | 50.73% | 27.92% | 21.35% |
| Mar 2 | 51.08% | 27.45% | 21.48% |
| Mar 9 | 50.99% | 27.46% | 21.55% |
| Mar 16 | 50.92% | 27.85% | 21.23% |
| Mar 23 | 50.79% | 28.20% | 21.01% |
| Mar 30 | 51.32% | 27.86% | 20.83% |
| Apr 6 | 51.52% | 27.61% | 20.88% |
May 2026 update — the plateau is now five months old: Per clean calendar-month pulls, HTTP/3 ran 21.40% (Jan) → 21.68% (Feb) → 21.33% (Mar) → 21.07% (Apr) → 21.20% (May). That is a 0.6-point band across five months — flatter than any quarter Cloudflare has published on HTTP/3. The "decline from January" framing in the original Q1 read is now fully retired: HTTP/3 didn't keep falling, it stopped. But a flat equilibrium at 21% is still a long way from the 30% trajectory most 2024 forecasts called for, and May's fractional uptick is well inside the month-to-month noise. The month-by-month section breaks out the full per-month series.
Three things jump out.
HTTP/1.x peaked at 29.27% in the week of February 2. That's a full 1.5 percentage points above the April level. Something pushed legacy HTTP traffic higher in early February and then faded. My working theory from running crawlers: it's bot traffic. Early February coincides with several large-scale scraping operations targeting financial data before quarterly earnings, and scraping frameworks disproportionately use HTTP/1.1 clients. We see the same pattern in our internal crawling data. When we run heavier crawl cycles during earnings season, our own HTTP/1.1 share spikes. We wrote about bot traffic in more depth in our AI crawlers blocking report.
HTTP/3 peaked at 22.16% in the week of January 19 and has declined every week since. This is the most counterintuitive finding in the dataset. The narrative around HTTP/3 is one of steady adoption, and the W3Techs HTTP/3 tracker shows website-level "support" still growing. But request-level traffic, which is what Cloudflare Radar measures, tells a different story.
Cloudflare published their own HTTP/3 adoption post in May 2023 showing HTTP/3 at 28% of all traffic. Three years later, their public Radar data shows HTTP/3 at 21.11% and declining. The arc of HTTP/3 adoption between 2023 and 2026 inverted. That isn't a narrative anyone is telling loudly, but the numbers are published and public. Cloudflare's own blog said HTTP/3 was at 28% and growing in May 2023. Their own Radar now says 21.11% and falling in April 2026.
HTTP/2 is the consolidation winner. It climbed from 48.84% at the February trough to 51.52% in early April. That's 2.68 percentage points of share gained in eight weeks, almost entirely at HTTP/3's expense. The story isn't "new is replacing old." It's "the middle is beating both ends."
If you're planning a 2026 migration strategy, don't skip straight to HTTP/3 assuming HTTP/2 is obsolete. The data suggests HTTP/2 will remain the dominant protocol through 2027 at least, and the operational cost of running HTTP/3 alongside it is non-trivial. Most major CDNs, including Cloudflare, serve both by default, but the gain from prioritizing HTTP/3 over HTTP/2 is smaller than the marketing suggests. The next section explains why, and the explanation is academic, not anecdotal.
Why HTTP/3 plateaued: the 500 Mbps physics problem
When I saw HTTP/3 flatten in the Q1 2026 data, my first instinct was to blame the usual suspects. UDP port blocking on corporate firewalls. QUIC's CPU overhead on servers. The CI/CD lag of getting HTTP/3 deployed to origin servers. All three are real. None of them is the main story.
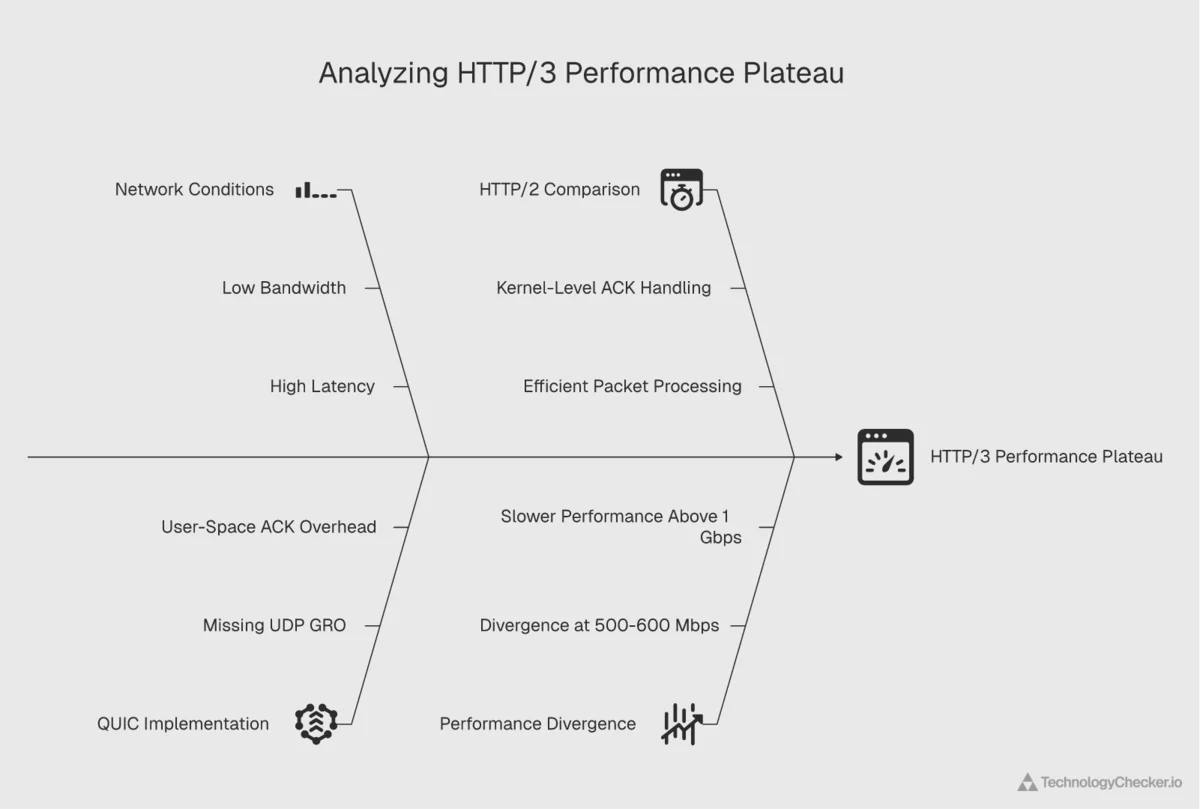
The main story is a paper I first read last year called "QUIC is not Quick Enough over Fast Internet" (Zhang et al.), presented at the 2024 ACM Web Conference. The authors measured QUIC's throughput on Chrome, Edge, Firefox, Opera, and command-line clients over a range of network speeds. Their headline finding:
At 1 Gbps on Chrome, QUIC delivers up to 45.2% less throughput than HTTP/2. The performance gap begins around 500-600 Mbps and grows as bandwidth increases.
Read that again. Over genuinely fast networks, HTTP/3 is slower than HTTP/2. Not "slightly slower." Up to 45% slower on mainstream browsers. The paper traces the cause to two specific engineering issues.
The first is packet processing overhead. At 1 Gbps, QUIC on Chrome generates about 744,000 packet reads during a test transfer. TCP generates about 58,000. The ratio is roughly 13x. The reason: the Linux kernel has a feature called UDP Generic Receive Offload (GRO) that batches incoming UDP packets into larger chunks before the application sees them, dramatically reducing syscall overhead. GRO wasn't deployed for QUIC when the paper was written, so every QUIC datagram is handled individually.
The second is user-space ACK overhead. TCP's ACK generation happens in the kernel, with built-in delayed-ACK logic to reduce the number of ACKs sent. QUIC runs in user space, so ACK generation is a userland loop. Over a test that TCP handles in negligible ACK CPU time, QUIC burns 3.0 seconds of wall-clock time just generating ACKs.
Both problems are solvable with engineering work. GRO can be extended. ACK batching can be implemented. Multi-threaded reception can be enabled across cores. But as of early 2026, the fixes aren't universally deployed, and the measurable result is that HTTP/3 is slower on fast networks than the previous generation protocol it's supposed to replace.
This reframes the Q1 2026 data completely. The HTTP/3 plateau isn't operational reluctance or marketing pessimism. It's a structural performance problem that only becomes visible once consumer networks cross a specific bandwidth threshold. Mexico, Brazil, India: countries with median bandwidth well below 500 Mbps are still firmly in HTTP/3's favorable regime. Those are the same countries my own data shows leading HTTP/3 adoption (29-30% shares vs 21% globally). Germany, France, the United States, Singapore: all crossing the threshold in more and more consumer connections, all countries with the highest HTTP/1.x and the lowest HTTP/3 shares.
The causal chain works in both directions. Fast networks are what you'd expect to accelerate HTTP/3 adoption. Instead, they stall it, because the protocol's performance envelope hasn't kept up with the speed of the underlying links.
I don't want to overstate the finding. The paper measures specific network scenarios on specific browsers, and the academic response (Siddiqui et al., "Performance Comparison of HTTP/3 and HTTP/2: Proxy vs. Non-Proxy Environments", September 2024) shows HTTP/3 still winning in proxy environments and over lossy links. Akamai's 2025 State of the Internet report shows HTTP/3 reducing mobile latency by around 30%. These are real wins. But on fast fixed broadband in 2026, the picture is cloudier than the marketing suggests.
From an engineering perspective, what this data tells me is that HTTP/3 will keep growing where the bandwidth regime favors it: mobile networks, emerging markets, and anywhere with meaningful packet loss. It'll struggle to grow where the bandwidth regime has moved past its sweet spot. For most enterprise sites serving primarily developed-market users over fiber connections, HTTP/2 is, counterintuitively, the performance-optimal choice in 2026.
Country-by-country: where HTTP/1.x persists
I pulled HTTP version data for the 20 largest source countries of web traffic. Sorted by HTTP/1.x share from highest to lowest:
| Country | HTTP/1.x | HTTP/2 | HTTP/3 |
|---|---|---|---|
| Singapore | 52.24% | 39.81% | 7.96% |
| Netherlands | 50.99% | 38.19% | 10.82% |
| China | 44.43% | 40.88% | 14.70% |
| Germany | 39.39% | 43.27% | 17.35% |
| France | 37.54% | 42.98% | 19.48% |
| Russia | 37.19% | 45.54% | 17.27% |
| United States | 35.80% | 48.94% | 15.26% |
| Canada | 27.38% | 49.63% | 23.00% |
| Australia | 25.29% | 48.37% | 26.34% |
| United Kingdom | 21.75% | 56.95% | 21.30% |
| South Korea | 20.37% | 51.86% | 27.77% |
| India | 18.75% | 52.12% | 29.13% |
| Japan | 18.57% | 60.87% | 20.56% |
| Poland | 17.49% | 56.26% | 26.25% |
| Brazil | 16.08% | 54.65% | 29.27% |
| Italy | 15.72% | 54.08% | 30.20% |
| Spain | 15.56% | 60.70% | 23.74% |
| Indonesia | 14.88% | 58.89% | 26.23% |
| Turkey | 13.43% | 61.61% | 24.96% |
| Mexico | 12.84% | 65.02% | 22.14% |
May 2026 update — the leaderboard kept moving, and one move we don't trust:
Country Q1 HTTP/1.x April May Q1→May Read Netherlands 50.99% 50.89% 51.74% +0.75 pt Now clearly #1 China 44.43% 47.07% 48.55% +4.12 pt Up 3 months running Singapore 52.24% 47.89% 48.43% -3.81 pt April dip didn't continue Germany 39.39% 40.27% 38.49% -0.90 pt Eased United States 35.80% 34.84% 35.15% -0.65 pt Flat France 37.54% 31.89% 29.70% -7.84 pt Two-month decline Russia 37.19% 37.60% 29.57% -7.62 pt Anomaly — see note Brazil 16.08% 21.05% 24.97% +8.89 pt Climbing India 18.75% 18.91% 18.75% flat Steady Japan 18.57% 17.79% 17.52% -1.05 pt Steady decline Italy 15.72% 16.40% 14.65% -1.07 pt Eased Mexico 12.84% 12.09% 11.63% -1.21 pt Cleanest, getting cleaner Two moves are durable and one isn't. China up three straight months (+4.12 pt Q1→May) is the most durable signal in the table — structural barriers to HTTP/2/3 inside China haven't eased. France's two-month slide (−7.84 pt) is gradual enough to read as a genuine re-cut of server-to-server traffic through French cloud regions. Russia's −7.62-point move is the one I don't trust: an 8-point HTTP/1.x drop and a simultaneous TLS-version collapse in a single month is the signature of a traffic-mix shift, not infrastructure modernizing — the same diagnosis the two-signal framework gave Singapore in April. Singapore itself ticked back up (+0.54), confirming April's drop was a one-month dip rather than a trend.
This ranking is the opposite of what most infrastructure analysts would predict. The developed, high-bandwidth countries cluster at the top of the HTTP/1.x leaderboard. Singapore, the Netherlands, Germany, France, and the United States all have HTTP/1.x share well above the global average of 27.84%. Meanwhile, emerging markets like Mexico, Turkey, Indonesia, Brazil, and India have the lowest HTTP/1.x shares.
The pattern lines up exactly with what the ACM 2024 paper predicts about the 500 Mbps threshold.
Singapore and the Netherlands are datacenter hubs, not legacy markets. Both countries host massive concentrations of colocation facilities, cloud regions, and CDN points of presence. Singapore is the primary APAC hub for AWS (ap-southeast-1), Google Cloud (asia-southeast1), and Microsoft Azure (Southeast Asia). The Netherlands (Amsterdam) is the European peering capital. AMS-IX alone handles over 13 Tbps of peak traffic, and it's a primary hub for Akamai, Cloudflare, and Fastly. I'll explain in the next section why datacenter traffic looks different from consumer traffic.
China's 44.4% HTTP/1.x share reflects the Great Firewall. Cross-border traffic into and out of China routes through a small set of gateway ASNs with deep packet inspection. HTTP/3 uses UDP, and the gateway infrastructure handles UDP less efficiently than TCP, so Chinese edge operators actively steer traffic toward HTTP/2 and HTTP/1.1. Combined with the massive volume of domestic CDN traffic handled by providers like Tencent Cloud and Alibaba Cloud (which rolled out HTTP/3 support later than Western CDNs), the result is elevated HTTP/1.x share. China's bandwidth numbers back this up. Median Internet Quality bandwidth in China is just 3.43 Mbps, the lowest of any major market and an order of magnitude below Singapore's 41.47 Mbps.
Mexico, Turkey, and Indonesia lead HTTP/2+ adoption. This sounds paradoxical but makes sense once you understand how these markets grew. All three leapfrogged desktop broadband and went straight to mobile-first. Most internet usage happens through smartphones connecting to modern mobile CDN edges. Those CDNs, especially the ones operated by global players like Cloudflare and Akamai, default to HTTP/2 and HTTP/3. There's no legacy server farm dragging down the average because the legacy server farm never existed.
Mexico's breakdown is the most striking in the dataset: 65.02% HTTP/2, 22.14% HTTP/3, and just 12.84% HTTP/1.x. That's the cleanest modernization profile of any major country. If you want to understand what "the modern web" looks like, point at Mexico City.
Brazil and India show the HTTP/3 story most clearly. Brazil is at 29.27% HTTP/3 and India at 29.13%, both dramatically above the global 21.11% average. Both are mobile-first markets where the last-mile CDN edge is overwhelmingly Cloudflare, Akamai, or a carrier-owned CDN. These edges push HTTP/3 aggressively because it performs better on the high-latency, lossy mobile networks common in these countries. And their networks are well below the 500 Mbps threshold where QUIC's throughput advantage starts to collapse. For teams tracking companies using Google Cloud or companies using Microsoft Azure across APAC and LATAM, protocol adoption is a reasonable proxy for CDN maturity.
The datacenter paradox: why Singapore and the Netherlands look "legacy"

Singapore's 52.24% HTTP/1.x share is the highest among the 20 largest web traffic sources I analyzed. The Netherlands is right behind at 50.99%. But neither country is a legacy market. Both have higher median bandwidth than the United States, modern mobile infrastructure, and some of the world's most sophisticated digital economies. So why do they have the protocol profile of 2012?
The answer is what I call the datacenter paradox. When you host a huge fraction of the world's servers, your country-level HTTP version data doesn't really reflect "websites in Singapore." It reflects server-to-server traffic, bot traffic, and API calls that happen to originate or terminate in your datacenters.
Here's where the HTTP Archive cross-reference earns its keep. HTTP Archive measures 15% HTTP/1.1 at the request level, crawling websites with fresh browser profiles. Cloudflare Radar measures 27.84%. The 12.84 percentage point gap is the best single piece of evidence I have for what the datacenter paradox actually consists of.
HTTP Archive deliberately filters out the non-browser web. Their methodology uses fresh browser profiles with no session state, no cookies, no cache. That's the ideal environment for a browser, and in an ideal browser environment, HTTP/1.1 share drops to 15%, because any modern browser connecting to any modern server will negotiate HTTP/2 or HTTP/3. The remaining 15% is websites that genuinely haven't moved off HTTP/1.1 at the origin.
Cloudflare Radar doesn't filter anything out. It captures the full set of HTTP requests crossing Cloudflare's network. That includes cloud regions serving cross-border enterprise workloads, CDN points of presence acting as caches for the surrounding region, peering exchanges where ISPs and content networks interconnect, scraping infrastructure operated by SEO tools and price monitors and AI training pipelines, monitoring probes running uptime checks against global endpoints, and CI/CD runners pulling dependencies, pushing builds, and calling APIs.
All of these generate enormous volumes of HTTP traffic, and a huge share of that traffic still uses HTTP/1.1 clients. Python's requests library. Go's net/http default client until Go 1.6. Ruby's Net::HTTP. PHP's cURL defaults. Many long-running open-source tools still default to HTTP/1.1. I've spent more nights than I'd like debugging HTTP/1.1 keepalive edge cases in our own crawler infrastructure at TechnologyChecker. Upgrading to HTTP/2 requires code changes that the developer maintaining a 2017 scraping script simply hasn't made, and at scale those changes never happen uniformly across an entire fleet.
More importantly, 31.08% of all global internet requests come from bots, according to the same Cloudflare Radar dataset I pulled for this analysis. That's nearly a third of the entire web. When you filter to datacenter countries specifically, the bot share is much higher. Easily 50% or more in places like Singapore and the Netherlands, where consumer internet traffic is small relative to server infrastructure. HTTP Archive's 15% figure is what the browser-facing web looks like. Cloudflare Radar's 27.84% is what happens when you measure the real web, including the half that no browser ever sees.
When Cloudflare published their 2023 HTTP/3 adoption post, one of the most striking numbers was that search engine bots used HTTP/3 less than 2% of the time. Googlebot specifically was at around 1% HTTP/3 in early 2023. Our own crawlers at TechnologyChecker are still almost exclusively HTTP/1.1 on many codepaths. Not because we haven't considered upgrading, but because the marginal performance win for server-to-server API-style calls isn't worth the engineering cost when our crawler is already hitting rate limits set by origin servers. The bottleneck is politeness, not protocol.
This explains the Singapore/Netherlands anomaly cleanly. The HTTP/1.x share in these countries isn't "their websites are old." It's "most traffic originating from these countries is bots and server-to-server calls, and those clients never upgraded."
We can cross-check this theory against TLS version data. If Singapore's high HTTP/1.x share reflected genuinely legacy infrastructure, we'd expect to see elevated TLS 1.2 usage too. Instead, Singapore has the highest TLS 1.3 share of any country I measured: 81.37%. The Netherlands has 76.95% TLS 1.3. These are modern networks. They just happen to carry a lot of HTTP/1.1 bot traffic.
HTTP/1.x share alone is a noisy signal. You can't look at a country's HTTP version profile and conclude anything about the modernity of its consumer web. The signal only becomes useful when you combine it with other protocol-level data. That's exactly what I did next.
The TLS correlation: where protocol modernity actually clusters
TLS version is the second protocol signal worth looking at. TLS 1.3 became standard in 2018, and by 2026 any modern client or server supports it. TLS 1.2 is the last "acceptable" fallback. TLS 1.1 and 1.0 are deprecated and should never appear in 2026 traffic, and the data confirms this. Globally, TLS 1.0 and 1.1 combined account for just 0.017% of all requests. Effectively zero.
Before I dig into the country-level TLS numbers, it's worth cross-referencing Cloudflare Radar's 71.51% TLS 1.3 request share against an independent source. Qualys SSL Labs' SSL Pulse scans the top 150,000 TLS-enabled websites monthly and measures what TLS versions they support at the server level. Their June 2025 SSL Pulse report showed 75.3% of top websites supporting TLS 1.3, up from 70.1% in May 2024, a gain of 5.2 percentage points over thirteen months.
The two numbers agree more than they disagree. Cloudflare Radar says 71.51% of actual requests use TLS 1.3. SSL Labs says 75.3% of top sites support it. The small gap reflects the fact that request-level usage lags site-level support. A site can advertise TLS 1.3 but still serve most of its traffic to older clients that negotiate down to TLS 1.2. The consistency between the two measurements is the real signal: independent sources using independent methodologies both say TLS 1.3 is around three-quarters of the modern web.
Here's the TLS version breakdown for the same 20 countries, sorted from highest TLS 1.2 share (the most "legacy" modern TLS version) to lowest:
| Country | TLS 1.3 | TLS QUIC | TLS 1.2 | HTTP/1.x |
|---|---|---|---|---|
| Russia | 67.41% | 18.88% | 13.68% | 37.19% |
| Singapore | 81.37% | 8.57% | 10.04% | 52.24% |
| Netherlands | 76.95% | 13.48% | 9.56% | 50.99% |
| Turkey | 66.50% | 25.30% | 8.16% | 13.43% |
| United States | 75.92% | 16.36% | 7.71% | 35.80% |
| Australia | 65.56% | 26.93% | 7.50% | 25.29% |
| China | 76.07% | 16.87% | 7.02% | 44.43% |
| United Kingdom | 71.63% | 21.73% | 6.63% | 21.75% |
| Germany | 74.67% | 18.73% | 6.59% | 39.39% |
| Brazil | 63.98% | 30.10% | 5.90% | 16.08% |
| Indonesia | 67.92% | 26.56% | 5.48% | 14.88% |
| Canada | 69.51% | 25.15% | 5.32% | 27.38% |
| Italy | 64.21% | 31.02% | 4.75% | 15.72% |
| India | 65.90% | 29.51% | 4.57% | 18.75% |
| France | 75.14% | 20.87% | 3.98% | 37.54% |
| Spain | 71.88% | 24.28% | 3.83% | 15.56% |
| Poland | 69.37% | 26.82% | 3.79% | 17.49% |
| Japan | 75.35% | 20.77% | 3.87% | 18.57% |
| South Korea | 68.15% | 28.14% | 3.70% | 20.37% |
| Mexico | 73.99% | 22.49% | 3.51% | 12.84% |
May 2026 update — the framework flags its own anchor: Russia's TLS 1.2 share fell again, from 12.40% (April) to 9.00% (May), while TLS 1.3 jumped to 78.99%. On its own that looks like modernization. But it landed in the same month Russia's HTTP/1.x dropped 8 points — and when both the HTTP signal and the TLS signal swing hard together in 30 days, the two-signal framework this section is built on says the same thing it said about Singapore in April: the traffic mix changed, not the servers. The framework's whole value is that it stops you from misreading a routing artifact as a fleet upgrade, and in May it flagged its own designated "genuine legacy" anchor. Singapore, meanwhile, recovered to 80.28% TLS 1.3 as its April dip reversed. We'll know in June which Russia reading was real.
Now the picture gets clearer. Russia is the genuine legacy outlier. Russian networks show 13.68% TLS 1.2 share, more than double the global average of 6.29%, combined with 37.19% HTTP/1.x share. Both signals point the same direction: a meaningful fraction of Russian infrastructure hasn't been touched in years. This is what a real "tech debt signal" looks like when you combine HTTP version with TLS version.
Compare Russia to Singapore. Both have elevated HTTP/1.x shares (37% and 52%), but their TLS profiles are completely different. Singapore has 81.37% TLS 1.3, the highest in my dataset. That tells you Singapore's HTTP/1.x traffic is running on modern TLS stacks. The clients are old, but the servers are current. In Russia, the HTTP/1.x traffic is running on older TLS stacks too. The clients and servers are both behind.
There's a structural reason TLS 1.3 was easier to adopt than HTTP/3. TLS happens in the handshake phase of a connection, and modern libraries (OpenSSL 1.1.1+, BoringSSL, Go's crypto/tls) all support TLS 1.3 transparently. You can upgrade your TLS stack without touching your application code. HTTP/3, by contrast, requires changes at the transport layer (UDP instead of TCP), the crypto layer (QUIC's built-in encryption), and the application layer (HTTP/3 framing, QPACK headers). Every layer has to be upgraded in lockstep. When I look at our own stack at TechnologyChecker, upgrading our TLS libraries is a package bump. Upgrading to HTTP/3 would mean replacing our entire HTTP client library and re-validating every downstream integration. The operational asymmetry is enormous.
HTTP/1.x alone tells you nothing specific. HTTP/1.x combined with TLS 1.2 at 2x or more the global average tells you the infrastructure has been neglected. If you're trying to identify prospects running legacy stacks, this two-signal filter is dramatically more precise than either signal in isolation.
France is another interesting case. 37.54% HTTP/1.x (fifth highest) but only 3.98% TLS 1.2 (near the bottom). That's a datacenter-effect country. France hosts major European cloud regions (OVH's Paris and Roubaix facilities alone generate enormous traffic). The HTTP/1.x share reflects server-to-server traffic, not outdated infrastructure. Companies routing traffic through France contribute to this pattern.
Germany sits in a middle position at 39.39% HTTP/1.x and 6.59% TLS 1.2. Closer to the global averages on both axes. Germany has both a large datacenter footprint (Frankfurt is Europe's biggest peering point) and a significant population of legacy enterprise systems. Germany's Mittelstand companies often run on-premise software that's been in production for decades. The data reflects both forces pulling in the same direction.
TLS QUIC is the TLS variant that runs as part of HTTP/3 over QUIC. Countries with high QUIC shares (Italy 31.02%, Brazil 30.10%, India 29.51%) are the same countries that lead HTTP/3 adoption. That's not a coincidence. They're the same underlying transport. When you see high TLS QUIC share, you're looking at a country whose traffic flows primarily through modern CDN edges, and whose bandwidth regime keeps QUIC in its favorable performance zone.
HTTPS is everywhere. HTTP/1.x is still alive.

Here's a fact that's easy to miss when you're focused on version numbers: 94.65% of all global HTTP requests are now encrypted (HTTPS), and only 5.35% travel over plain HTTP. Unencrypted HTTP is effectively dead. The encryption transition is complete.
| Protocol Layer | Q1 2026 Share |
|---|---|
| HTTPS (encrypted) | 94.65% |
| HTTP (plain) | 5.35% |
May 2026 update: HTTPS share held at 94.47% (94.5% across all of Q2 so far) — the encryption layer is saturated and oscillates in a fraction of a point. The metric that keeps moving is post-quantum support, which climbed from 52.74% (April) to 53.71% (May), a full point of monthly growth. Sit that next to HTTP/3's flat 21% and the contrast is the lesson: PQ ships invisibly inside TLS libraries, so it migrates fast; HTTP/3 needs coordinated transport-, crypto-, and application-layer changes, so it stalls. The protocol transition nobody is covering is outpacing the one everybody is.
That 5.35% plain HTTP slice is itself interesting. It isn't websites. Modern browsers flag plain HTTP as "Not Secure" and most CDNs force HTTPS. Most of the remaining HTTP traffic is machine-to-machine: IoT devices hitting manufacturer endpoints, legacy APIs that never moved behind a load balancer, health checks, and redirect requests on initial connection that haven't yet upgraded. For practical purposes, the encryption layer has reached saturation.
This creates an interesting asymmetry. The encryption war is over. The protocol version war isn't. You can run HTTP/1.1 over TLS 1.3, and a lot of the internet does exactly that. When you see HTTP/1.x numbers like 27.84%, you're not looking at unencrypted traffic. You're looking at encrypted traffic that's using an old framing protocol.
This matters because the security community sometimes talks about "legacy HTTP" as if it means unencrypted. It doesn't. A request carrying sensitive data over HTTPS/TLS 1.3 with HTTP/1.1 framing is cryptographically secure. It's just slower. The conversation about HTTP version adoption is a performance conversation, not a security conversation. Russia's 13.68% TLS 1.2 share is a security signal. 27.84% HTTP/1.x is a performance signal.
I remember having this exact debate with a security engineer at Google in around 2014, when we were evaluating whether SPDY (pre-HTTP/2) made our crawler faster enough to justify the complexity. His position was that since we were already on TLS, "the protocol is secure, everything else is optimization." He wasn't wrong. But he was under-weighting how much of the crawler's wall-clock time was actually spent in head-of-line blocking on HTTP/1.1. Framing protocol version as purely a performance concern is the right framing today, but it means the numbers should be evaluated through a performance lens, not a security one.
If you haven't audited your HTTP version support recently, you probably serve HTTP/2 to most clients and HTTP/1.1 to the rest. That's fine. But if you haven't enabled HTTP/3, you're probably not missing much. The performance gain is marginal for most sites, and the operational complexity is real. Focus energy on getting HTTP/2 configured well (enable HTTP/2 server push sparingly, tune the stream concurrency limit, watch for head-of-line blocking in mixed-content pages) before worrying about HTTP/3.
The performance tax: what HTTP/1.x actually costs
HTTP/1.x isn't a security problem in 2026 (when paired with modern TLS, which it usually is). It is a performance problem. The cost shows up in three specific areas, and understanding them clarifies why performance engineers care about the version distribution at all.
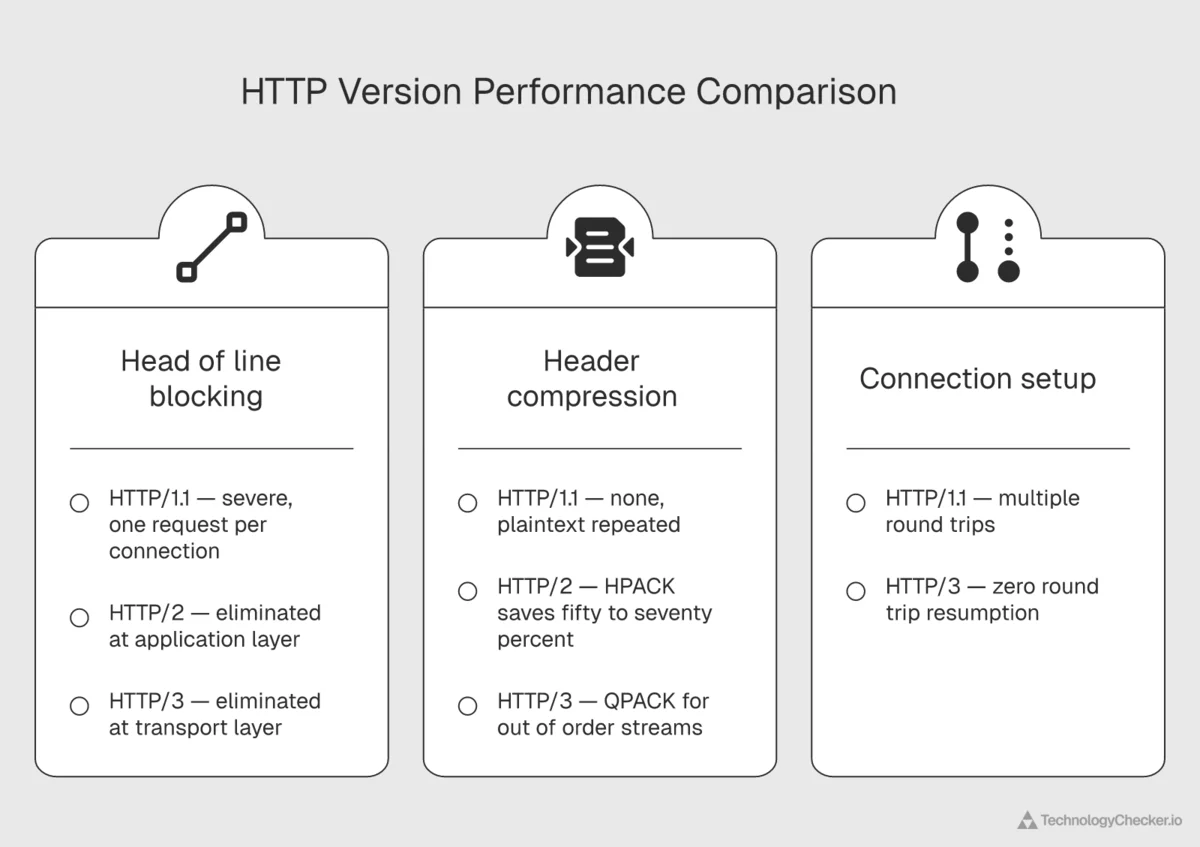
The first is head-of-line blocking. In HTTP/1.1, each TCP connection handles one request at a time. If a single request is slow, it blocks every subsequent request on the same connection. Browsers work around this by opening multiple connections (typically 6 per origin), but that just pushes the problem up a layer. Now you have 6 connections competing for bandwidth, each vulnerable to head-of-line blocking individually. HTTP/2 solves this at the application layer with multiplexed streams over a single connection. HTTP/3 goes further and solves it at the transport layer by running on QUIC, which doesn't have TCP's stream ordering constraint.
The practical impact depends on the site. A static-heavy page with 50+ resources loads noticeably faster on HTTP/2 than HTTP/1.1. In our own tests on a simulated mobile connection, the difference is typically 300-800ms on the initial load. For API-heavy single-page applications, the difference is smaller because modern SPAs tend to batch requests anyway. The HTTP Archive 2024 Web Almanac found that 54% of all page requests now traverse a CDN, and that CDN traffic is 96% HTTP/2+. Non-CDN traffic is still up to 29% HTTP/1.1. If you care about the head-of-line blocking penalty, whether you're behind a modern CDN matters more than anything else.
The second is header compression. HTTP/1.1 sends every request header in plaintext. That means if you're making 100 requests to the same origin, you're sending the same User-Agent, Accept, Cookie, and other headers 100 times. On a page with lots of resources, headers can account for 30-40% of total bytes transferred. HTTP/2 introduced HPACK, which compresses headers with a static dictionary plus dynamic referencing. HTTP/3 uses QPACK, which is similar but designed to work with QUIC's out-of-order streams. The savings on a typical modern site are 50-70% of header bytes.
The third is connection setup cost. Every HTTP/1.1 TLS connection requires a TCP handshake (1 round trip), a TLS handshake (1-2 round trips depending on TLS version and session resumption), and then the actual request (1 round trip). On a mobile connection with 100ms RTT, that's 300-400ms before the first byte of content arrives. HTTP/2 reuses connections aggressively, so the cost amortizes over many requests. HTTP/3 runs on QUIC, which combines the transport and TLS handshakes into a single round trip, and supports 0-RTT resumption for returning clients.
The aggregated effect on Core Web Vitals can be significant. Google's Web Vitals documentation defines Largest Contentful Paint (LCP) as "good" when it occurs within 2.5 seconds, and Interaction to Next Paint (INP), which replaced First Input Delay as a Core Web Vital in March 2024, as "good" at 200 milliseconds or less. Sites still on HTTP/1.x tend to score worse on LCP by 200-500ms on mobile, which can be the difference between "good" and "needs improvement" on Google's page experience signals.
Akamai's 2025 State of the Internet report quantifies the mobile performance gain from HTTP/3 at around 30% latency reduction, but only in the bandwidth regimes where QUIC's throughput doesn't hit the 500 Mbps ceiling documented in the ACM 2024 paper. The short version: HTTP/3 helps mobile users on emerging-market networks significantly. It helps mobile users on fast 5G or Wi-Fi much less. And on fiber-connected desktops in 2026, HTTP/2 is probably the better choice for reasons the protocol designers didn't anticipate when they started the HTTP/3 standardization in 2019.
If you control your infrastructure, enabling HTTP/2 is usually a one-line config change in nginx, Caddy, or IIS. HTTP/3 is a bigger lift because it requires UDP to be unblocked end-to-end and a more complex server configuration. If you're on a modern CDN (Cloudflare, Fastly, Akamai), HTTP/2 and HTTP/3 are enabled by default. You're already covered without doing anything. If you're on older shared hosting (GoDaddy, Hostinger, IONOS), check your server configuration because HTTP/2 support varies by plan.
From my seat running detection across 29.9 million active domains, the biggest performance mistake I see isn't "not on HTTP/3." It's "not on a CDN at all." The difference between bare origin and CDN-fronted is an order of magnitude larger than the difference between HTTP/2 and HTTP/3 for almost every site I look at.
Reading HTTP version as a prospecting signal
Here's the practical question for sales teams. Can you use HTTP version data as a prospecting signal for companies running legacy infrastructure? The answer is yes, but only if you combine signals correctly. Raw HTTP/1.x share is too noisy to use alone, as the Singapore and Netherlands examples demonstrated.
The refined framework we use at TechnologyChecker combines three data points to separate real legacy prospects from datacenter noise. I designed this framework around the specific failure modes I ran into at Google when I was trying to use HTTP signatures to identify sites that needed crawler-side compatibility work.
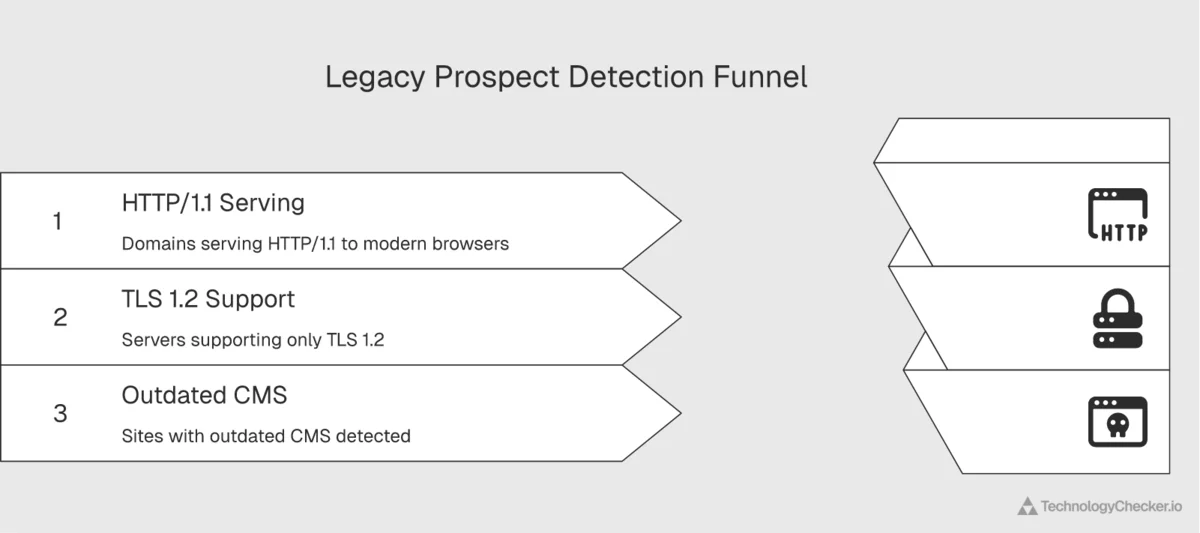
First, the HTTP version check. Does the target company's primary web properties serve HTTP/1.1 to modern browsers? Modern CDNs and well-maintained origin servers will negotiate HTTP/2 or HTTP/3 automatically. If a browser with full HTTP/3 support negotiates down to HTTP/1.1, something is old or misconfigured. Our detection system at TechnologyChecker fingerprints the negotiated protocol version on every scan, so we know which version the site actually serves, not just what it claims to support.
Second, the TLS version check. What's the TLS version the server supports? If the server only supports TLS 1.2 (or worse, TLS 1.1), that's a strong signal that the TLS stack hasn't been updated in years. A modern load balancer or CDN will support TLS 1.3. A five-year-old Apache instance with untouched configuration won't. SSL Labs' SSL Pulse data shows 75.3% of top websites now support TLS 1.3, meaning the remaining 24.7% is a concentrated pool of sites where the TLS stack has meaningfully fallen behind.
Third, the infrastructure fingerprint. What technologies does our detection identify on the site? An old nginx version, outdated jQuery, a CMS version that's two major releases behind, an analytics stack that stopped being updated in 2021. Each of these adds evidence. A company running old HTTP and old TLS and an end-of-life Drupal version is a completely different prospect from a Singapore-based SaaS using a modern CDN that happens to route API traffic over HTTP/1.1.
When these three signals align, you have a real legacy prospect. The HTTP version is the macro filter that narrows your list from millions to thousands. TLS version and technology fingerprints narrow it further to prospects where the legacy signal is substantive rather than artifactual.
At TechnologyChecker, we literally scan for all three signals together across 29.9 million active domains every month. I built the detection pipeline specifically so sales teams could query "HTTP/1.1 + TLS 1.2 + outdated CMS" as a combined filter. The number of matching domains globally is a few hundred thousand, not tens of millions. That's the difference between a useful prospect list and a mailing list.
The sales pitch writes itself. A company running HTTP/1.1, TLS 1.2, and an outdated CMS in 2026 is probably also running outdated analytics, outdated payment processing, and outdated internal tools. They're not going to modernize everything at once, but they're a prime target for anyone selling digital transformation, modern SaaS replacements, or infrastructure monitoring. The protocol data tells you which doors to knock on. The full technology profile tells you what they'll actually buy.
Our detection engine fingerprints over 40,000 technologies across 29.9 million active domains, including HTTP version, TLS version, server software, CMS, analytics, payment processors, hosting provider, CDN, and hundreds of other technographic data points. For sales teams that want to use protocol-level data as a macro filter and then dig into the full stack of any company that matches, our technology search surfaces the prospects and their complete infrastructure at once.
What these numbers mean for infrastructure teams

Five things worth remembering from this analysis.
HTTP/2 is the dominant protocol and will remain so. At 51.04% share and growing, HTTP/2 is the workhorse of 2026. Any infrastructure planning that treats HTTP/2 as a transitional protocol, something to skip over on the way to HTTP/3, is reading the trend wrong. HTTP/2 gained 0.58 percentage points month over month while HTTP/3 lost 0.45. This is not a market where HTTP/3 is racing ahead.
HTTP/3 adoption has plateaued, and the reason is physics. The 2024 ACM Web Conference paper "QUIC is not Quick Enough over Fast Internet" shows QUIC loses up to 45.2% of its throughput vs HTTP/2 above 500 Mbps. Fiber networks in developed markets have now crossed that threshold, which flips HTTP/3 from "faster" to "slower." Cloudflare's own public data shows HTTP/3 peaked at 28% in May 2023 and has retreated to 21.11% in April 2026. Don't bet your 2026 roadmap on HTTP/3 dominance in fast-bandwidth markets.
HTTP/1.x has a floor, not a ceiling. The 27.84% HTTP/1.x share is sticky. The 12.84 percentage point gap between Cloudflare Radar's 27.84% and HTTP Archive's 15% is bot traffic, server-to-server APIs, and legacy clients keeping it alive. That floor isn't going to move in 2026, and probably not in 2027 either. If your monitoring or security tooling assumes HTTP/1.1 is deprecated and can be ignored, you're missing a quarter of your traffic.
Country-level HTTP data has to be read carefully. Singapore and the Netherlands look legacy by raw HTTP/1.x share but aren't. Russia looks legacy and actually is. The difference shows up when you combine HTTP version with TLS version. Any analysis that relies on HTTP version alone will misread half the countries in the top 10.
The encryption layer is saturated. 94.65% HTTPS is effectively complete. Qualys SSL Labs' SSL Pulse shows TLS 1.3 adoption at 75.3% of top sites. Both of those milestones happened quietly, and the interesting protocol-level work has moved on. HTTPS is no longer where the story is. The story is in the HTTP/2 vs HTTP/3 tradeoff and in how bandwidth regime determines the right answer.
The combined picture is that the web's protocol stack is in a stable equilibrium, not a transition. Three versions coexist, each serving a different role. HTTP/1.1 handles bots, APIs, and legacy clients. HTTP/2 handles mainstream websites and modern server-to-server traffic. HTTP/3 handles mobile-first regions where the bandwidth regime keeps it in its favorable performance zone. This equilibrium will shift over time, but slowly, and in some markets the direction of that shift is the opposite of what you'd predict from standards documents alone. Anyone forecasting rapid, linear change is selling something.
For teams tracking infrastructure trends, we cover related topics in our analysis of cloud provider traffic share and SSL certificate transparency. Both posts combine Cloudflare Radar data with TechnologyChecker's own detection signals to build a more complete picture of what's actually running on the web.
Methodology
Primary data source: Cloudflare Radar HTTP Analytics endpoints. Specifically: summary/http_version, summary/tls_version, summary/http_protocol, summary/bot_class, timeseries_groups/http_version, and summary/as for ASN-level data. Internet Quality (bandwidth, latency) pulled from get_internet_quality_data with BANDWIDTH and LATENCY metrics.
Timeframe: 30-day window from March 10, 2026 through April 9, 2026 for the primary Q1 share data. 90-day window from January 5, 2026 through April 6, 2026 for trend data. Month-over-month comparison uses 30d vs. 30dcontrol (February 8 through March 10, 2026).
June 2026 refresh. For the May update layer and the month-by-month section, we pulled each calendar month of 2026 (January 1 through May 31) as its own discrete dateStart/dateEnd window on summary/http_version, summary/tls_version, summary/http_protocol (HTTPS vs plain HTTP), summary/ip_version, summary/post_quantum, and summary/bot_class. Country-level May figures (Netherlands, China, Singapore, Germany, United States, Russia, France, Brazil, India, Japan, Italy, Mexico) were pulled per country on the same May 1–31 window. Because the May figures use clean calendar-month windows while the published April column uses the previous update's 30-day window, sub-0.3-point April→May moves are within window noise and should be read as flat. Cloudflare's confidence annotations surfaced a May 5 .de DNSSEC-signature distribution fault inside the German pull; it does not affect the HTTP-version shares reported here. Note that summary/http_protocol returns the HTTPS-vs-plain-HTTP split, not the version breakdown — the HTTP/1.x / HTTP/2 / HTTP/3 shares come from summary/http_version.
July 2026 refresh (Q2 close plus year-over-year). For the Q2 2026 close and the first year-over-year layer, we pulled http/summary/{http_version, tls_version, http_protocol, post_quantum, bot_class, ip_version} for three calendar windows: Q2 2025 (April 1 to June 30, 2025), Q1 2026, and the full Q2 2026 quarter (April 1 to June 30, 2026). All are PERCENTAGE-normalized request shares, read directly. The Q2-over-Q2 comparison is the clean like-for-like year-over-year (the same three calendar months a year apart); it is the first such comparison in this post, since the June refresh's series only ran back to January 2026. The net-new post-quantum "both sides" cut pairs the client-to-edge leg (http/summary/post_quantum, the SUPPORTED share of requests) with the edge-to-origin leg (post_quantum/origin/summary/key_agreement, reading the X25519MLKEM768 share); the origin endpoint returns overlapping per-curve support percentages, not a partition, so only the post-quantum hybrid share is quoted. To resolve the Russia anomaly the June update flagged, we pulled Russia's http_version and tls_version for full-month June 2026 alongside both Q2 windows; the June HTTP/1.x figure (38.99%) reverted to its pre-May level, confirming the May dip as a routing artifact, while the TLS 1.2 year-over-year decline (20.33% to 10.08%) held. Country year-over-year figures used http/summary/http_version with a location filter across both Q2 windows. The original Q1 baseline, the June refresh's month-by-month series, and all deep dives are retained unchanged; the Q2 close is layered on top.
Method: All share percentages are normalized by request count, not byte volume. "HTTP/1.x" in this dataset includes HTTP/1.0 and HTTP/1.1 combined. HTTP/1.0 accounts for a negligible fraction. "TLS QUIC" refers to the TLS variant bundled inside QUIC (used by HTTP/3), not a separate TLS version. Country-level data pulled per country using positional location filters matched to 30d date ranges. The 20 countries analyzed are the largest source countries by web traffic volume, selected based on Cloudflare's ASN and location rankings rather than population or GDP.
Independent cross-reference sources:
-
HTTP Archive 2024 Web Almanac, HTTP chapter. Fresh browser profile crawls showing HTTP/1.1 at 15% request level and HTTP/2+ at 85%. CDN share of requests (54%), CDN HTTP/2+ share (96%), non-CDN HTTP/1.1 share (29%), HTTP/3 alt-svc advertisement rates (26% desktop, 28% mobile). Used to cross-check request-level numbers against browser-only measurement.
-
W3Techs HTTP/3 Usage Statistics (April 2026). Website-level HTTP/3 "support" at 38.8%. Used to distinguish between what sites advertise via
alt-svcand what browsers actually negotiate. -
Qualys SSL Labs SSL Pulse (June 2025 report). Monthly scans of 150,000 top TLS-enabled websites. 75.3% of top sites support TLS 1.3 in June 2025, up from 70.1% in May 2024. Used to cross-check Cloudflare Radar's 71.51% TLS 1.3 request share.
-
Cloudflare Blog, "HTTP/3 usage one year on" (May 2023). Historical HTTP/3 share data: 28% in May 2023, up from 23% in May 2022. Desktop Chrome HTTP/3 share at around 74% of total HTTP/3 volume. Search bots at under 2% HTTP/3 usage. Used to establish the 2023-to-2026 inversion.
-
Zhang et al., "QUIC is not Quick Enough over Fast Internet", ACM Web Conference 2024 (WWW '24). Peer-reviewed measurement of QUIC vs HTTP/2 throughput across Chrome, Edge, Firefox, Opera, cURL, and quic_client on 1 Gbps Ethernet, 5G, and 4G networks. Key findings: up to 45.2% data rate reduction for QUIC at 1 Gbps, 500-600 Mbps bandwidth threshold where HTTP/2 starts outperforming HTTP/3, 13x packet processing overhead from missing UDP GRO support, and user-space ACK overhead consuming 3+ seconds vs negligible kernel time for TCP. Used to explain the Q1 2026 HTTP/3 plateau structurally rather than anecdotally.
-
web.dev Core Web Vitals documentation (2024 update). LCP good threshold at 2.5 seconds, INP good threshold at 200 milliseconds (INP replaced FID as a Core Web Vital in March 2024), CLS good threshold at 0.1. Used to frame the performance impact of HTTP/1.x on Google page experience signals.
Limitations: Cloudflare Radar reflects traffic visible to Cloudflare's network. Traffic that never touches Cloudflare (direct connections between non-Cloudflare servers, traffic routed through private peering that excludes Cloudflare) is underrepresented. HTTP/3 negotiation requires UDP port 443, so networks that block UDP will show artificially low HTTP/3 shares. The "bot" percentage (31.08%) uses Cloudflare's bot detection heuristics, which are conservative. The true share of automated traffic is likely higher. Country-level HTTP/1.x data should be cross-referenced against TLS version data to distinguish genuine legacy infrastructure from datacenter server-to-server traffic.
We plan to update this analysis quarterly as new Cloudflare Radar data becomes available, and to track whether HTTP/3's 500 Mbps performance ceiling is closed by the engineering fixes (UDP GRO deployment, ACK batching) recommended in the ACM 2024 paper.
Frequently asked questions
What is the current HTTP protocol adoption in 2026?
As of Q1 2026, HTTP/2 carries 51.04% of all global web requests, HTTP/1.x carries 27.84%, and HTTP/3 carries 21.11%, based on 30 days of Cloudflare Radar data (March 10 through April 9, 2026). HTTP/2 is growing slowly (+0.58 percentage points month over month) while HTTP/3 has actually declined slightly (-0.45 points). The encryption layer is essentially complete: 94.65% of requests are HTTPS, with only 5.35% still using plain HTTP. HTTP Archive's 2024 Web Almanac independently measures HTTP/1.1 at 15% request-level using clean browser crawls, and W3Techs measures HTTP/3 "support" at 38.8% at the website level. Both confirm the same general picture from different angles. As of the latest full month (May 2026), those shares are essentially unchanged — HTTP/2 51.08%, HTTP/1.x 27.72%, HTTP/3 21.20% — making the HTTP/3 plateau five months old and the three-protocol split a stable equilibrium rather than a transition. At the Q2 2026 close the full-quarter shares are HTTP/2 51.16%, HTTP/1.x 27.80%, and HTTP/3 21.04%, and the year-over-year comparison confirms the plateau is now a full year old: HTTP/3 was 20.50% in Q2 2025, so it moved just half a point over twelve months.
Why is HTTP/1.x still used in 2026?
HTTP/1.x persists in 2026 for three reasons. First, bot traffic (31% of all internet requests) disproportionately uses HTTP/1.1 clients like Python's requests library, curl, and older Go net/http clients. Second, server-to-server API calls in datacenter environments often run on HTTP/1.1 because the performance cost is negligible for point-to-point API calls and upgrading requires code changes. Third, some legacy websites and enterprise systems genuinely haven't been updated in years. The 12.84 percentage point gap between Cloudflare Radar's 27.84% HTTP/1.1 share and HTTP Archive's 15% HTTP/1.1 share (measured via fresh browser crawls) quantifies the bot and server-to-server layer. It's roughly half of all HTTP/1.1 traffic globally.
Is HTTP/3 actually faster than HTTP/2 in 2026?
Not universally. A peer-reviewed paper at the 2024 ACM Web Conference, "QUIC is not Quick Enough over Fast Internet" by Zhang et al., measured QUIC delivering up to 45.2% less throughput than HTTP/2 at 1 Gbps on Chrome. The performance gap begins at 500-600 Mbps. The root causes are QUIC's user-space ACK handling and missing UDP Generic Receive Offload (GRO) support in mainstream kernels. HTTP/3 still wins on high-latency and lossy networks (mobile, emerging markets), where Akamai has measured around 30% latency reduction. But on fast fiber broadband in developed markets, HTTP/2 is typically the faster choice in 2026. This explains why HTTP/3 adoption peaked in 2023, retreated through early 2026, and has now held flat near 21% for a full year (20.50% in Q2 2025, 21.04% in Q2 2026, inside a 0.6-point monthly band across January to May) rather than resuming its climb.
Is HTTP/3 the same as QUIC?
HTTP/3 and QUIC are related but distinct. QUIC is a transport protocol that runs on UDP and includes built-in encryption. HTTP/3 is the application-layer protocol that runs on top of QUIC. You can think of it as: HTTP/1.1 and HTTP/2 run on top of TCP (with TLS layered on TCP for HTTPS), while HTTP/3 runs on top of QUIC (which has TLS built in). In Cloudflare Radar data, "TLS QUIC" refers to the TLS variant bundled inside QUIC, which is functionally equivalent to TLS 1.3 but integrated with QUIC's handshake. In Q1 2026, TLS QUIC represents 22.19% of all TLS usage, which closely matches the 21.11% HTTP/3 share.
Which countries have the highest HTTP/3 adoption?
Italy leads at 30.20% HTTP/3 share, followed closely by Brazil (29.27%) and India (29.13%). These are all mobile-first or mobile-dominant markets where CDN edges push HTTP/3 aggressively because it performs better on high-latency, lossy mobile networks. Their median bandwidth is well below the 500 Mbps threshold where QUIC's throughput advantage starts to collapse. Mexico, Turkey, Indonesia, and Poland also have HTTP/3 shares well above the 21.11% global average. The countries with the lowest HTTP/3 adoption are Singapore (7.96%), Netherlands (10.82%), and China (14.70%), all for different reasons. Singapore and Netherlands because their traffic is dominated by datacenter server-to-server calls that don't use HTTP/3, and China because the Great Firewall infrastructure handles UDP less efficiently than TCP.
Does HTTP/1.x mean a website is insecure?
No. HTTP version (1.1 vs 2 vs 3) and encryption (HTTPS vs plain HTTP) are separate concerns. A website can run HTTP/1.1 over TLS 1.3 and be fully encrypted and secure. In 2026, 94.65% of all requests are encrypted regardless of HTTP version, and Qualys SSL Labs' SSL Pulse reports 75.3% of top websites supporting TLS 1.3. The question of HTTP version is about performance (head-of-line blocking, header compression, connection setup cost), not security. The real security signal at the protocol level is the TLS version, not the HTTP version. A site running TLS 1.0 or TLS 1.1 is a legitimate security concern. A site running HTTP/1.1 over TLS 1.3 is just slightly slower than it could be.
What is the "datacenter paradox" in HTTP version data?
The datacenter paradox is the observation that countries hosting large concentrations of cloud regions, CDN points of presence, and peering exchanges (Singapore, Netherlands, France) have unusually high HTTP/1.x shares despite being technologically advanced. The explanation is that their traffic is dominated by server-to-server calls, bot traffic, and API requests rather than consumer browsing. These server-side clients disproportionately use HTTP/1.1 because many older tooling libraries default to it. The HTTP Archive 2024 Web Almanac, which crawls with fresh browser profiles and excludes most server-to-server traffic, measures HTTP/1.1 at 15%, while Cloudflare Radar (which sees all traffic) measures it at 27.84%. The 12.84 percentage point gap is essentially the quantitative footprint of the datacenter paradox. To distinguish real legacy infrastructure from datacenter noise, you have to combine HTTP version data with TLS version data. Russia shows genuinely legacy patterns (37% HTTP/1.x + 13.7% TLS 1.2), while Singapore shows datacenter-effect patterns (52% HTTP/1.x + 81% TLS 1.3).
Why did HTTP/3 peak in 2023 and decline by 2026?
Cloudflare's own blog post in May 2023 reported HTTP/3 at 28% of global traffic and growing. By the Q2 2026 close, Cloudflare Radar shows HTTP/3 at 21.04% — down sharply from its 2023 peak, then flat near 21% for a full year (20.50% in Q2 2025, 21.04% in Q2 2026). The most likely explanation comes from the 2024 ACM Web Conference paper "QUIC is not Quick Enough over Fast Internet," which showed QUIC suffers up to 45.2% throughput reduction vs HTTP/2 above 500 Mbps bandwidth. As fiber broadband expanded in developed markets between 2023 and 2026, more consumer connections crossed the 500 Mbps threshold where HTTP/3 becomes slower than HTTP/2. The underlying engineering fixes (UDP Generic Receive Offload deployment, user-space ACK optimization, multi-threaded reception) exist but are not yet universally deployed. Until those fixes ship more broadly, HTTP/3 is likely to continue trading share with HTTP/2 in fast-bandwidth markets while holding ground in mobile-first regions.
How do you use HTTP version as a sales prospecting signal?
HTTP version alone is too noisy to use as a prospecting signal. The right approach combines three signals: HTTP version (is the site serving HTTP/1.1 to modern clients?), TLS version (is the server stuck on TLS 1.2?), and full technology fingerprint (what CMS, server software, analytics, and payment processors does the site run?). When all three signals align on "outdated," you have a real prospect for digital transformation, modern SaaS replacement, or infrastructure modernization tools. TechnologyChecker's detection engine tracks all three signals across 29.9 million active domains, which makes this multi-signal filtering practical at scale. Protocol data is the macro filter. Technology fingerprinting is the micro filter. In our own data, the number of globally reachable domains that match "HTTP/1.1 + TLS 1.2 + outdated CMS" as a combined filter is a few hundred thousand. Small enough to be an actionable sales list, not just a market sizing exercise.
Is post-quantum encryption widely used in 2026?
On the client side, yes, and it happened fast. At the Q2 2026 close, 54.15% of web requests used a post-quantum-capable key exchange (the X25519MLKEM768 hybrid), up from 28.96% a year earlier, crossing the majority threshold in twelve months. But that's the browser-to-edge leg. On the edge-to-origin leg, only 9.58% of origins support post-quantum key exchange. The migration is nearly complete at CDN edges and barely started at origin servers. (Source: Cloudflare Radar — http/summary/post_quantum and post_quantum/origin/summary/key_agreement, Q2 2025 / Q2 2026, pulled 2026-07-02.)
Did HTTP/3 adoption grow in 2026?
Barely. HTTP/3 was 20.50% of global web requests in Q2 2025 and 21.04% in Q2 2026, a move of half a percentage point across a full year, and the flattest twelve-month stretch in the protocol's published history. HTTP/2 (51.16%) gained about a point of share over the year, and all of it came from HTTP/1.x (27.80%, down from 29.32%), not from HTTP/3. On the wire, HTTP/3 has plateaued, not grown. (Source: Cloudflare Radar — http/summary/http_version, Q2 2025 / Q2 2026, pulled 2026-07-02.)
Which country has the highest HTTP/1.x share in 2026?
The Netherlands, at 52.58% of requests in Q2 2026, which overtook Singapore (50.31%) over the past year as Dutch HTTP/1.x rose and Singapore's eased. Neither is a legacy market. Both are datacenter hubs, so their high HTTP/1.x share reflects server-to-server calls and bot traffic running on modern TLS, not old websites. The Netherlands pairs its 52.58% HTTP/1.x with roughly 77% TLS 1.3. China (47.79%) and the United States (34.87%) round out the top of the request-level leaderboard. (Source: Cloudflare Radar — http/summary/http_version with location filter, Q2 2025 / Q2 2026, pulled 2026-07-02.)
David Thomson
CTO

