Turkey E-commerce Statistics 2026: The 4.57 Trillion TL Year, in 9 Charts and 7 Patterns We Saw
Turkey's e-commerce hit 4.57T TL in 2025. ETBİS data plus Q1 2026 Cloudflare Radar: Trendyol now #3 globally in Fast Fashion. Our crawl finds 955 Shopify stores.
Published •29 min read

Turkey's e-commerce volume reached 4.57 trillion TL ($115.43 billion) in 2025, a 52.2% jump from the previous year on 5.94 billion transactions. The country now ranks as the 4th fastest-growing e-commerce market in the world through 2030 at a 7.47% compound annual growth rate, per the Turkish Ministry of Trade's ETBİS report and Statista Market Insights.
Honestly, I didn't expect the picture to be this striking when I first opened the report. Turkey's growth rate puts it ahead of China, the U.S., Germany, and the worldwide average of 6.29%.
We combined that government dataset with the E-commerce in Turkey market dossier, then layered Q1 2026 (1 Jan – 31 Mar) Cloudflare Radar telemetry on top to ground the numbers in live internet behavior. Three findings really stood out: Turkey's flagship marketplace Trendyol now ranks #3 globally in Fast Fashion (ahead of Zara and H&M), ChatGPT sits in Turkey's top 10 most-visited domains, and 56% of Turkish HTTP traffic comes from mobile devices.
Key findings:
- Turkey's total e-commerce volume reached 4.57 trillion TL ($115.43B) in 2025, up 52.2% YoY. — Source: ETBİS / Turkish Ministry of Trade
- Turkey is the 4th fastest-growing e-commerce market globally through 2030 (CAGR 7.47%), behind only India, Japan, and Indonesia. — Source: Statista Market Insights forecast
- E-commerce now represents 19.3% of total trade and 6.9% of GDP in Turkey (2025). — Source: ETBİS
- 5.94 billion transactions were completed in 2025 (1.94 billion in retail alone). — Source: ETBİS
- Women drive 56% of marketplace transaction value and 74.6% of all transactions — the 25-29 female cohort hits an 82.3% share within its age group. — Source: ETBİS
- Quick commerce (under-1-hour or scheduled delivery) hit 388.7 billion TL in 2025, growing at a 138.7% compound annual rate since 2019. — Source: ETBİS
- The November campaign month delivered a 41.5% YoY volume jump across marketplaces; 11/11 was the single highest-volume day of the year. — Source: ETBİS
- Trendyol leads online retail with $4.9 billion in net sales — more than 4× the #2, Hepsiburada. — Source: ECDB
- 62.5% of e-commerce volume is paid by card, 3D Secure covers 64.1% of card transactions, and 91.3% of total volume stays within Turkey. — Source: ETBİS
- NEW Q1 2026 telemetry: Turkish HTTP traffic is 56% mobile / 44% desktop, Chrome holds 72% browser share, ChatGPT ranks #7 in Turkey's most-visited domains, and Trendyol's Fashion & Trends app ranks #3 globally in Fast Fashion — ahead of Zara, Asos, and Uniqlo. — Source: Cloudflare Radar
How big is Turkey's e-commerce market

The two datasets agree on direction but use different reference dates and currency baselines. The longer market-size series from the E-Commerce Info Platform and the Ministry of Trade covers 2016-2024 in Turkish lira. ETBİS extends through 2025 and reports both TL and USD figures. Reading them side-by-side reveals an economy that's compounded faster than almost any peer.
Turkey E-commerce Market Size 2016-2024: From 53.5B to 3 Trillion TL
Turkey's e-commerce market size grew from 53.5 billion TL in 2016 to 3,000 billion TL (3 trillion) in 2024 — a 56-fold nominal increase over eight years. After 2018 the curve steepens dramatically: the market jumped from 76.9B (2018) to 226B (2020) to 1,855B (2023) and finally to 3 trillion in 2024.
Source: E-Commerce Info Platform; Ministry of Trade Turkey · 2016-2024
| Year | Market size (billion Turkish lira) |
|---|---|
| 2016 | 53.5B TL |
| 2017 | 64.8B TL |
| 2018 | 76.9B TL |
| 2019 | 136B TL |
| 2020 | 226B TL |
| 2021 | 381B TL |
| 2022 | 800B TL |
| 2023 | 1855B TL |
| 2024 | 3000B TL |
- 56× nominal growth over 8 years (53.5B → 3,000B TL)
- Inflation-adjusted, growth is roughly 4× over the period
- 2022-2024 added 2.2 trillion TL in volume — more than the prior 6 years combined
According to E-Commerce Info Platform and Ministry of Trade data, the market was 53.5 billion TL in 2016 and reached 3,000 billion TL (3 trillion) by 2024. That's a 56× nominal increase over eight years. The 2024-to-2025 jump captured in the ETBİS report adds another 52.2%, putting the 2025 total at 4.57 trillion TL, of which 2.46 trillion TL is retail e-commerce (up 51.8% from 2024).
Turkey E-commerce Volume 2019-2025: 4.57 Trillion TL Total, 2.46 Trillion TL Retail
Turkey's total e-commerce volume grew from 136 billion TL in 2019 to 4,567 billion TL in 2025 — a 52.2% year-over-year jump and a 79.6% compound annual growth rate over the period. Retail e-commerce kept pace at 83.7% CAGR, reaching 2,457 billion TL.
Source: Turkish Ministry of Trade (ETBİS) · 2019-2025
| Year | Volume in billion Turkish lira |
|---|---|
| 2019 | 136B TL |
| 2020 | 226B TL |
| 2021 | 381B TL |
| 2022 | 800B TL |
| 2023 | 1855B TL |
| 2024 | 3000B TL |
| 2025 | 4567B TL |
- 33.6× growth in total e-commerce in 6 years (136B → 4,567B TL)
- 52.2% year-over-year growth in 2025
- Retail e-commerce CAGR (83.7%) outpaces general e-commerce CAGR (79.6%)
The ETBİS chart above tells the cleanest version of the growth story. Total e-commerce climbed from 136 billion TL in 2019 to 4,567 billion TL in 2025. That's a 2019-2025 compound growth rate of 79.6% for the broader category and 83.7% for retail-only. These numbers include FX-driven inflation effects, but even after adjusting for inflation the underlying volume trend is structural, not transitory.
Dollar-denominated view and GDP share
For international readers, USD figures matter more than TL because lira inflation distorts the time series. The ETBİS report includes both views.
Turkey E-commerce in USD 2019-2025: From $23.9B to $115.4B (30% CAGR)
Turkey's e-commerce volume in USD grew from $23.94 billion in 2019 to $115.43 billion in 2025, a 30% compound annual growth rate that filters out lira inflation effects. The 2025 jump from $89.58B was +28.9% year-over-year, the steepest single-year jump in the time series.
Source: Turkish Ministry of Trade (ETBİS) · 2019-2025
| Year | E-commerce volume (USD billions) |
|---|---|
| 2019 | $23.94B |
| 2020 | $31.96B |
| 2021 | $43.07B |
| 2022 | $47.63B |
| 2023 | $77.89B |
| 2024 | $89.58B |
| 2025 | $115.43B |
- 30% compound annual growth in USD terms (4.8× over 6 years)
- +28.9% YoY in 2025 — the steepest single-year jump on record
- USD view filters out lira inflation, showing genuine real growth
In USD terms, Turkey's e-commerce volume grew from $23.94 billion (2019) to $115.43 billion (2025) — a 30% compound annual growth rate. The 2024-to-2025 jump alone was +28.9%, the steepest single-year increase on record. As a share of GDP, e-commerce expanded from 2.7% in 2019 to 6.9% in 2025, with retail e-commerce alone occupying 3.5% of GDP (2024 data) and non-retail another 3%.
Turkey E-commerce Share of GDP 2019-2025: 2.7% to 6.9%
Turkey's e-commerce share of GDP expanded from 2.7% in 2019 to 6.9% in 2025. The 2024 reading sits at 6.5% before climbing back to 6.9% in 2025.
Source: Turkish Ministry of Trade (ETBİS) · 2019-2025
| Year | E-commerce share of GDP |
|---|---|
| 2019 | 2.7% |
| 2020 | 4.1% |
| 2021 | 5.1% |
| 2022 | 5.1% |
| 2023 | 6.8% |
| 2024 | 6.5% |
| 2025 | 6.9% |
- 2.55× expansion of e-commerce in GDP share over 6 years
- 2024 dip to 6.5% reflects strong physical retail recovery, not e-commerce decline
- Non-retail e-commerce now occupies 3% of GDP — services drive nearly half of the total
ETBİS extends the series to 2025 at 6.9% — back above 2023's 6.8% reading after a temporary 2024 dip to 6.5%.
Where Turkey sits globally

Turkey 4th Fastest-Growing E-commerce Market Globally: 7.47% CAGR 2025-2030
Turkey ranks as the 4th fastest-growing retail e-commerce market in the world through 2030, with a projected 7.47% compound annual growth rate. Only India (11.77%), Japan (9.67%), and Indonesia (7.75%) grow faster. Turkey's CAGR beats China (7.41%), the worldwide average (6.29%), the United States (5.59%), Germany (4.98%), and Canada (4.90%).
Source: Statista Market Insights · 2025-2030
| Country | Retail e-commerce CAGR 2025-2030 |
|---|---|
| India | 11.77% |
| Japan | 9.67% |
| Indonesia | 7.75% |
| Turkey | 7.47% |
| China | 7.41% |
| Worldwide avg | 6.29% |
| Mexico | 6.14% |
| Spain | 5.9% |
| United States | 5.59% |
| Italy | 5.33% |
| Germany | 4.98% |
| Canada | 4.9% |
- Turkey ranks 4th globally — only India, Japan, and Indonesia grow faster
- Turkey's CAGR (7.47%) beats the worldwide average (6.29%) by 118 basis points
- Turkey outpaces every G7 economy except Japan in projected e-commerce growth
The Statista Market Insights cross-country growth forecast is the cleanest way to position Turkey internationally. Turkey's 7.47% retail e-commerce CAGR (2025-2030) beats the worldwide average (6.29%) by 118 basis points. It puts the country ahead of China (7.41%), Mexico (6.14%), Spain (5.90%), the United States (5.59%), Italy (5.33%), Germany (4.98%), and Canada (4.90%). Only India (11.77%), Japan (9.67%), and Indonesia (7.75%) outpace it.
That said, Turkey still trails Europe in adoption depth. The Ecommerce Europe 2024 benchmark shows 73% of the European population shopped online, compared with 55.7% of the Turkish population. That's a 17.3 percentage point gap.
Online Shoppers Turkey vs Europe 2024: 55.7% vs 73% Population Penetration
In 2024, 55.7% of Turkey's population shopped online, compared with 73% across the 38 European countries included in the European E-commerce Report 2025 — a 17.3 percentage point gap. For operators, that gap is the opportunity: Turkey is growing faster than Europe from a lower penetration base, so per-user spending and order frequency still have meaningful headroom before the market reaches saturation.
Source: Ecommerce Europe; LinkedIn; Ministry of Trade Turkey; TurkStat · 2024
| Region | Share of population shopping online |
|---|---|
| Europe (38 countries) | 73% |
| Turkey | 55.7% |
- 17.3 percentage point penetration gap versus Europe
- Turkey's gap is the upside — faster growth from a lower base
- Turkey's penetration today is roughly where Western Europe sat 5-7 years ago
For operators, that gap is the opportunity. Turkey is growing faster than Europe from a lower penetration base, so per-user spending and order frequency still have meaningful headroom before the market reaches saturation.
Elif Arslan, CMO at TechnologyChecker: "I've been pitching Turkey as the next high-growth e-commerce play for two years now, and the 7.47% CAGR finally gives me clean evidence to point at. What I tell European brands considering entry is this: the same playbook that worked in Poland and Romania between 2018 and 2022 — heavy mobile spend, taksit (installment) integration, fast-shipping promises — works in Turkey today, but on a much larger consumer base. The window is open, but it's not unlimited. By the time the penetration gap with Europe closes, the customer-acquisition costs will look like Germany's."
E-commerce share of retail keeps climbing

Turkey E-commerce Share of Retail 2016-2023: From 4% to 18.3%
E-commerce's share of total retail in Turkey climbed from just 4% in 2016 and 2017 to 18.3% in 2023 — a 4.6× expansion. The 2020 jump from 8.3% to 15.8% reflects pandemic lockdown behavior, but the continued rise to 18.3% through 2023 (and 19.3% per ETBİS in 2025) confirms the shift is structural rather than transitory.
Source: Dogma Alares; Euromonitor; iyzico · 2016-2023
| Year | E-commerce share of total retail |
|---|---|
| 2016 | 4% |
| 2017 | 4% |
| 2018 | 5.3% |
| 2019 | 8.3% |
| 2020 | 15.8% |
| 2021 | 17.9% |
| 2022 | 16.7% |
| 2023 | 18.3% |
- Retail e-commerce share nearly doubled from 8.3% to 15.8% in a single year (2019-2020)
- Post-pandemic share kept climbing despite physical retail reopening
- ETBİS 2025 reading of 19.3% confirms the upward trend is structural
E-commerce's share of total retail in Turkey was just 4% in both 2016 and 2017. It ticked up to 5.3% in 2018 and 8.3% in 2019, then doubled to 15.8% in 2020 as pandemic lockdowns reshaped behavior. The share kept climbing post-pandemic: 17.9% (2021), 16.7% (2022), 18.3% (2023). The 2025 ETBİS data point of 19.3% confirms the upward trend is structural, not a Covid spike. For comparison, retail e-commerce penetration in Turkey now exceeds Germany's recent benchmark.
E-commerce by sector: where the money goes
The two datasets take complementary cuts of the sector data. The international segmentation groups categories as Fashion, Beauty, Consumer Electronics, Food, Furniture, Toys & Hobby, Beverages, and Media. ETBİS uses Turkish industry classifications that surface domestic patterns, particularly the strength of "Yemek" (food delivery) and "Beyaz Eşya" (white goods).
Forward-looking Market Insights forecasts have Fashion staying the dominant segment, projected to reach about $15 billion by 2029, roughly double Consumer Electronics and Food. Beauty & Personal Care and Furniture grow steadily in the mid-single billions. The combined segment market is forecast to push past $31 billion by 2029.
2024 vs 2025 by sector (ETBİS data)
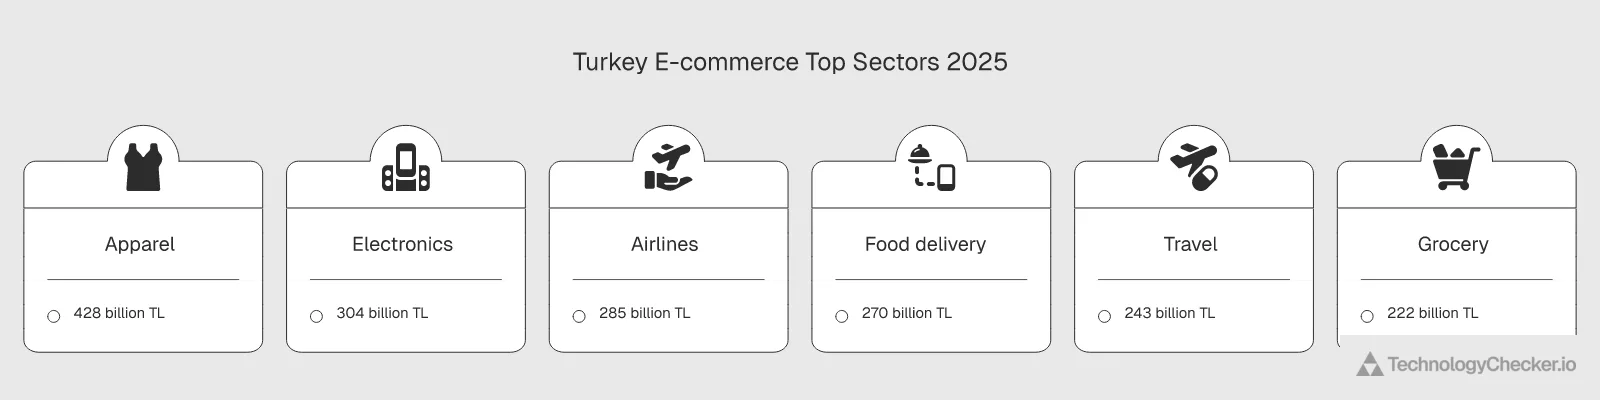
Turkey E-commerce Sector Volumes 2024 vs 2025: Apparel Leads at 428.7B TL
Apparel, Footwear & Accessories leads Turkish e-commerce at 428.7 billion TL in 2025 — about one-sixth of total retail e-commerce. Electronics grew fastest in absolute terms (+127B TL year-over-year, +72%), and Education & Consulting Services more than doubled (+113.1%). White Goods showed the weakest growth (+12.7%), reflecting durable-goods cycle exposure.
Source: Turkish Ministry of Trade (ETBİS) · 2024-2025
| Sector | E-commerce volume (billion TL) |
|---|---|
| Apparel & Accessories | 428.7B TL |
| Electronics | 304.34B TL |
| Airlines | 285.44B TL |
| Food delivery | 270.16B TL |
| Travel & Logistics | 243.43B TL |
| Grocery | 221.93B TL |
| Home & Furniture | 215.57B TL |
| White Goods | 196.04B TL |
| Cosmetics & Personal Care | 145.7B TL |
| Education & Consulting | 59.28B TL |
- Apparel leads at 428.7B TL — one-sixth of total retail e-commerce
- Electronics added +127B TL year-over-year (+72%) — biggest absolute jump
- Education & Consulting Services more than doubled (+113.1% YoY)
The government data lays out 2025 sector volumes in TL with year-over-year growth:
| Sector | 2024 (B TL) | 2025 (B TL) | YoY Growth |
|---|---|---|---|
| Giyim, Ayakkabı ve Aksesuar (Apparel) | 301.34 | 428.70 | +42.3% |
| Elektronik | 176.92 | 304.34 | +72.0% |
| Havayolları (Airlines) | 208.90 | 285.44 | +36.6% |
| Yemek (Food delivery) | 171.42 | 270.16 | +57.6% |
| Seyahat ve Taşımacılık | 180.23 | 243.43 | +35.1% |
| Gıda ve Süpermarket (Grocery) | 144.29 | 221.93 | +53.8% |
| Ev, Bahçe, Mobilya | 143.72 | 215.57 | +50.0% |
| Beyaz Eşya ve Küçük Ev Aletleri | 173.89 | 196.04 | +12.7% |
| Medikal, Kişisel Bakım ve Kozmetik | 90.32 | 145.70 | +61.3% |
| Eğitim ve Danışmanlık | 27.82 | 59.28 | +113.1% |
Apparel, Footwear & Accessories is the largest single sector at 428.7 billion TL, about one-sixth of total retail e-commerce. Electronics grew the fastest in absolute terms (+127 billion TL), and Education & Consulting Services more than doubled (+113.1%). The modest growth in White Goods (+12.7%) likely reflects the sector's exposure to durable-goods cycle dynamics.
Average basket value by sector
Sector mix matters because average basket sizes differ dramatically. The 2024 cart-value data from the E-Commerce Info Platform and the Ministry of Trade ranks Home, garden, furniture, and decoration first at 15,733 TL, more than 38× the food and supermarkets cart of 405 TL. The ETBİS 2025 cart-value data confirms this hierarchy: White Goods (10,513 TL), Home/Garden (9,388 TL), and Cosmetics (3,062 TL) lead, while Grocery sits at 889 TL average. Operators in low-AOV categories need volume. Operators in high-AOV categories need conversion.
Cancellation and return rates
ETBİS publishes a piece of data the international datasets don't: sector-level cancellation and return rates. The leader is Apparel/Footwear at 21.6%, followed by Electronics (12.0%) and Sports/Outdoor (11.4%). At the other end, Cosmetics returns only 3.2%, Pet Products 3.4%. Anyone running a fashion brand in Turkey is operationally running a returns business. The gap to Cosmetics shows just how much category mix changes unit economics.
Who shops online in Turkey

Across marketplaces in 2025, 56% of transaction value comes from women and 44% from men. On a transaction-count basis the skew is much stronger. 74.6% of orders are placed by women, only 25.4% by men. So women shop more frequently. Men spend more per order.
Turkey E-commerce Spending by Age Group 2025: Peak at 25-34 (37.9%)
Turkish e-commerce spending peaks sharply in the 25-34 age range. The 25-29 group accounts for 18.2% of transaction value and 21.2% of transaction count; the 30-34 group adds another 19.7% of value and 21.4% of count. Together they drive 37.9% of value and 42.6% of all transactions. Volume drops sharply after age 50, with the 65+ groups together representing under 3% of activity.
Source: Turkish Ministry of Trade (ETBİS) · 2025
| Age group | Share of e-commerce activity |
|---|---|
| 15-19 | 0.6% |
| 20-24 | 8% |
| 25-29 | 18.2% |
| 30-34 | 19.7% |
| 35-39 | 18.1% |
| 40-44 | 15% |
| 45-49 | 10.2% |
| 50-54 | 5.3% |
| 55-59 | 2.7% |
| 60-64 | 1.4% |
| 65-69 | 0.6% |
| 70-74 | 0.2% |
- 25-34 age range drives 37.9% of value and 42.6% of all transactions
- Value share is higher than count share past age 35 — older shoppers buy fewer items but spend more per order
- 65+ groups together represent under 3% of e-commerce activity
By age, the peak shopper is in the 25-34 bracket. The 25-29 group accounts for 18.2% of transaction value and 21.2% of transaction count, and 30-34 hits 19.7% of value and 21.4% of count. Volume falls sharply after age 50, with the 65+ groups together representing under 3% of activity.
Turkey E-commerce Female Transaction Share by Age 2025: 82.3% in the 25-29 Cohort
On Turkish marketplaces in 2025, the female transaction share peaks at 82.3% in the 25-29 age group and stays above 64% through age 49. The female share gradually declines with age and roughly reaches parity around age 70. For brands targeting Gen Z and young Millennials in Turkey, the marketplace audience is overwhelmingly female.
Source: Turkish Ministry of Trade (ETBİS) · 2025
| Age group | Share of marketplace transactions |
|---|---|
| 15-19 | 67.1% |
| 20-24 | 80.4% |
| 25-29 | 82.3% |
| 30-34 | 78.6% |
| 35-39 | 73.6% |
| 40-44 | 68.3% |
| 45-49 | 64.8% |
| 50-54 | 63.2% |
| 55-59 | 59% |
| 60-64 | 54.4% |
| 65-69 | 51.6% |
| 70-74 | 49% |
- Female share peaks at 82.3% in the 25-29 cohort
- Female share stays above 64% through age 49
- Cross-gender parity not reached until age 70+ — marketplace audience is female-skewed at every working-age bracket
When gender is cross-tabulated against age, the female-skew is most pronounced in the late-20s to mid-30s. Among 25-29-year-olds, 82.3% of all transactions on marketplaces are by women (only 17.7% by men). Among 20-24, women drive 80.4%. The female share gradually declines with age and roughly reaches parity around age 70+. For brands targeting Gen Z and young Millennials, the market is overwhelmingly female.
Elif Arslan, CMO at TechnologyChecker: "The 82.3% female share in the 25-29 bracket is one of those numbers I keep showing to clients because they don't believe it until they see the chart. When I'm reviewing a Turkish brand's paid social spend, the first thing I check is whether their creative pipeline reflects that ratio. Usually it doesn't. Most brands still split their fashion and beauty creative roughly 60/40 female/male because that's what the global template says. In Turkey the right split is closer to 80/20, and the gap between those two ratios is where conversion gets quietly lost."
Where each sector skews demographically
The ETBİS sector × age cross-tabulation surfaces patterns that are directly actionable for category buyers:
- Mom & Baby peaks hard at age 30-34 (33.1%) — the post-childbirth window.
- Food delivery (Yemek) is youngest, concentrated in 20-29 (22.3% + 32.1% = 54.4%).
- Apparel has the most even spread across 20-44.
- White Goods skew older (40-49 holds 24.2%) — durable purchase decisions track household-formation age.
- Cosmetics peaks at 25-29 (21.5%) and decays smoothly past 35.
And by gender × sector: Cosmetics is 80.4% female, Apparel 82.7% female, Mom & Baby 78.7% female, Software 91.1% male, and Automotive Parts 61.1% male. Marketplace category managers can use this directly to tune segmented advertising spend.
When Turks shop online: hourly and daily patterns

This is the area where the government report adds the most operational value. ETBİS has direct access to virtual POS transaction data not surfaced by other public datasets.
Turkey E-commerce Share by Hour of Day 2025: 58.7% Overnight, 11.9% Mid-Afternoon
Turkish e-commerce dominates the overnight hours (00:00-06:00) with a 58.7% share of total transaction volume, while traditional retail dominates during working hours. The 15:00-19:00 window is the lowest e-commerce share at 11.9% as physical stores peak. Programmatic media buyers should weight bid floors and creative rotation toward late-evening and overnight windows.
Source: Turkish Ministry of Trade (ETBİS) · 2025
| Hour-of-day bucket | Share of total trade volume |
|---|---|
| 00:00-06:00 | 58.7% |
| 06:00-11:00 | 18% |
| 11:00-15:00 | 14.2% |
| 15:00-19:00 | 11.9% |
| 19:00-23:00 | 30.6% |
| 23:00-00:00 | 50.7% |
- E-commerce wins overnight with 58.7% share of transactions
- Physical retail dominates 06:00-19:00 (82-88% share)
- Evening crossover at 23:00 — e-commerce overtakes traditional after midnight
The hourly comparison shows when consumers shift from physical retail to online. During the working day (06:00-19:00), traditional retail dominates with 82-88% of transaction volume in each hour. After 19:00 that ratio collapses. Between 23:00 and 06:00, e-commerce takes 50.7% of transactions. Between 00:00 and 06:00, it hits 58.7%. That's the moment when e-commerce's 7/24 availability advantage is strongest, and brands buying programmatic media should weight bid floors accordingly.
On a weekday basis, Saturday is the highest e-commerce share at 26.6% and Sunday next at 26.4%. Weekdays cluster in the 15.6-17.1% range. The weekend lift makes sense: consumers have more discretionary time and use e-commerce as the default rather than visiting physical stores.
Peak and quiet days of the year

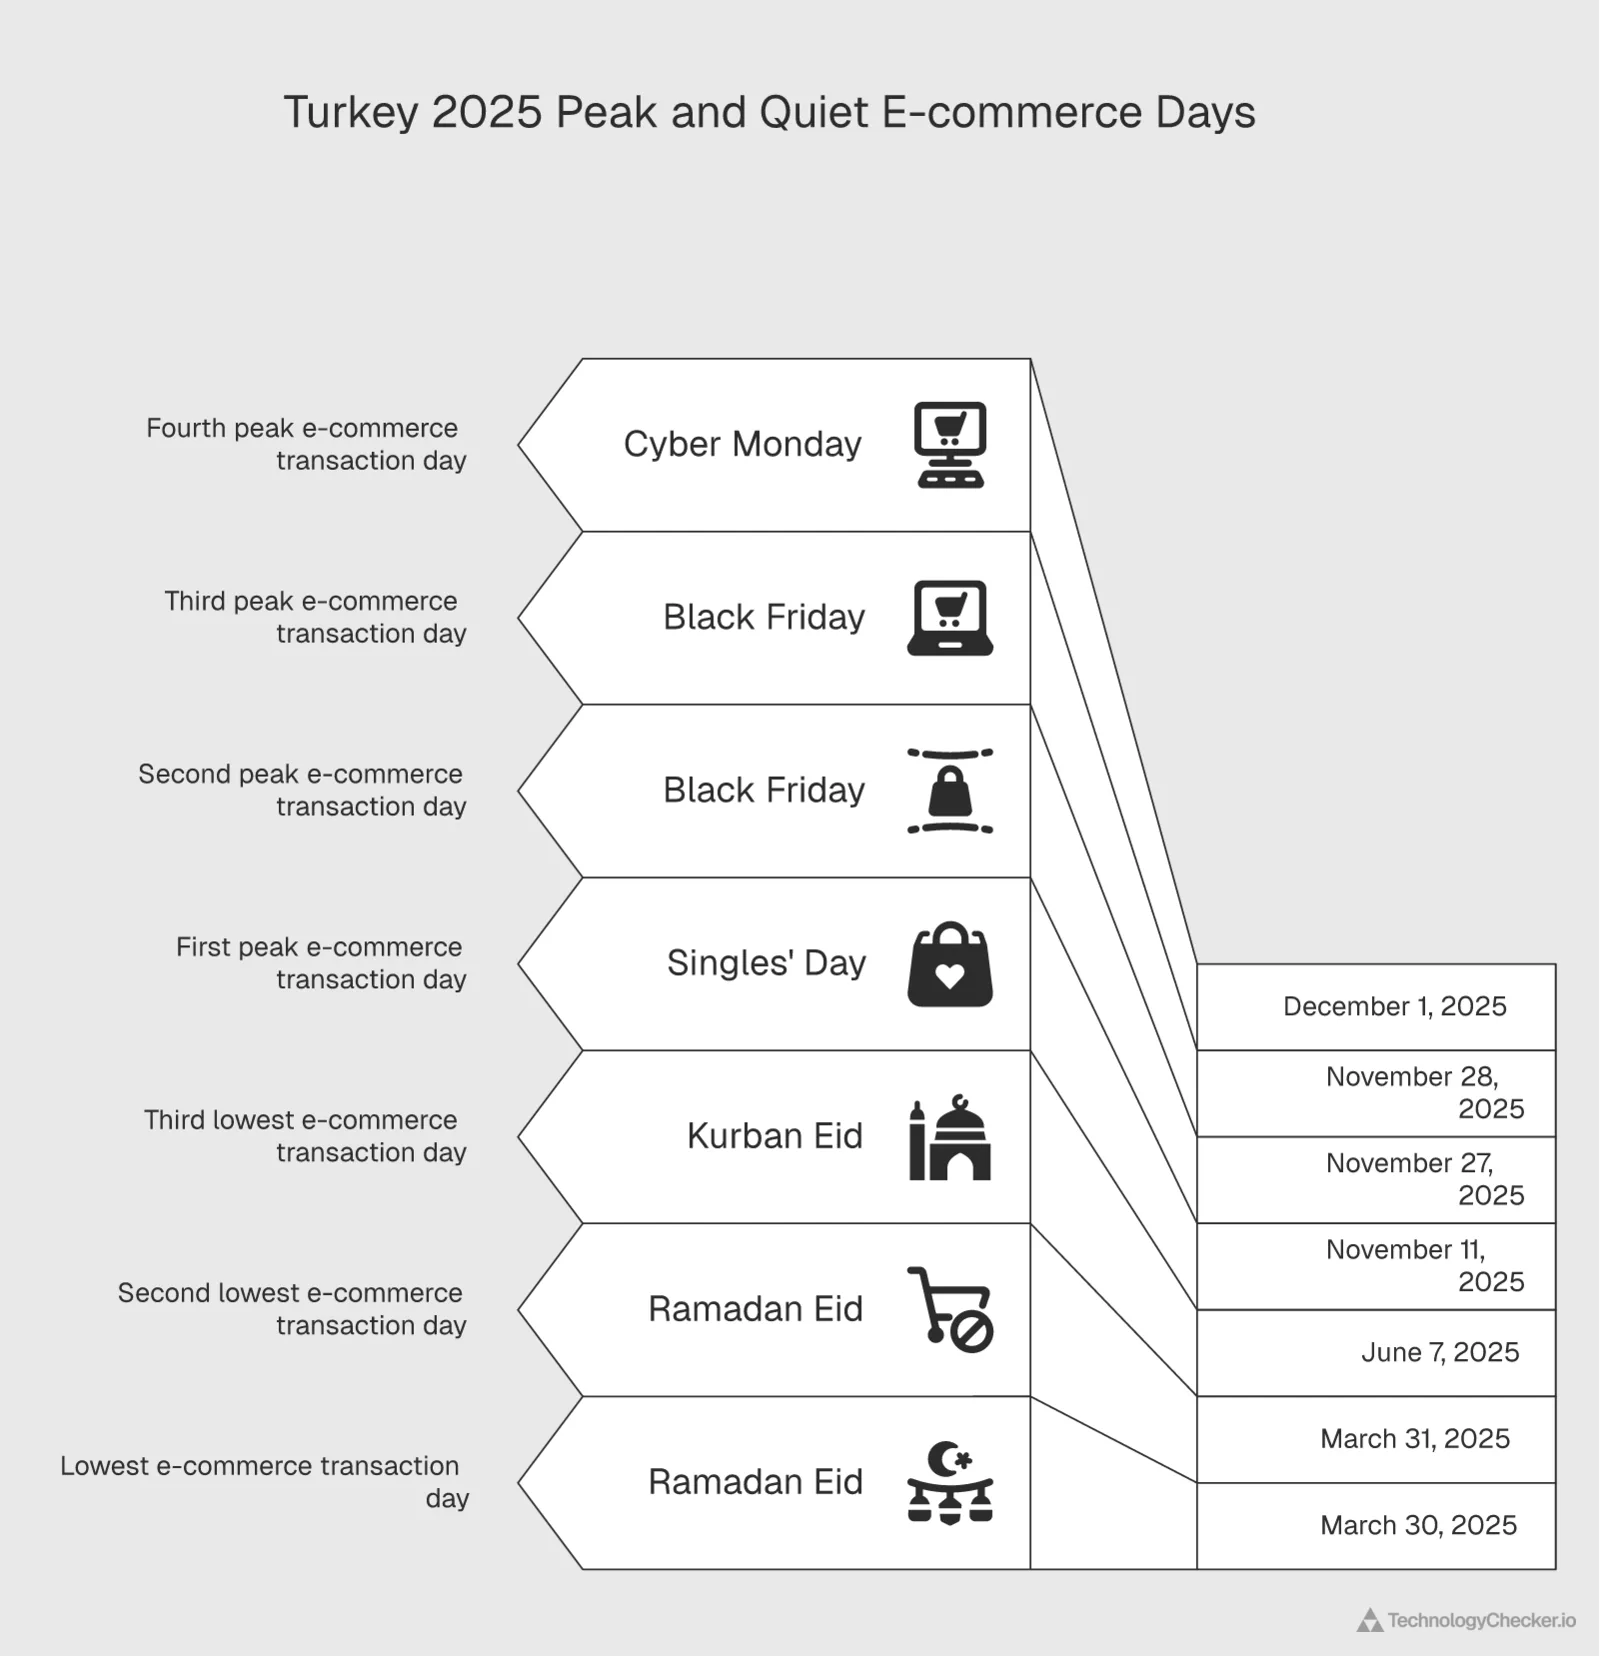
The single-day rankings tell two stories. The top 10 highest-transaction days of 2025 are dominated by November campaign dates. 11/11 sits first at 0.79% of annual transactions in a single day, nearly 3× the daily average of 0.274%. November campaigns occupy 7 of the top 10 slots.
| Rank | Date | % of annual transactions | Event |
|---|---|---|---|
| 1 | 11.11.2025 | 0.79% | Kasım Kampanyaları (11/11) |
| 2 | 27.11.2025 | 0.62% | Kasım Kampanyaları |
| 3 | 28.11.2025 | 0.53% | Kasım Kampanyaları (Black Friday) |
| 4 | 06.11.2025 | 0.48% | Kasım Kampanyaları |
| 5 | 01.12.2025 | 0.47% | Cyber Monday |
| 6 | 05.11.2025 | 0.43% | Kasım Kampanyaları |
| 7 | 01.07.2025 | 0.42% | — |
| 8 | 10.11.2025 | 0.42% | Kasım Kampanyaları |
| 9 | 01.08.2025 | 0.41% | — |
| 10 | 07.11.2025 | 0.41% | Kasım Kampanyaları |
The 10 quietest days are equally telling. Five of them fall in Ramadan/Eid (Ramazan Bayramı) or Kurban Bayramı (Eid al-Adha). The 1st day of Ramadan Eid (30.03.2025) had just 0.12% of annual transactions, barely a third of an average day:
| Rank | Date | % of annual transactions | Event |
|---|---|---|---|
| 1 | 30.03.2025 | 0.12% | Ramazan Bayramı 1st Day |
| 2 | 31.03.2025 | 0.14% | Ramazan Bayramı 2nd Day |
| 3 | 29.03.2025 | 0.15% | Ramazan Bayramı Eve |
| 4 | 07.06.2025 | 0.15% | Kurban Bayramı 2nd Day |
| 5 | 26.01.2025 | 0.16% | — |
| 6 | 04.01.2025 | 0.17% | — |
| 7 | 25.01.2025 | 0.17% | — |
| 8 | 22.02.2025 | 0.17% | — |
| 9 | 08.06.2025 | 0.17% | Kurban Bayramı 3rd Day |
For operators, religious holidays are the inverse of November campaigns. Avoid scheduling launches, but use them as natural cooldown windows.
Elif Arslan, CMO at TechnologyChecker: "When I plan annual campaign calendars for clients selling into Turkey, I literally print these two tables and pin them above my desk. The 0.79% single-day reading on 11/11 isn't theoretical: I've seen one fashion client's revenue do a 4.2× spike on that exact date with the same creative they'd been running all year. The mirror image is just as important. If you fire a paid social burn on the first day of Ramadan Eid, you're spending impressions that have a third of the conversion potential of a normal Tuesday. I've made that mistake once, in 2022, and it cost a client roughly six figures in wasted ad spend."
Where Turkey shops: regional and city patterns

ETBİS publishes an E-Ticarete Uyum Endeksi (E-Commerce Adaptation Index) that combines four indicators: e-commerce share of provincial GDP, share of businesses doing e-commerce, sales-to-purchase ratio, and e-commerce volume per business. The 2025 top 10 and bottom 5:
| Rank | Province | Adaptation Index | Notes |
|---|---|---|---|
| 1 | İstanbul | 93.10 | Hosts 42% of all national e-commerce businesses |
| 2 | Çorum | 71.03 | Unusual #2 — exports 181% of what residents buy |
| 3 | Kayseri | 69.62 | Manufacturing hub with strong export ratio |
| 4 | Kocaeli | 69.38 | Industrial concentration drives export-led score |
| 5 | Ankara | 64.90 | Capital — second-largest absolute volume |
| 6 | İzmir | 64.49 | Major coastal commercial hub |
| 7 | Bursa | 63.35 | Industrial textile + automotive base |
| 8 | Gaziantep | 58.52 | Largest economy in Southeast Anatolia |
| 9 | Eskişehir | 58.51 | Education + light industrial economy |
| 10 | Adana | 58.01 | Agriculture and logistics hub |
| ... | ... | ... | ... |
| 77 | Hakkâri | 27.72 | Lowest sales-to-purchase ratio |
| 78 | Kırşehir | 27.38 | — |
| 79 | Bitlis | 25.73 | — |
| 80 | Tunceli | 25.06 | — |
| 81 | Iğdır | 25.03 | Lowest in Turkey |
Çorum's #2 placement is the odd one. It ranks high because its sales-to-purchase ratio is 180.96%, meaning it exports far more e-commerce volume than residents buy. The index favors industrial/production hubs over consumption hubs, which is why Kayseri and Kocaeli outrank larger Ankara on adaptation depth even if Ankara has more absolute volume.
By absolute sales volume (2025): İstanbul (2,813 billion TL), 61.6% of national volume, Ankara (288.79), İzmir (178.28), Kocaeli (113.14), Bursa (105.25). The top five provinces alone account for roughly 76% of national e-commerce sales.
Turkey Top E-commerce Cities 2021-2023: Istanbul Reaches 218,500 Businesses
Istanbul concentrates Turkey's e-commerce businesses faster than any other province. The city grew from 131,300 e-commerce businesses in 2021 to 218,500 in 2023 — a 66% increase. Ankara nearly doubled from 26,300 to 50,101 over the same period. By the 2025 ETBİS count, Istanbul alone hosts 267,934 e-commerce businesses — about 42% of Turkey's national total.
Source: E-Commerce Info Platform; Ministry of Trade Turkey · 2021-2023
| City | Number of e-commerce businesses |
|---|---|
| Istanbul | 218500 |
| Ankara | 50101 |
| Izmir | 41000 |
| Bursa | 25500 |
| Antalya | 20000 |
| Kocaeli | 13500 |
| Konya | 13000 |
| Adana | 11000 |
| Kayseri | 9500 |
| Mersin | 8000 |
- Istanbul added 87,200 e-commerce businesses in 2 years (66% growth)
- Ankara nearly doubled — 26,300 to 50,101
- Top 3 cities (Istanbul, Ankara, Izmir) host more e-commerce businesses than the rest of Turkey combined
The longitudinal Ministry of Trade city data shows e-commerce businesses concentrating fast. Istanbul went from 131,300 (2021) to 218,500 (2023), a 66% increase. Ankara nearly doubled from 26,300 to 50,101. By the 2025 ETBİS count, Istanbul alone hosts 267,934 e-commerce businesses, about 42% of Turkey's national total of 634,611.
Marmara dominates orders
The IdeaSoft 2023 regional breakdown of e-commerce orders confirms the geographic skew. Marmara: 42.08%, Central Anatolia 16.8%, Black Sea 14.49%, Mediterranean 10.08%, Aegean 7.92%, Eastern Anatolia 4.57%, Southeastern Anatolia 4.06%.
How Turks pay online
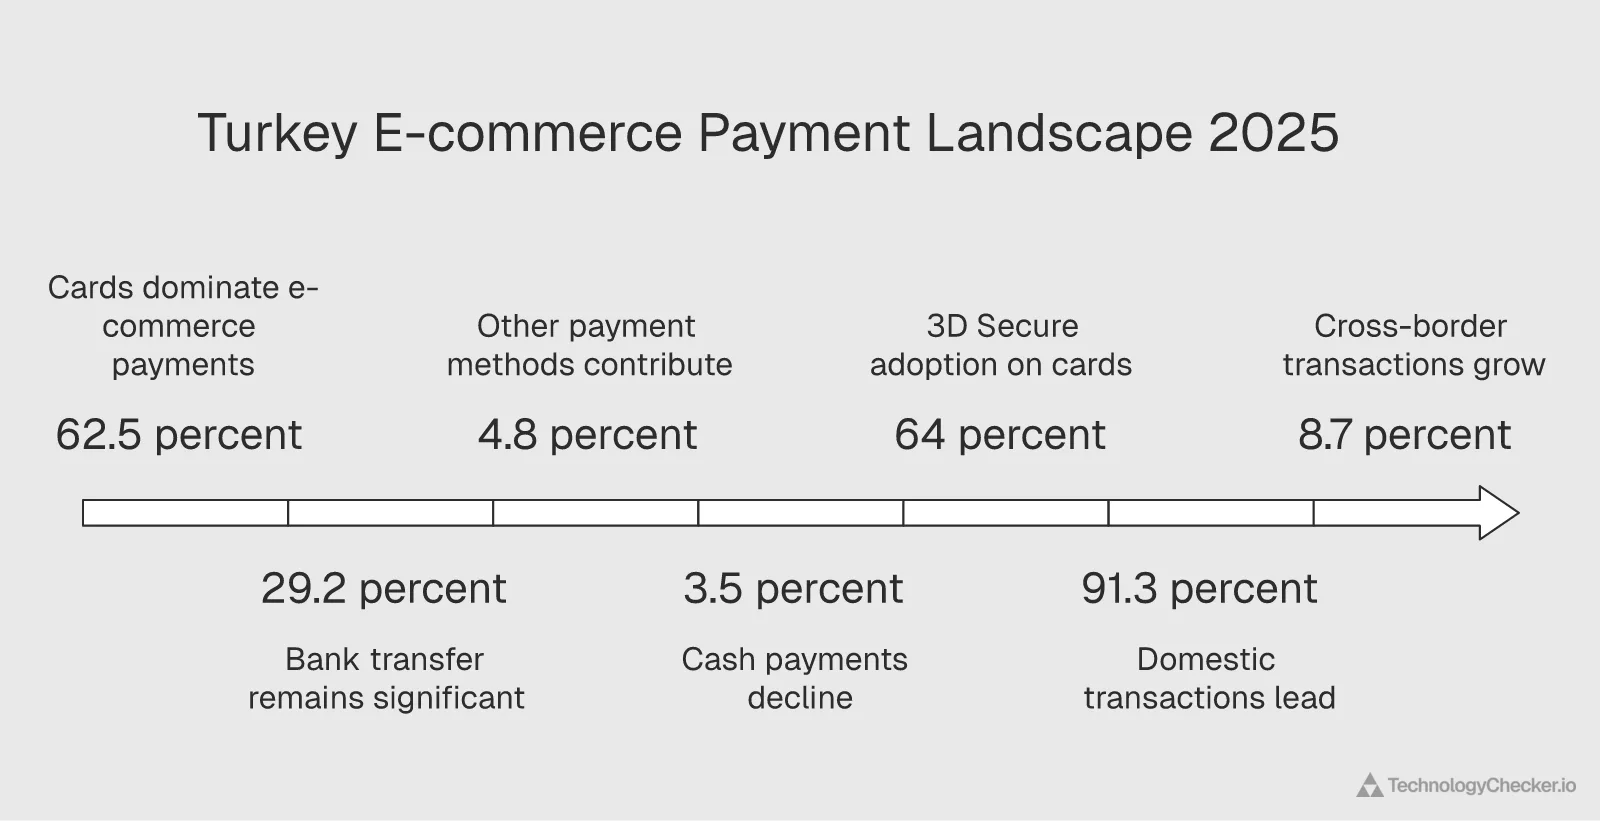
Turkey E-commerce Payment Method Share 2025: Cards 62.5%, Bank Transfer 29.2%
Cards (credit and debit combined) account for 62.5% of Turkish e-commerce transaction volume in 2025, with bank transfer (Havale/EFT) at 29.2% and cash on delivery now just 3.5%. Other methods — multi-payment, digital wallet, prepaid card, shopping credit — make up the remaining 4.8%. 3D Secure is used on 64.1% of online card transactions, and 91.3% of total e-commerce volume stays within Turkey.
Source: Turkish Ministry of Trade (ETBİS) · 2025
| Payment method | Share of e-commerce transaction volume |
|---|---|
| Credit / Debit card | 62.5% |
| Bank transfer (Havale/EFT) | 29.2% |
| Other (wallet, prepaid, etc.) | 4.8% |
| Cash on delivery | 3.5% |
- Cards dominate but bank transfer is unusually high at 29.2% — reflecting Turkey's FAST instant payment infrastructure
- Cash on delivery has collapsed to 3.5% — down from double-digit shares a decade ago
- 3D Secure used on 64.1% of card transactions; cross-border share just 8.7% of total volume
Cards remain dominant. According to ETBİS, 62.5% of 2025 e-commerce volume is paid by credit/debit card, with 29.2% via bank transfer (Havale/EFT). Cash on delivery is now just 3.5%, and other methods (multi-payment, digital wallet, prepaid card, shopping credit) total 4.8%.
The GlobalData / Worldpay 2016-2025 payment-method panel tells a longer story:
| Payment method | 2016 | 2020 | 2025 | 2030 (forecast) |
|---|---|---|---|---|
| Credit card | 80% | 52% | 52% | 47% |
| A2A (Account-to-Account) | – | – | 14% | 21% |
| E-wallet / Mobile wallet | 7% | 9% | 13% | 18% |
| Debit card | 6% | 9% | 12% | 8% |
| Cash | 3% | 6% | 5% | 3% |
Credit card share has dropped from 80% to 52% in a decade, ceding ground to A2A payments (FAST/Açık Bankacılık) and digital wallets such as Google Pay. By 2030, the underlying GlobalData / Worldpay forecast has E-wallets at 18% and A2A at 21%. Together that's more than double the 2025 base.
Security and cross-border behavior
ETBİS adds two operational stats not surfaced by the international payment-method panel:
- 3D Secure is used on 64.1% of online card transactions in 2025. Strong, but not universal.
- 91.3% of e-commerce volume stays within Turkey. Turkish residents buy 5.0% from foreign sites and foreign residents buy 3.7% from Turkish sites. Cross-border represents about 8.7% of total volume, small but growing.
What drives Turkish consumers to buy

Top Online Purchase Drivers in Turkey 2025: Free Delivery (55.2%) Beats Discounts
Free delivery is the single biggest conversion lever in Turkish e-commerce, cited by 55.2% of internet users in Q2 2025 — 14 percentage points ahead of coupons and discounts (41.6%). Easy returns policy (46.2%) ranks second. Interest-free installments (taksit) remain a Turkish-specific signal at 25.1% — much higher than the global benchmark. Any merchant operating in Turkey without configured installment plans is leaving conversion on the table.
Source: DataReportal; GWI; Meltwater; We Are Social · Q2 2025
| Purchase driver | Share of respondents citing this driver |
|---|---|
| Free delivery | 55.2% |
| Easy returns policy | 46.2% |
| Coupons & discounts | 41.6% |
| Customer reviews | 36.9% |
| Simple checkout | 34.5% |
| Next-day delivery | 32.5% |
| Social likes & comments | 26.5% |
| Interest-free installments | 25.1% |
| Loyalty points | 25% |
| Cash on delivery | 22% |
| Guest checkout | 18.7% |
| Eco-friendly credentials | 16.9% |
| Click & collect | 13.6% |
| Influencer recommendations | 12.1% |
- Free delivery (55.2%) beats coupons/discounts (41.6%) by 14 percentage points
- Easy returns matters more than discounts — fulfilment policies trump price cuts
- Interest-free installments (taksit) at 25.1% — a Turkey-specific lever most international merchants miss
The DataReportal / GWI Q2 2025 consumer survey ranks the factors that push Turkish shoppers across the finish line:
- Free delivery — 55.2% (the single biggest lever)
- Easy returns policy — 46.2%
- Coupons & discounts — 41.6%
- Customer reviews — 36.9%
- Simple online checkout — 34.5%
- Next-day delivery — 32.5%
- Social likes & comments — 26.5%
- Interest-free installments — 25.1%
- Loyalty points — 25.0%
- Cash on delivery — 22%
Two implications. First, fulfilment cost matters more than discount depth. Free delivery beats coupons by 14 percentage points. Second, interest-free installments (taksit) remain a Turkish-specific signal: 25.1% of consumers cite them as a top driver, which is far higher than the global benchmark. Any merchant operating in Turkey without configured installment plans is leaving conversion on the table.
A separate attitudinal survey reports that 65% of Turkish shoppers say customer reviews are very helpful and 65% always research online before a major purchase. 55% prefer express shipping and 50% manage habitual orders on mobile.
Elif Arslan, CMO at TechnologyChecker: "Taksit is the single most under-appreciated growth lever for international brands entering Turkey. I've watched two separate cross-border clients see their conversion rate jump 30-40% the same week they enabled 6-month interest-free installments at checkout. The cultural expectation here is that anything over roughly 2,000 TL gets split into installments, and the consumer literally won't complete the purchase without that option visible. Free delivery + taksit is the Turkish equivalent of free shipping + Apple Pay in the US."
Top online stores and market structure

Turkey Top 10 Online Stores 2024: Trendyol Leads at $4.9B in Net Sales
Trendyol leads Turkey's online retail market with $4,909.4 million in 2024 e-commerce net sales — about 4.65× the #2 store, Hepsiburada ($1,055.2M). The top 10 stores include two grocery chains (Migros at #3, A101 at #10) reflecting rapid grocery digitization, plus international entrants Amazon.com.tr ($572.8M) and Apple.com ($302.4M).
Source: ECDB GmbH · 2024
| Online store | E-commerce net sales (USD millions) |
|---|---|
| trendyol.com | $4909.4M |
| hepsiburada.com | $1055.2M |
| migros.com.tr | $907.3M |
| amazon.com.tr | $572.8M |
| apple.com | $302.4M |
| teknosa.com | $233.6M |
| mediamarkt.com.tr | $212.2M |
| lcwaikiki.com | $163.1M |
| ciceksepeti.com | $139.1M |
| a101.com.tr | $136.6M |
- Trendyol's net sales are 4.65× the #2 (Hepsiburada) — one of the most concentrated leader gaps among major global markets
- Two grocery chains (Migros #3, A101 #10) confirm rapid food retail digitization
- Apple.com beats Mediamarkt and Teknosa in direct online sales — D2C is winning in electronics
The ECDB ranking of Turkey's top online stores by 2024 net sales shows a clear leader and a long tail. Trendyol's net sales are about 4.65× the #2, one of the most concentrated leader gaps among major global markets. We cover the broader picture in our global e-commerce marketplace market share analysis, but Turkey stands out for how single-platform-dominant it has become. Note also that Migros (#3) and A101 (#10) are grocery chains, reflecting the rapid digitization of food retail. The 2022 marketplace-share data ranked Hepsiburada at 27% and Trendyol at 25% as platforms (versus direct online retail), so the marketplace-vs-direct-retail distinction matters when comparing rankings.
From our crawl: the platform layer underneath Turkish e-commerce
ETBİS reports total transaction volume. It doesn't tell you what platforms Turkish merchants actually run on. Our own detection across 29.6M domains globally (May 2026 crawl, enriched against 226K Turkish companies in our index) surfaces the hidden tech layer underneath — and the Turkish mix looks nothing like the global one.
| E-commerce platform | Turkish companies detected | Global market share | Global rank |
|---|---|---|---|
| WooCommerce | 5,225 | 17.79% | #2 |
| Wix eCommerce | 2,250 | ~3% | #4 |
| Shopify | 955 | 45.99% | #1 globally |
| Magento | 33 | small | #5 |
| BigCommerce | 3 | small | — |
Shopify holds 46% of the global e-commerce platform market and serves 2.45M companies worldwide. Inside Turkey it's only #3 by company count — outnumbered roughly 5.5-to-1 by WooCommerce (5,225 domains) and 2.4-to-1 by Wix eCommerce (2,250 domains). Globally the ratio is inverted: Shopify outnumbers WooCommerce 2.6-to-1. Turkey is one of the few sizeable markets where that mainstream global pattern flips.
Verified Turkish companies on Shopify in our index include large domestic apparel chains like Kiğılı (kigili.com), Derimod (derimod.com.tr), Dagi Giyim (dagi.com.tr), and Tuğba & Venn (tugba.com), textile and home-goods manufacturers (Empera in Gaziantep, Atlas Halı, Creavit Türkiye), multinational subsidiaries (Decathlon Türkiye, SharkNinja Türkiye), and consumer brands (JUMBO Ev Gereçleri, Liva Pastacılık). The mid-market sits on WooCommerce and Wix.
Why this matters operationally. International Shopify partners and apps pitching into Turkey are addressing a roughly 1,000-merchant TAM, not a Polish- or German-scale Shopify ecosystem. The WooCommerce ecosystem (over 5× larger by company count) is where the actual merchant volume sits, and that's the gap most cross-border GTM strategies miss.
Source: TechnologyChecker.io detection data, May 2026 crawl, joined against the enriched company table (n=226,199 Turkish companies). Tech IDs queried: Shopify (2184), WooCommerce (402), Wix eCommerce (258), Magento (2002), BigCommerce (7791).
Elif Arslan, CMO at TechnologyChecker: "When we ran this query I'll admit I expected Shopify to be in the top spot in Turkey — that's the global pattern in every other emerging market we've looked at. WooCommerce coming in at 5.5× Shopify here was a real surprise. My read: Turkey's WordPress-hosting ecosystem is unusually mature (lots of local hosts and developers competing on price), and Wix's Turkish-language signup flow has been live for years. Both of those quietly built moats while Shopify focused on US and EU growth. For anyone selling Shopify apps into Turkey, the WooCommerce ratio is the number to internalize before you set your CAC targets."
How many e-commerce businesses operate in Turkey
The total number of e-commerce businesses tracked by ETBİS climbed from 559,412 (2023) to 600,800 (2024) to 634,611 (2025). That's a net add of about 75,000 businesses in two years.
Turkey E-commerce Businesses by Sector 2025: Food Delivery Leads at 20.3%
Turkey now hosts 634,611 e-commerce businesses, up from 559,412 in 2023 and 600,800 in 2024 — a net add of about 75,000 businesses over two years. Food delivery (Yemek) leads at 20.3% — more than 128,000 establishments, reflecting how restaurant aggregation platforms (Yemeksepeti, Getir Yemek, Trendyol Yemek) have made every neighborhood restaurant effectively an e-commerce participant.
Source: Turkish Ministry of Trade (ETBİS) · 2025
| Sector | Share of e-commerce businesses |
|---|---|
| Food delivery (Yemek) | 20.3% |
| Apparel & Accessories | 13.8% |
| Electronics | 11.9% |
| Home & Furniture | 10.5% |
| Cosmetics & Personal Care | 5.3% |
| Grocery | 5% |
| White Goods | 5% |
| Toys & Hobby | 4.8% |
| Construction Materials | 3.6% |
| Automotive Parts | 3.3% |
| Sports & Outdoor | 2.2% |
| Other | 14.3% |
- Food delivery alone hosts ~128,000 of Turkey's 634,611 e-commerce businesses
- Top 4 sectors (Food, Apparel, Electronics, Home) account for over 56% of all businesses
- Business count grew +13.4% over 2023-2025 — adding ~75,000 establishments
The high share of food-delivery businesses (more than 128,000 establishments) reflects how restaurant aggregation platforms (Yemeksepeti, Getir Yemek, Trendyol Yemek) have made every neighborhood restaurant effectively an e-commerce participant.
Quick commerce: the fastest-growing slice

Quick commerce (orders delivered in under an hour, plus scheduled-delivery models) is the segment where Turkey moves fastest. The two reports agree it's massive and corroborate each other almost perfectly.
Turkey Quick Commerce Volume 2019-2025: From 2.1B to 388.7B TL (138.7% CAGR)
Quick commerce volume in Turkey grew from 2.15 billion TL in 2019 to 388.7 billion TL in 2025 — a 181× increase at a 138.7% compound annual growth rate. Within quick commerce in 2025, food delivery accounts for 69.5% of volume and groceries/supermarket for 30.5%.
Source: Turkish Ministry of Trade (ETBİS) · 2019-2025
| Year | Quick commerce volume (billion TL) |
|---|---|
| 2019 | 2.1B TL |
| 2020 | 9.9B TL |
| 2021 | 26.7B TL |
| 2022 | 63.3B TL |
| 2023 | 126.1B TL |
| 2024 | 249.8B TL |
| 2025 | 388.7B TL |
- 181× growth in 6 years — 138.7% compound annual growth rate
- +55.6% year-over-year in 2025 — growth is still accelerating from a high base
- Food delivery drives 69.5% of quick commerce; grocery makes up 30.5%
The E-Commerce Info Platform 2019-2024 trajectory: 2.15 → 9.94 → 26.73 → 63.27 → 126.08 → 249.8 billion TL. The ETBİS 2025 update extends the series to 388.7 billion TL, up 55.6% from 2024 and a 138.7% compound annual growth rate over 2019-2025.
Turkey Quick Commerce Share of E-commerce 2019-2025: From 1.6% to 8.5%
Quick commerce expanded from 1.6% of total e-commerce in 2019 to 8.5% in 2025 — a 5.3× expansion in share over six years. The category is no longer niche: at 388.7 billion TL of 2025 volume and growing at 50%+ annually, quick commerce now operates as a distinct strategic category with its own logistics, regulatory dynamics, and consumer expectations.
Source: Turkish Ministry of Trade (ETBİS) · 2019-2025
| Year | Quick commerce share of e-commerce |
|---|---|
| 2019 | 1.6% |
| 2020 | 4.4% |
| 2021 | 7% |
| 2022 | 7.9% |
| 2023 | 6.8% |
| 2024 | 8.3% |
| 2025 | 8.5% |
- 5.3× expansion in share — from sub-2% to nearly 9% in 6 years
- 2023 dip (6.8%) reflects total e-commerce growing faster than quick-commerce that year
- 2025 share of 8.5% means roughly 1 in 12 Turkish e-commerce transactions is delivered within an hour or scheduled window
As a share of total e-commerce, quick commerce expanded from 1.6% (2019) to 8.5% (2025), a 5.3× increase in share over six years. Within quick commerce in 2025, food delivery (Yemek) accounts for 69.5% and groceries/supermarket 30.5%. That's a near-identical split to the 2024 E-Commerce Info Platform reading where food + beverages combined sat above 93%.
Elif Arslan, CMO at TechnologyChecker: "Getir's late-2024 retrenchment outside Turkey made some people read this category as cooling off. The ETBİS numbers say the opposite. Domestic quick commerce kept compounding through Getir's international pullback, because the unit economics inside Turkey actually work: dense urban geography, low motorcycle-courier wages, and consumer expectations that have been set by 6 years of Getir / Yemeksepeti / Trendyol Yemek competing on speed. If you're a global quick-commerce operator, Turkey is the market that proves the model isn't broken; the export was."
Shipping infrastructure
The Turkish e-commerce logistics market is concentrated around four domestic carriers. The ECDB September 2025 reading of shipping providers offered by online stores: Yurtiçi Kargo 45.3%, Aras Kargo 27.8%, MNG Kargo 26.7%, HepsiJet 13%, UPS 9.1%. (Stores can offer multiple providers, so totals exceed 100%.) Cross-border delivery integrations are still under-developed, which looks like a growth vector as Turkey's cross-border e-commerce share (currently 8.7%) expands.
Q1 2026 cross-reference: Cloudflare Radar Turkey telemetry

To validate where the 2025 ETBİS findings land in 2026 reality, we pulled live Q1 2026 (1 January – 31 March 2026) Turkey-specific data from Cloudflare Radar, the open internet observability platform that publishes anonymized telemetry from one of the largest CDNs in the world. Three things stand out: mobile dominance is now structural, AI tools have entered the top 10 most-visited domains in Turkey, and Trendyol has broken into the global Fast Fashion top 3.
Device, OS, and browser share (Turkey Q1 2026)
| Dimension | Share | Reading |
|---|---|---|
| Mobile HTTP requests | 56.04% | Mobile-first is now the operational default in Turkey |
| Desktop HTTP requests | 43.87% | Desktop still meaningful; bigger than European average |
| Android OS | 34.74% | Largest single OS slice |
| Windows | 35.75% | Holds slight lead overall (desktop) |
| iOS | 21.98% | Apple share substantially below Android |
| macOS | 5.16% | — |
| Chrome browser | 72.00% | Near-monopoly on Turkish browsing |
| Safari | 18.03% | iOS-driven; mirrors iOS share + macOS combined |
| Edge / Opera / Firefox | 3.20% / 2.91% / 2.08% | Long tail |
| HTTPS share | 98.16% | Effectively universal: only 1.84% of Turkey HTTP traffic stays unencrypted |
Combined Android + iOS = 56.72%, which matches the HTTP mobile-device share of 56.04% almost exactly. That's strong internal consistency between the two slices. Turkey sits roughly at the global average mobile-traffic split: our mobile internet usage by country report has the cross-country breakdown for context. For merchants, the implication is unambiguous: every checkout flow needs to be mobile-perfect first, desktop second.
Most-visited domains in Turkey (1 March 2026 snapshot)
The top 10 mostly reflects global content-infrastructure dominance (Google, Microsoft, Meta, Apple, Cloudflare). But ChatGPT now sits at #7, ahead of Instagram and the entire YouTube/TikTok video stack. Generative AI isn't a novelty layer anymore. It's load-bearing infrastructure.
| Rank | Domain | Category |
|---|---|---|
| 1 | google.com | Search |
| 2 | googleapis.com | Content servers |
| 3 | microsoft.com | Technology |
| 4 | facebook.com | Social |
| 5 | gstatic.com | Content servers |
| 6 | apple.com | Technology |
| 7 | chatgpt.com | Generative AI |
| 8 | instagram.com | Social |
| 9 | cloudflare.com | Technology |
| 10 | whatsapp.net | Messaging |
| 11 | youtube.com | Video |
| 18 | tiktokv.com | Video / social |
| 28 | spotify.com | Audio streaming |
For comparison, chatgpt.com sits at #21 in the UK. Turkey's #7 placement reflects an unusually high per-capita engagement with OpenAI's ChatGPT, consistent with the broader Gen Z and Millennial behavior captured in the ETBİS demographic data above. We covered the platform's broader adoption trajectory in our ChatGPT statistics overview.
AI bot crawler share inside Turkey (Q1 2026)
Anyone running a Turkish e-commerce site needs to know which AI crawlers are actually hitting their content, both for SEO surface area and for content-licensing decisions.
| Crawler | Operator | Share of AI bot requests |
|---|---|---|
| Googlebot | 76.93% | |
| ClaudeBot | Anthropic | 6.18% |
| GPTBot | OpenAI | 4.90% |
| Bingbot | Microsoft | 3.79% |
| Meta-ExternalAgent | Meta | 3.14% |
| Amazonbot | Amazon | 1.45% |
| Applebot | Apple | 1.20% |
| Bytespider | ByteDance / TikTok | 0.79% |
Two things worth flagging. First, Anthropic's ClaudeBot crawls Turkish content more aggressively than OpenAI's GPTBot: a 6.18% / 4.90% split where the ratio is flipped in many Western markets. Second, the crawl-purpose breakdown confirms most AI bot traffic is for live serving rather than training. Mixed Purpose 80.7%, Training only 16.2%, Search 1.8%. For GEO-aware content strategies, blocking ClaudeBot in Turkey has a meaningfully larger trade-off than blocking GPTBot.
Elif Arslan, CMO at TechnologyChecker: "This one surprised me. In most of the markets I work with, the AI-bot ratio is GPTBot first, ClaudeBot second by a clear margin. Turkey flips it. My working theory: Claude's product traction inside Turkey's developer and content-creator communities runs ahead of ChatGPT's traction in the same segment, so Anthropic's freshness-crawler hits Turkish sites harder. Practically: if you're a Turkish brand auditing your robots.txt, the cost of blocking ClaudeBot is higher than the cost of blocking GPTBot, which is the opposite of what most US-led playbooks assume."
Global service rankings: where Turkish e-commerce sits (1 March 2026)
Cloudflare Radar's service rankings give Turkey-relevant context the ETBİS report can't: how Turkish platforms stack up against global peers.
Fast Fashion — global top 10:
| Rank | Service |
|---|---|
| 1 | Shein |
| 2 | H&M |
| 3 | Trendyol: Fashion & Trends |
| 4 | Falabella |
| 5 | Asos |
| 6 | Uniqlo |
| 7 | Renner (BR) |
| 8 | Zara |
| 9 | American Eagle |
| 10 | Urban Outfitters |
Trendyol's Fashion & Trends app ranks #3 globally in Fast Fashion, ahead of Asos, Uniqlo, Zara, and American Eagle. This ranking isn't "Turkey-only", it's worldwide HTTP traffic. The only services in front of it are Shein (Chinese fast-fashion juggernaut) and H&M (Swedish global incumbent). Trendyol is the highest-ranked emerging-market platform in the category.
Elif Arslan, CMO at TechnologyChecker: "I've been tracking Trendyol's international expansion for three years and the Cloudflare Radar reading is the first piece of independent data that confirms what their CEO has been saying. They're not just a Turkish marketplace anymore. To be at #3 globally in Fast Fashion, ahead of Zara, you need real cross-border consumer adoption, not just a translated app. The Gulf and MENA markets have been the obvious play, but the traffic mix suggests they're picking up European volume too. For Turkish brands generally, this is the proof point that domestic scale plus aggressive cross-border app distribution can put you on the world map without needing US-style venture capital behind you."
General E-commerce — global top 10 (for context):
| Rank | Service |
|---|---|
| 1 | Amazon |
| 2 | Shopee |
| 3 | Temu |
| 4 | Shopify |
| 5 | Taobao |
| 6 | eBay |
| 7 | Alibaba |
| 8 | AliExpress |
| 9 | Mercado Libre |
| 10 | Walmart |
Trendyol doesn't break the global E-commerce top 10 (that list is dominated by Amazon, Asian super-apps, and Western incumbents). But in the Fast Fashion vertical Trendyol has crossed into global tier-1 status. Hepsiburada doesn't show up in any category top 10. Its position is structurally domestic.
Generative AI — global top 10:
| Rank | Service |
|---|---|
| 1 | ChatGPT / OpenAI |
| 2 | Claude / Anthropic |
| 3 | Perplexity |
| 4 | DeepSeek |
| 5 | Google Gemini |
| 6 | Grok / xAI |
ChatGPT's #7 placement in Turkey's domain ranking aligns with its #1 ranking globally. Turkish consumers are adopting the global AI leader at scale.
Internet quality in Turkey (90-day rolling, through May 2026)
| Metric | Value | Notes |
|---|---|---|
| Median download bandwidth | 112.13 Mbps | Strong national average for e-commerce media-rich pages |
| Median upload bandwidth | 30.92 Mbps | Adequate for return-shipping label uploads, video reviews |
| Idle latency | 56.05 ms | — |
| Loaded latency | 174.37 ms | Bufferbloat-typical jump under load |
| Packet loss | 0.33% | Excellent: under the 1% threshold for video commerce |
| Speed tests measured | 58,617 | Strong sample |
At 112 Mbps median download, Turkish consumers can comfortably load image-heavy product pages and short-form video commerce. Operators rolling out live shopping or 4K product videos in Turkey have the bandwidth headroom. Bufferbloat (the 56 → 174 ms latency jump under load) is the more interesting constraint, since it directly affects checkout latency under page load.
Methodology and sources
This post combines three independent datasets:
-
ETBİS — "Türkiye'de E-Ticaretin Görünümü Raporu 2025" — published May 2026 by the Turkish Ministry of Trade (Ticaret Bakanlığı), General Directorate of Internal Trade, Electronic Trade Department. The report draws on Turkey's official Electronic Trade Information System (ETBİS), which records virtual POS transactions, marketplace data, and business registrations. Data covers transactions through year-end 2025. ISBN: 978-625-92240-0-8. Source: etbis.ticaret.gov.tr
-
"E-commerce in Turkey" Digital & Trends dossier — 50-page market-research dossier covering global comparisons, forecasts, payment methods, segments, sellers, online orders, and consumer behavior. Underlying data sources cited per chart include Statista Market Insights, Statista Consumer Insights, the E-Commerce Info Platform, the Ministry of Trade Turkey, TurkStat, Euromonitor, Iyzico, DataReportal, GWI, Hootsuite, ECDB, GlobalData, IMF, McKinsey & Company, World Bank, Worldpay, Bankalararası Kart Merkezi (BKM), and PwC Turkey.
-
Cloudflare Radar — Q1 2026 (1 Jan – 31 Mar 2026) — anonymized HTTP, DNS, AI-bot, and service-ranking telemetry from Cloudflare's global network, filtered to Turkey where applicable. Internet speed and quality figures use the rolling 90-day window through 13 May 2026, sampled across 58,617 Cloudflare Speed Tests. Source: radar.cloudflare.com
Where datasets overlap, we used ETBİS as the primary source for domestic transaction figures (it has direct administrative access to virtual POS data), the international market dossier for cross-country comparisons and forecasts, and Cloudflare Radar for live 2026 internet behavior. The three datasets are independent. When their readings agree, that's the strongest possible signal.
For currency conversion, ETBİS USD figures use daily exchange rates over the relevant period. Where TL and USD coexist for the same indicator, both currencies are shown.
What this means for the year ahead
A few takeaways for operators, investors, and agencies planning around the Turkish market:
- Headroom remains. At 6.9% of GDP and 55.7% population penetration versus Europe's 73%, Turkey hasn't saturated. The 7.47% projected CAGR through 2030 reflects that.
- November campaigns are existentially important. Single days like 11/11 deliver volume worth nearly 3× an average day. Inventory, fulfillment, and ad spend planning needs to revolve around the November window, and avoid Ramadan/Eid for launches.
- Fashion and Electronics are the structural categories. Together they exceed 730 billion TL, about one-third of retail e-commerce. Cosmetics grows fastest in percentage terms.
- Quick commerce isn't niche anymore. At 8.5% of total e-commerce and growing at 50%+ annually, it now functions as a separate strategic category with its own logistics, regulatory, and consumer dynamics.
- Women aged 25-34 are the modal Turkish shopper. Marketplaces targeting Gen Z and young Millennials are running female-skewed businesses by default.
- Trendyol's dominance is now structural and global. Nearly 5× the domestic #2 in net sales, #3 globally in Fast Fashion per Q1 2026 Cloudflare Radar telemetry, ahead of Asos, Uniqlo, and Zara. The platform sets the de facto rules for terms, take rates, ad units, and consumer expectations across the Turkish market and is starting to project that influence internationally.
- Mobile-first isn't aspirational anymore. Q1 2026 telemetry confirms 56% of Turkish HTTP traffic is mobile and 98.16% is HTTPS. Every checkout flow needs to assume a phone-shaped viewport and HTTPS-only by default.
- AI traffic is real and Anthropic-leaning in Turkey. ChatGPT sits at #7 in Turkey's most-visited domains, and ClaudeBot crawls Turkish content more than GPTBot (6.18% vs 4.90% of AI bot requests). Content strategies need to plan for AI-citation surface area, not just search engines.
The picture from the combined ETBİS + Cloudflare Radar Q1 2026 view is hard to misread. E-commerce in Turkey isn't just bigger than it was. It's structurally different. The market has crossed the threshold from a retail channel into a core piece of national economic activity, and Turkish platforms have started to project that scale onto the global internet.
Elif Arslan
CMO & Co-founder

