Mobile Internet Usage by Country: Device Share Statistics for 2026 (July 2026 Update)
Q2 2026 close: mobile is still the human majority at 54.9%, but a year of data splits the desktop rise into bots versus real drift, plus IPv6 adoption by country.
Published •Updated •39 min read
Mobile's share of global HTTP traffic on Cloudflare's network was 40.86% over the 90-day window ending April 20, 2026 — not the 60%+ that survey data suggests. Country-level variance is dramatic: Bangladesh sits at 71.1%, while Finland lands at just 22.2%. Mobile internet usage by country is far less uniform than the "mobile-first world" narrative implies.
I pulled this data directly from Cloudflare Radar, the public telemetry feed that covers roughly 20% of global web traffic. The 90-day window ran from January 20 to April 20, 2026. What surprised me most wasn't the top of the mobile ranking — it was the bottom. Finland, the Netherlands, Germany, and the US all sit north of 69% desktop share. For a sales or product team building a global roadmap, treating "mobile vs desktop" as a solved problem is a mistake.
Key findings from our analysis:
- Globally, desktop generated 59.11% of HTTP requests on Cloudflare's network vs 40.86% mobile over 90 days
- Bangladesh leads the world at 71.09% mobile share; Nigeria (68.66%) and the Philippines (64.90%) round out the top three
- Finland tops the desktop-heavy list at 77.77% desktop share, followed by the Netherlands (76.88%) and Russia (74.10%)
- Iran returned 96.19% desktop as an extreme outlier — a likely VPN/proxy routing artifact
- Japan is the surprise mobile-majority developed market at 56.18% mobile
- Mobile's global share actually declined 2.0 percentage points over the 90-day window
- India's mobile share jumped 2.96 percentage points month-over-month — the biggest positive swing
- Italy is the only G7 economy sitting near a 50/50 split at 50.92% mobile
Where Mobile Stands at the Q2 2026 Close, With the Year-Over-Year Picture
Updated July 2, 2026. Q2 2026 closed on June 30. This section aggregates the full calendar quarter (April 1 through June 30) and, for the first time, adds a year-over-year layer against the same window in 2025. It sits on top of the June 1 and April analyses below, which are preserved unchanged. The June update introduced the human-versus-bot correction as a one-time fix; a full year of data now lets me test it properly, and the "desktop is winning" story splits cleaner than I expected.
The June 1 update and the original April analysis that follow this section are unchanged. Read on for the year-long trajectory behind these numbers.
The +3.5-point desktop swing is real, and about a third of it is bots
Blended device share moved exactly the way the bears predicted: over the past year global mobile fell from 43.8% to 40.3% of HTTP requests, a 3.5-point slide, and desktop climbed the mirror image to 59.6%. If you stop there, "mobile keeps losing" looks settled. But the June update taught me not to stop at the blended number, so I pulled the human-only series across the same three windows.
| Population | Q2 2025 | Q1 2026 | Q2 2026 | Year-over-year (mobile) |
|---|---|---|---|---|
| Blended mobile (all traffic) | 43.8% | 41.2% | 40.3% | -3.5pt |
| Human-only mobile | 57.3% | 54.6% | 54.9% | -2.4pt |
| Blended desktop (all traffic) | 56.2% | 58.8% | 59.6% | +3.5pt |
Source: Cloudflare Radar — http/summary/device_type, request-weighted shares; human-only via botClass=likely_human. Q2 2026 = 2026-04-01 to 06-30, Q1 2026 = 2026-01-01 to 03-31, Q2 2025 = 2025-04-01 to 06-30. Pulled 2026-07-02.
Put the two mobile rows side by side and the decomposition falls out. Blended mobile lost 3.5 points; human-only mobile lost 2.4. The gap between them, the slice that is machines rather than people, widened from 13.5 points a year ago to 14.6 points now. That 1.1-point widening is the growing desktop-classified bot share, and it accounts for roughly a third of the headline desktop gain. The other two-thirds, about 2.4 points, is a genuine drift: real humans put a slightly larger share of their requests on desktop this year than last.
That refines what I wrote on June 1. Looking at the recent quarter alone, the June read holds: human-only mobile went 54.6% to 54.9% from Q1 to Q2, essentially flat, so the recent plateau really is mostly the rising bot share, not people changing devices. Stretch the baseline to a full year, though, and a real human component appears underneath the bot noise. Both are true at once. The plateau is bots; the year-long slope is part bots, part behavior.
The human-only majority held, but the developed world crossed a line
The single number I most wanted to re-check was the human-only majority: 54.9% mobile at the Q2 close, still a majority, still the number I would hand a product team. But the global figure hides two groups of markets moving in opposite directions, which is the finding the year-over-year country cut surfaces.
| Country | Human mobile Q2 2025 | Human mobile Q2 2026 | Year-over-year |
|---|---|---|---|
| Bangladesh | 76.9% | 77.5% | +0.6pt |
| Nigeria | 68.2% | 69.6% | +1.4pt |
| Japan | 69.1% | 68.0% | -1.1pt |
| India | 63.9% | 66.2% | +2.3pt |
| Germany | 51.7% | 48.0% | -3.7pt |
| United States | 50.9% | 47.0% | -3.9pt |
| Finland | 47.1% | 42.0% | -5.1pt |
Source: Cloudflare Radar — http/summary/device_type?botClass=likely_human&location={cc}, human request-weighted mobile share. Q2 2026 vs Q2 2025, both full quarters. Pulled 2026-07-02.
The emerging-market leaders kept going more mobile among actual humans: India added 2.3 points to 66.2%, Nigeria 1.4 to 69.6%, and Bangladesh held its 77% ceiling. The developed markets moved the other way, and two of them crossed a threshold that changes how you read this whole report. A year ago both Germany (51.7%) and the United States (50.9%) were still human-mobile-majority; at the Q2 2026 close both have dipped below half, to 48.0% and 47.0%. Finland fell 5.1 points to 42.0%. This is the honest counterweight to the bot story. The developed-world mobile decline is not a measurement artifact, because it survives the human-only filter. Real Americans and Germans routed a bigger share of their requests through desktops this year, most likely the same return-to-office and desktop-session-weight forces the April version floated, now visible over a longer baseline.
Nigeria is the case that proves the method. Its blended mobile share fell 11.3 points year over year, from 67.9% to 56.5%, the steepest drop of any country I track and exactly the kind of "collapse" that makes a good, wrong headline. Its human-only share did the opposite: up 1.4 points to 69.6%. The entire 11-point blended drop is composition, the desktop-heavy automated traffic documented in the June update, now confirmed over a full year rather than a single snapshot. Real Nigerian users are more mobile than they were a year ago, not less.
IPv6 by country: the leapfrog that wasn't
For the net-new cut this quarter I went one layer below the device to the network protocol: what share of each country's requests arrive over IPv6 rather than legacy IPv4. My working assumption was that it would echo the mobile story, because the mobile-first leapfrog markets built their networks late and mobile carriers were the ones deploying IPv6 at scale. Countries that skipped desktop should have skipped IPv4 too. The data says that assumption is wrong, and the way it is wrong is the interesting part.
| Country | IPv6 request share Q2 2025 | IPv6 request share Q2 2026 | Year-over-year |
|---|---|---|---|
| India | 68.4% | 64.6% | -3.9pt |
| France | 52.3% | 52.0% | -0.3pt |
| Brazil | 46.0% | 46.3% | +0.3pt |
| Japan | 40.7% | 41.5% | +0.8pt |
| Vietnam | 30.5% | 40.7% | +10.2pt |
| Germany | 36.4% | 34.8% | -1.6pt |
| Finland | 33.2% | 33.7% | +0.5pt |
| Global | 29.6% | 29.6% | 0.0pt |
| United States | 30.6% | 28.0% | -2.6pt |
| Indonesia | 12.3% | 20.2% | +7.9pt |
| Philippines | 15.4% | 17.8% | +2.4pt |
| Bangladesh | 19.5% | 20.2% | +0.7pt |
| Nigeria | 4.4% | 5.0% | +0.7pt |
Source: Cloudflare Radar — http/summary/ip_version?location={cc}, share of HTTP requests carried over IPv6. Q2 2026 vs Q2 2025, both full quarters. Pulled 2026-07-02.
India tops the table at 64.6%, which fits the story: Reliance Jio built an IPv6-first mobile network, and a mobile-first country wired for IPv6 lands exactly where you would guess. Then the pattern breaks. Nigeria, second in the mobile rankings, runs almost no IPv6 at all, 5.0% of requests. Bangladesh, the most mobile-first country on earth, sits at 20.2%. Meanwhile France, one of the desktop-heavy markets from the sections above, carries 52.0% of its traffic over IPv6, more than double mobile-first Bangladesh. Being mobile-first plainly does not make a country IPv6-first.
What IPv6 actually tracks is whether a country's large carriers turned it on, a policy and capital decision that sits one layer below device mix rather than following from it. India and Vietnam turned it on; Nigeria's mobile operators largely did not, so Nigerians can be overwhelmingly mobile and still reach the web over IPv4. The live movement is in Southeast Asia: Vietnam jumped 10.2 points in a year to 40.7% and Indonesia 7.9 points to 20.2%, the two clearest carrier-rollout stories in the set. The counterweight is that global IPv6 request share went nowhere, 29.6% to 29.6%, and the current leader, India, actually slipped 3.9 points. A dozen countries moving in different directions netted to flat. For a team sizing infrastructure the practical read is blunt: you cannot infer a market's IPv6 readiness from how mobile it is, so you have to check the country, because "mobile-first" and "IPv6-ready" turn out to be different maps.
The Q2 2026 bottom line
A year of data leaves the report's central claim standing and sands down its edges. Mobile is still the human majority at 54.9%, but the majority is 2.4 points thinner than a year ago, and about a third of the scary-looking blended desktop rise is bots rather than people. The human story underneath has split in two: emerging markets are still going more mobile (India, Nigeria, and Bangladesh all up among humans), while the developed West quietly crossed below its own mobile-majority line (the US and Germany both under 50% now). And one layer down, the network itself refuses to follow the device: IPv6 is a carrier-policy map, not a mobile-adoption map, with Nigeria at 5% and desktop-heavy France at 52%. The habit that produced all three findings is the same one the June update was built on: never trust a blended country number until you have split it by bot class and checked it against a longer baseline.
What changed by June 2026: strip out the bots and mobile wins
When I first published this in April, I led with a number that bugged me: 40.86% mobile. Surveys say 60%+. I explained the gap as request-weighting, where a desktop session fires more requests than a mobile one, and that part is real. But I left a second factor out, and re-running the data on June 1, 2026 sent me back to add it: bot traffic. Filter Cloudflare's network down to human visitors only and global mobile share is 54.9%, not 40.4% — a majority, and much closer to what the survey shops report. The 40% figure isn't wrong. It just blends in a flood of automated traffic that runs heavily desktop. Updated June 1, 2026.
Two things moved enough since April to change the story: the human-versus-bot split (which I should have shown the first time), and one country, Nigeria, that looked like it had lost 22 points of mobile share until I checked what was underneath it.
Does desktop really beat mobile? Not once you remove the bots
Here's the correction I owe the April version. This report counts HTTP requests, and across all requests, desktop wins 59.6% to 40.4% over the May 4 to June 1 window. That's the right number for sizing servers. It's the wrong number for sizing an audience, because automated traffic (scrapers, monitoring, and the AI crawlers that have spiked over the last year) skews heavily to desktop, and it's a growing share of everything Cloudflare sees.
Strip it out and mobile is the majority in almost every market I track.
Mobile's Real Share: Human-Only Device Split by Country, May 2026
Filtering out automated traffic changes the picture sharply. Among human visitors, mobile is the majority almost everywhere: Bangladesh 77.9%, Nigeria 70.0%, the Philippines 69.6%, Japan 67.8%, and India 66.8%. Even the markets this report calls 'desktop-heavy' sit close to an even split once bots are removed — Germany 48.0%, the Netherlands 47.4%, the United States 47.0%, and Finland 41.7% — far above their blended request-weighted figures of 22–30%. Iran remains a desktop outlier even among humans at 18.0% mobile, consistent with VPN/proxy routing. Globally, human-only mobile share is 54.9% — a majority — versus 40.4% for all bot-inclusive traffic.
Source: Cloudflare Radar · May 4 – June 1, 2026
| Label | Human-only mobile share (%) |
|---|---|
| Bangladesh | 77.86% |
| Nigeria | 69.99% |
| Philippines | 69.61% |
| Japan | 67.78% |
| India | 66.82% |
| Germany | 47.96% |
| Netherlands | 47.42% |
| United States | 46.97% |
| Finland | 41.71% |
| Iran | 18.01% |
- Among human visitors, global mobile share is 54.9% — a majority, versus 40.4% for all bot-inclusive traffic
- Japan's human mobile share is 67.8%, well above its 57.2% blended figure
- 'Desktop-heavy' Germany, the Netherlands, and the US all sit near 47–48% mobile once bots are excluded
- Iran stays a desktop outlier even among humans (18.0% mobile), consistent with VPN/proxy routing
| Country | Blended mobile (all traffic) | Human-only mobile | Gap (pp) |
|---|---|---|---|
| Bangladesh | 69.2% | 77.9% | +8.7 |
| Japan | 57.2% | 67.8% | +10.6 |
| India | 60.2% | 66.8% | +6.6 |
| Germany | 29.7% | 48.0% | +18.3 |
| United States | 29.3% | 47.0% | +17.7 |
| Finland | 22.0% | 41.7% | +19.7 |
The developed-market rows are the ones that reframe the whole post. Finland looks like the most desktop-bound country on earth at 22% blended mobile share. Among actual Finnish humans, it's 41.7%. Germany climbs from 29.7% to 48.0%. The United States goes from 29.3% to 47.0%. The "desktop-heavy West" is real in the request logs, but a large slice of it is machines, not people. If you're using this data to decide whether to build mobile-first, the human-only column is the one that matters, and it says build for mobile nearly everywhere. For one market in close-up, our UK mobile vs desktop split applies the same human-versus-bot filter to Britain alone.
This also settles the tension I raised in April against StatCounter's 60%+ mobile reading. Line the three numbers up: session-weighted surveys put mobile near 60%, human request-weighted data puts it at 54.9%, and bot-inclusive request-weighted data puts it at 40.4%. None of them contradict each other. Each one strips or adds a layer (sessions versus requests, humans versus machines), and once you know which layer you're looking at, they agree.
What happened to Nigeria's mobile share?
This is the finding that made me rewrite the section. In April I flagged Nigeria as "the real surprise": mobile share had slipped 1.61 points month-over-month even though Nigeria sits near the top of the mobile-first rankings. My exact words were, "I'd want two more months of data before calling this a trend." Two months arrived. Nigeria's blended mobile share didn't keep sliding, it fell off a cliff, from 69% in March to 46.6% by June 1.
A country shedding 22 points of mobile share in twelve weeks is not something that happens to real people. Nigerians did not put down their phones. So before writing a word about it, I pulled the bot-class breakdown, and there was the answer.
How Bots Faked Nigeria's Mobile 'Collapse': Automated Traffic Quadrupled in 12 Weeks
Automated traffic rose from 13.6% of Nigeria's HTTP requests (week of March 9, 2026) to 53.0% (week of June 1) — crossing the 50% line by mid-May. Because automated traffic in Nigeria is roughly 68% desktop-classified, this surge mechanically dragged Nigeria's blended mobile share down from 69% to 47% over the same window. Filtered to human visitors only, Nigeria's mobile share held near 70% the entire time. The decline that looks like a behavior change is mostly a traffic-composition artifact, and it began the same week the bot surge started.
Source: Cloudflare Radar · March 9 – June 1, 2026
| Week beginning | Automated share of requests (%) |
|---|---|
| Mar 9 | 13.56% |
| Mar 16 | 15.05% |
| Mar 23 | 17.09% |
| Mar 30 | 17.51% |
| Apr 6 | 21.8% |
| Apr 13 | 24.3% |
| Apr 20 | 23.26% |
| Apr 27 | 26.89% |
| May 4 | 32.64% |
| May 11 | 41.76% |
| May 18 | 51.1% |
| May 25 | 52.24% |
| Jun 1 | 53.03% |
- Automated traffic in Nigeria quadrupled from 13.6% to 53.0% of all HTTP requests in 12 weeks
- It crossed 50% by mid-May — bots now generate more than half of Nigeria's measured requests
- Because that automated traffic is ~68% desktop, it cut Nigeria's blended mobile share from 69% to 47%
- Human-only mobile share held near 70% throughout — the 'collapse' is a composition artifact, not behavior
Automated traffic went from 13.6% of Nigeria's HTTP requests in early March to 53.0% by June 1. By mid-May, more than half of every request Cloudflare logged from Nigeria was a bot. Nigeria's automated traffic is 68% desktop-classified, so as it grew it pulled the blended mobile share down with it, week for week. The device-share decline and the bot surge both start the same week, April 6, and accelerate together.
The proof sits in the human-only cut. Filtered to human traffic, Nigeria's mobile share is 70.0%, right where it was in Q1. Real Nigerian users are exactly as mobile-first as they always were. Two more checks ruled out a measurement glitch: neighboring Ghana moved the opposite way over the same window (56.8% up to 60.4% mobile), and Nigeria's human mobile share barely budged until a small late-May dip that's partly the incomplete June 1 week. The collapse is a composition artifact. Even Nigeria's slide from #2 to #3 in the blended mobile ranking, now behind the Philippines, is a bot story rather than a behavior story.
I can't tell you what's generating the surge. Cloudflare's feed labels traffic automated without saying why, so I won't name an operator. What I can describe is the shape: a steady, accelerating climb concentrated in one country, riding desktop user agents. That's the signature of crawling or scraping infrastructure, not a fixed-broadband boom.
Did mobile's Q1 decline continue?
In April I wrote that global mobile share had fallen 2 points over the quarter, then added, "I'm not ready to call this a trend reversal. Three months isn't enough." Six months in, the hedge holds. Mobile's blended share held between 40.3% and 40.6% every week from late April through late May, then dipped to 39.5% on the partial June 1 week. The slow erosion from 43% last December never reversed, but it never accelerated either. It flattened into a plateau. Calling Q1 a reversal would have been wrong; calling it the start of a mobile collapse would have been wrong too. And the human-only series, steady near 55%, suggests the plateau is mostly the rising bot share at work, not people changing devices.
Which country calls held up, and which didn't?
I made four month-over-month calls in April. Here's the scorecard, because the misses teach more than the hits.
| April call | What happened by June | Verdict |
|---|---|---|
| India +2.96pp, "still expanding" | Held the gain near 60% through May, then fell back to 57.6% on June 1: range-bound, not a breakout | Half right |
| Japan +1.50pp toward mobile | Continued: 57.2% blended, 67.8% human. The developed world's mobile outlier holds | Right |
| Germany −1.49pp, "desktop dominance deepened" | Wrong direction: mobile recovered to 29.7% blended, the deepening didn't happen | Miss |
| Nigeria −1.61pp, "want two more months" | Waiting paid off. The drop was real in the data but turned out to be bots, not behavior | Right to wait |
The Germany miss is the honest one. I read a single month's −1.49 as "consolidation" and implied it would keep going. It didn't; Germany's blended mobile share is flat against April, if anything slightly higher. One month of movement is a data point, not a direction, which is the same reason the Nigeria "wait" call was right, even though the reason it resolved (bots) wasn't the one I had in mind.
How I sanity-check a country swing before I trust it
This whole update turned on one habit, so let me state it plainly, because it's the part of the work that never shows up in a chart. When a country-level number moves more than a couple of points between pulls, I don't publish it as behavior until it clears three checks: split the traffic by bot class (humans or machines?), compare a neighbor on similar infrastructure (country-specific or regional?), and confirm the latest bucket is a full week. Nigeria failed the first check and passed the other two, which is how a 22-point "collapse" became a one-line footnote about crawler traffic. After enough years querying Cloudflare's device and bot-class endpoints, the blended-versus-human gap is the first thing I reach for. It catches more bad country stories than any other single cut.
Global device split in 2026: desktop still beats mobile on Cloudflare's network
Cloudflare's request-weighted data tells a different story than the headline stats you've probably seen. Over the 90-day window ending April 20, 2026, desktop clients generated 59.11% of HTTP requests worldwide. Mobile landed at 40.86%. The rest (tablets, consoles, connected TVs, and odd user agents) rolled up into a 0.03% "other" bucket.
That number looks wrong at first. Survey shops like StatCounter regularly report mobile above 60% of page views globally. How can both be right?
They're measuring different things. StatCounter tracks page views, weighted by session. A user who opens a news site on their phone and reads one article registers a single mobile page view. Cloudflare Radar counts raw HTTP requests: every asset loaded, every JavaScript bundle, every image, every API call, every analytics beacon. A desktop user browsing a media-heavy application fires off 200+ requests in a session. A mobile user tapping into a lean mobile site might fire 20. Request-weighted data structurally over-represents desktop.
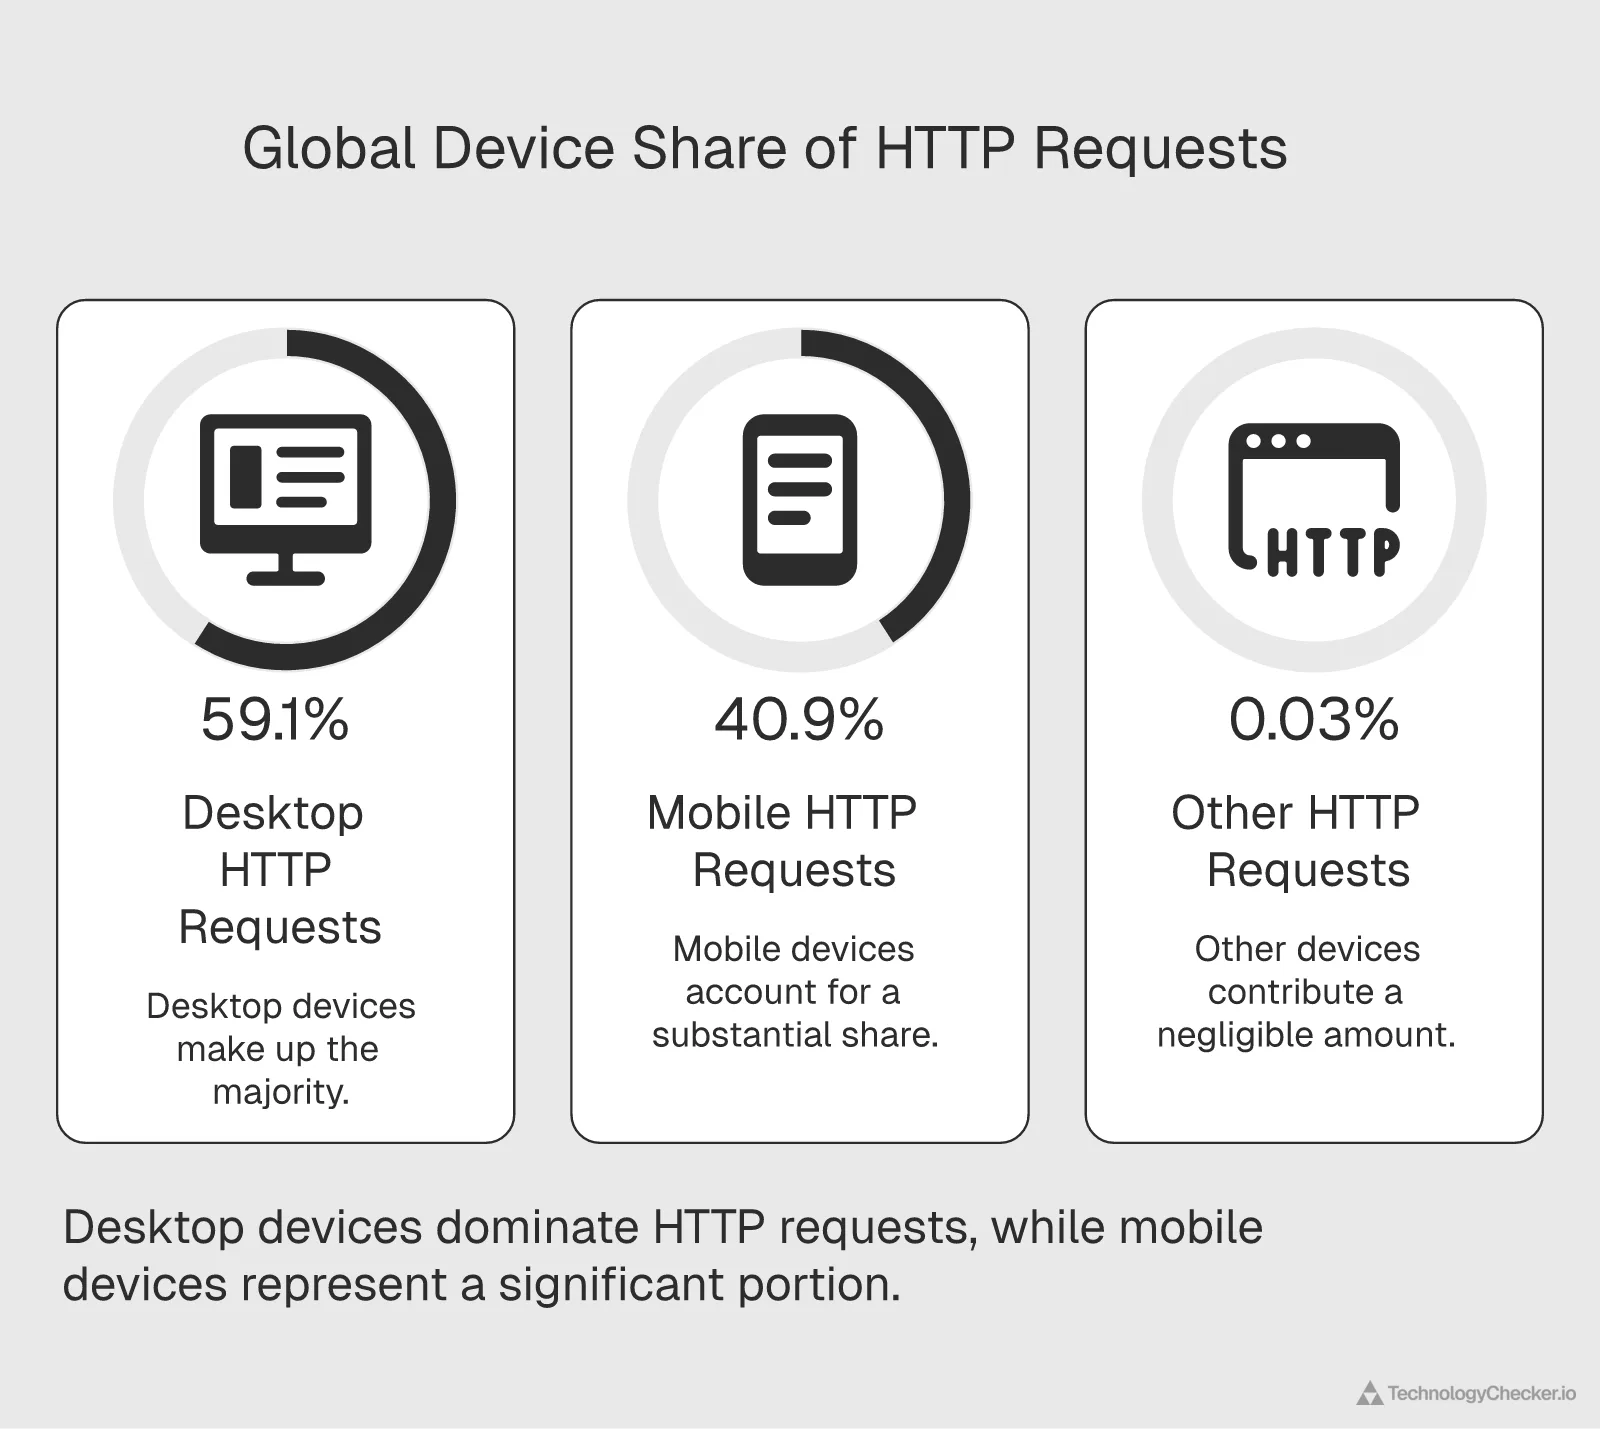
Global Device Share of HTTP Requests in 2026: Desktop Leads at 59.11%
Cloudflare Radar data shows desktop generated 59.11% of global HTTP requests over the 90-day window from January 20 to April 20, 2026, with mobile at 40.86% and other devices at 0.03%. This contradicts session-weighted survey data that regularly places mobile above 60% — the difference reflects that request-weighted data structurally favors desktop, where a single session can trigger 10x more asset requests than a lean mobile visit.
Source: Cloudflare Radar · January 20 – April 20, 2026
| Label | Value |
|---|---|
| Desktop | 59.11% |
| Mobile | 40.86% |
| Other | 0.03% |
- Desktop generates 59.11% of HTTP requests globally — the opposite of session-weighted survey figures
- Mobile lands at 40.86%, with tablets, consoles, and connected TVs collectively under 0.1%
- Request-weighted data treats a desktop user's 200-request session equally to 10 mobile visits
| Metric | Share | What It Represents |
|---|---|---|
| Desktop HTTP requests | 59.11% | Raw request volume, request-weighted |
| Mobile HTTP requests | 40.86% | Raw request volume, request-weighted |
| Other (tablet, console, TV) | 0.03% | Everything else |
Neither number is wrong. They answer different questions. If you're sizing infrastructure, Cloudflare's number is closer to the truth. It tells you how many requests your origin servers will actually handle. If you're sizing an audience, StatCounter's number tells you how many humans will reach you on each device class. For this analysis I'm using Cloudflare's data because it's the only publicly available dataset that gives us country-level granularity at this sample size, refreshed daily.
One more note on methodology: Cloudflare sees roughly 20% of the web. That's the largest single network sample any researcher can access without buying private data. We have related traffic-share analysis in our cloud provider traffic share report that uses similar sourcing. The 0.03% "other" category is small enough to ignore for strategic planning — it doesn't shift rankings or patterns.
Top 10 mobile-first countries: where smartphones dominate internet access
Bangladesh leads the world with 71.09% of HTTP requests coming from mobile devices. Nigeria (68.66%) and the Philippines (64.90%) round out the top three. Every country in the top 10 except Japan fits the same profile: emerging or lower-middle-income economy where fixed broadband rollout lagged and smartphone adoption accelerated past the desktop generation entirely.
Top 10 Mobile-First Countries by HTTP Traffic Share in 2026
Bangladesh leads the world at 71.09% mobile share of HTTP requests, followed by Nigeria at 68.66% and the Philippines at 64.90%. Every country in the top 10 is an emerging market. India (58.72%) and Pakistan (58.22%) round out the list despite being the largest and fifth-largest internet populations. Japan, the only developed economy in mobile-majority territory at 56.18%, falls just outside this top 10.
Source: Cloudflare Radar · January 20 – April 20, 2026
| Label | Mobile Share (%) |
|---|---|
| Bangladesh | 71.09% |
| Nigeria | 68.66% |
| Philippines | 64.9% |
| Thailand | 61.63% |
| Indonesia | 60.39% |
| Mexico | 60.13% |
| Saudi Arabia | 59.54% |
| India | 58.72% |
| Pakistan | 58.22% |
| Ghana | 56.84% |
- Bangladesh leads globally at 71.09% mobile share — over 30 percentage points above the US
- Every country in the top 10 is an emerging market with a mobile-leapfrogging history
- India (58.72%) sits below Mexico and Saudi Arabia despite being the world's largest mobile market by user count
| Rank | Country | Mobile Share | Desktop Share |
|---|---|---|---|
| 1 | Bangladesh | 71.09% | 28.89% |
| 2 | Nigeria | 68.66% | 31.34% |
| 3 | Philippines | 64.90% | 35.08% |
| 4 | Thailand | 61.63% | 38.33% |
| 5 | Indonesia | 60.39% | 39.60% |
| 6 | Mexico | 60.13% | 39.85% |
| 7 | Saudi Arabia | 59.54% | 40.45% |
| 8 | India | 58.72% | 41.25% |
| 9 | Pakistan | 58.22% | 41.78% |
| 10 | Ghana | 56.84% | 43.12% |
Bangladesh's 71.09% didn't happen by accident. GSMA's Mobile Economy report has documented South Asia's leap from sub-20% smartphone penetration in 2015 to above 70% today. Bangladesh skipped the desktop-to-laptop-to-smartphone path that most of Europe walked through. For tens of millions of Bangladeshis, the first device that ever loaded a web page was a phone. You see that in the traffic.
Nigeria's 68.66% reflects the same leapfrogging story on a larger population base. The Philippines at 64.90% is driven partly by social commerce — Facebook Marketplace, TikTok Shop, and Shopee are all predominantly mobile experiences there. Thailand and Indonesia round out the top 5, both above 60%.
India's position at rank 8 (58.72%) is the quiet surprise. For a country often cited as the world's mobile internet story, it's behind Saudi Arabia and Mexico on Cloudflare's request-weighted data. The gap likely reflects India's large developer and enterprise populations running desktop workflows on the CDN network, plus a growing base of home broadband. The month-over-month data (we'll get there) shows this rebalancing is still in motion.
Japan's rank 12 position at 56.18% mobile (just outside the top 10) is the real outlier of the developed world. No other G7 country is mobile-majority. We'll dig into why in Section 6.
The pattern for SaaS go-to-market: if you're selling into a top-10 mobile market, your prospect's end customers are interacting with them primarily on mobile. That cascades into which backend APIs matter, which front-end frameworks get adopted, and which analytics platforms get deployed. For context on how technology adoption varies by country, our analysis of the most reliable internet by country overlaps with some of these markets.
Top 10 desktop-heavy countries: where computers still lead

Finland generated 77.77% of its HTTP requests from desktop over the 90-day window. The Netherlands (76.88%) and Russia (74.10%) followed. Nordic and Western European countries cluster at the top of the desktop-heavy list, with Russia as a high-population non-Western entry and the United States at rank 5 (69.46% desktop).
Top 10 Desktop-Heavy Countries by HTTP Traffic Share in 2026
Finland leads the world at 77.77% desktop share of HTTP requests, followed by the Netherlands at 76.88% and Russia at 74.10%. Nordic and Western European countries cluster at the top of the list, joined by the United States at 69.46% and China at 67.54%. Iran returned 96.19% desktop — excluded from the ranking as a likely VPN/proxy routing artifact from widespread circumvention of national filtering.
Source: Cloudflare Radar · January 20 – April 20, 2026
| Label | Desktop Share (%) |
|---|---|
| Finland | 77.77% |
| Netherlands | 76.88% |
| Russia | 74.1% |
| Germany | 70.12% |
| United States | 69.46% |
| Belgium | 67.7% |
| China | 67.54% |
| Sweden | 66.26% |
| Australia | 65.71% |
| France | 65.68% |
- Finland tops the desktop-heavy list at 77.77% desktop share
- Nordic, Western European, and North American markets dominate — none in this list sit below 65% desktop
- Iran at 96.19% was excluded as a VPN/proxy routing artifact rather than organic browsing behavior
| Rank | Country | Desktop Share | Mobile Share |
|---|---|---|---|
| 1 | Finland | 77.77% | 22.18% |
| 2 | Netherlands | 76.88% | 23.11% |
| 3 | Russia | 74.10% | 25.88% |
| 4 | Germany | 70.12% | 29.85% |
| 5 | United States | 69.46% | 30.53% |
| 6 | Belgium | 67.70% | 32.28% |
| 7 | China | 67.54% | 32.46% |
| 8 | Sweden | 66.26% | 33.72% |
| 9 | Australia | 65.71% | 34.27% |
| 10 | France | 65.68% | 34.21% |
Finland's 77.77% desktop share is roughly three times the global mobile average — a remarkable gap. Several things contribute. Finland has the highest fixed broadband penetration per capita in the EU, according to OECD broadband statistics. Its workforce skews knowledge-economy, meaning more people spend more hours at desks running desktop applications. And Finnish tech adoption patterns have historically favored laptops over phones for substantial browsing.
The Netherlands at 76.88% shows the same profile. Dutch home broadband is near-universal (98%+ household penetration), and the country has one of the EU's highest rates of remote/hybrid work — which translates directly into more desktop hours. Russia's 74.10% is partially shaped by different dynamics: large industrial and government sectors where desktop Windows dominates, and a population distribution where home PCs remain central.
The United States at rank 5 (69.46% desktop) is striking given how often US commentary treats mobile as dominant. The 30.53% mobile figure is request-weighted — US users spend plenty of time on phones, but each desktop session generates far more raw requests.
Update (June 1, 2026): These are blended, all-traffic shares. Filter to human visitors only and these "desktop-heavy" markets look far more even: Finland is 41.7% mobile, the Netherlands 47.4%, Germany 48.0%, and the United States 47.0%. Much of the desktop weight here is automated traffic, not people. See the June 2026 update at the top of this report for the full human-only breakdown.
The Iran outlier: 96.19% desktop
Iran (IR) returned 96.19% desktop and 3.81% mobile in the raw dataset. That's not a measurement of actual Iranian device usage. It's an artifact of how traffic gets routed through the country under current filtering conditions. When a large share of requests reach international sites through VPN and proxy services, those services typically originate from desktop clients, and they dominate the outbound traffic pattern Cloudflare sees.
We excluded Iran from the main desktop rankings because the number doesn't reflect the underlying population's behavior. Anyone reading this data for go-to-market decisions should note the caveat: country-level device share is a proxy for network conditions, not just user preference.
The 90-day trend: mobile share slightly declined in Q1 2026
Global mobile share fell from 41.47% (week of January 19) to 39.45% (week of April 20) over the 90-day window I analyzed. That's a 2.0 percentage point drop in roughly three months. Desktop share rose correspondingly from 58.51% to 60.52%. The finding contradicts the conventional "mobile keeps winning" narrative.
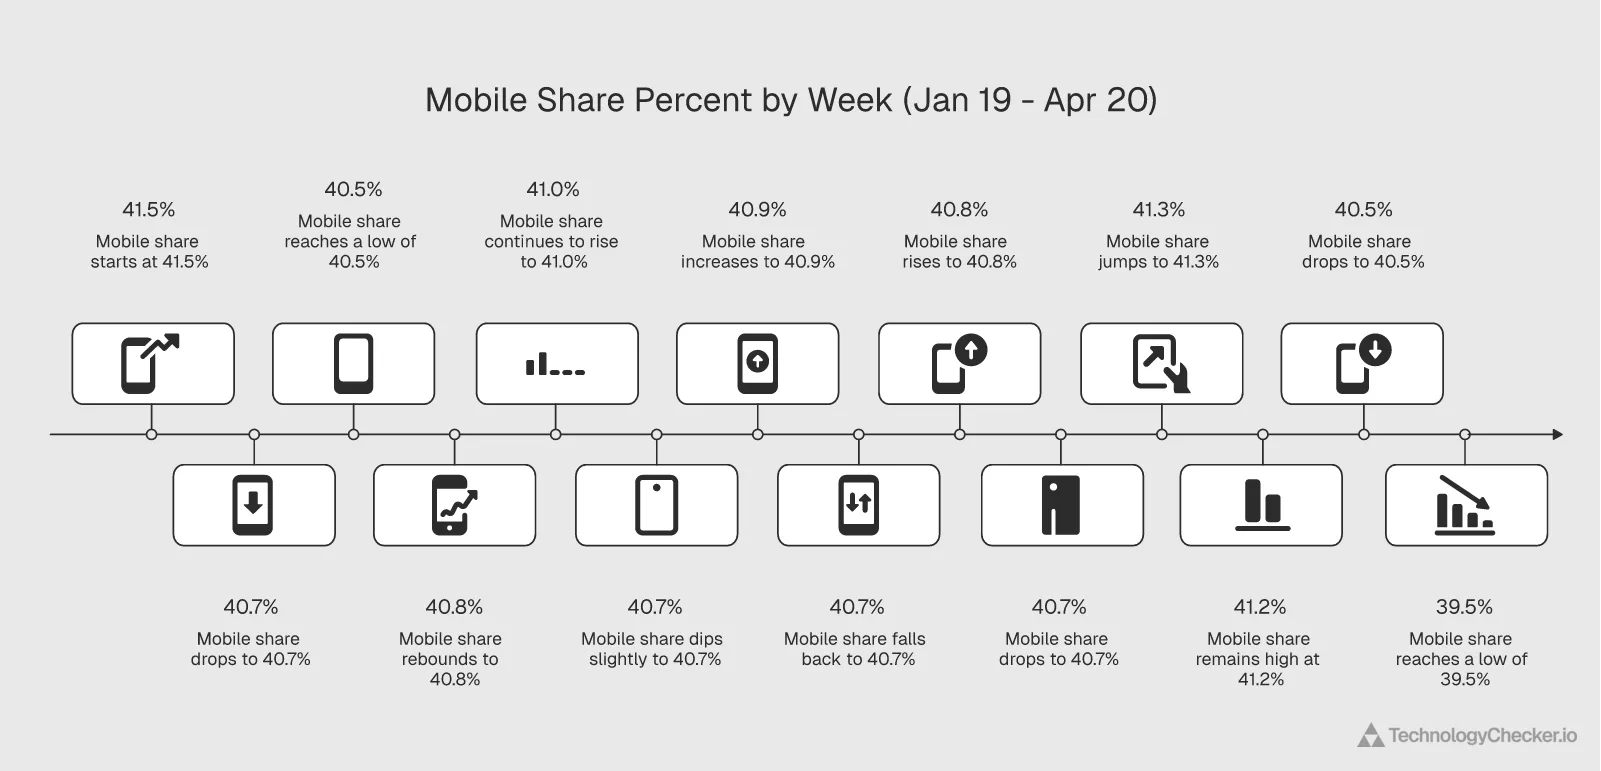
Global Mobile HTTP Traffic Share Declined 2 pp Over 90 Days in Q1 2026
Global mobile share of HTTP requests fell from 41.47% (week of January 19) to 39.45% (week of April 20) — a 2.0 percentage point decline over 90 days. Desktop share correspondingly rose from 58.51% to 60.52%. The trend runs counter to the widely-cited narrative that mobile is linearly gaining ground; in request-weighted data, mobile has actually plateaued and slightly reversed in Q1 2026.
Source: Cloudflare Radar · January 19 – April 20, 2026
| Label | Mobile Share (%) |
|---|---|
| Jan 19 | 41.47% |
| Jan 26 | 40.72% |
| Feb 2 | 40.46% |
| Feb 9 | 40.83% |
| Feb 16 | 41.01% |
| Feb 23 | 40.7% |
| Mar 2 | 40.92% |
| Mar 9 | 40.67% |
| Mar 16 | 40.8% |
| Mar 23 | 40.66% |
| Mar 30 | 41.32% |
| Apr 6 | 41.2% |
| Apr 13 | 40.48% |
| Apr 20 | 39.45% |
- Mobile share fell from 41.47% to 39.45% — a 2.0 percentage point decline over 90 days
- Desktop share correspondingly rose from 58.51% to 60.52% over the same window
- The 'mobile is always winning' narrative isn't showing up in request-weighted data
| Week | Mobile Share | Desktop Share |
|---|---|---|
| Jan 19 | 41.47% | 58.51% |
| Feb 16 | 41.01% | 58.97% |
| Mar 16 | 40.80% | 59.17% |
| Mar 30 | 41.32% | 58.65% |
| Apr 13 | 40.48% | 59.48% |
| Apr 20 | 39.45% | 60.52% |
The "mobile always wins" story has been the dominant framing for a decade. This 90-day slice pushes back on it. A few possible explanations, none of which fully account for the move on their own:
Seasonal patterns. Q1 often sees desktop-heavy behavior shifts as workplaces come back from end-of-year slowdowns. More employees at desks means more desktop requests. It's plausible this explains part of the decline.
Bot and automated traffic. Desktop user agents dominate automated traffic — scrapers, monitoring services, and increasingly AI crawlers. If automated traffic grew faster than human traffic over this window, desktop share would mechanically rise. Our own data on robots.txt and AI crawler behavior suggests crawler activity has spiked significantly in the last 12 months.
Genuine plateauing. Mobile's share in developed markets may actually be topping out. Germany's data (down 1.49pp month-over-month) fits this pattern. In mature markets with saturated smartphone penetration, the mobile share may have a ceiling dictated by how people actually use the web.
I'm not ready to call this a trend reversal. Three months isn't enough. But anyone modeling long-term mobile share should factor in that "mobile keeps winning, forever" is an assumption, not a measurement. The graph goes flat — and sometimes down — in real data.
Month-over-month shifts: India up, Germany down

Comparing the most recent 30 days (ending April 20) to the prior 30 days, we tracked month-over-month mobile share shifts for six key markets. The swings are bigger than the global trend suggests.
Month-Over-Month Mobile Share Shift by Country in Q1 2026
India posted the biggest positive mobile-share swing among tracked countries at +2.96 percentage points month-over-month, followed by Japan (+1.50 pp) and Bangladesh (+0.70 pp). Germany's mobile share fell 1.49 pp in the same window, Nigeria lost 1.61 pp despite being a mobile-first market, and the United States slipped 0.42 pp. The spread shows how non-uniform global mobile adoption is, even over a single month.
Source: Cloudflare Radar · March 21 – April 20 vs February 19 – March 21, 2026
| Label | MoM Change (pp) |
|---|---|
| India | 2.96 pp |
| Japan | 1.5 pp |
| Bangladesh | 0.7 pp |
| United States | -0.42 pp |
| Germany | -1.49 pp |
| Nigeria | -1.61 pp |
- India saw the biggest positive swing at +2.96 percentage points in a single month
- Germany's mobile share declined 1.49 pp — the mature desktop-heavy market consolidated further
- Nigeria surprisingly lost 1.61 pp despite being the #2 mobile-first market globally
| Country | Previous Mobile % | Current Mobile % | Change (pp) | Direction |
|---|---|---|---|---|
| India | 56.89% | 59.85% | +2.96 | Mobile gained |
| Japan | 55.98% | 57.48% | +1.50 | Mobile gained |
| Bangladesh | 70.81% | 71.51% | +0.70 | Mobile gained (stable high) |
| United States | 30.56% | 30.14% | -0.42 | Mobile lost (slight) |
| Germany | 30.24% | 28.75% | -1.49 | Mobile lost (desktop dominance deepened) |
| Nigeria | 69.23% | 67.62% | -1.61 | Mobile lost |
India's +2.96 percentage point jump is the biggest move of any large economy tracked. Over a 30-day window, that's substantial. The likely driver is continued smartphone adoption at the margin combined with some of India's heaviest data-consumption periods (cricket finals, festival shopping peaks) landing inside the current window. India is a country where the base of mobile users is still expanding in absolute terms.
Germany's -1.49 percentage point decline is the counterpoint. Mobile share moved backward in Germany, deepening its desktop dominance. That's not what the dominant narrative predicts. It fits a pattern where mature, desktop-heavy markets consolidate rather than shifting further toward mobile. Workplace return-to-office trends in Germany likely play a role — more office hours means more desktop hours.
Nigeria's -1.61 percentage point drop is the real surprise. Nigeria sits second in the mobile-first rankings, yet its monthly direction is negative. A few explanations come to mind: growth in fixed broadband in Lagos and Abuja shifting some traffic to desktops, larger enterprise crawling pushing up desktop request volume, or normal month-to-month noise in a market where total request volume is relatively volatile. I'd want two more months of data before calling this a trend.
Japan's +1.50 percentage point mobile gain is quiet but directionally important. Japan was already mobile-majority at 56.18% over 90 days. It's pushing further toward mobile even as other developed markets flatten or reverse. For a market of Japan's size and economic importance, that's a real signal.
Why device share varies so much across countries
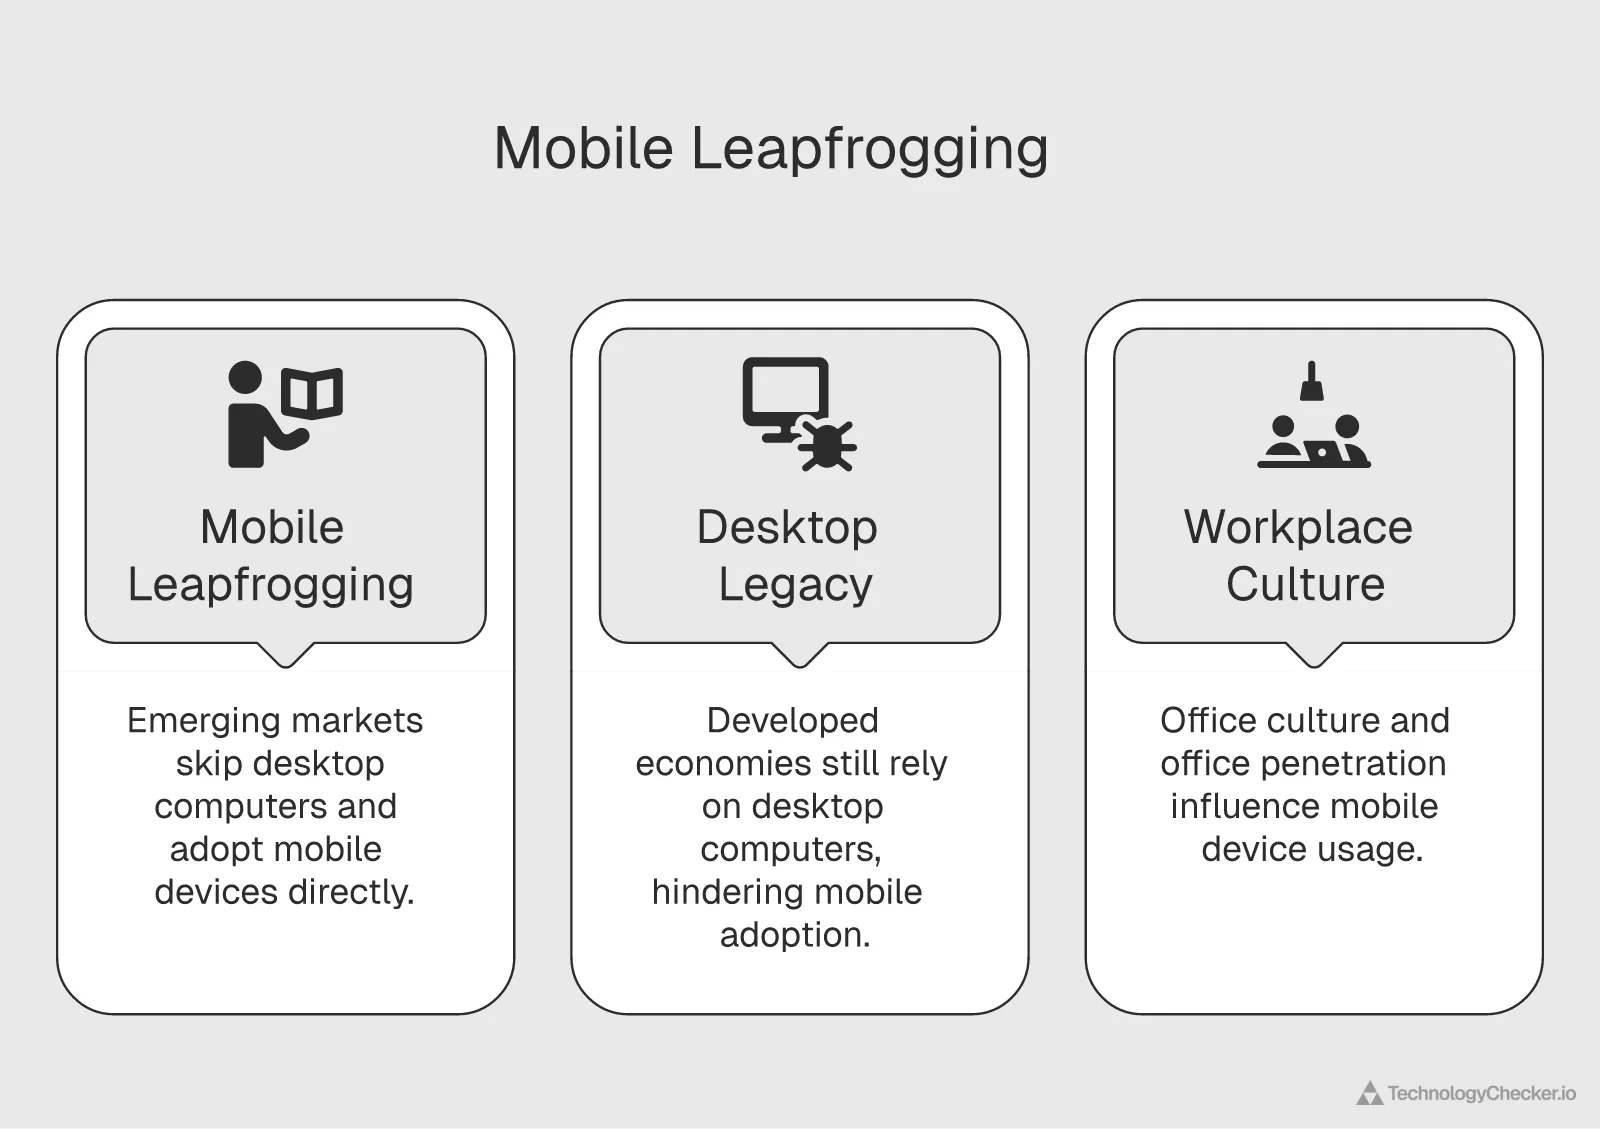
Three forces explain most of the country-level variance in device share: mobile leapfrogging in emerging markets, desktop legacy in developed economies, and workplace culture. None operates in isolation. Every country's position reflects all three simultaneously, in different ratios.
Mobile leapfrogging in emerging markets
Bangladesh, Nigeria, and the Philippines all share a history of limited legacy desktop infrastructure. Fixed broadband penetration in these markets was below 5% when 3G and 4G mobile networks started rolling out. For the next wave of internet users, smartphones weren't a second device — they were the first. According to ITU Facts and Figures, mobile broadband subscriptions exceed fixed broadband subscriptions by 4-to-1 or more in most of Sub-Saharan Africa and South Asia.
This leapfrogging pattern compounds over time. Once a country's web ecosystem (banking apps, government services, social platforms, e-commerce) gets built mobile-first, the incentive for users to move to desktop drops. You see the result in the traffic: Bangladesh, Nigeria, Thailand, Indonesia, Mexico all cluster above 60% mobile share.
Affordability matters too. The Alliance for Affordable Internet (A4AI) tracks the cost of 1GB of mobile data as a percentage of monthly income. Markets where mobile data is cheap relative to income see higher mobile traffic share. Markets with expensive mobile data or artificial caps see traffic push onto wifi-connected desktops.
Desktop legacy in developed economies
Finland, Germany, the Netherlands, and the US followed the opposite trajectory. These markets had home PCs and office networks in the late 1990s, broadband at scale by the mid-2000s, and mature desktop workflows before the iPhone existed. Smartphones layered on top of that infrastructure rather than replacing it.
The World Bank's digital development research notes that countries with high fixed broadband penetration retain higher desktop shares even decades after mass smartphone adoption. Habits, employer-issued devices, and the sheer volume of desktop-optimized enterprise tools all keep desktop weight high. Finland at 77.77% desktop is the extreme version of this.
Workplace culture and office penetration
The third factor is workplace behavior. Countries where a high share of the working population spends significant time at desk-bound knowledge work generate more desktop requests per capita. Nordic countries, Western Europe, and parts of East Asia fit this pattern. Countries with larger informal economies, more mobile sales forces, or larger populations not in formal office employment generate more mobile requests per capita.
Japan is a special case — it's knowledge-economy-heavy but mobile-majority. The likely explanation is the famously high adoption of mobile workflows for non-work activities (messaging, commerce, media) among a population that also uses desktop heavily at work. The net result: 56.18% mobile. Related: our analysis of country-level infrastructure differences in the most reliable internet by country piece digs into how these factors also shape uptime and speed.
Inside the mobile number: Android vs iOS by country
Everything above treats "mobile" as one bucket. It isn't. The moment you split traffic by operating system, a second map appears — and it reads a market's economics even more sharply than the mobile-versus-desktop cut does. I pulled Cloudflare's summary/os data for the 28 days ending June 9, 2026. Globally the request mix is Windows 35.5%, Android 34.7%, iOS 16.9%, macOS 9.6%, with Linux and ChromeOS making up most of the rest. Roll the two phone platforms together (Android + iOS ≈ 51.6%) and you land in the same neighborhood as the human-only mobile majority from the top of this report — a quiet cross-check that the device and OS cuts agree.
But the global split isn't the story. The number I actually watch is the Android-to-iOS ratio, because it barely moves with bot traffic — it's a within-mobile comparison, so the desktop-heavy automated skew that distorts blended device share mostly cancels out — and it tracks national income almost linearly.
| Country | Android | iOS | Windows | macOS | Android : iOS |
|---|---|---|---|---|---|
| Global | 34.7% | 16.9% | 35.5% | 9.6% | 2.1 : 1 |
| India | 66.2% | 6.5% | 21.7% | 3.8% | 10.1 : 1 |
| Indonesia | 60.8% | 6.9% | 26.0% | 3.9% | 8.9 : 1 |
| Brazil | 55.9% | 13.0% | 26.5% | 2.8% | 4.3 : 1 |
| China | 30.4% | 10.8% | 46.2% | 7.3% | 2.8 : 1 |
| Nigeria | 51.9% | 23.3% | 20.1% | 3.4% | 2.2 : 1 |
| Germany | 27.5% | 18.8% | 37.3% | 11.3% | 1.5 : 1 |
| Japan | 25.4% | 27.9% | 36.5% | 8.2% | 0.9 : 1 |
| United States | 18.8% | 22.6% | 36.6% | 16.5% | 0.8 : 1 |
OS shares are of all HTTP requests, so Windows and macOS sit alongside the two phone platforms (and the desktop/automated layer from the sections above is baked in). Read the Android-to-iOS column, not the absolute mobile-OS totals — the ratio is the part that survives the bot skew.
Two markets on that list — the United States and Japan — are the only ones where iOS actually out-requests Android. That isn't a coincidence; it's the clearest income signal in the whole dataset. The US sits at 0.8 Androids per iPhone and carries the highest macOS share I measured (16.5%), so more than a third of US requests come from an Apple device of some kind. Japan is the same shape (0.9 : 1) — the developed world's mobile outlier in the device cut is also its iOS stronghold. If you're modeling ARPU or willingness-to-pay off device data, the iOS ratio is a better proxy than the raw mobile share, because a country can be 70% mobile and still be a budget-Android market.
The mobile-first leaders from the top-10 ranking tell the opposite story at the OS layer. India runs 10 Android requests for every iPhone one; Indonesia is nearly 9 : 1; Brazil 4 : 1. The "mobile leapfrogging" markets didn't just skip desktop — they skipped iOS. For a product team, that turns a vague "build mobile-first" into a specific instruction: build Android-first, test on mid-tier Android hardware and the network conditions those devices live on, and don't let an iPhone-only QA pass stand in for the market. Nigeria is the interesting hedge — 2.2 : 1, with a 23% iOS share that's high for an emerging market, reflecting a genuinely wealthy Lagos iPhone segment sitting on top of a mass Android base. It's a reminder that the national ratio hides a bimodal reality you'd want to segment before localizing a pricing page. That same Android-to-iOS ratio decides the browser layer too: the 10-to-1 Android markets are where Chrome runs close to 90% of web traffic, while the iPhone-heavy markets are where Safari wins back a real slice.
The same three-checks discipline applies here as everywhere else in this report: I trust the Android-to-iOS ratio because it's internally consistent across pulls and survives the human-only filter, whereas I'd treat any single country's absolute iOS percentage as softer, since it moves with whatever desktop and bot mix happened to route through that country in the window.
What this means for B2B SaaS companies targeting global markets
If you're selling B2B SaaS globally, your customers' device mix shapes their technology buying decisions. And your customers' customers' device mix shapes their product roadmaps. Device share shows up in ad network reports all the time, but it also cascades into which SaaS tools make it into a buyer's evaluation.
Selling into mobile-first markets like Bangladesh, Nigeria, the Philippines, India, and Indonesia changes the product categories you can plausibly sell. Prospects in these markets are running mobile-heavy products, so they're buying mobile analytics, mobile push notification platforms, responsive CMS, and mobile SDK tooling. They're also likely running modern frontend frameworks like React, Vue, or hybrid stacks. A prospect in Lagos running WordPress on desktop-first themes is a very different buyer from a Lagos prospect running a React-based progressive web app. The device-share data gives you a prior on which product categories are priorities.
Desktop-heavy markets (Finland, Germany, the Netherlands, the US, Russia) flip the math. Desktop parity is non-negotiable because prospects' customers spend most of their sessions at laptops. That elevates keyboard-first UX, screen-dense dashboards, multi-window workflows, and browser extensions as distribution channels. Mobile matters, but it's rarely the primary channel for B2B SaaS engagement.
Balanced markets (Italy, Spain, Colombia, Turkey, the UK, South Korea) demand dual-device evaluation cycles. Prospects evaluate your product on both mobile and desktop, sometimes in the same day. If either experience is weak, the sale stalls.
At TechnologyChecker, we detect the actual technology stacks companies are running — across 40K+ technologies and 29.9 million active domains. For GTM teams targeting mobile-first geographies, that means you can filter prospects for companies already running modern mobile-capable frontend frameworks, mobile CMS platforms like Shopify, or mobile analytics stacks. Instead of guessing which Bangladeshi or Nigerian companies are ready for your mobile SDK, you see which ones already deployed similar technology and can prioritize accordingly. See the TechnologyChecker platform for how the detection and filtering work in practice.
The device share data also changes how you interpret market sizing. A country like Bangladesh with 71% mobile share and a large population has a different SaaS opportunity profile than its raw GDP suggests. If your product is mobile-compatible, Bangladesh is a meaningful market. If it's desktop-only, it's not. Our post on Shopify migration patterns touches on how mobile-first commerce shifts migration flows across platforms.
One final implication: account-based marketing segmentation. If you're running ABM campaigns, layering country-level device share onto your target account list tells you which accounts need mobile-first creative and which should get desktop-focused landing pages. Same company, same product, different sales motion.
Frequently asked questions about mobile internet usage by country
Which country has the highest mobile internet usage?
Bangladesh leads the world with 71.09% of HTTP requests coming from mobile devices, based on our analysis of Cloudflare Radar data for the 90-day window ending April 20, 2026. Nigeria (68.66%) and the Philippines (64.90%) round out the top three. All three are emerging markets where mobile-first internet adoption bypassed the desktop era.
Which country has the lowest mobile internet usage?
Among the 43 countries we tracked, Finland had the lowest mobile share at 22.18% (meaning 77.77% desktop). The Netherlands (23.11%), Russia (25.88%), Germany (29.85%), and the United States (30.53%) also sit well below the global average. Iran returned an extreme 3.81% mobile share, but we flagged it as a VPN/proxy routing artifact rather than a true measurement of user behavior.
Why does Cloudflare show desktop at 59% when other sources say mobile is over 60%?
Cloudflare Radar measures raw HTTP requests — every asset, API call, and beacon your browser fires. StatCounter and similar sources measure page views or sessions. Desktop users generate more requests per session than mobile users, so request-weighted data over-represents desktop relative to user-weighted data. Both numbers are accurate; they answer different questions. For infrastructure and technographic analysis, request-weighted data is more useful.
Is mobile or desktop bigger globally in 2026?
It depends on which traffic you count. Across all HTTP requests on Cloudflare's network, desktop leads 59.6% to 40.4% (May 2026). But filter to human visitors only — excluding bots, scrapers, and AI crawlers, which skew heavily desktop — and mobile is the majority at 54.9%. Session-weighted surveys like StatCounter, which count human page views rather than requests, land near 60% mobile. All three are correct; they answer different questions. For audience and UX decisions, use the human-only or session-weighted figure, where mobile wins. For server and infrastructure sizing, use the blended request-weighted figure, where desktop wins.
How has mobile internet usage by country changed in 2026?
Global mobile share declined 2.0 percentage points over the 90-day window from January 19 to April 20, 2026 — from 41.47% to 39.45%. Month-over-month, India gained 2.96pp, Japan gained 1.50pp, and Bangladesh gained 0.70pp. Germany (-1.49pp), Nigeria (-1.61pp), and the US (-0.42pp) saw mobile share decline. The "mobile always wins" narrative isn't holding across every market simultaneously. By June 2026 that decline had flattened into a plateau, with blended mobile holding near 40.4% through May. The standout country move, Nigeria's blended mobile share dropping to 47%, turned out to be a bot-traffic artifact; human mobile share there held near 70%. Over the full year to the Q2 2026 close, blended mobile fell 3.5 points (43.8% to 40.3%) while human-only mobile fell a smaller 2.4 points (57.3% to 54.9%), so roughly a third of the desktop gain is rising bot traffic and the rest is a real, slow human drift concentrated in developed markets, where US and German human mobile share both slipped below 50% for the first time.
What does high mobile share mean for B2B SaaS companies?
High mobile share in a country signals that local businesses are building mobile-first products, buying mobile-capable tooling, and prioritizing mobile-responsive customer experiences. If you sell into Bangladesh or Nigeria, your prospects are likely running modern mobile-capable frontend frameworks, mobile CMS platforms, and mobile analytics. If you sell into Finland or Germany, desktop parity is still critical and mobile-only products face adoption friction.
Did mobile lose share in 2026 because of bots or real users?
Both, in roughly a one-to-two split. Year over year to the Q2 2026 close, blended mobile share fell 3.5 points but human-only mobile fell 2.4 points, so about a third of the apparent desktop gain is rising desktop-classified bot traffic and about two-thirds is genuine human drift. That human drift is concentrated in developed markets: United States and German human mobile share each fell below 50% for the first time in Q2 2026.
Which country has the highest IPv6 adoption?
Among the markets we track, India carries the most traffic over IPv6 at 64.6% of requests in Q2 2026, driven by its IPv6-first mobile carriers, followed by France at 52.0% and Brazil at 46.3%. Global IPv6 request share was flat year over year at 29.6%. The United States sits at 28.0% and Nigeria at just 5.0%.
Are mobile-first countries also IPv6-first?
No. IPv6 adoption tracks whether a country's carriers deployed it, not how mobile the population is. India, a mobile-first market, leads at 64.6% IPv6, but Nigeria, the second most mobile-first country, runs only 5.0% IPv6, while desktop-heavy France carries 52.0%. Vietnam (up 10.2 points year over year) and Indonesia (up 7.9) were the fastest movers.
Methodology: how we analyzed Cloudflare Radar data
Data source: Cloudflare Radar Traffic, specifically the summary/device_type and timeseries_groups/device_type endpoints, plus summary/os for the Android-vs-iOS breakdown (28 days ending June 9, 2026, request-weighted). Cloudflare's network handles roughly 20% of the public web, making this the largest publicly-queryable sample of HTTP traffic available.
Sample size: Country-level HTTP request totals across 43 tracked countries plus one excluded outlier (Iran). The global aggregate covers every country Cloudflare serves, which is most of the internet-connected world.
Timeframe: 90-day window from January 20, 2026 to April 20, 2026. Weekly timeseries data covers the same window in 14 weekly buckets. Month-over-month data compares the 30 days ending April 20 against the prior 30 days (March 21 through April 19).
Method: I queried the Radar API directly for device type share at both the global and per-country level. Device classification is Cloudflare's own — they categorize user agents into desktop, mobile, and other based on request headers. I exported the raw data, cross-checked a handful of countries against Cloudflare's web dashboard to confirm numeric agreement, and structured the 10 highest mobile-share and 10 highest desktop-share countries as top-10 rankings. For the month-over-month comparison, I pulled 30d and 30dControl datasets for six strategically important markets (India, Japan, Bangladesh, US, Germany, Nigeria).
Why 43 countries: Cloudflare Radar reports data for a long tail of countries, but I focused on the 43 with high enough request volume to produce stable device-share numbers. Countries with very low traffic volume can swing several percentage points day-to-day and aren't useful for benchmarking.
July 2026 refresh (Q2 close and first year-over-year layer): For this update I aggregated the full Q2 2026 calendar quarter (April 1 to June 30) and pulled the same window in Q1 2026 and Q2 2025 to add quarter-over-quarter and year-over-year comparisons. Blended and human-only device share both come from http/summary/device_type, with the human-only cut filtered by botClass=likely_human; the net-new IPv6 breakdown comes from http/summary/ip_version at the per-country level. All figures were pulled from the Cloudflare Radar API on July 2, 2026 and are attributed inline under each new table. The blended-versus-human decomposition (a 3.5-point blended mobile decline against a 2.4-point human-only decline) is the method behind the "about a third is bots" claim: the 1.1-point gap between the two series is the growing desktop-classified bot share. One measurement note carried into this refresh: http/summary/ip_version reports the share of requests carried over IPv6, which is a network-transport measure, not a count of IPv6-capable users or devices.
Limitations:
- Request-weighted data over-represents desktop relative to session-weighted or user-weighted metrics. For audience sizing, survey-based sources are a better reference.
- Iran's 96.19% desktop figure reflects VPN/proxy routing conditions, not actual device usage. Excluded from rankings.
- The 0.03% "other" category (tablets, consoles, TVs) is too small to produce meaningful country-level rankings for those device types.
- Cloudflare's coverage varies slightly by country. In a handful of markets, local CDNs or domestic-routed traffic never touch Cloudflare's network.
- This analysis is a snapshot. Device share shifts month to month, and anyone using this data for strategic planning should refresh it against live Cloudflare Radar queries periodically.
For related Cloudflare-sourced analysis, see our pieces on HTTP protocol adoption and cloud provider traffic share — both use the same underlying telemetry with different slices.

Data Analyst
5+ years of experience
Emma is a Data Analyst at TechnologyChecker, where she analyses technology adoption data to build better prospect lists and uncover actionable patterns for sales teams.
- BSc Data Science, Cardiff University
- Google Data Analytics Professional Certificate
- Tableau Desktop Certified Associate
Never miss our research

