AI Market Size Statistics 2026: 26 Charts From $94B to $1.67 Trillion by 2031
Global AI market: $94.81B (2020) → $1.675T forecast (2031). 26 interactive charts on segments, regional adoption, GenAI — Statista 2026 dossier.
Published •32 min read

The global artificial intelligence market was worth $94.81 billion in 2020. By 2031, Statista Market Insights forecasts it will reach $1.675 trillion — a 17.7× expansion in just over a decade. That single trajectory reframes every adjacent conversation: AI's share of new unicorn births has gone from 6% in 2015 to 53% in 2025; corporate AI adoption has jumped from 55% to 88% in two years; and generative AI alone is projected to grow from $37.87B in 2024 to $442B by 2031. This report pulls 26 charts from Statista's May 2026 AI dossier and walks through what each one means — for vendors, investors, and the workforce.
We layer in TechnologyChecker.io's own detection data alongside each forecast. Statista measures revenue projections; we measure live deployment signals across 29.9M active domains in our monthly crawl. The two views frequently diverge — and where they diverge is usually where the actual strategic question lives.
Key findings — Statista AI dossier, 2026:
- $1.675 trillion projected global AI market size by 2031, up from $94.81B in 2020 — a +1,667% expansion across 11 years. Source: Statista Market Insights.
- 88% of organizations worldwide use AI in at least one function in 2025, up from 55% in 2023 — a 33-point jump in two years. Source: McKinsey & Co.; Stanford University.
- 53% of all new unicorns born in 2025 were AI startups, up from 32% in 2023 and 6% in 2015. One in five new 2025 unicorns is an AI agents company. Source: CB Insights.
- The United States leads the Government AI Readiness Index at 87.2/100, followed by the UK (77.64) and France (77.27). Source: Oxford Insights.
- India and Nigeria report 92% AI usage rates among consumers — higher than any advanced economy. Singapore is the top-ranked advanced economy at 73%. Source: KPMG; University of Melbourne.
- Generative AI is the fastest-growing AI segment: forecast to grow from $37.87B (2024) to $441.6B by 2031, a +1,067% trajectory. Source: Statista Market Insights.
- AI robotics market growth peaks at 35.28% in 2024 before tapering to 23.5% by 2031 — the AI subsegment with the most sustained growth curve.
- 53% of AI leaders are restructuring their workforce around AI fluency education as the #1 talent-strategy adjustment in 2025. Source: Deloitte.
How to read this report
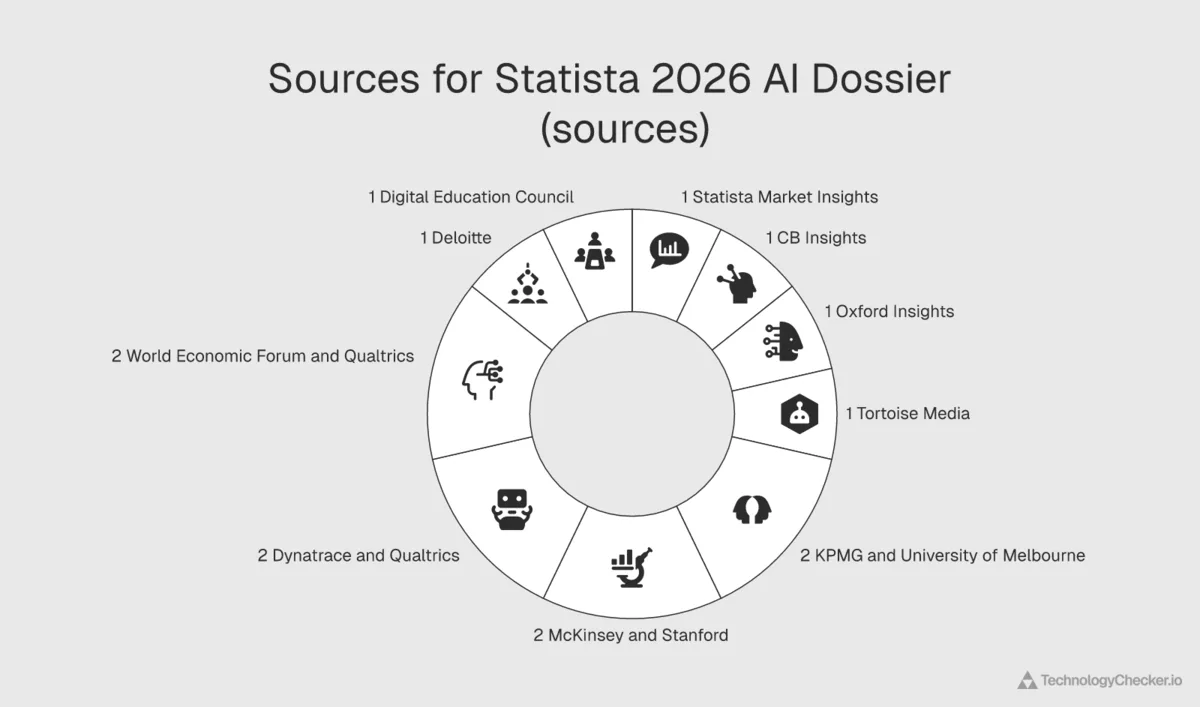
We curated this report from multiple authoritative sources, layered with TechnologyChecker.io's own detection data. Eleven distinct research providers contribute the underlying numbers: CB Insights (unicorn births), Oxford Insights and the International Development Research Centre (Government AI Readiness Index), Tortoise Media (Global AI Strategy Index), KPMG International with the University of Melbourne (consumer AI usage survey, 48,000 respondents), McKinsey & Company with Stanford University (State of AI organizational adoption), Dynatrace and Qualtrics (agentic AI barriers, 919 respondents), the World Economic Forum with Qualtrics (Future of Jobs employer skills survey, 1,000 respondents), Deloitte (AI leader talent strategy, 3,235 respondents), the Digital Education Council (faculty views, 1,681 respondents across 28 countries), and Statista Market Insights (in-house revenue forecasts). Statista's 2026 Artificial Intelligence (AI) dossier (study ID 38609) is the publication that assembled these eleven sources into a single 33-page reference; we reused that assembly as our starting point and kept both source layers visible in every citation so you can trace each data point back to its origin.
A calibration note before you read further. Statista Market Insights is Statista's proprietary in-house forecast model — not a primary research firm in the IDC, Gartner, or Forrester mold, and its underlying methodology is not public. Other major aggregators (Grand View Research, Precedence Research, Bloomberg Intelligence) publish AI market forecasts that differ from Statista's by hundreds of billions of dollars at the 2031 horizon. Treat the specific dollar values in this report as one credible estimate among several, not as the canonical number. The directional story — multi-trillion-dollar trajectory, generative AI as the fastest-growing segment, emerging-market lead on consumer adoption — is consistent across the major aggregators. The exact 2031 dollar figures are not.
On top of these curated forecasts and survey results, we add a third layer: TechnologyChecker.io's first-party detection data from our monthly crawl of 29.9M active domains. Where the dossier measures revenue projections and survey-based adoption, our crawl measures live deployment signals — which AI vendors are actually integrated into commercial websites, by country, by industry, and by adjacent stack component. These three layers (revenue forecasts + survey adoption + commercial deployment) answer different questions, and they don't always agree. The sections below walk through each chart's Statista-sourced view first, then surface the TechnologyChecker.io data where it adds, contradicts, or contextualizes the forecast.
Quick stats overview
| Metric | Value | Source |
|---|---|---|
| Global AI market size (2020) | $94.81B | Statista Market Insights |
| Global AI market size (2024, actual) | $186.93B | Statista Market Insights |
| Global AI market size (2031, forecast) | $1.675T | Statista Market Insights |
| AI growth rate (2024) | 34.75% | Statista Market Insights |
| Generative AI market (2024 → 2031) | $37.87B → $441.6B | Statista Market Insights |
| Machine learning segment (2031 forecast) | ~$568B | Statista Market Insights |
| Organizations using AI (2025) | 88% | McKinsey; Stanford |
| Top AI usage country (2025) | India / Nigeria, 92% | KPMG; Univ. of Melbourne |
| Top Government AI Readiness Index (2025) | United States, 87.2/100 | Oxford Insights |
| AI share of new unicorns (2025) | 53% | CB Insights |
| #1 AI talent strategy adjustment (2025) | Workforce AI fluency education, 53% | Deloitte |
AI market size and growth (2020–2031)
The headline number from the dossier is also its most-cited: global AI revenue is forecast to grow from $94.81B in 2020 to $1.675 trillion in 2031.
Global AI Market Forecast 2020-2031: $94B to $1.67 Trillion
The global AI market is forecast to grow from $94.81 billion in 2020 to $1.675 trillion by 2031 — a 17.7x expansion over the decade. Between 2026 and 2031 alone, the market is projected to add $1.3 trillion (+382.65 percent). Growth is not linear: 2022 dipped to $126.78B from the 2021 surge to $206.34B before resuming its long-term trajectory. The strongest compounding happens after 2027.
Source: Statista Market Insights · 2020-2031
| Year | Market size (billion USD) |
|---|---|
| 2020 | $94.81B |
| 2021 | $206.34B |
| 2022 | $126.78B |
| 2023 | $137.5B |
| 2024 | $186.93B |
| 2025 | $254.5B |
| 2026 | $347.05B |
| 2027 | $473.98B |
| 2028 | $648.34B |
| 2029 | $888.24B |
| 2030 | $1218.8B |
| 2031 | $1675B |
- 2026 market size hits $347B — roughly the combined revenue of the world's top five SaaS companies
- Forecast implies +$1.3 trillion in new market value between 2026 and 2031
- 2022's dip to $126.78B from the 2021 peak of $206.34B is the only contraction year in the series
Two patterns deserve attention. First, the trajectory isn't smooth — there's a visible contraction in 2022 (from $206B in 2021 down to $127B) before recovery in 2023. We originally read this as the post-ZIRP valuation correction and an enterprise AI capex pullback, but that explanation doesn't survive scrutiny. Real markets don't contract 38% in a year and then recover 47% two years later — that pattern is the signature of category-definition or methodology revision between Statista's annual updates, not an actual market contraction. AI vendor revenue did not collapse in 2022. We report the published series as-is for transparency, but the 2021→2022 sequence is best treated as a series discontinuity rather than a market signal. The same caveat applies to several segment-level charts below where the 2022 dip reappears. Second, growth accelerates sharply from 2026 onward, with the market roughly doubling every three years from $347B in 2026 to $648B in 2028 and then to $1.22T in 2030. Statista attributes +382.65% of growth specifically to the 2026–2031 window — meaning the bulk of the curve is still ahead of us.
| Year | AI market size (billion USD) | YoY change |
|---|---|---|
| 2020 | $94.81 | — |
| 2021 | $206.34 | +117.21% |
| 2022 | $126.78 | −38.4% |
| 2023 | $137.50 | +10.91% |
| 2024 | $186.93 | +34.75% |
| 2025 | $254.50 | +31% |
| 2026 | $347.05 | +29.78% |
| 2027 | $473.98 | +28.5% |
| 2028 | $648.34 | +27.21% |
| 2029 | $888.24 | +25.94% |
| 2030 | $1,218.80 | +24.71% |
| 2031 | $1,675.00 | +23.54% |
The percentage change view tells a clearer growth-deceleration story.
AI Market Growth Rate 2021-2031: 35% in 2024 Tapering to 23.5% by 2031
The global artificial intelligence market grew 34.75% year-over-year in 2024 and is forecast to maintain growth rates between 23.5% and 31% through 2031, according to Statista Market Insights. After peaking at 117.21% in 2021 and contracting 38.4% in 2022 during the post-ZIRP correction, the AI market entered a 'mature high-growth' phase. The forecast deceleration of just 11.21 percentage points over 2024-2031 is unusually flat for a market this size, signaling sustained double-digit growth through the end of the decade.
Source: Statista Market Insights · 2021-2031
| Year | Year-over-year change (%) |
|---|---|
| 2021 | 117.21% |
| 2022 | -38.4% |
| 2023 | 10.91% |
| 2024 | 34.75% |
| 2025 | 31% |
| 2026 | 29.78% |
| 2027 | 28.5% |
| 2028 | 27.21% |
| 2029 | 25.94% |
| 2030 | 24.71% |
| 2031 | 23.54% |
- 2022 contraction of -38.4% is the only negative year in the eleven-year series
- Growth stabilizes in a 23-35% band from 2024 onward — a mature high-growth phase
- Only 11.21 percentage points of deceleration over 2024-2031 — flatter than most analyst forecasts
After the 117% bubble year of 2021 and the −38% reset of 2022, the growth rate stabilizes in a relatively narrow band between 23% and 35% from 2024 through 2031. This is the "mature high-growth" phase — large absolute dollar gains, but on a base that's expanding so fast the percentages tighten. Between 2024 and 2031, growth rates are forecast to drop by only 11.21 percentage points, which is a remarkably flat deceleration curve for a market this size.
AI's share of new unicorn births

If market-size charts measure capital flowing into AI, unicorn-birth share measures capital flowing out — investors voting with multi-hundred-million-dollar checks for which startups deserve a $1B+ valuation.
AI Share of New Unicorns 2015-2025: From 6% to 53%
In 2025, 53 percent of new unicorn births worldwide were AI startups — up from 6 percent in 2015 and 44 percent in 2024. Growth accelerated sharply between 2023 and 2025, roughly tripling the AI share of new billion-dollar companies in three years. CB Insights reports that one in five new unicorns in 2025 are AI agents.
Source: CB Insights · 2015-2025
| Year | AI share of new unicorns (%) |
|---|---|
| 2015 | 6% |
| 2016 | 11% |
| 2017 | 15% |
| 2018 | 17% |
| 2019 | 23% |
| 2020 | 14% |
| 2021 | 18% |
| 2022 | 17% |
| 2023 | 32% |
| 2024 | 44% |
| 2025 | 53% |
- 53% of 2025 unicorn births were AI startups — more than half of all new billion-dollar companies
- The 2023-2025 acceleration (32% → 53%) maps directly to the GenAI funding wave post-ChatGPT launch
- One in five new 2025 unicorns are AI agents, per CB Insights — an emerging category inside the category
The chart shows AI's share of all new unicorns rising from 6% in 2015 to 53% in 2025 — meaning more than half of every new billion-dollar startup born globally in 2025 is an AI company. The acceleration is concentrated in the last three years: AI was 17% of new unicorns in 2022, jumped to 32% in 2023, hit 44% in 2024, then crossed the majority threshold in 2025. CB Insights' supplementary note that "one in five new unicorns in 2025 are AI agents" is the more specific signal: agentic AI is now its own venture category at scale, not a feature of generic LLM startups.
Consumer AI usage by country (2025)

The dossier's KPMG–University of Melbourne survey of 48,000 respondents reverses the assumption that AI is an advanced-economy story.
Consumer AI Usage by Country 2025: India and Nigeria Lead at 92%
In 2025, India and Nigeria reported the world's highest consumer AI usage rates at 92 percent each, followed by UAE (91%), Egypt (90%), and China (89%). Emerging economies dominate the top of the list — every country with 85%+ usage is classified as an emerging market. Advanced economies such as Singapore (73%) trail the leaders by nearly 20 percentage points.
Source: KPMG International; The University of Melbourne · 2025
| Country | Share of respondents (%) |
|---|---|
| India | 92% |
| Nigeria | 92% |
| UAE | 91% |
| Egypt | 90% |
| China | 89% |
| Saudi Arabia | 88% |
| Costa Rica | 87% |
| South Africa | 83% |
| Brazil | 82% |
| Türkiye | 81% |
| Mexico | 77% |
| Argentina | 75% |
| Colombia | 74% |
| Singapore | 73% |
- Emerging economies dominate — every country at 85%+ AI usage is classified as emerging
- India and Nigeria tie for #1 at 92%, reflecting AI's role as a productivity leapfrog in high-growth markets
- Singapore at 73% is the highest-ranked advanced economy — still 19 points behind the leaders
Emerging economies dominate the top of the list. India and Nigeria tie at 92% of consumers using AI regularly or semi-regularly. The UAE (91%), Egypt (90%), and China (89%) round out the top five. Among the 14 countries shown, the lowest usage rate is Singapore at 73% — still a higher rate than most "AI adoption" estimates assumed two years ago, but a 19-point gap behind India.
| Rank | Country | AI usage rate | Economy type |
|---|---|---|---|
| 1 | India | 92% | Emerging |
| 1 | Nigeria | 92% | Emerging |
| 3 | United Arab Emirates | 91% | Emerging |
| 4 | Egypt | 90% | Emerging |
| 5 | China | 89% | Emerging |
| 6 | Saudi Arabia | 88% | Emerging |
| 7 | Costa Rica | 87% | Emerging |
| 8 | South Africa | 83% | Emerging |
| 9 | Brazil | 82% | Emerging |
| 10 | Türkiye | 81% | Emerging |
| 11 | Mexico | 77% | Emerging |
| 12 | Argentina | 75% | Emerging |
| 13 | Colombia | 74% | Emerging |
| 14 | Singapore | 73% | Advanced |
This emerging-market lead has practical implications for product strategy. If a vendor is building consumer AI features and excluding India, Nigeria, Brazil, and Turkey from priority markets, they're missing the highest-usage cohorts.
What our detection data shows alongside this: the consumer-usage map and the commercial-deployment map are different shapes. In our monthly crawl, OpenAI ChatGPT is detected on customer-facing websites with a top-7 distribution led by the United States (7,793 domains), United Kingdom (1,441), Germany (996), Canada (802), France (763), Spain (724), and Australia (591). India and Nigeria — the leaders on consumer use — sit much further down the commercial-deployment ranking. The implication: emerging markets are using AI heavily as end-users, but advanced economies are integrating AI into their websites and products at scale. Both views are real; they answer different questions. (For the supply-side picture, see our analysis of which AI crawlers get blocked most — publishers are actively shaping which vendors can train on their data.)
Government AI readiness and strategy (2024–2025)
Two charts in the dossier rank countries on AI policy — but they measure different things, and the rankings only partially overlap.
Government AI Readiness Index 2025: US Leads at 87.2
The United States tops the 2025 Government AI Readiness Index with a score of 87.2, followed by the United Kingdom (77.64), France (77.27), the Netherlands (75.57), and China (75.55). The index measures a government's capacity to implement AI across public services — healthcare, education, transportation, and administration. The US lead of nearly 10 points over #2 is the largest gap in the top 15.
Source: International Development Research Centre; Oxford Insights · 2025
| Country | AI readiness index score |
|---|---|
| United States | 87.2 |
| United Kingdom | 77.64 |
| France | 77.27 |
| Netherlands | 75.57 |
| China | 75.55 |
| Germany | 75.5 |
| Singapore | 74.36 |
| South Korea | 73.54 |
| Australia | 73.16 |
| Norway | 72.33 |
| Canada | 72.26 |
| Spain | 71.95 |
| Denmark | 71.41 |
| Japan | 70.99 |
| Saudi Arabia | 69.79 |
- US lead of nearly 10 points over #2 is the largest gap anywhere in the top 15
- China (#5) and Saudi Arabia (#15) are the only non-OECD countries in the leading cluster
- The top 15 all score above 69 — government AI capacity is clustered tightly outside the US
The Government AI Readiness Index — produced by Oxford Insights and the International Development Research Centre — measures how prepared a government is to deploy AI within public services (healthcare, education, transportation, administration). The United States leads at 87.2/100, followed by the UK (77.64), France (77.27), the Netherlands (75.57), and China (75.55). The gap between #1 and #2 is wider than the gap between #2 and #15 (Saudi Arabia at 69.79), which suggests the US has a structural readiness advantage rather than a narrow lead.
Leading National AI Strategies 2024: Saudi Arabia Tops at 100, US at 83
Saudi Arabia leads the world in artificial intelligence strategy ambition in 2024 with a perfect Tortoise Media Global AI Index strategy score of 100, followed by the United States (83), Canada (70), and South Korea (69). The strategy score measures the documented ambition of national AI plans — distinct from the Government AI Readiness Index, which measures execution capacity. Saudi Arabia's #1 ranking is driven by the Vision 2030 program. The US leads both indexes but trails Saudi Arabia by 17 points on documented strategy.
Source: Tortoise Media · 2024
| Country | AI strategy score |
|---|---|
| Saudi Arabia | 100 |
| United States | 83 |
| Canada | 70 |
| South Korea | 69 |
| Spain | 66 |
| China | 66 |
| United Kingdom | 65 |
| Germany | 59 |
| France | 59 |
| Singapore | 59 |
| India | 55 |
| Japan | 54 |
| Italy | 53 |
| Turkey | 48 |
| Taiwan | 47 |
- Saudi Arabia is the only country scoring 100 — Vision 2030 has produced the most documented AI ambition globally
- US at 83 trails Saudi Arabia on strategy but leads the world on the Government AI Readiness Index
- Top 15 spans 100 → 47 — a 53-point spread, indicating wide variation in how seriously governments document AI plans
Tortoise Media's strategy score, which measures the ambition of national AI strategies rather than execution readiness, produces a different leaderboard. Saudi Arabia scores 100 — the only country at the ceiling. The United States is second at 83, Canada third at 70. China and Spain tie at 66, behind the UK (65). The two charts together tell the same story two ways: the US has both the readiness and the strategy. Saudi Arabia is making the biggest strategic bet (driven by the Vision 2030 program), but trails on readiness. The UK, France, Canada, and Germany are consistently top-tier across both measures.
Enterprise AI adoption by region (2023–2025)
McKinsey and Stanford's annual State of AI survey provides the cleanest year-over-year view of corporate adoption.
Organizational AI Adoption 2023-2025: 88% Global, Europe Leads at 91%
88% of organizations worldwide used artificial intelligence in at least one business function in 2025, up from 55% in 2023 — a 33-percentage-point jump in two years, according to McKinsey & Company and Stanford University's State of AI survey. Europe leads regions at 91% adoption (up from 57% in 2023), followed by North America (90%) and Greater China and developing markets (88%). Asia-Pacific is the regional laggard at 82% but still gained 24 percentage points over two years. Greater China posted the largest single-year jump (75% to 88%) between 2024 and 2025.
Source: McKinsey & Company; Stanford University · 2023-2025
| Region | Share of organizations (%) |
|---|---|
| All geographies | 88% |
| Asia-Pacific | 82% |
| Europe | 91% |
| North America | 90% |
| Greater China | 88% |
| Developing markets | 88% |
- Europe overtook North America for the global lead in 2025 at 91% adoption
- Greater China posted the largest +13-point jump from 2024 to 2025 — less restrictive regulation than EU/US
- Global adoption rose 33 percentage points in just two years (55% → 88%)
Globally, organizational AI use jumped from 55% (2023) → 78% (2024) → 88% (2025) — a 33-percentage-point gain in two years. Every region tracked grew in every year. Europe overtook North America for the lead in 2025 at 91% (vs. North America's 90%). The biggest single-year jump came from Greater China, where adoption rose 13 percentage points from 75% to 88% between 2024 and 2025 — McKinsey attributes this partly to less restrictive regulation than in the EU or US.
| Region | 2023 | 2024 | 2025 | 2-yr change |
|---|---|---|---|---|
| All geographies | 55% | 78% | 88% | +33 pt |
| Asia-Pacific | 58% | 72% | 82% | +24 pt |
| Europe | 57% | 80% | 91% | +34 pt |
| North America | 61% | 82% | 90% | +29 pt |
| Greater China | 48% | 75% | 88% | +40 pt |
| Developing markets | 49% | 77% | 88% | +39 pt |
The Greater China and Developing Markets cohorts both showed the largest two-year gains (+40 and +39 points respectively), starting from the lowest 2023 baselines. The gap between the lowest and highest regions has compressed from 13 points in 2023 to just 9 points in 2025.
Barriers to agentic AI in production (2025)
A Dynatrace–Qualtrics survey of 919 enterprise respondents (Nov–Dec 2025) identifies what's blocking agentic AI from moving past pilots into production.
Top Barriers to Agentic AI in Production 2025: 60% Cite Agent Management
60% of senior IT leaders in Asia-Pacific cite managing and monitoring AI agents at scale as the top barrier to putting agentic AI into production in 2025 — the highest rate globally, according to Dynatrace and Qualtrics' survey of 919 respondents. In EMEA, 50% cite the same barrier. The Americas reverses the order — 51% cite shortage of skilled staff as the #1 obstacle versus 45% citing management overhead. The regional split: in Asia and Europe, the problem is operational complexity; in the Americas, it is talent supply.
Source: Dynatrace; Qualtrics · 2025
| Barrier | Share of respondents (%) |
|---|---|
| Managing agents at scale | 60% |
| Shortage of skilled staff | 51% |
- APAC has the hardest time scaling agent operations (60%) — 15 points higher than the Americas
- The Americas is the only region where talent shortage (51%) outranks operational complexity
- EMEA sits in the middle on both dimensions — neither the hardest to hire nor the hardest to operate
Two barriers dominate, and they vary sharply by geography. Managing and monitoring agents at scale is the #1 issue in APAC (60% of respondents) and EMEA (50%), but only 45% of Americas respondents flag it. Shortage of skilled staff is the bigger blocker in the Americas (51%) than in APAC (46%) or EMEA (39%). The Americas-versus-rest-of-world split suggests U.S. companies have made more architectural progress on observability tooling but are now hitting a hiring wall. APAC and EMEA respondents are still wrestling with the operational reality of monitoring autonomous agents in production environments.
AI as a core employer skill — by region
The World Economic Forum and Qualtrics surveyed 1,000 employers about which skills they expect to be "core" to their workers between 2025 and 2030.
AI as Core Skill 2025-2030: 62% in N. America, 32% in Central Asia
62% of North American employers expect artificial intelligence and big data to be core worker skills between 2025 and 2030 — the highest share globally, according to the World Economic Forum and Qualtrics' Future of Jobs survey of 1,000 employers. Southeastern Asia (58%), Southern Asia (55%), and Sub-Saharan Africa (55%) follow closely, signaling emerging-market employer demand matches or exceeds many advanced economies. Europe sits in the middle at 44%, behind the Middle East (46%) and Eastern Asia (45%). Central Asia is the global outlier at 32%, the only region where fewer than 40% of employers classify AI as a core skill.
Source: Qualtrics; World Economic Forum · 2025-2030
| Region | Share of employers (%) |
|---|---|
| Northern America | 62% |
| South-eastern Asia | 58% |
| Southern Asia | 55% |
| Sub-Saharan Africa | 55% |
| Middle East and N. Africa | 46% |
| Eastern Asia | 45% |
| Europe | 44% |
| Latin America & Caribbean | 40% |
| Central Asia | 32% |
- Northern America at 62% leads the global ranking on AI/big-data skill demand
- Asia-Pacific emerging economies (SE Asia 58%, S. Asia 55%) outrank Europe (44%)
- Central Asia is the only region below 40% — a 30-point gap behind the leader
North American employers lead at 62% rating AI and big data as core skills for the next five years. Southeastern Asia (58%), Southern Asia (55%), and Sub-Saharan Africa (55%) follow — a notable signal that emerging-economy employers are betting heavily on AI skills, consistent with the consumer-adoption pattern above. Central Asia is the outlier, with only 32% of employers identifying AI/big data as core. Europe sits in the middle at 44%, behind the Middle East and Northern Africa (46%) and Eastern Asia (45%).
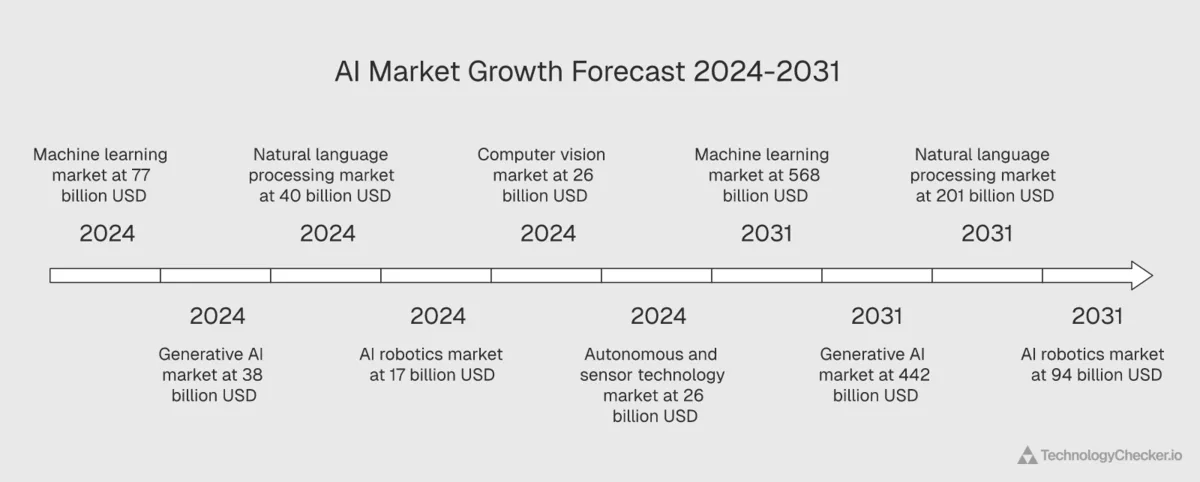
AI market segments: Machine Learning, Computer Vision, NLP, Robotics, Autonomous Tech

Statista's Market Insights model splits the overall AI market into five technical segments. The headline 2024 segment values:
| Segment | 2024 size | 2031 forecast | Growth (2024→2031) |
|---|---|---|---|
| Machine Learning | $77.13B | ~$568B | +$491B (+637%) |
| Computer Vision | $25.92B | ~$72.66B | +$46.74B (+180%) |
| Natural Language Processing | $39.79B | ~$201.49B | +$161.7B (+406%) |
| AI Robotics | $17.14B | $94.14B | +$77B (+449%) |
| Autonomous & Sensor Technology | $26.46B | ~$68.75B | +$42.29B (+160%) |
| Generative AI (deep-dive below) | $37.87B | ~$442B | +$404B (+1,067%) |
Machine learning is the largest segment in absolute dollars; generative AI has the highest percentage growth. The next eight charts walk through each segment's size and growth trajectory.
Machine Learning market (2020–2031)
Machine Learning Market Size 2020-2031: $77B in 2024, $568B by 2031
The global machine learning market reached $77.13 billion in 2024 and is forecast to grow to $568 billion by 2031, according to Statista Market Insights — an 11x expansion in eleven years adding $491 billion of new market value. Machine learning is the largest segment of the broader AI market by absolute dollar value, ahead of generative AI ($442B forecast for 2031) and natural language processing ($201B). The 2022 contraction visible in the chart reflects the post-ZIRP capex correction shared by every classical AI segment.
Source: Statista Market Insights · 2020-2031
| Year | ML market size (USD billions) |
|---|---|
| 2020 | $49.52B |
| 2021 | $120B |
| 2022 | $65B |
| 2023 | $55B |
| 2024 | $77.13B |
| 2025 | $107B |
| 2026 | $143B |
| 2027 | $195B |
| 2028 | $256B |
| 2029 | $335B |
| 2030 | $440B |
| 2031 | $568.32B |
- ML is the largest AI segment by 2031 — $568B vs. NLP's $201B and GenAI's $442B
- Adds $491B between 2024 and 2031 — nearly 7x the 2024 base
- 2022 dip reflects the post-ZIRP capex correction shared by every classical AI segment
ML stood at $77.13 billion in 2024, up $27.61B from 2020. Statista forecasts it will rise by $491.19 billion over 2024–2031 — meaning the segment will be roughly 7× larger by 2031. The trajectory shows the same 2022 contraction visible in the headline chart, but the ML-specific recovery from 2024 onward is sharper than for the AI market overall.
Machine Learning Market Growth 2021-2031: 44.66% in 2024, 29% by 2031
The global machine learning market grew 44.66% year-over-year in 2024 and is forecast to decelerate to 29.36% by 2031, according to Statista Market Insights. Machine learning experienced the only consecutive two-year contraction in the AI dossier (-45.8% in 2022, -15.4% in 2023) before recovery in 2024. Forecast deceleration of just 15.3 percentage points over 2024-2031 keeps ML in high-20% territory through the end of the decade — a multi-year compound expansion sustained at near-peak rates.
Source: Statista Market Insights · 2021-2031
| Year | Year-over-year change (%) |
|---|---|
| 2021 | 142.4% |
| 2022 | -45.8% |
| 2023 | -15.4% |
| 2024 | 44.66% |
| 2025 | 40% |
| 2026 | 38% |
| 2027 | 37% |
| 2028 | 35% |
| 2029 | 33% |
| 2030 | 31% |
| 2031 | 29.36% |
- 2024 growth rate of 44.66% is the post-correction stabilization point
- ML had two consecutive contraction years (2022-2023) — deeper than any other AI segment
- Forecast deceleration of just 15 percentage points over 2024-2031 keeps ML in high-20s territory
The ML growth-rate chart shows the post-2024 deceleration that mirrors the overall AI market — peaking at 44.66% in 2024 and tapering through the late 2020s. The 2022 dip is steeper than the overall AI market dip, which is consistent with ML being one of the segments most affected by the tech-capex pullback that year.
Computer Vision market (2020–2031)
Computer Vision Market 2020-2031: $25.92B in 2024 to $72.66B by 2031
The global computer vision market generated $25.92 billion in revenue in 2024 and is forecast to reach $72.66 billion by 2031, according to Statista Market Insights — a $46.74 billion expansion adding 180% over seven years. Computer vision is the smallest of the major AI segments but has the most linear growth curve, because revenue is tied to industrial cameras, automotive ADAS, and security systems — hardware-anchored categories that are more stable across capex cycles than software-only AI.
Source: Statista Market Insights · 2020-2031
| Year | CV market revenue (USD billions) |
|---|---|
| 2020 | $9.62B |
| 2021 | $23.5B |
| 2022 | $17.2B |
| 2023 | $22.4B |
| 2024 | $25.92B |
| 2025 | $30B |
| 2026 | $34.7B |
| 2027 | $40B |
| 2028 | $46.2B |
| 2029 | $53.7B |
| 2030 | $62.3B |
| 2031 | $72.66B |
- Smallest classical AI segment but most linear growth curve
- CV revenue is hardware-anchored (cameras, ADAS, security) so less sensitive to capex cycles
- Adds $46.74B between 2024 and 2031 — 180% expansion over seven years
Computer vision was a $25.92 billion market in 2024 — the smallest of the four "classical AI" segments. The forecast adds $46.74 billion over 2024–2031, ending at roughly $72.66B. CV's growth curve is the most linear of any AI segment shown, with none of the 2022 contraction the other segments display. This is likely because CV revenue is heavily tied to industrial cameras, automotive ADAS, and security systems — categories with more capex stability than software-only AI.
AI Robotics market (2020–2031)
AI Robotics Market 2020-2031: $17.14B in 2024 to $94.14B by 2031 (19x)
The global AI robotics market reached $17.14 billion in 2024 and is forecast to grow to $94.14 billion by 2031, according to Statista Market Insights — a 19x expansion across the eleven-year series. The 2024 inflection point reflects the commercial takeoff of humanoid robotics, warehouse automation, and AI-enabled industrial arms, as startups and established robot manufacturers began shipping at scale. AI robotics is the only segment in the Statista AI dossier without a 2022 contraction — physical product revenue is structurally smoother than software-only categories.
Source: Statista Market Insights · 2020-2031
| Year | AI robotics market size (USD billions) |
|---|---|
| 2020 | $4.98B |
| 2021 | $6.83B |
| 2022 | $9.33B |
| 2023 | $12.67B |
| 2024 | $17.14B |
| 2025 | $22.63B |
| 2026 | $29.5B |
| 2027 | $38.02B |
| 2028 | $48.46B |
| 2029 | $61.09B |
| 2030 | $76.21B |
| 2031 | $94.14B |
- Only AI segment without a 2022 contraction — physical-product revenue is smoother than software
- 19x growth over the eleven-year forecast — nearly $100B market by 2031
- 2024 inflection point: humanoid robotics + warehouse automation commercial takeoff
AI robotics is the segment to watch on absolute growth: from $4.98B in 2020 to a forecast $94.14B in 2031 — nearly 19× expansion. The 2024 figure of $17.14B represents almost 30% YoY growth over 2023. Statista's note that "the combination of AI and robotics took off in 2024, with both startups and established robot manufacturers teaming up" explains the inflection: 2024 is when humanoid robotics, warehouse automation, and AI-enabled industrial arms started generating commercial revenue at scale.
AI Robotics Growth 2021-2031: 35.28% in 2024, Smoothest AI Curve
The global AI robotics market grew 35.28% year-over-year in 2024 and is forecast to decelerate to 23.52% by 2031, according to Statista Market Insights. AI robotics is the only AI segment in the Statista dossier without a 2022 contraction, with growth rates running steadily between 35-37% from 2021 through 2024 before a gradual taper. The 11.76 percentage points of deceleration over 2024-2031 is the gentlest decline of any AI segment — robotics revenue is tied to physical product shipments, which creates a smoother growth profile than software-only AI.
Source: Statista Market Insights · 2021-2031
| Year | Year-over-year change (%) |
|---|---|
| 2021 | 37.07% |
| 2022 | 36.6% |
| 2023 | 35.8% |
| 2024 | 35.28% |
| 2025 | 32% |
| 2026 | 30.4% |
| 2027 | 28.9% |
| 2028 | 27.5% |
| 2029 | 26% |
| 2030 | 24.8% |
| 2031 | 23.52% |
- No 2022 contraction — the only segment in the dossier without one
- 11.76 percentage points of deceleration over 2024-2031 — gentlest decline in AI
- Sustained 23-37% growth band across the entire eleven-year window
What makes AI robotics distinctive on the growth chart: it's the only segment without a 2022 contraction. Growth rates run between 35–37% from 2021 through 2024, then taper gradually to 23.5% by 2031. Robotics revenue is tied to physical product shipments, which creates a smoother growth profile than software-only segments that swing harder with capex cycles.
Natural Language Processing market (2020–2031)
NLP Market Size 2020-2031: $39.79B in 2024 to $201B Forecast by 2031
The global natural language processing (NLP) market reached $39.79 billion in 2024 and is forecast to grow to $201.49 billion by 2031, according to Statista Market Insights — a $161.7 billion expansion over seven years. The 2022-to-2024 ramp (5x in two years, from $17.5B to $39.79B) is the steepest of any AI segment, mapping directly to the post-ChatGPT enterprise commercialization of large language models. NLP ends 2031 as the second-largest classical AI segment behind machine learning.
Source: Statista Market Insights · 2020-2031
| Year | NLP market size (USD billions) |
|---|---|
| 2020 | $13.38B |
| 2021 | $20.05B |
| 2022 | $17.5B |
| 2023 | $30.05B |
| 2024 | $39.79B |
| 2025 | $53B |
| 2026 | $70B |
| 2027 | $90B |
| 2028 | $115B |
| 2029 | $141B |
| 2030 | $170B |
| 2031 | $201.49B |
- 5x revenue ramp between 2022 and 2024 — steepest in any AI segment
- 2023 inflection maps to ChatGPT's enterprise commercialization
- $161.7B added between 2024 and 2031 — second-largest absolute growth after ML
NLP was $39.79 billion in 2024 and is forecast to add $161.7 billion by 2031 to reach ~$201B. The 2023 inflection point is the post-ChatGPT moment — NLP revenue spiked as enterprise customers started licensing large language models for production use cases. The 2024 number is roughly 5× the 2022 figure, the steepest two-year ramp of any segment shown.
NLP Market Growth 2021-2031: 71.7% Spike in 2023, 32.43% in 2024
The natural language processing market grew 32.43% year-over-year in 2024, following a 71.7% surge in 2023 — the largest single-year growth rate for any classical AI segment in the Statista AI dossier. The 2023 spike maps directly to ChatGPT's enterprise commercialization, when companies began licensing large language models at scale. NLP has the most volatile growth curve of any AI segment, swinging from 49.85% in 2021 to -12.72% in 2022 before the 2023 recovery. Forecast deceleration through 2031 ends the series at 18.16%.
Source: Statista Market Insights · 2021-2031
| Year | Year-over-year change (%) |
|---|---|
| 2021 | 49.85% |
| 2022 | -12.72% |
| 2023 | 71.7% |
| 2024 | 32.43% |
| 2025 | 33% |
| 2026 | 31% |
| 2027 | 28% |
| 2028 | 26% |
| 2029 | 24% |
| 2030 | 21% |
| 2031 | 18.16% |
- 2023 growth of 71.7% — biggest single-year jump for any classical AI segment
- Highest single-segment volatility from 50% spike to -13% contraction in consecutive years
- Forecast deceleration of 14.27 percentage points by 2031 — steepest decline in the dossier
The NLP growth chart shows the most volatile pattern of any segment: a 50% spike in 2021, a contraction in 2022, then a massive ~75% growth burst in 2023 — bigger than any segment except generative AI in the same year. From 2024 onward (32.43%), the trajectory normalizes into a familiar downward taper.
Autonomous & Sensor Technology market (2020–2031)
Autonomous & Sensor AI Market 2020-2031: $26.46B to $68.75B
The global autonomous and sensor technology market reached $26.46 billion in 2024 and is forecast to grow to $68.75 billion by 2031, according to Statista Market Insights — adding $42.29 billion over seven years. This is the slowest-growing major AI segment in percentage terms: Statista forecasts a 25.49-percentage-point decline in annual growth rates between 2024 (30.92%) and 2031 (5.43%) as the segment matures earlier than other AI categories. Despite the rapid deceleration, the autonomous and sensor tech market still grows 160% across the forecast window.
Source: Statista Market Insights · 2020-2031
| Year | Autonomous & sensor revenue (USD billions) |
|---|---|
| 2020 | $15.73B |
| 2021 | $31.45B |
| 2022 | $17.2B |
| 2023 | $20.21B |
| 2024 | $26.46B |
| 2025 | $33B |
| 2026 | $40B |
| 2027 | $46.5B |
| 2028 | $53.5B |
| 2029 | $60B |
| 2030 | $65B |
| 2031 | $68.75B |
- Slowest-growing AI segment — ends 2031 at single-digit annual growth
- $42.29B of new market value added between 2024 and 2031
- 2022 contraction was the deepest of any AI segment (-46%) — reflects the AV market reset that year
The autonomous and sensor technology segment was $26.46B in 2024, forecast to reach ~$68.75B by 2031 (+$42.29B). This is the slowest-growing of the AI segments in percentage terms — Statista's note flags it explicitly as having a 25.49-percentage-point decline in growth rate between 2024 and 2031.
Autonomous & Sensor Tech Growth 2021-2031: 30.92% in 2024, 5.43% by 2031
The global autonomous and sensor technology market grew 30.92% year-over-year in 2024 and is forecast to slow to just 5.43% by 2031, according to Statista Market Insights. After a 99.94% surge in 2021 driven by early autonomous-vehicle capex and a 45.31% contraction in 2022 during the AV market reset, the segment is decelerating faster than any other AI category — ending the forecast period at near-mature single-digit growth. The 25.49-percentage-point deceleration over 2024-2031 is the steepest of any AI segment.
Source: Statista Market Insights · 2021-2031
| Year | Year-over-year change (%) |
|---|---|
| 2021 | 99.94% |
| 2022 | -45.31% |
| 2023 | 17.5% |
| 2024 | 30.92% |
| 2025 | 24.7% |
| 2026 | 21.2% |
| 2027 | 18.4% |
| 2028 | 15.4% |
| 2029 | 12% |
| 2030 | 8.7% |
| 2031 | 5.43% |
- Steepest growth deceleration in the dossier — 25.49 percentage points lost between 2024 and 2031
- 2031 annual growth of just 5-6% — closest to a mature-technology curve
- 100% growth peak in 2021 driven by early AV capex; -45% in 2022 was the deepest AI contraction
By 2031, this segment is growing at just 5–6% — closer to a mature-technology curve than the explosive trajectories of generative AI or robotics. That doesn't mean it's small (it ends at $68B+), but it does mean investor and vendor expectations should be calibrated differently. The 2021 100% growth spike is the residue of early autonomous-vehicle capex, and the 2022 contraction (−45%) reflects the well-documented AV market reset of that year.
How AI is reshaping the workforce

Three charts in the dossier examine how AI is changing talent strategy, which AI types employers expect to matter most, and how educators view the technology.
Talent strategy adjustments
AI Talent Strategy Adjustments 2025: 53% Prioritize Workforce AI Fluency
53% of senior AI leaders worldwide cite educating a broader workforce for AI fluency as their #1 talent strategy adjustment in 2025, according to Deloitte's survey of 3,235 senior IT and line-of-business leaders. Reskilling and upskilling strategies (48%) rank second, and hiring specialized AI talent third at 36%. Together the two whole-workforce education priorities outrank targeted strategies by 12-17 percentage points — organizations have collectively decided AI is a fluency problem, not a specialist-team problem. Even the lowest-ranked adjustment (rebalancing full-time, contract, and gig workers) is being pursued by 19% of respondents.
Source: Deloitte · 2025
| Talent strategy adjustment | Share of respondents (%) |
|---|---|
| Educate workforce for AI fluency | 53% |
| Upskilling and reskilling | 48% |
| Hiring specialized AI talent | 36% |
| Redesigning career paths | 33% |
| Assessing skill supply/demand | 30% |
| Performance incentives for AI use | 30% |
| Reimagining org structure | 30% |
| Measuring worker trust | 30% |
| Rebalancing full-time/contract/gig | 19% |
- 53% prioritize whole-workforce AI education — the consensus #1 talent strategy
- Hiring specialized AI talent ranks only #3 (36%) — fluency outranks specialization
- Bottom-ranked option (workforce-mix rebalance) sits at 19% — every option is being pursued by at least 1 in 5
Deloitte's August–September 2025 survey of 3,235 senior IT and line-of-business leaders shows that 53% of organizations are prioritizing "educating a broader workforce to raise overall AI fluency" as their top talent adjustment. Reskilling and upskilling strategies follow at 48%. Together those two general-workforce-education priorities are 5–17 points ahead of the more targeted strategies (hiring specialized AI talent at 36%, redesigning career paths at 33%).
| Talent strategy adjustment | % of respondents |
|---|---|
| Educating broader workforce for AI fluency | 53% |
| Designing upskilling and reskilling strategies | 48% |
| Hiring specialized AI talent | 36% |
| Redesigning career paths and mobility | 33% |
| Assessing supply/demand of skills | 30% |
| Providing AI-performance incentives | 30% |
| Reimagining org structure around AI work | 30% |
| Measuring worker trust and engagement | 30% |
| Rebalancing full-time, contract, gig mix | 19% |
The implication: organizations have decided that AI is not a specialist-team problem. It's a whole-company-fluency problem.
Physical AI types with the greatest impact
Top Physical AI Types 2025: Security & Smart Monitoring Lead at 21%
21% of AI leaders surveyed worldwide in 2025 expect intelligent security systems and smart monitoring to have the greatest industry impact among physical AI types, according to Deloitte's survey of 3,235 senior leaders. Collaborative robotics (20%) and digital twins (19%) follow closely, with IoT-driven retail (16%) and autonomous logistics (13%) rounding out the top five. The clustering of the top three categories at 19-21% suggests no single physical AI type is dominant — enterprise leaders see physical AI as a portfolio of co-emerging technologies rather than a single bet. Smart materials (7%) trails as the only physical AI category most respondents discount.
Source: Deloitte · 2025
| Physical AI type | Share of respondents (%) |
|---|---|
| Intelligent security/smart monitoring | 21% |
| Collaborative robotics | 20% |
| Digital twins | 19% |
| IoT-driven retail | 16% |
| Autonomous logistics | 13% |
| Smart materials | 7% |
| Other | 3% |
- Top three categories cluster tightly at 19-21% — no dominant physical AI bet
- Collaborative robotics + digital twins both above pure logistics or retail use cases
- Smart materials at 7% — the only physical AI category most leaders dismiss
When the same Deloitte respondents were asked which physical AI types they expect to drive the greatest industry impact, the top three are tightly clustered: intelligent security systems and smart monitoring (21%), collaborative robotics (20%), and digital twins (19%). IoT-driven retail (16%) and autonomous logistics (13%) round out the top five. Smart materials (7%) and "other" (3%) trail well behind. The clustering of the top three at 19–21% suggests no single category is dominant — enterprise leaders see physical AI as a portfolio of co-emerging technologies rather than a single bet.
AI/big data as core industry skills
AI as Core Skill by Industry 2025-2030: 66% in Tech & Telecom
66% of employers in information technology services and telecommunications expect artificial intelligence and big data to be core worker skills between 2025 and 2030 — tied for the highest share of any industry, according to the World Economic Forum and Qualtrics' Future of Jobs survey of 1,000 employers. Financial services (61%), insurance (58%), education (56%), and automotive/aerospace (54%) round out the top six. Professional services (37%) and infrastructure (39%) rank lowest, but every industry surveyed expects more than a third of its workforce to need AI skills by 2030.
Source: Qualtrics; World Economic Forum · 2025-2030
| Industry | Share of employers (%) |
|---|---|
| Info tech services | 66% |
| Telecommunication | 66% |
| Financial services | 61% |
| Insurance | 58% |
| Education | 56% |
| Automotive/aerospace | 54% |
| Medical/healthcare | 51% |
| Government | 50% |
| Electronics | 44% |
| Supply chain | 44% |
| Real estate | 43% |
| Consumer goods production | 42% |
| Retail & wholesale | 41% |
| Infrastructure | 39% |
| Professional services | 37% |
- Tech and telecom tie at 66% — AI skills are effectively non-optional in those verticals
- Financial services and insurance (61% and 58%) signal a compliance + risk-driven AI skill demand
- Even the lowest-ranked industry (professional services) sits at 37% — there is no low-AI-skill industry
The WEF–Qualtrics survey breaks down AI-as-a-core-skill by industry. The information & technology services and telecommunications industries lead at 66% of employers identifying AI/big data as a core skill for 2025–2030. Financial services (61%), insurance (58%), and education and training (56%) follow. The lowest two industries in the top 15 are infrastructure (39%) and professional services (37%) — both still meaningfully above the 32% Central Asia regional floor. The signal: every industry surveyed treats AI as core for at least a third of its workforce planning, but information services and telecom are nearly twice as bullish as the laggards.
Faculty views on AI in education
Faculty Views on AI in Education 2025: 78% in LATAM See Opportunity
78% of Latin American faculty members view artificial intelligence's impact on education as an opportunity rather than a challenge — the highest opportunity share globally, according to the Digital Education Council's 2025 survey of 1,681 faculty across 52 institutions in 28 countries. In contrast, 43% of USA and Canada faculty see AI as a challenge — the highest cautious share worldwide. APAC sits at 70% opportunity / 30% challenge, EMEA at 65% / 35%. Every region surveyed has more optimists than skeptics, but margins range from 1.3x (USA & Canada) to 3.5x (LATAM).
Source: Digital Education Council · 2025
| Region | Share of faculty (%) |
|---|---|
| APAC | 70% |
| EMEA | 65% |
| USA & Canada | 57% |
| LATAM | 78% |
- LATAM faculty most optimistic — 78% see AI as an opportunity, only 22% see a challenge
- USA & Canada is the only region above 40% challenge — most cautious in the world
- Every region sees opportunity outweighing challenge — but by margins of 1.3x to 3.5x
A 2025 Digital Education Council survey of 1,681 faculty members across 52 institutions in 28 countries asked whether AI's impact on education is a challenge or an opportunity. In every region, more faculty saw opportunity than challenge — but the ratio varies sharply. Latin America is the most optimistic (78% opportunity, 22% challenge). USA & Canada is the most cautious (57% opportunity, 43% challenge — the highest challenge share globally). APAC sits in between at 70/30, and EMEA at 65/35. The U.S. caution is consistent with the same region's higher AI-skilled-staff shortage barrier visible in the Dynatrace agentic AI chart above.
Special focus: Generative AI

Statista dedicates a full chapter to generative AI in the dossier, with four charts covering global market size, growth, and US/Europe regional breakdowns.
Generative AI global market size
Generative AI Market Forecast 2020-2031: $5.5B to $442B
The generative AI segment of the AI market is projected to grow from roughly $5.5 billion in 2020 to $442 billion by 2031 — an 80x expansion. The 2024 market size of $37.87 billion is forecast to rise by $404.2 billion over the 2024-2031 period. GenAI growth rates peak in 2024 (+85%) and taper to ~20% by 2031 as the base gets larger.
Source: Statista Market Insights · 2020-2031
| Year | Market size (billion USD) |
|---|---|
| 2020 | $5.51B |
| 2021 | $8B |
| 2022 | $12B |
| 2023 | $20B |
| 2024 | $37.87B |
| 2025 | $67B |
| 2026 | $108B |
| 2027 | $161B |
| 2028 | $224B |
| 2029 | $294B |
| 2030 | $367B |
| 2031 | $442.07B |
- 2026 GenAI market hits $108B — more than 3x the 2024 actual of $37.87B
- GenAI grows 80x between 2020 and 2031 — fastest sub-segment in the AI dossier
- Peak growth year is 2024 at +85%; by 2031 growth decelerates to ~20% as the base scales
The generative AI segment was $37.87B in 2024 — up from a baseline of just $5.51B in 2020. Statista forecasts it will reach $441.6B by 2031, adding $404.2 billion over the next seven years. Of all six AI segments tracked in the dossier, generative AI has the highest absolute dollar growth (+$404B) and the highest percentage growth (+1,067% from 2024 to 2031). It's the segment that didn't exist commercially before 2020 and will be the largest absolute contributor to overall AI market growth by the end of the forecast period.
Generative AI growth rate
Generative AI Market Growth 2021-2031: 85% Peak in 2024, 20% by 2031
The global generative AI market grew 85% year-over-year in 2024 — the highest single-year growth rate for any segment in the Statista AI dossier — and is forecast to decelerate to 20.09% by 2031, according to Statista Market Insights. Generative AI is the only AI segment with no contraction year in the eleven-year series; the lack of a 2022 dip reflects that GenAI revenue was almost zero before ChatGPT's November 2022 launch. The 64.91-percentage-point forecast deceleration is the steepest in the dossier — but the segment is still growing 20% annually from a $442 billion base by 2031.
Source: Statista Market Insights · 2021-2031
| Year | Year-over-year change (%) |
|---|---|
| 2021 | 39.69% |
| 2022 | 56.7% |
| 2023 | 70% |
| 2024 | 85% |
| 2025 | 76.9% |
| 2026 | 61.2% |
| 2027 | 49.1% |
| 2028 | 39.1% |
| 2029 | 31.3% |
| 2030 | 24.8% |
| 2031 | 20.09% |
- Only AI segment with no contraction year — monotonically positive across the entire series
- 85% growth in 2024 is the highest single-year rate of any segment in the dossier
- Forecast deceleration of 64.91 percentage points by 2031 — steepest of any segment, but from the highest base
Unlike every other segment, generative AI's growth chart is monotonically positive across every year — there's no 2022 contraction. Growth peaks at 85% in 2024 (the highest single-year growth rate of any segment in any year of the forecast), then tapers gradually: 77% in 2025, 61% in 2026, 49% in 2027, and so on down to 20% in 2031. The lack of a 2022 dip reflects that GenAI revenue was almost zero before ChatGPT's November 2022 launch — the segment essentially started from a clean baseline at exactly the moment other AI segments were contracting.
Generative AI in the United States
US Generative AI Market 2020-2031: $12.26B in 2024 to $143B Forecast
The United States generative AI market reached $12.26 billion in 2024 and is forecast to grow to $143.15 billion by 2031, according to Statista Market Insights — an 11.7x expansion adding $130.89 billion over seven years. The US accounts for roughly 32-33% of global generative AI revenue across the forecast period, neither growing nor shrinking its share of the worldwide market. By 2031, the US GenAI market alone will be more than twice the size of the entire global GenAI market in 2025.
Source: Statista Market Insights · 2020-2031
| Year | U.S. GenAI market size (USD billions) |
|---|---|
| 2020 | $1.78B |
| 2021 | $2.5B |
| 2022 | $4B |
| 2023 | $7B |
| 2024 | $12.26B |
| 2025 | $21.6B |
| 2026 | $34.7B |
| 2027 | $52.4B |
| 2028 | $72.9B |
| 2029 | $95.4B |
| 2030 | $119.6B |
| 2031 | $143.15B |
- U.S. share of global GenAI revenue holds steady at 32-33% across the forecast
- $130.89B added between 2024 and 2031 — second-largest absolute market behind global aggregate
- U.S. GenAI revenue at the 2020 baseline ($1.78B) was barely a rounding error — now a $12B segment
The US generative AI market was $12.26 billion in 2024 — roughly one-third of the global $37.87B. Statista forecasts it will reach ~$143B by 2031, a +$130.89B expansion. The US trajectory mirrors the global one almost exactly in shape, but the absolute floor is lower (the segment started at just $1.78B in 2020). The US share of global generative AI revenue stays in the 32–33% range across the forecast period — not growing, not shrinking, just keeping pace with global growth.
Generative AI in Europe
Europe Generative AI Market 2020-2031: $11.77B in 2024 to $137B Forecast
Europe's generative AI market reached $11.77 billion in 2024 and is forecast to grow to $137.28 billion by 2031, according to Statista Market Insights — adding $125.51 billion over seven years. Europe runs essentially parallel to the United States at near-identical absolute dollar levels: Europe $11.77B vs. US $12.26B in 2024, Europe $137B vs. US $143B in 2031. Europe holds roughly 31% of the global generative AI market versus 32% for the US — the 'EU is behind on AI' narrative does not show up in this revenue dataset.
Source: Statista Market Insights · 2020-2031
| Year | European GenAI market size (USD billions) |
|---|---|
| 2020 | $1.71B |
| 2021 | $2.4B |
| 2022 | $3.6B |
| 2023 | $6.4B |
| 2024 | $11.77B |
| 2025 | $20.6B |
| 2026 | $33.3B |
| 2027 | $50.3B |
| 2028 | $70B |
| 2029 | $91.6B |
| 2030 | $114B |
| 2031 | $137.28B |
- Europe-U.S. GenAI market parity — $11.77B vs $12.26B in 2024, $137B vs $143B by 2031
- Europe holds ~31% of global GenAI revenue versus U.S. ~32% — the 'EU is behind on AI' narrative does not show up in revenue data
- $125.51B of new market value added between 2024 and 2031
Europe's generative AI market was $11.77B in 2024, almost exactly matching the US figure ($12.26B). The forecast adds $125.51B through 2031 to reach ~$138B — slightly below the US trajectory but closer than most observers would expect. The European generative AI market is roughly 31% of the global market in 2024 versus 32% for the US — Europe and the US are running essentially parallel growth curves at near-identical absolute dollar levels. The "EU is behind on AI" narrative does not show up in this revenue dataset; if anything, the gap is shrinking marginally over the forecast horizon.
How TechnologyChecker.io's detection data complements Statista's forecasts
Statista's AI dossier measures one thing extremely well: projected revenue. It tells you how big the market will get, but not where the technology is actually showing up today. That's the gap our first-party detection data fills.
We crawl 29.9M active domains monthly — out of a 50M-domain detection database that includes 10.1M domains we've flagged dead over years of crawling — and detect 40,000+ technologies including AI vendors, chatbot platforms, embedded ML APIs, and the broader stack components that ship alongside AI. Three things this view adds to the Statista forecasts above:
Live deployment signals run ahead of revenue
In the sites we monitor, ChatGPT integration signals (API calls, embedded widgets, OpenAI SDK references) have increased roughly 3× since January 2025. That detection-rate acceleration is one signal that the 85% growth Statista models for the GenAI segment in 2024 was not a one-time spike — it shows up in our deployment data and continued into 2025-2026. Revenue projections lag deployment signals by 6-18 months because vendors recognize revenue on contracts, not on integration events.
Vertical distribution differs from headline industry adoption surveys
The WEF/Qualtrics chart above shows tech and telecom employers leading at 66% on "AI as a core skill." Our detection data on commercial AI integration shows a different vertical leaderboard: travel and hospitality at 18% adoption, retail and CPG at 16%, IT at 14%, health and lifestyle at 13%, and food at 13%. Travel/hospitality leads in real-world deployment because those teams ship customer-facing chatbots and content translation at scale — exactly where consumer-grade AI saves the most time. The skill-demand survey and the actual-deployment data are measuring different stages of the same trend.
Cross-cuts only first-party data can produce
Statista publishes the forecast; we publish what runs alongside it. From our monthly crawl we can answer questions Statista can't — "which countries have the highest commercial ChatGPT footprint?" (US, UK, Germany, Canada, France, Spain, Australia — in that order), "how does Perplexity's deployment footprint compare to ChatGPT's at the company level?" (see our Perplexity technology profile), or "which adjacent tech stack components correlate with AI vendor adoption?" These are operational questions for GTM teams, investors, and product strategists that revenue forecasts can't address.
For deeper cuts on the AI deployment side of this picture, our AI Adoption Trends & Data Insights report layers Cloudflare Radar bot-traffic data, DNS query patterns, and TLD shifts against the same Statista revenue model — measuring AI's infrastructure footprint, not just its dollar value. Our ChatGPT Statistics 2026 report tracks the single largest GenAI vendor through both lenses: 900M weekly active users (consumer side) + the commercial domain-level detection signal that runs alongside it.
Five strategic takeaways from the 2026 AI dossier
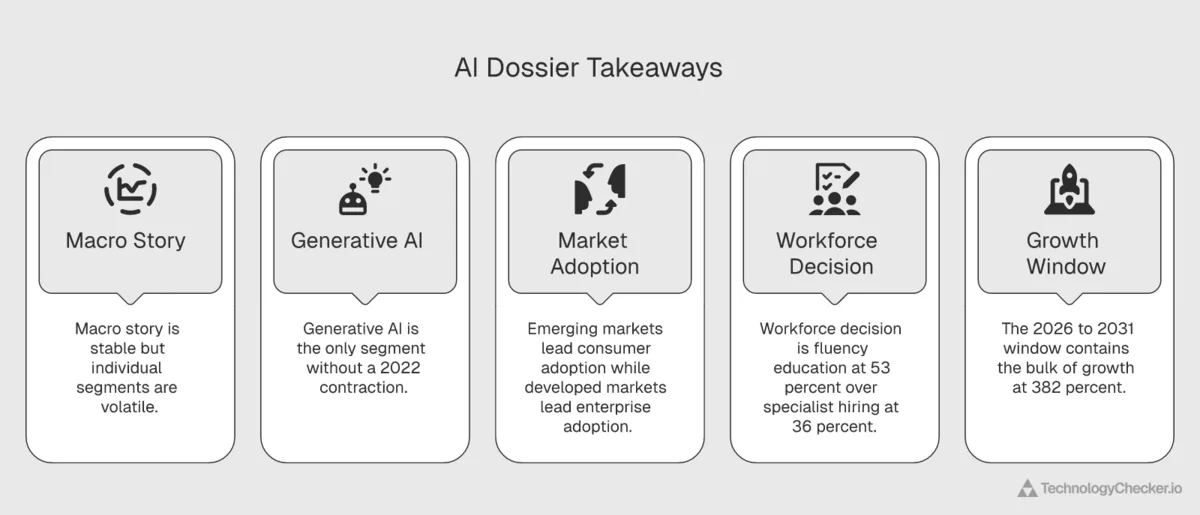
Five patterns stand out from reading all 26 charts in sequence.
1. The macro story is more stable than the micro story. Headline AI market growth tapers gently from 35% to 23% over the forecast horizon. But every individual segment has wild swings — NLP grew 75% in one year, autonomous tech contracted 45% in another. Build forecasts on segment-level data, not the aggregate.
2. Generative AI is the only segment without a 2022 dip. Every other AI segment shows contraction in 2022 from the ZIRP correction. GenAI was effectively zero before ChatGPT launched, so it has a cleaner starting line — and the steepest growth trajectory as a result.
3. Emerging markets lead consumer adoption; developed markets lead enterprise adoption. India and Nigeria run 92% consumer AI usage. The US leads government readiness. Europe leads enterprise AI deployment at 91%. There's no single "AI winner" geography — the leaderboards depend entirely on what you're measuring.
4. The workforce question is settled, but execution is not. 53% of leaders are prioritizing whole-workforce AI fluency education, not specialized hiring. Yet the Americas still rank shortage of skilled staff as their #1 barrier to agentic AI in production. The skill gap is changing shape, not closing.
5. The 2026–2031 window contains the bulk of the growth. Statista attributes +382.65% of total AI market growth specifically to this five-year window. We are at the start of that window now. The forecast charts are not extrapolating from a peak — they're extrapolating from a base that's still well below the model's midpoint.
One more thing — how much to trust the 2031 number. Long-range forecasts in fast-moving tech categories have a poor historical track record. The Statista series in this report is built on a 2020-baseline view of AI: that view did not predict ChatGPT, did not predict generative AI going from near-zero to $37.87B in four years, and did not predict AI startups capturing 53% of new unicorn births by 2025. If 2020-era forecasts missed the GenAI inflection that completely, the prior on any 2026-era forecast being precisely right about 2031 should be modest. Read the $1.675T headline as AI is on a clear multi-trillion-dollar trajectory — not as AI will be worth exactly $1.675 trillion in 2031. The directional certainty is high; the decimal-point precision is not.
Frequently asked questions
How big is the global AI market in 2026?
The global artificial intelligence market is forecast to reach $347.05 billion in 2026, according to Statista Market Insights — a 36% increase from $254.5 billion in 2025. The market is on a trajectory to hit $1.675 trillion by 2031, with the bulk of forecast growth ($1.3 trillion) concentrated in the 2026–2031 window.
What is the projected AI market size by 2031?
Statista Market Insights forecasts the global AI market will reach $1.675 trillion by 2031, a 17.7× expansion from the 2020 baseline of $94.81 billion. The forecast represents a +382.65% expansion specifically in the 2026–2031 window, with annual growth rates stabilizing in a 23–35% band from 2024 onward.
Which AI segment will be largest by 2031?
Machine learning is forecast to be the largest AI segment by 2031 at approximately $568 billion, ahead of generative AI ($442 billion), natural language processing ($201 billion), AI robotics ($94 billion), computer vision ($72 billion), and autonomous & sensor technology ($69 billion). Machine learning's 2024 baseline of $77.13 billion expands by $491 billion across the seven-year forecast.
How fast is generative AI growing?
The global generative AI market grew 85% year-over-year in 2024 — the single highest growth rate of any AI segment in any year of the Statista dossier. The segment is forecast to expand from $37.87 billion in 2024 to $441.6 billion by 2031, a +1,067% trajectory. Generative AI is the only AI segment with no 2022 contraction year, because its commercial revenue base began near zero before ChatGPT's November 2022 launch.
What percentage of companies use AI in 2025?
88% of organizations worldwide used artificial intelligence in at least one business function in 2025, according to McKinsey & Company and Stanford University's State of AI survey — up from 78% in 2024 and 55% in 2023. Europe leads regions at 91% adoption, followed by North America at 90% and Greater China at 88%.
Which country uses AI the most?
India and Nigeria tie for the world's highest consumer AI usage rate at 92%, according to a 2025 KPMG–University of Melbourne survey of 48,000 respondents. The UAE (91%), Egypt (90%), and China (89%) round out the top five. Emerging economies dominate the top of the list; Singapore at 73% is the highest-ranked advanced economy and the lowest of the 14 countries tracked.
Which country leads on government AI readiness?
The United States leads the 2025 Government AI Readiness Index at 87.2/100, followed by the United Kingdom (77.64), France (77.27), the Netherlands (75.57), and China (75.55), according to Oxford Insights and the International Development Research Centre. The US lead of nearly 10 points over #2 is the largest gap anywhere in the top 15 countries.
How are companies adjusting their workforce for AI?
53% of senior AI leaders worldwide cite educating a broader workforce for AI fluency as their #1 talent strategy adjustment in 2025, according to a Deloitte survey of 3,235 IT and line-of-business leaders. Reskilling and upskilling strategies rank second at 48%. Together, those two whole-workforce education priorities outrank targeted strategies like hiring specialized AI talent (36%) by 12–17 percentage points — organizations have decided AI is a fluency problem, not a specialist-team problem.
Are US and Europe really at parity on generative AI?
Yes, on a revenue basis. The US generative AI market was $12.26 billion in 2024 versus Europe's $11.77 billion — a difference of less than 5%. Statista forecasts the US will reach $143 billion by 2031 versus Europe's $137 billion. The US holds roughly 32% of global GenAI revenue versus Europe's 31% — essentially parallel growth curves. The narrative that "the EU is behind on AI" does not show up in this revenue dataset.
About the data
This report draws exclusively from Statista's Artificial Intelligence (AI) dossier (study ID 38609), published in the Digital & Trends category in 2026. The dossier covers five chapters — Overview, Regional Overview, Segments, Impact of AI, and Special Focus: Generative AI — across 33 pages with 26 distinct charts.
Data collection methodology: All 26 charts in this article were extracted from the source PDF and re-rendered as interactive Recharts visualizations on TechnologyChecker.io. The underlying values, descriptions, and source attributions are preserved unchanged from the Statista publication. For forecast charts (2020–2031 series), the data comes from Statista's in-house Market Insights model. For survey-based charts (talent strategy, consumer AI usage, faculty views, agentic AI barriers, employer skill demand), the data comes from the original publisher's primary research, with sample sizes and field dates noted under each chart.
Source attribution chain: every chart in this report is double-cited — once to Statista as the aggregator, and once to the underlying research provider. The third-party sources contributing data to the dossier include:
- CB Insights — unicorn births data (
AI Share of New Unicorns 2015-2025) - Oxford Insights & International Development Research Centre — Government AI Readiness Index
- Tortoise Media — Global AI Strategy Index
- KPMG International & The University of Melbourne — consumer AI usage survey (48,000 respondents, 2025)
- McKinsey & Company; Stanford University — State of AI organizational adoption survey
- Dynatrace & Qualtrics — agentic AI barriers survey (919 respondents, Nov–Dec 2025)
- Qualtrics & World Economic Forum — Future of Jobs employer skills survey (1,000 respondents, May–Sep 2024)
- Deloitte — AI leader talent strategy survey (3,235 respondents, Aug–Sep 2025)
- Digital Education Council — faculty views on AI in education (1,681 respondents, 52 institutions, 28 countries, 2025)
Definitions used in this report:
- AI market size: total revenue across all AI segments (ML, computer vision, NLP, robotics, autonomous & sensor technology, generative AI), measured in USD.
- Generative AI: AI systems capable of producing novel text, image, audio, or video content from prompts. Distinguished from classical AI (ML, NLP, CV) by its content-generation focus.
- Agentic AI: AI systems that act autonomously over multi-step workflows, often involving tool use, planning, and reasoning across long contexts. Distinguished from generative AI by its autonomy and tool-execution capability.
- Government AI readiness: a composite index measuring a government's capacity to implement AI within public services (healthcare, education, transportation, administration).
- AI government strategy score: a composite index measuring the documented ambition of national AI strategies, distinct from execution readiness.
Disclosure. TechnologyChecker.io operates a commercial technology-detection product, including AI-vendor detection data. That gives us a business interest in AI looking large, growing, and strategically important — readers should weight the framing in this report accordingly. We've tried to keep the analysis honest by reporting Statista's numbers as published (including the 2022 anomaly flagged above), by adding a forecast-confidence caveat next to the 2031 headline, and by double-citing every chart back to its underlying primary source. But if you're using this report to inform a buying, investing, or hiring decision, treat our commentary as informed-but-incentivized and triangulate the underlying Statista, McKinsey, CB Insights, and KPMG primary sources directly.
Methodology and sources
All charts in this report are sourced from Statista's Artificial Intelligence (AI) dossier (Digital & Trends category, study ID 38609), published 2026. The dossier aggregates data from Statista Market Insights (Statista's in-house forecast model) and the following third-party sources:
- CB Insights — unicorn births data
- Oxford Insights & International Development Research Centre — Government AI Readiness Index
- Tortoise Media — Global AI Strategy Index
- KPMG International & The University of Melbourne — consumer AI usage survey (48,000 respondents, 2025)
- McKinsey & Company; Stanford University — State of AI organizational adoption survey
- Dynatrace & Qualtrics — agentic AI barriers survey (919 respondents, Nov–Dec 2025)
- Qualtrics & World Economic Forum — Future of Jobs employer skills survey (1,000 respondents)
- Deloitte — AI leader talent strategy survey (3,235 respondents, Aug–Sep 2025)
- Digital Education Council — faculty views on AI in education (1,681 respondents, 52 institutions, 28 countries)
Forecast values (2025–2031) are produced by Statista's Market Insights model. Survey data uses the original publisher's methodology, with sample sizes noted next to each chart above. For deeper analysis of any individual chart, the "Read more" links in the source PDF resolve to the live interactive Statista page for each data series.
If you want to ground these forecasts in real-world usage data, TechnologyChecker.io tracks adoption signals across 40,000+ technologies and 29.9M active domains scanned monthly — including individual product profiles for OpenAI ChatGPT and Perplexity (the two AI vendors we currently track at the product-profile level). Our detection data tells you not just what the AI market is forecast to be worth, but where AI is actually being integrated right now, by vertical, by country, and by adjacent stack component.
About the author
This report was researched and written by Emma Davies, Data Analyst at TechnologyChecker.io. Emma specializes in technology adoption pattern recognition, technographic trend research, and turning raw detection data into prospect intelligence. With 5 years of experience analyzing technology adoption across millions of domains, she focuses on cross-referencing third-party market research against TechnologyChecker.io's first-party tech-stack detection data — including the live AI vendor footprint that underpins the segment-level forecasts described above. Read more of Emma's work at emmadavies.uk or in Emma's author archive on TechnologyChecker.io.
Related reading
- ChatGPT Statistics 2026: 900M Users, $25B ARR — the single largest GenAI product, with live Cloudflare crawl data and TechnologyChecker.io's vertical-by-vertical detection breakdown
- Claude Statistics & Anthropic Growth Insights — competitive context for the GenAI segment, ARR trajectory $1B → $14B → $30B
- AI Adoption Trends & Data Insights — our infrastructure-level companion to this revenue dataset: Cloudflare Radar bot traffic, DNS query patterns, AI domain rush, training-purpose crawl shifts
- OpenAI ChatGPT technology profile — country and industry breakdown of commercial ChatGPT detection across our 29.9M active-domain monthly crawl
- Perplexity technology profile — competitive AI-search vendor tracked across the same crawl
Emma Davies
Data Analyst

