Social Media Advertising Insights 2026: 35 Stats, Plus 2M Live Ad Pixels
We tracked 2M+ live ad pixels and mapped them against $480B in projected spend. 35 stats on social media advertising ROI, engagement, and real platform traffic in 2026.
Published •Updated •18 min read

Global social media advertising spending is on track to reach $275.98 billion in 2025 and $480 billion by 2030, while the number of social media users has already passed 5.4 billion worldwide. Facebook is still the platform marketers rate most important (36%) and highest for ROI (54%), even as TikTok posts engagement rates roughly eight times Instagram's. We also ran the survey data against our own crawl of the open web: Meta's ad pixel now sits on 2.06 million live sites, and real traffic rankings expose where audience attention runs well ahead of where ad budgets currently sit.
Key findings:
- $480.07 billion projected global social media ad spend by 2030, up from less than $93 billion in 2019, a 5.2x increase (Statista Market Insights)
- 5.45 billion social media users in 2025, forecast to reach 6.6 billion by 2030 (Statista Market Insights)
- Facebook is named the most important platform by 36% of marketers and the highest-ROI platform by 54% (Social Media Examiner; HubSpot)
- Meta generated $196 billion in advertising revenue in 2025, up 22.1% year over year (Meta Platforms)
- TikTok leads engagement at a 3.7% rate per follower, about 8x Instagram's 0.48% (Socialinsider)
- Connected TV tops 2026 budget plans with a net +82% of marketers raising spend (Ebiquity; WFA)
- Social media ad CPM peaked at $5.48 in Q4 2024 before easing to $4.37 in Q1 2025 (Skai)
Each chart and table below names its original primary source, including Meta, Alphabet, Kantar, HubSpot, Social Media Examiner, Socialinsider, and Skai. The modeled market and per-user forecasts come from Statista Market Insights, and the consumer purchase-influence survey from Statista Consumer Insights. You can browse every visual in our interactive charts library.
The state of social media advertising in 2026
Social media advertising has gone from a roughly $93 billion line item in 2019 to a projected $276 billion in 2025, and the curve does not flatten. Statista Market Insights models the market reaching $480 billion by 2030, growth of almost 74% over five years.
Social Media Ad Spend Worldwide 2019-2030: $93B to a Forecast $480B
Global social media advertising spending is projected to reach approximately 275.98 billion U.S. dollars in 2025, up from less than 93 billion U.S. dollars in 2019 - a near-200% increase in just over half a decade. Spending is expected to keep rising, growing by almost 74 percent through 2030 to reach roughly 480 billion U.S. dollars.
Source: Statista Market Insights · 2019-2030
| Year | Social media ad spend (USD billions) |
|---|---|
| 2019 | $92.99B |
| 2020 | $124.95B |
| 2021 | $164.78B |
| 2022 | $173.3B |
| 2023 | $201.41B |
| 2024 | $237.42B |
| 2025 | $275.98B |
| 2026 | $317.33B |
| 2027 | $357.37B |
| 2028 | $398.48B |
| 2029 | $439.72B |
| 2030 | $480.07B |
- Spending more than doubled from $93B in 2019 to a projected $276B in 2025
- Forecast to reach $480B by 2030 - a 5.2x increase across the period
- Growth of almost 74% expected between 2025 and 2030 alone
More advertisers explain only part of that climb. The bigger driver is rising value per user. Average ad spending per internet user (ARPU) in the social media segment nearly tripled from $15.82 in 2017 to a modeled $42.77 in 2024, and is forecast to hit $60.90 by 2030.
Social Media Ad ARPU Worldwide 2017-2030: $15.82 to $60.90 per User
The average ad spending per internet user in the 'Social Media Advertising' segment of the advertising market worldwide was modeled to stand at 42.77 U.S. dollars in 2024. Between 2017 and 2024, average ad spending per internet user rose by 26.95 U.S. dollars, though the increase followed an uneven trajectory rather than a consistent upward trend. Average ad spending per internet user is set to rise by a further 18.13 U.S. dollars over the period from 2024 to 2030.
Source: Statista Market Insights · 2017-2030
| Year | Average revenue per user (USD) |
|---|---|
| 2017 | $15.82 |
| 2018 | $21 |
| 2019 | $25.1 |
| 2020 | $30.5 |
| 2021 | $39.1 |
| 2022 | $38.5 |
| 2023 | $39.8 |
| 2024 | $42.77 |
| 2025 | $45.9 |
| 2026 | $49 |
| 2027 | $52.1 |
| 2028 | $55.3 |
| 2029 | $58.4 |
| 2030 | $60.9 |
- ARPU nearly tripled from $15.82 in 2017 to a modeled $42.77 in 2024
- Projected to reach $60.90 per internet user by 2030
- Growth has been uneven - 2022 dipped below 2021 before resuming the climb
Where is that money going next? When marketers were surveyed in November 2025 about their 2026 budgets, connected TV (CTV) and retail media led on net intent to increase, while paid social held a strong mid-table position at a net +56%. Only digital display showed a net decline.
Where Marketers Are Moving 2026 Ad Budgets: CTV Leads at +82% Net
During a survey among marketers worldwide published at the end of 2025, a net percentage of 82 percent of respondents anticipated a rise in connected TV (CTV) advertising budgets for 2026. Retail media and digital video followed, with net shares of 78 and 68 percent respectively. The only ad channel with a negative net share was digital display, at -18 percent.
Source: Ebiquity; World Federation of Advertisers · 2026
| Advertising channel | Net share of marketers raising budgets |
|---|---|
| Connected TV (CTV) | 82% |
| Retail media | 78% |
| Digital video | 68% |
| Influencer marketing | 58% |
| Paid social | 56% |
| Digital out-of-home | 52% |
| Gaming/eSports | 28% |
| Paid search | 10% |
| Mobile in-app | 3% |
| Digital display | -18% |
- Connected TV tops the list with a net +82% of marketers raising budgets
- Paid social sits mid-pack at +56% net, ahead of paid search (+10%)
- Digital display is the only channel in net decline at -18%
Which platforms marketers rate most important
Despite years of newer entrants, Facebook remains the platform marketers single out as most important, though Instagram and LinkedIn are now effectively tied behind it.
Most Important Social Media Platform for Marketers 2026: Facebook at 36%
During a 2026 survey among marketers worldwide, approximately 36 percent said Facebook was the most important social media platform. Instagram and LinkedIn followed, named by 27 and 26 percent of respondents respectively, while YouTube, TikTok, and X/Twitter trailed well behind.
Source: Social Media Examiner · 2026
| Platform | Share of marketers |
|---|---|
| 36% | |
| 27% | |
| 26% | |
| YouTube | 7% |
| TikTok | 2% |
| X/Twitter | 1% |
- Facebook remains the single most important platform for 36% of marketers
- Instagram (27%) and LinkedIn (26%) are effectively tied for second
- TikTok is named most important by just 2% despite its reach
That headline hides a sharp split by audience type. Break the same survey into business-to-consumer (B2C) and business-to-business (B2B) marketers and LinkedIn vaults from a 10% share among B2C marketers to 51% among B2B marketers, while Facebook does the reverse.
B2C vs B2B Platform Priorities 2026: Facebook Leads B2C, LinkedIn B2B
During a 2026 global survey, approximately 46 percent of responding business-to-consumer (B2C) marketers said Facebook was the most important social media platform. Among business-to-business (B2B) professionals, LinkedIn ranked first, selected by 51 percent. The split shows how audience type reshapes platform strategy: LinkedIn jumps from 10% among B2C marketers to 51% among B2B marketers.
Source: Social Media Examiner · 2026
| Platform | Share of marketers |
|---|---|
| 46% | |
| 33% | |
| 10% | |
| YouTube | 9% |
| TikTok | 2% |
| X/Twitter | 0% |
- LinkedIn is most important for 51% of B2B marketers vs just 10% of B2C
- Facebook leads B2C at 46% but drops to 23% for B2B
- Instagram skews consumer: 33% B2C vs 19% B2B
The trends marketers are watching
Generative AI tops the list of consumer trends marketers say they are tracking for 2026, ahead of CTV/streaming and short-form social video. That focus tracks the broader AI market size and growth now rewiring every software category.
| Consumer trend (2026) | Share of marketers |
|---|---|
| Generative AI | 70% |
| CTV/streaming | 63% |
| TikTok/social video | 43% |
| Consumer privacy | 28% |
| E-commerce everywhere | 27% |
| Political & advocacy trends | 18% |
| Sustainability/carbon impact | 17% |
| Gaming | 13% |
| Metaverse | 12% |
Source: Mediaocean; TechValidate. Worldwide; November 2025; 320 respondents.
Social advertising in the age of AI
Generative AI has moved past the watch-list. It already shapes how social campaigns get made and measured. AI usage among marketers has climbed more than 180% as teams lean on it for creative production and targeting, according to Strike Social. That shift dovetails with where attention is heading: short-form video delivers the highest ROI of any video format (41%), and 94% of organizations say influencer marketing outperforms traditional digital advertising, per Sprout Social. For the wider stack of tools powering this shift, see our marketing technology statistics breakdown.
Commerce is collapsing into the feed, too. Around 26% of marketers plan to sell products directly on social platforms in 2026, including Instagram shops, according to HubSpot's State of Marketing report. That shift ties social advertising ever more tightly to the broader e-commerce marketplace market share picture.
Who leads the market: platforms, brands, and revenue
Social media and streaming brands dominate the most valuable media properties worldwide. Google leads with a brand value of $840 billion, larger than the next three brands combined, and seven of the top ten are social platforms.
Most Valuable Media & Entertainment Brands 2025: Google Leads at $840B
In 2025, Google ranked as the most valuable media and entertainment brand worldwide, with a brand value of 840 billion U.S. dollars. Facebook ranked second, valued at around 300.7 billion dollars. Even though the media and entertainment category includes traditional media such as TV and newspapers, social media and streaming services dominate the top 10 of most valuable brands.
Source: Kantar · 2025
| Brand | Brand value (USD billions) |
|---|---|
| $840.25B | |
| $300.66B | |
| $228.95B | |
| Netflix | $115.27B |
| YouTube | $89.11B |
| $76.64B | |
| TikTok | $75.67B |
| $75.57B | |
| Disney | $48.67B |
| Spotify | $29.69B |
- Google's $840B brand value is larger than the next three brands combined
- Seven of the top 10 most valuable media brands are social platforms
- Instagram ($229B) now out-values Netflix, YouTube, and Disney
Growth, rather than absolute value, tells a different story. In 2025 the fastest-growing brands worldwide were led by AI and hardware names, but Instagram (+101%) and Facebook (+80%) both appear in the top ten.
| Brand | Brand value change (2025 vs 2024) |
|---|---|
| Nvidia | +152% |
| Huawei | +142% |
| VMware | +119% |
| Xiaomi | +103% |
| +101% | |
| +80% | |
| Walmart | +72% |
| Costco | +67% |
| SAP | +66% |
| American Express | +66% |
Source: Kantar. Worldwide; 2025.
Return on investment by platform
Brand value is one thing; what marketers actually get back is another. In a September 2025 survey, Facebook was named among the highest-ROI platforms by 54% of marketers, with Instagram second. Meta's two flagship apps take the top two ROI spots.
Highest-ROI Social Media Platforms 2025: Facebook Tops at 54% of Marketers
During a September 2025 survey among marketers in North America, Europe, Asia, and Australia, over half of respondents included Facebook among the social media platforms delivering the highest return on investment (ROI). Instagram and YouTube followed, mentioned by 43 and 33 percent of participants respectively.
Source: HubSpot · 2025
| Platform | Share of marketers |
|---|---|
| 54% | |
| 43% | |
| YouTube | 33% |
| X (Twitter) | 24% |
| TikTok | 19% |
- Facebook is cited for highest ROI by 54% of marketers - the clear leader
- Meta's two platforms (Facebook + Instagram) take the top two ROI spots
- TikTok lands last at 19% despite strong engagement metrics
The revenue engines behind the platforms
Advertising is the overwhelming majority of Meta's business. Its ad revenue grew from under $1 billion in 2009 to $196 billion in 2025, a 257x increase, with 2022 the only down year in the entire run.
Meta Advertising Revenue 2009-2025: $0.76B to $196B Worldwide
Advertising accounts for the vast majority of Meta's revenue. In 2025, it generated over 196 billion U.S. dollars in advertising revenue, representing a 22.1 percent increase compared with the previous year. Meta's ad business has grown from under one billion dollars in 2009 to nearly 200 billion in 2025.
Source: Meta Platforms · 2009-2025
| Year | Meta advertising revenue (USD billions) |
|---|---|
| 2009 | $0.76B |
| 2010 | $1.87B |
| 2011 | $3.15B |
| 2012 | $4.28B |
| 2013 | $6.99B |
| 2014 | $11.49B |
| 2015 | $17.08B |
| 2016 | $26.89B |
| 2017 | $39.94B |
| 2018 | $55.01B |
| 2019 | $69.66B |
| 2020 | $84.17B |
| 2021 | $114.93B |
| 2022 | $113.64B |
| 2023 | $131.95B |
| 2024 | $160.63B |
| 2025 | $196.18B |
- Meta's ad revenue grew from $0.76B in 2009 to $196B in 2025 - a 257x increase
- 2025 ad revenue rose 22.1% year over year, the fastest jump since 2021
- 2022 was the only down year in the entire 16-year run
YouTube has built a parallel, if smaller, advertising machine for Alphabet, crossing $40 billion in ad revenue for the first time in 2025.
YouTube Advertising Revenue 2017-2025: $8.2B to $40.4B Worldwide
In 2025, YouTube's global advertising revenues amounted to 40.37 billion U.S. dollars, up from 36.15 billion in the preceding fiscal period. While the video platform does not generate as much revenue as Google's key segment, Search, it remains a significant moneymaker for parent company Alphabet.
Source: Alphabet; YouTube · 2017-2025
| Year | YouTube advertising revenue (USD billions) |
|---|---|
| 2017 | $8.15B |
| 2018 | $11.16B |
| 2019 | $15.15B |
| 2020 | $19.77B |
| 2021 | $28.85B |
| 2022 | $29.24B |
| 2023 | $31.51B |
| 2024 | $36.15B |
| 2025 | $40.37B |
- YouTube ad revenue nearly 5x'd from $8.2B in 2017 to $40.4B in 2025
- 2025 crossed the $40B threshold for the first time
- Growth flattened in 2022 ($29.2B) before reaccelerating
Newer entrants are scaling fast off a small base. Reddit's worldwide advertising revenue jumped 216% between 2022 and 2025, surpassing $2 billion:
| Year | Reddit ad revenue (USD millions) |
|---|---|
| 2022 | $652.56M |
| 2023 | $788.78M |
| 2024 | $1,185.46M |
| 2025 | $2,062.48M |
Source: Reddit. Worldwide; 2022 to 2025.
For context on scale, in 2025 Meta Platforms reported total annual revenue above $200 billion (up from $164 billion in 2024), LinkedIn generated over $17 billion, and Snapchat reported roughly $5.9 billion, a reminder of how concentrated the social advertising economy remains.
What the open web shows: pixel deployment and real traffic in 2026
Survey data captures what marketers say; two other 2026 signals capture what they actually do and where audiences actually go. The first comes from our own detection crawl of the open web, which records which advertising and conversion pixels are installed on live websites. The second comes from Cloudflare Radar, which ranks platforms by real DNS and HTTP traffic rather than stated preference. Together they triangulate the survey numbers above with hard behavioral data.
On the supply side (the tracking infrastructure advertisers physically install to measure paid-social campaigns), Meta's dominance is even starker than its revenue suggests. We detect Meta's Facebook Pixel on more than 2.06 million active websites as of June 2026, roughly 8.6% of all sites we crawl and more than every other social ad pixel combined.
![]()
Social Ad Pixel Deployment 2026: Meta's Pixel Sits on 2M+ Websites
TechnologyChecker's detection crawl of the open web finds Meta's Facebook Pixel installed on more than 2.06 million active websites in June 2026 - roughly 8.6 percent of all sites tracked and more than every other social advertising pixel combined. Pinterest's tag is second at around 883,000 sites, while LinkedIn's two tracking tags together reach under 200,000, and X/Twitter and Reddit ad pixels each sit below 25,000 sites. The spread shows how concentrated paid-social measurement infrastructure is around Meta, even as marketers spread their attention across newer platforms.
Source: TechnologyChecker detection data · 2026
| Advertising pixel | Websites with pixel detected |
|---|---|
| Facebook Pixel | 2066299 |
| Pinterest tag | 883066 |
| LinkedIn Insights Tag | 111433 |
| LinkedIn Ads | 83686 |
| Twitter/X Ads | 24173 |
| Reddit Ads | 16935 |
- Meta's Facebook Pixel is on 2.06M sites - more than all other social ad pixels combined
- Pinterest's tag (883K) is the only other pixel above the 100K mark
- LinkedIn, X/Twitter, and Reddit ad pixels together cover under 240K sites
Pinterest's tag is a distant second at about 883,000 sites, and after that the drop is steep: LinkedIn's two tracking tags (LinkedIn Insights Tag plus LinkedIn Ads) together reach under 200,000 sites, while X/Twitter and Reddit ad pixels each sit below 25,000. The pattern reinforces the survey data: advertisers concentrate measurement spend where reach and ROI are proven, and Meta owns that ground by an order of magnitude.
Real audience traffic tells a more competitive story than deployment does. Cloudflare Radar's June 2026 ranking of the most-visited social platforms worldwide puts Facebook and Instagram first and second, matching the marketer surveys. But TikTok ranks third on raw traffic despite only 2% of marketers naming it their most important platform, and Snapchat ranks fourth with almost no marketer mindshare at all.
| Traffic rank (Cloudflare Radar, 30 June 2026) | Platform | Share of marketers naming it most important (2026) |
|---|---|---|
| 1 | 36% | |
| 2 | 27% | |
| 3 | TikTok | 2% |
| 4 | Snapchat | not in top tier |
| 5 | 26% (51% among B2B) | |
| 6 | X / Twitter | 1% |
| 7 | not rated | |
| 8 | not in top tier | |
| 9 | Kwai | regional (LatAm short-form video) |
| 10 | Douyin | China only |
Traffic ranking: Cloudflare Radar, Social Media service category, 30 June 2026. Marketer-importance shares: Social Media Examiner, January 2026, 840 respondents.
That pecking order has barely moved all year. We pulled Cloudflare Radar's weekly rankings back to late December 2025, and the top four held identical positions every single week through the end of June 2026. The only real movement came lower down: Reddit climbed from #9 to #7 and has held there through quarter-end, LinkedIn and X/Twitter traded the #5 and #6 spots week to week, and Discord dropped out of the global top 10 in mid-January. For a category that adds new platforms constantly, the stability at the top is the surprise.
The mismatch between rows 3 and 4 and the survey column is the most useful signal here: TikTok and Snapchat command far more real attention than ad budgets currently reflect. That gap is where early-mover advertisers find under-priced reach before CPMs catch up to the traffic.
Real audience traffic and ad budgets do not line up: TikTok and Snapchat draw attention that current spend underweights — under-priced reach until CPMs catch up.
Usage, effectiveness, and performance metrics
Most-important and most-used are different questions. By raw adoption, Facebook (86%), Instagram (82%), and LinkedIn (72%) are the platforms marketers actually use, with newer surfaces like Threads still in single-to-low-double digits.
| Platform | Share of marketers using it (2026) |
|---|---|
| 86% | |
| 82% | |
| 72% | |
| YouTube | 58% |
| TikTok | 32% |
| X/Twitter | 23% |
| Threads | 13% |
Source: Social Media Examiner. Worldwide; January 2026; 840 respondents.
Looking forward, marketers' intent to expand video is concentrated on YouTube and Instagram, while X/Twitter and Threads see the largest "no plans to use" shares:
| Video platform | Increase | Stay the same | Decrease | No plans to use |
|---|---|---|---|---|
| YouTube | 70% | 18% | 1% | 11% |
| 65% | 23% | 2% | 10% | |
| 52% | 28% | 2% | 17% | |
| 49% | 34% | 5% | 12% | |
| TikTok | 42% | 12% | 2% | 44% |
| X/Twitter | 12% | 17% | 8% | 64% |
| Threads | 12% | 15% | 2% | 71% |
Source: Social Media Examiner. Worldwide; January 2026; 840 respondents.
What marketers get out of social media, and what gets in the way
The benefits marketers report skew toward the top of the funnel: exposure and traffic far outrank direct sales.
Top Benefits of Social Media Marketing 2026: 83% Cite Increased Exposure
During a 2026 survey among marketers worldwide, approximately 83 percent selected increased exposure as a benefit of social media marketing. Increased traffic followed, mentioned by 71 percent of respondents, while 62 percent cited generated leads. Direct sales ranked lowest at 46 percent, underscoring that marketers still value social media most as a top-of-funnel awareness channel.
Source: Social Media Examiner · 2026
| Benefit | Share of marketers |
|---|---|
| Increased exposure | 83% |
| Increased traffic | 71% |
| Generated leads | 62% |
| Developed loyal fans | 57% |
| Improved sales | 46% |
- Increased exposure (83%) is the top-cited benefit by a wide margin
- Lead generation (62%) outranks direct sales (46%)
- Marketers still treat social primarily as an awareness and traffic channel
The challenges are mostly about reach and measurement. Reaching the target audience tops the list, followed by keeping up with content trends and the perennial problem of calculating return on ad spend, a gap many teams now close with marketing automation platforms.
| Advertising challenge (2025) | Share of marketers |
|---|---|
| Ability to reach target audience | 46% |
| Keeping up with content trends | 38% |
| Calculating ROAS/ROI | 33% |
| Managing campaigns across channels | 33% |
| Brand safety/content alignment | 32% |
| Handling feedback/comments | 31% |
| Measuring cross-channel performance | 27% |
| Reporting capabilities/transparency | 24% |
Source: DoubleVerify; Sapio Research. Worldwide; March 2025; 1,970 respondents.
Impressions, engagement, and cost
Ad impression volume actually dipped slightly over the past year. Indexed to Q1 2024, total social ad impressions sat 7% lower by Q1 2025:
| Quarter | Indexed ad impression volume |
|---|---|
| Q1 2024 | 1.00 |
| Q2 2024 | 0.87 |
| Q3 2024 | 0.94 |
| Q4 2024 | 0.93 |
| Q1 2025 | 0.93 |
Source: Skai. Worldwide.
Per post, though, the platforms differ enormously in reach. TikTok averaged nearly 6,500 ad impressions per post in 2025, about 7x Facebook's 913:
| Platform | Avg. ad impressions per post (2025) |
|---|---|
| TikTok | 6,496 |
| 3,403 | |
| X | 2,979 |
| 913 |
Source: Socialinsider. Worldwide; 2025.
That reach advantage shows up in engagement, too. TikTok's average engagement rate per follower is in a different league from the established platforms.
Social Media Engagement Rates 2025: TikTok Dominates at 3.7%
In 2025, TikTok held the highest average engagement rate (ER) based on number of followers: 3.7 percent. Instagram's ER stood at 0.48 percent, whereas Facebook's and X's reached 0.15 and 0.12 percent respectively. TikTok's engagement rate is nearly 8x Instagram's and roughly 25x Facebook's.
Source: Socialinsider · 2025
| Platform | Engagement rate per follower |
|---|---|
| TikTok | 3.7% |
| 0.48% | |
| 0.15% | |
| X (Twitter) | 0.12% |
- TikTok's 3.7% engagement rate is roughly 8x Instagram's 0.48%
- Facebook (0.15%) and X (0.12%) sit far behind on per-follower engagement
- High engagement does not equal high marketer ROI - TikTok ranks last for ROI
Yet engagement does not translate directly into marketer-rated ROI; recall TikTok ranked last for ROI earlier. What advertisers pay for that reach follows a clear seasonal rhythm, peaking each fourth quarter as brands compete for pre-holiday attention.
Social Media Ad CPM 2024-2025: Peaked at $5.48 in Q4 2024
The cost-per-mille of advertising on social media was 5.48 U.S. dollars in the fourth quarter of 2024 - the amount advertisers paid to have their ads viewed by a thousand potential customers. Social media CPM is usually higher in the final quarters of each year, as the surge in costs is prompted by increased demand for advertising space during pre-Christmas spending. CPM eased back to 4.37 dollars in Q1 2025.
Source: Skai · 2024-2025
| Quarter | Cost per mille (USD) |
|---|---|
| Q1 2024 | $4.16 |
| Q2 2024 | $4.29 |
| Q3 2024 | $4.54 |
| Q4 2024 | $5.48 |
| Q1 2025 | $4.37 |
- CPM peaked at $5.48 in Q4 2024 amid pre-holiday demand
- Q1 2025 reset to $4.37, just above the year-earlier $4.16
- The Q4 spike is a recurring seasonal pattern, not a structural rise
The platform scorecard at a glance
Pulling the metrics above into one view shows why no single platform "wins." Facebook leads on perceived importance and ROI, TikTok dominates engagement and per-post reach, and LinkedIn owns B2B. Each platform is strongest on a different axis:
| Platform | Most important (2026) | Highest ROI (2025) | Engagement/follower (2025) | Avg. impressions/post (2025) | Monthly active users (2025) |
|---|---|---|---|---|---|
| 36% | 54% | 0.15% | 913 | 3.07B | |
| 27% | 43% | 0.48% | 3,403 | 3.00B | |
| 26% | — | — | — | — | |
| YouTube | 7% | 33% | — | — | 2.58B |
| TikTok | 2% | 19% | 3.7% | 6,496 | 1.99B |
| X/Twitter | 1% | 24% | 0.12% | 2,979 | 0.56B |
Sources: Social Media Examiner, HubSpot, Socialinsider, and DataReportal/Meltwater/We Are Social,. A dash means the platform was not measured in that survey. See each chart above for full methodology.
How consumers use social media

None of this works without an audience, and the audience keeps growing. Social media surpassed 5.4 billion users in 2025, more than double the 2017 figure, and is projected to reach 6.6 billion by 2030.
Social Media Users Worldwide 2017-2030: 2.6B to a Forecast 6.6B
Social media usage is one of the most popular online activities. In 2025, over 5.4 billion people were estimated to be using social media worldwide, a number projected to increase to over 6.6 billion in 2030. The user base has more than doubled since 2017, when roughly 2.6 billion people used social platforms.
Source: Statista · 2017-2030
| Year | Social media users (billions) |
|---|---|
| 2017 | 2.58B |
| 2018 | 2.92B |
| 2019 | 3.3B |
| 2020 | 3.8B |
| 2021 | 4.11B |
| 2022 | 4.43B |
| 2023 | 4.76B |
| 2024 | 5.12B |
| 2025 | 5.45B |
| 2026 | 5.78B |
| 2027 | 6.03B |
| 2028 | 6.26B |
| 2029 | 6.45B |
| 2030 | 6.6B |
- Social media users surpassed 5.4 billion in 2025
- The base more than doubled from 2.6B (2017) in under a decade
- Forecast to reach 6.6 billion by 2030 - over 75% of projected global population
That audience is concentrated on a handful of platforms, four of which Meta owns. Facebook leads with 3.07 billion monthly active users, with WhatsApp and Instagram close behind.
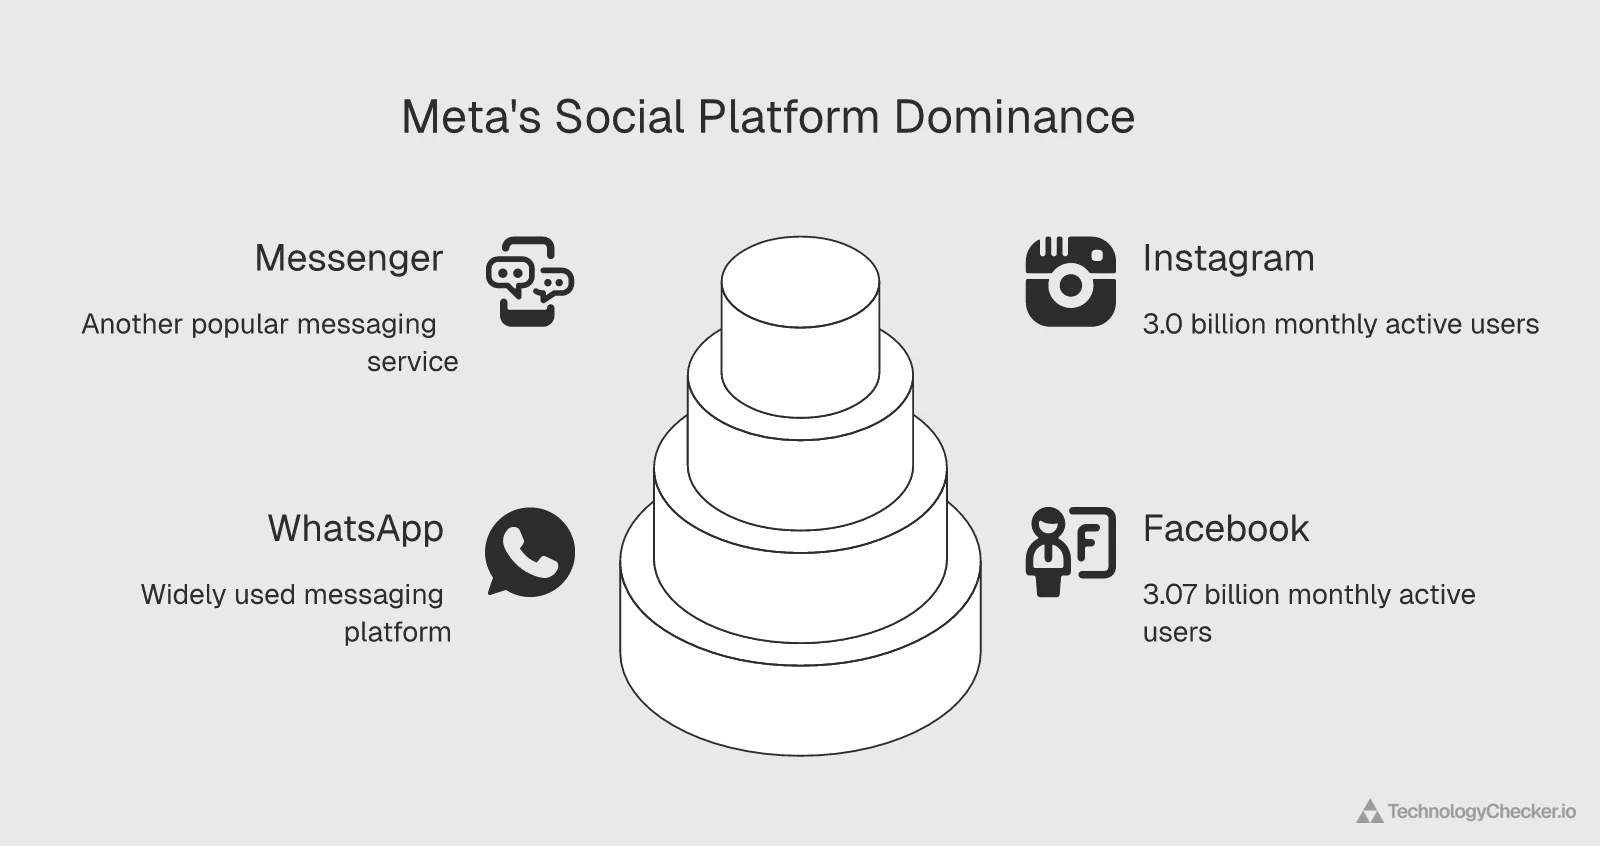
Four of the most-used social and messaging platforms — Facebook, WhatsApp, Instagram, and Messenger — all belong to Meta, the structural base under its $196 billion ad business.
Most Used Social Networks 2025: Facebook Leads With 3.07B Users
Market leader Facebook was the first social network to surpass one billion registered accounts and currently sits at more than three billion monthly active users. Meta Platforms owns four of the biggest social media platforms - Facebook, WhatsApp, Messenger, and Instagram - all with more than one billion monthly active users each.
Source: DataReportal; Meltwater; We Are Social · 2025
| Platform | Monthly active users (billions) |
|---|---|
| 3.07B | |
| 3B | |
| 3B | |
| YouTube | 2.58B |
| TikTok | 1.99B |
| 1.41B | |
| Telegram | 1B |
| Messenger | 0.94B |
| Snapchat | 0.93B |
| 0.77B | |
| Douyin | 0.73B |
| Kuaishou | 0.72B |
| 0.59B | |
| 0.58B | |
| X | 0.56B |
- Facebook leads with 3.07 billion monthly active users
- Meta owns four of the largest platforms, each above 1 billion MAU
- TikTok reaches 1.99 billion users even before counting Douyin
Why do people show up? Staying in touch with friends and family is still the dominant reason, but a meaningful share use social media for commercial discovery: finding products, seeing brand content, and getting purchase inspiration.
| Reason for using social media (Q2 2025) | Share of users |
|---|---|
| Keeping in touch with friends and family | 50.2% |
| Filling spare time | 39.7% |
| Reading news stories | 35.4% |
| Finding content (articles, videos) | 30.3% |
| Seeing what's being talked about | 28.9% |
| Finding products to purchase | 27.3% |
| Finding inspiration for things to do and buy | 27.1% |
| Watching or following sports | 23.5% |
| Watching live streams | 23.4% |
| Making new contacts | 22.8% |
| Seeing content for favorite brands | 22.7% |
| Sharing and discussing opinions | 22.5% |
| Work-related networking and research | 21.5% |
| Following celebrities or influencers | 20.4% |
| Avoiding missing out (FOMO) | 20.2% |
Source: DataReportal; GWI; Meltwater; We Are Social. Worldwide; Q2 2025; ages 16-64.
Commercial influence varies sharply by market. The share of consumers who say they have bought a product because of a celebrity or influencer ad ranges from 54% in the Philippines down to the low 30s in markets like South Korea:
| Country | Bought due to celebrity/influencer ads (2025) |
|---|---|
| Philippines | 54% |
| Indonesia | 52% |
| Brazil | 49% |
| United Arab Emirates | 46% |
| Vietnam | 46% |
| South Africa | 45% |
| Malaysia | 43% |
| India | 42% |
| Saudi Arabia | 38% |
| China (Mainland) | 37% |
| Colombia | 34% |
| Mexico | 34% |
| South Korea | 34% |
Source: Statista Consumer Insights. Worldwide; January to December 2025; 18-64 years.
Brand research follows a similar emerging-market pattern. Across all internet users, 72.3% say they use social media to research brands, but in Nigeria, Morocco, and Kenya that figure tops 90%. (For a generational lens on how younger audiences behave on these platforms, see our Gen Z social media statistics.)
Social Media for Brand Research 2025: Nigeria Leads at 98.2% of Users
During a survey among internet users worldwide in the second quarter of 2025, an average of 72.3 percent of global respondents said they used social media platforms to research brands. The top three markets with the highest share of internet users using social media for brand research were all African: Nigeria, Morocco, and Kenya, all recording shares above 90 percent.
Source: DataReportal; GWI; Meltwater; We Are Social · 2025
| Country | Share of internet users |
|---|---|
| Nigeria | 98.2% |
| Morocco | 94.7% |
| Kenya | 92.3% |
| Vietnam | 84.9% |
| Ghana | 81.3% |
| Mexico | 81.2% |
| Saudi Arabia | 81.2% |
| Colombia | 79.5% |
| Philippines | 79.4% |
| China | 79.3% |
| Indonesia | 78.9% |
| India | 78.8% |
| Brazil | 78% |
- Nigeria tops the list - 98.2% of internet users research brands on social
- The top three markets are all African and all above 90%
- The global average is 72.3%, well below every market shown here
Methodology
The statistics in this article are attributed to their original primary sources, named under each chart and table: Meta Platforms, Alphabet/YouTube, Reddit, Kantar, HubSpot, Social Media Examiner, Socialinsider, Skai, Ebiquity, the World Federation of Advertisers, Mediaocean/TechValidate, DoubleVerify/Sapio Research, DataReportal, GWI, Meltwater, and We Are Social. Two series are produced by Statista's own research divisions and are specified as such: the modeled ad-spend and per-user (ARPU) forecasts come from Statista Market Insights, and the consumer purchase-influence survey from Statista Consumer Insights.
Survey-based figures reflect specific respondent panels and dates noted under each chart and table. For example, marketer platform-preference data comes from an 840-respondent January 2026 survey, while ROI data comes from a separate 1,505-respondent September 2025 survey. Because samples, dates, and methodologies differ between charts, figures are best read as directional indicators within each series rather than precisely comparable across series. Forecast values (2026-2030) are model projections, not observed data.
Two figures come from outside the survey and market-research sources above, and are noted as such inline. The advertising-pixel deployment counts are first-party data from TechnologyChecker's own detection crawl of live websites (June 2026), measuring installed tracking code rather than organic platform usage. The platform traffic ranking comes from Cloudflare Radar, which orders platforms by observed DNS and HTTP request volume across Cloudflare's network for 30 June 2026; it is a relative ranking, not an absolute audience count. The week-over-week trajectory cited above draws on Radar's weekly Social Media rankings from 29 December 2025 through 30 June 2026 (27 weekly snapshots).
Key takeaways
The 2026 picture is one of a maturing but still-expanding market. Spending keeps climbing toward $480 billion, the user base toward 6.6 billion, and per-user monetization toward $61: three curves pointing the same direction. Meta sits at the center of the economics, with $196 billion in ad revenue and the top spots for both perceived importance and ROI, while TikTok wins on raw engagement without yet converting that into marketer-rated returns.
For advertisers, the data points to five practical moves for 2026:
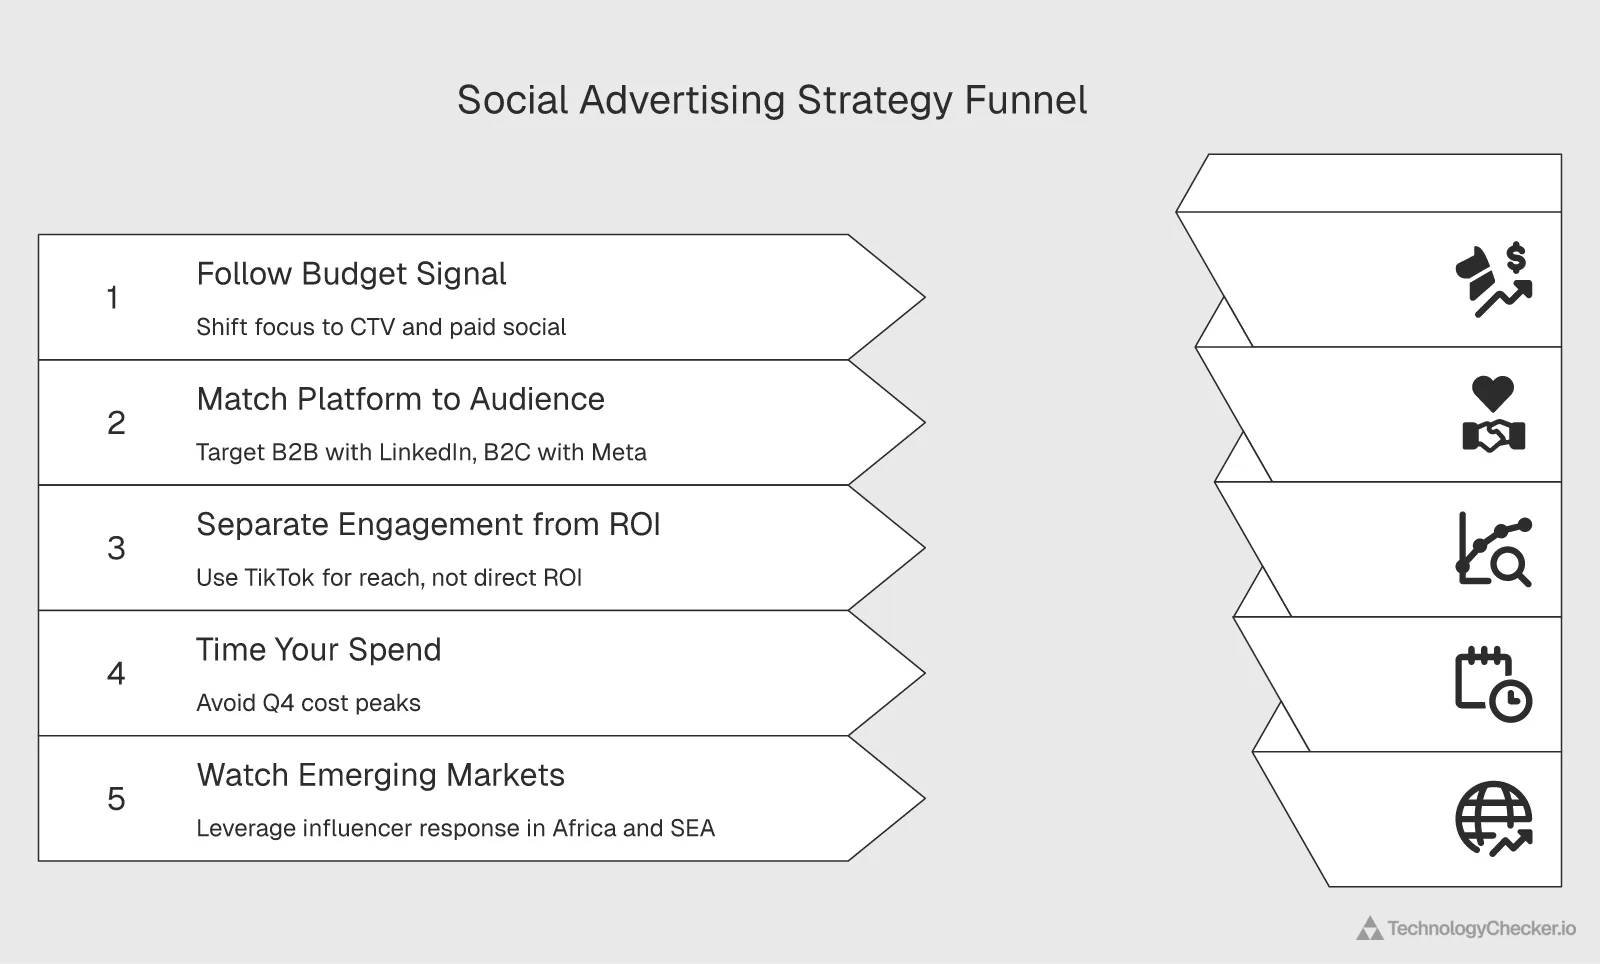
- Follow the budget signal. Net intent to raise spend is strongest for connected TV (+82%), retail media (+78%), and paid social (+56%), and negative only for digital display (-18%). Rebalance toward where the market is moving.
- Match the platform to the audience. LinkedIn is non-negotiable for B2B (51% of B2B marketers rate it most important), while Facebook and Instagram anchor B2C.
- Separate engagement from ROI. TikTok wins raw engagement (3.7%) and per-post reach (6,496 impressions), yet marketers still rate Meta's platforms highest for return. Treat TikTok as a reach play, not a guaranteed ROI channel.
- Time your spend. CPM peaks every fourth quarter; pull forward always-on budget or brace for higher pre-holiday costs.
- Watch emerging markets. African and Southeast Asian audiences show the highest rates of brand research and acting on influencer ads, an outsized opportunity for brands expanding internationally.
The audience and the money are both still growing. The open question for 2026 is which platforms convert that attention most efficiently.
Frequently asked questions
How fast is social media ad spend growing through 2030? Global social media ad spend is projected to rise from $275.98 billion in 2025 to $480.07 billion in 2030: growth of almost 74%, or roughly 11% a year (Statista Market Insights).
Which social media platform has the best ROI for marketers? Facebook, cited by 54% of marketers as a highest-ROI platform in a September 2025 HubSpot survey, ahead of Instagram (43%) and YouTube (33%).
Which platform has the highest engagement rate? TikTok, at a 3.7% average engagement rate per follower in 2025, roughly eight times Instagram's 0.48% and 25 times Facebook's 0.15% (Socialinsider).
How many people use social media in 2026? More than 5.4 billion people used social media in 2025, with forecasts pointing to over 6.6 billion by 2030 (Statista Market Insights). Industry trackers using broader definitions put the 2026 figure closer to 5.66 billion.
What is a typical social media ad CPM? Social media ad CPM ranged from $4.16 to $5.48 between Q1 2024 and Q1 2025, peaking each fourth quarter during pre-holiday demand (Skai).
Which social media advertising pixel is most widely installed? Meta's Facebook Pixel is by far the most deployed social ad pixel, detected on more than 2.06 million active websites in June 2026, about 8.6% of all sites we crawl and more than every other social pixel combined. Pinterest's tag is second (~883,000 sites), followed by LinkedIn's Insights Tag and LinkedIn Ads (TechnologyChecker detection data).
Which social platforms get the most traffic in 2026? By real DNS and HTTP traffic, Cloudflare Radar ranks Facebook first and Instagram second in mid-2026, with TikTok third and Snapchat fourth, notably ahead of where marketer budgets and survey priorities currently place them.
About the author
Emma Davies is a data analyst at TechnologyChecker with five years of experience turning technographic detection data into prospect intelligence. The first-party numbers in this report come from the kind of analysis she does daily: tracking which technologies are live across millions of domains, including advertising and conversion pixels like the Facebook Pixel, and reading the adoption patterns that signal where a market is heading. She holds a BSc in Data Science from Cardiff University and the Google Data Analytics Professional Certificate, and has built prospect-scoring models and automated data pipelines on the same detection datasets cited here. The pixel-deployment counts in this article were pulled and verified against TechnologyChecker's June 2026 crawl.

Data Analyst
5+ years of experience
Emma is a Data Analyst at TechnologyChecker, where she analyses technology adoption data to build better prospect lists and uncover actionable patterns for sales teams.
- BSc Data Science, Cardiff University
- Google Data Analytics Professional Certificate
- Tableau Desktop Certified Associate
Never miss our research

