AI Crawler Statistics in 2026: What AI Crawlers Actually Want? (September 2026 Update)
Live Cloudflare Radar data for August 2026: training fell to 40.1% of AI crawl purpose while search rose to 16.5%, nearly double a year ago. The 'mixed purpose' bucket has collapsed 16 points in twelve months.
Published •Updated •Data through August 2026•44 min read
Updated September 3, 2026 with August data. The purpose mix moved more in August than in any month this report has covered, and it moved in a direction that changes what the headline should be.
Training crawls fell from 44.76% to 40.15%. Crawling declared for Search rose from 11.56% to 16.45%, and "User Action" (a bot fetching a page because a person asked a question right now) nearly doubled to 4.80%. Read month to month that looks like training losing ground. Read against August 2025 it is something more specific: training is actually up on the year (35.45% to 40.15%). What has collapsed is the "Mixed Purpose" bucket, down from 53.23% to 36.96% in twelve months.
That is the finding. AI crawling has not shifted from training to search so much as it has stopped being ambiguous about which it is doing. A year ago most AI crawl traffic came from bots whose operators declared them as serving several purposes at once. Now the same operators are running purpose-specific crawlers, and both the training and the search columns grew as that middle bucket drained.
August 2026: the "mixed purpose" bucket is draining
| Crawl purpose | Aug 2025 | Jul 2026 | Aug 2026 | MoM | YoY |
|---|---|---|---|---|---|
| Training | 35.45% | 44.76% | 40.15% | −4.61 pt | +4.70 pt |
| Mixed Purpose | 53.23% | 39.80% | 36.96% | −2.84 pt | −16.28 pt |
| Search | 8.82% | 11.56% | 16.45% | +4.89 pt | +7.63 pt |
| User Action | 1.93% | 2.66% | 4.80% | +2.14 pt | +2.86 pt |
| Undeclared | 0.57% | 1.22% | 1.65% | +0.43 pt | +1.08 pt |
Source: Cloudflare Radar — radar/ai/bots/summary/crawl_purpose, calendar-month windows, pulled 2026-09-03. Normalization: PERCENTAGE, so the five buckets sum to 100. This measures traffic from bots Cloudflare has verified, classified by the purpose the operator declares — it is not a measure of what a crawler does with the page once it has it.
The crawler roster is fragmenting, which is the same story from the other side
| AI crawler | Aug 2025 | Jul 2026 | Aug 2026 |
|---|---|---|---|
| Googlebot | 38.67% | 24.44% | 22.90% |
| Meta-ExternalAgent | 7.98% | 12.44% | 14.04% |
| ClaudeBot | 11.92% | 16.54% | 11.88% |
| GPTBot | 12.25% | 9.73% | 8.34% |
| Amazonbot | 7.42% | 6.03% | 8.11% |
| Bingbot | 12.88% | 8.89% | 7.42% |
| Applebot | 1.69% | 6.47% | 6.63% |
| Bytespider | 2.99% | 5.34% | 3.73% |
| Claude-SearchBot | — | 3.54% | 3.69% |
| Everything else | 2.53% | 6.58% | 13.26% |
Source: Cloudflare Radar — radar/ai/bots/summary/user_agent, calendar-month windows, pulled 2026-09-03. "Everything else" is the API's other aggregate, not a named crawler.
The long tail is the row to watch. Crawlers outside the top nine took 2.53% of AI-bot traffic in August 2025 and 13.26% in August 2026 — a five-fold increase, and it doubled in the last month alone. Googlebot's share nearly halved over the same year. Both are the same phenomenon as the purpose-mix shift: more operators running more, narrower crawlers.
Updated August 1, 2026, and it starts with a correction. This report originally led with 52.3% of AI crawler requests being training crawls, measured over the 28 days to June 22, 2026. That number no longer exists in Cloudflare's data. I re-ran the identical window on August 1 and it now returns 45.94% training, with mixed purpose at 40.54% against the 34.2% we published. Search (10.14%) and User Action (2.61%) reproduce to two decimals, and the only two figures that moved did so by equal and opposite amounts. That is a reclassification, not a revision of traffic: Cloudflare moved a block of requests out of Training and into Mixed Purpose. On the corrected series training never passed 52%. Its 2026 high is 47.25% in June, and July reads 44.54%. The "training climbed past 52%" story did not happen. Every place this report cited 52.3% is annotated and left standing below, so you can see what we published next to what the data says now.
I ran Google's Search crawling and indexing systems for five years before joining TechnologyChecker, and the shift in the last year is the sharpest I've seen. The old question was "is Googlebot reaching my pages?" The new one is "what is every AI bot taking from them, and what do I get back?" The data below answers that. Where it touches who runs these bots or how to block them, I point you to the sibling reports that cover each in depth.
What is an AI crawler?
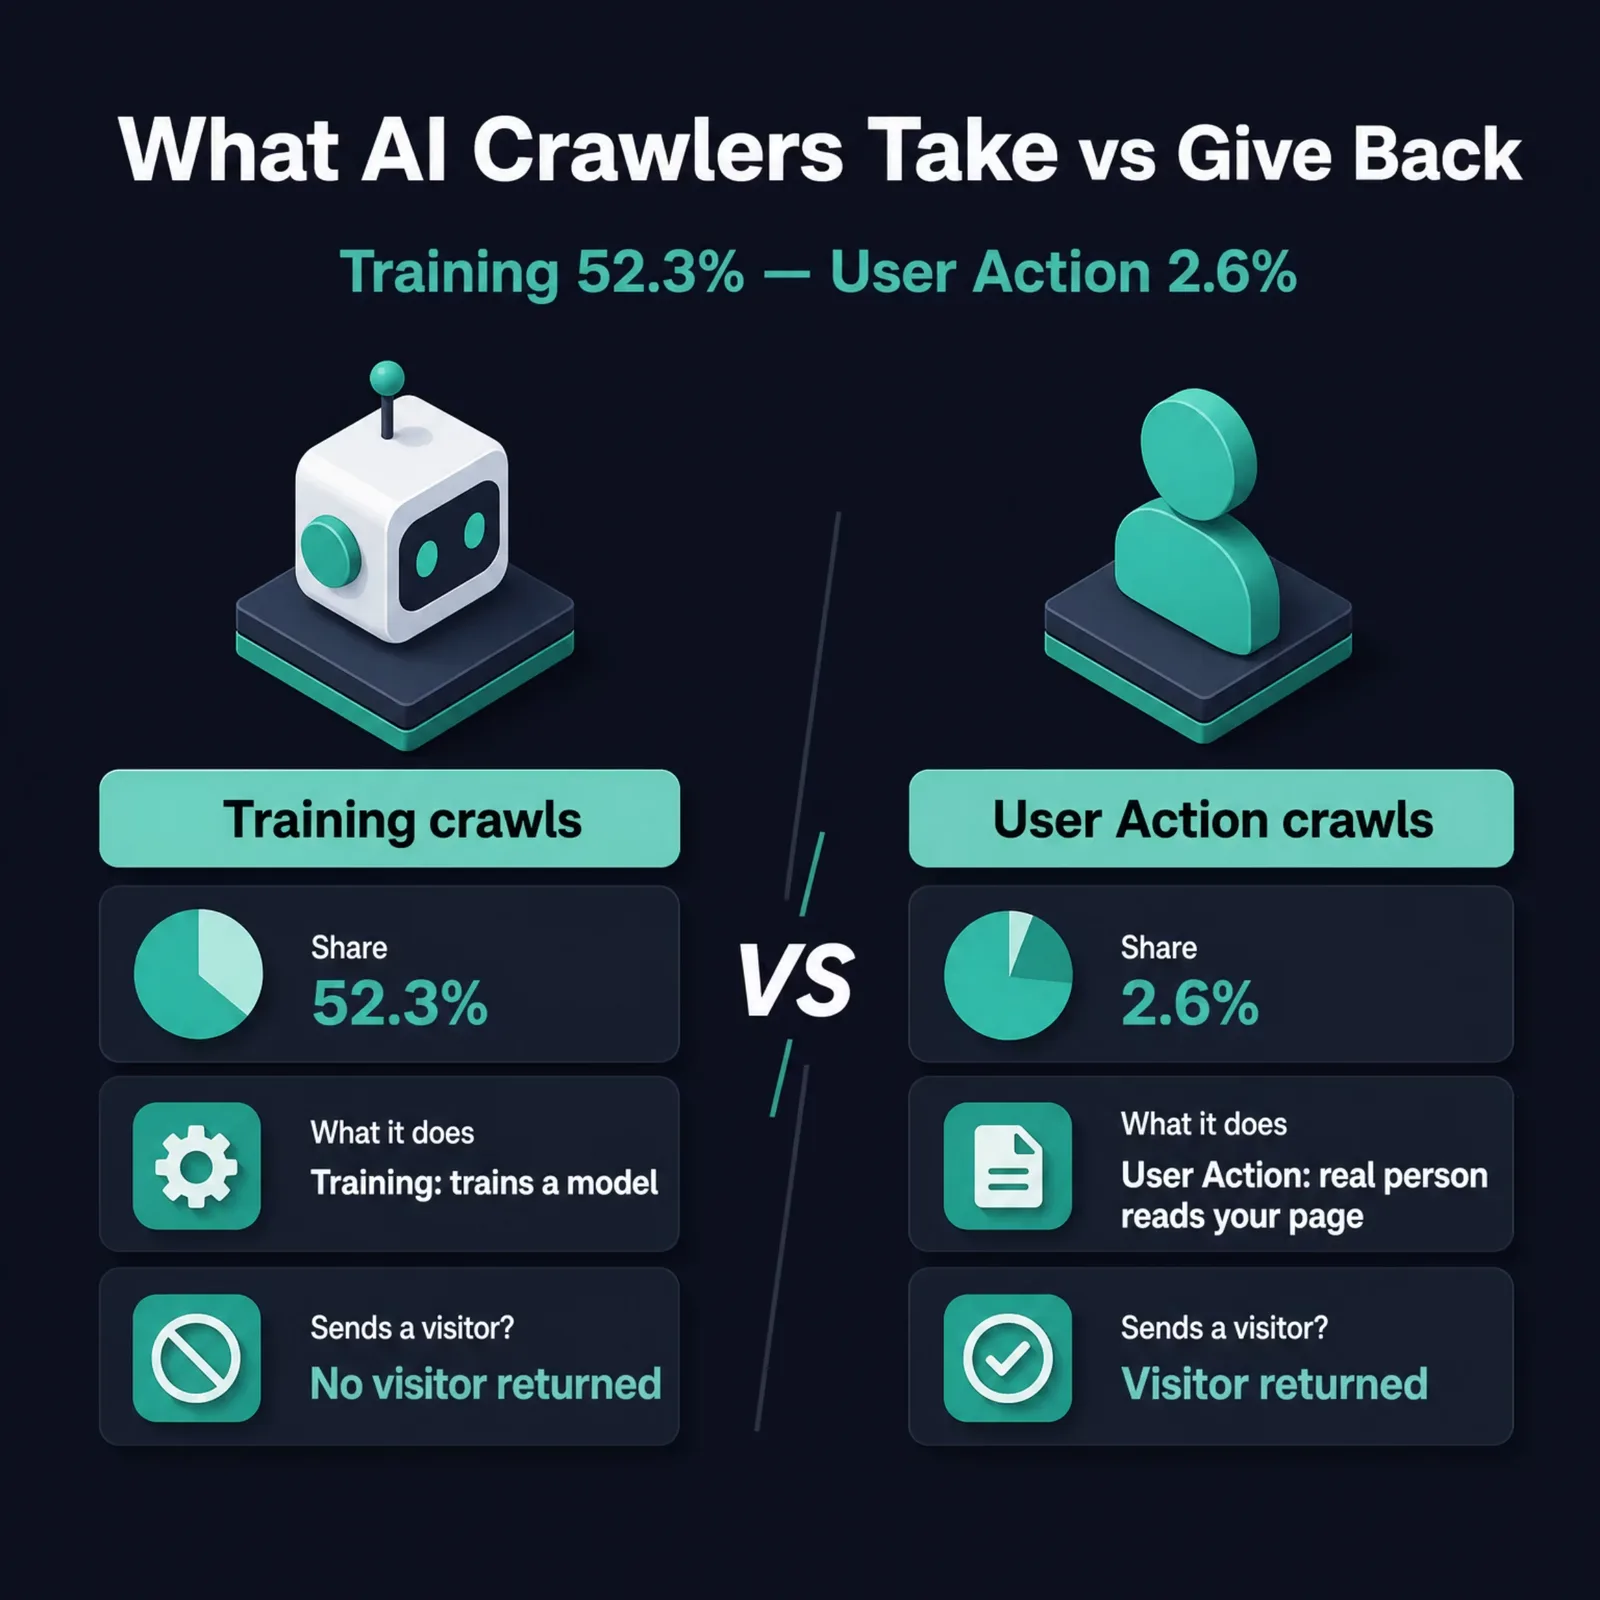
An AI crawler is an automated bot that fetches web pages to feed artificial intelligence systems. It does so mostly to collect training data for large language models, and increasingly to fetch live pages that AI answer engines cite. Named examples include OpenAI's GPTBot, Anthropic's ClaudeBot, and PerplexityBot. The difference from a traditional search bot like Googlebot is the goal, not the mechanism. Our full AI crawler list names every operator we see and what each one fetches for.
Googlebot crawls to build a search index that sends a human visitor back to your page. An AI crawler usually has no such return trip. A training crawler reads your page, extracts what it needs into a model, and moves on. Your content shapes the model's future answers, but the reader who benefits never sees your URL or your ad. That economic gap, which I'll come back to, is why AI crawler traffic now worries site owners who never gave Googlebot a second thought.
Cloudflare separates these bots by declared purpose, and that classification is what makes the rest of this report possible. You can read the full criteria in Cloudflare's verified-bots documentation.
AI crawl purpose in July 2026, and the correction to our 52% figure
Training is still the largest declared purpose. Two things changed since the June edition: July's own numbers moved, and Cloudflare rewrote the months underneath them. The rewrite is the bigger news, so it goes first.
Here is what happened to our own published window. Same query, same 28 days, run eight weeks apart:
| Crawl purpose | What we published (28 days to June 22, 2026) | Same window, re-queried August 1, 2026 | Change |
|---|---|---|---|
| Training | 52.3% | 45.94% | −6.36pt |
| Mixed Purpose | 34.2% | 40.54% | +6.34pt |
| Search | 10.1% | 10.14% | +0.04pt |
| User Action | 2.6% | 2.61% | +0.01pt |
| Undeclared | 0.8% | 0.76% | −0.04pt |
Source: Cloudflare Radar — ai/bots/summary/crawl_purpose, 2026-05-26 to 2026-06-22. Re-pulled 2026-08-01.
Two categories moved by the same amount in opposite directions and the other three didn't move at all. Traffic that already happened doesn't behave like that. Requests were relabelled from Training to Mixed Purpose, which means the crawls are the same crawls; only the declared purpose Cloudflare attributes to them changed. Our colleagues refreshing the AI adoption trends report found the identical signature on the same months, and the daily view agrees with the monthly one, so this isn't a quirk of one endpoint.
The rest of this report re-queries clean, which matters for how much you should trust the correction. The Q2 2025 against Q2 2026 quarterly table further down returns the same numbers it did in July. So do both industry tables and the year-over-year file-type comparison. One series was relabelled; the surrounding data was not touched.
What the corrected series actually shows, month by calendar month:
| Month (2026) | Training | Mixed Purpose | Search | User Action |
|---|---|---|---|---|
| March | 43.93% | 45.53% | 7.99% | 2.16% |
| April | 42.28% | 47.55% | 7.53% | 2.20% |
| May | 44.79% | 42.71% | 9.33% | 2.58% |
| June | 47.25% | 39.03% | 10.39% | 2.56% |
| July | 44.54% | 39.99% | 11.57% | 2.66% |
Source: Cloudflare Radar — ai/bots/summary/crawl_purpose, full calendar months. Pulled 2026-08-01.
Training bumps around the mid-40s, peaks in June, and comes back down in July. There is no march past 52% anywhere in it. The June edition of this report called training "still climbing" and put a 12-point six-month gain on it. On the data as it stands today, that call was wrong, and July would have broken it regardless: training fell 2.70 points month over month.
The year-over-year picture is the part that survives, and it survives comfortably. Comparing the same calendar month a year apart:
| Crawl purpose | July 2025 | June 2026 | July 2026 | MoM | YoY |
|---|---|---|---|---|---|
| Training | 35.74% | 47.25% | 44.54% | −2.70pt | +8.80pt |
| Mixed Purpose | 54.61% | 39.03% | 39.99% | +0.96pt | −14.62pt |
| Search | 7.79% | 10.39% | 11.57% | +1.18pt | +3.78pt |
| User Action | 1.38% | 2.56% | 2.66% | +0.10pt | +1.28pt |
| Undeclared | 0.48% | 0.77% | 1.24% | +0.46pt | +0.76pt |
Source: Cloudflare Radar — ai/bots/summary/crawl_purpose, full calendar months (July 2025, June 2026, July 2026). Pulled 2026-08-01.
A year ago the mixed-purpose bot was the majority of AI crawling at 54.61%. Today it's 39.99% and training has taken its place. Search nearly doubled off a small base, 7.79% to 11.57%, and it's the only purpose that rose in both comparisons at once. User Action went from 1.38% to 2.66%, so the rarest crawl type is also, proportionally, the fastest-growing one after search.
If you prefer a rolling window, the trailing 28 days (July 4 to August 1, 2026) read training 44.21%, mixed purpose 40.18%, search 11.66%, User Action 2.65%, undeclared 1.29%. That window keeps moving; the calendar months above don't. Don't compare one against the other and call the difference a trend.
ai/bots/timeseries_groups/crawl_purpose says 44.56%, with mixed purpose 40.00%, search 11.56% and User Action 2.65%. Summary and daily agree within 0.02pt, which is why I trust the corrected series over the one we published in June.From here the report keeps its original structure. Sections where July moved the data carry a July 2026 layer at the top; superseded figures stay where they were, marked in place rather than removed, so the record of what we published survives. Response codes and block rates are the one thing I haven't refreshed here, because our bot traffic report owns those numbers.
What AI crawlers actually want, by declared purpose (June 2026 snapshot)
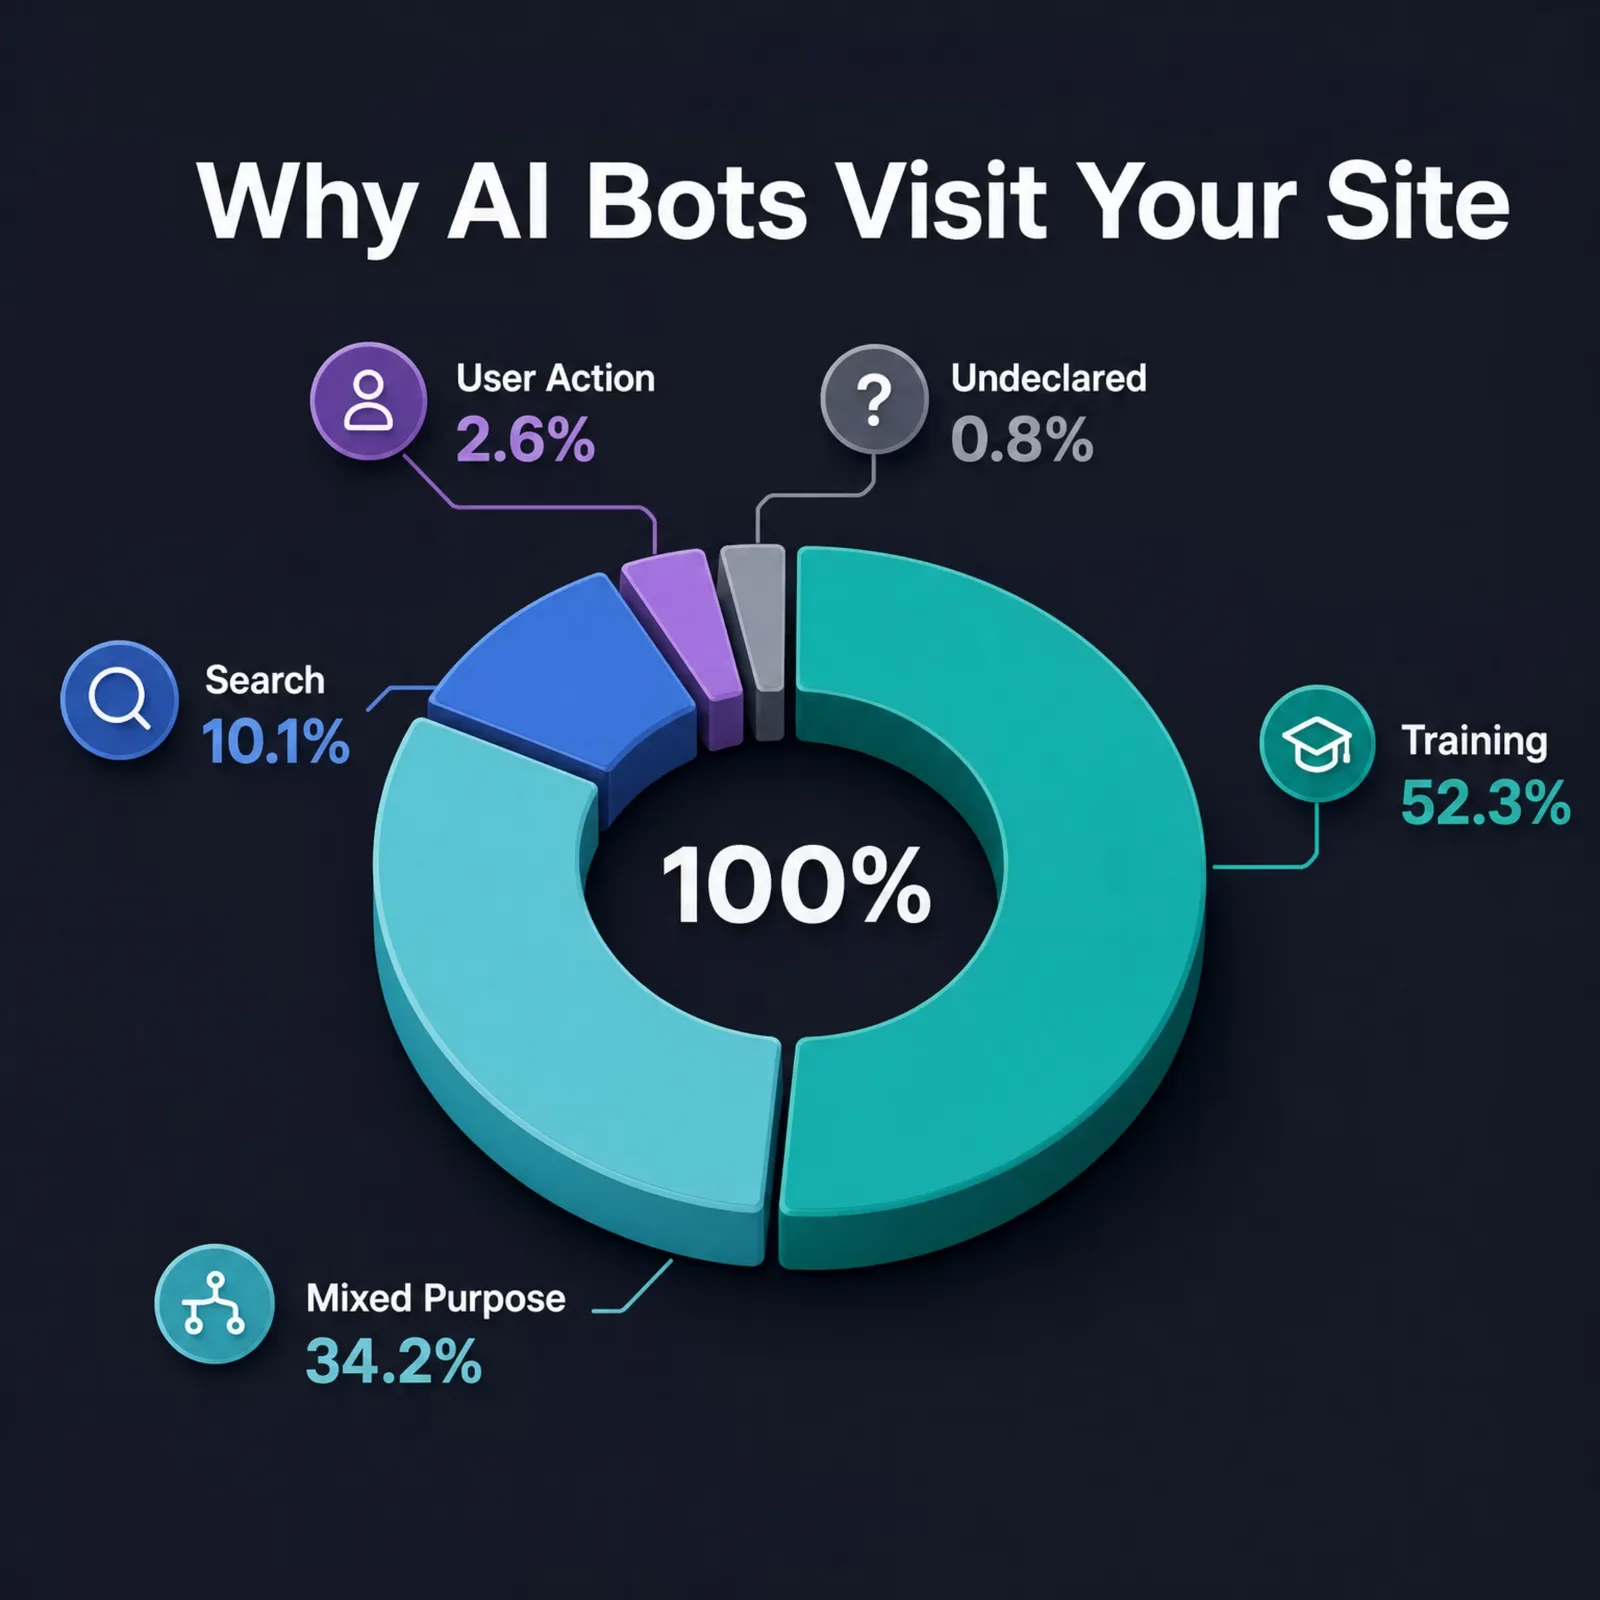
AI crawlers want training data first and everything else a distant second. Across Cloudflare's network in the 28 days to June 22, 2026, training crawls made up 52.3% of AI crawler requests, more than the next two purposes combined. Real-time fetches triggered by an actual person account for just 2.6%. The overwhelming majority of what hits your server is bulk collection that never sends a human back. ⚠️ The 52.3% figure is superseded by the August update above; preserved as originally published. The same window now returns 45.94%.
Here's the full split, straight from Cloudflare Radar:
| Crawl purpose | Share of AI crawler requests | What it means |
|---|---|---|
| Training | 52.3% | Collecting data to train or fine-tune AI models (bulk and indiscriminate) |
| Mixed Purpose | 34.2% | One crawler the operator uses for several purposes at once |
| Search | 10.1% | Building a search index, or fetching live pages to cite in AI answer engines |
| User Action | 2.6% | A real-time fetch triggered by an end user (someone pastes a URL or asks an assistant to read a page) |
| Undeclared | 0.8% | Purpose the operator hasn't declared |
⚠️ Training and Mixed Purpose in this table are superseded by the August update above; preserved as originally published. Re-queried on 2026-08-01, the same window reads training 45.94% and mixed purpose 40.54%. Search, User Action and Undeclared reproduce unchanged, and the purpose definitions in the right-hand column still stand.
The definitions matter because they change what each crawl is worth to you. A training crawl takes your content into a model with no link back. A search crawl can put your page in front of someone asking a question right now. A User Action fetch means a real person wanted your specific page in that moment, the rarest and most valuable visit of the five. Reading the table as one undifferentiated wave of "AI traffic" hides the only distinction that should drive your policy.
That table is the most recent 28-day snapshot. Average across the whole first half of 2026 instead, and the split is training 48.5%, mixed purpose 40.2%, search 8.5%, User Action 2.3%, and undeclared 0.5%. The two windows differ for a reason worth understanding: training's share was climbing all year, so the year-to-date average sits below where the number is today. The full 2026 trajectory, not just the latest snapshot, is the next section. ⚠️ Superseded by the August update above; preserved as originally published. The corrected first-half average is training 43.33%, mixed purpose 45.16%, search 8.66%, User Action 2.32%, undeclared 0.53% (Cloudflare Radar, ai/bots/summary/crawl_purpose, 2026-01-01 to 2026-06-30, pulled 2026-08-01). Mixed purpose, not training, led the first half.
This report covers what AI bots want and which sites they hit. It deliberately does not rank the operators behind them. For the breakdown of which companies run the most bot traffic, see our companion report on who operates the most bot traffic.
Training's climb, as we reported it in June 2026
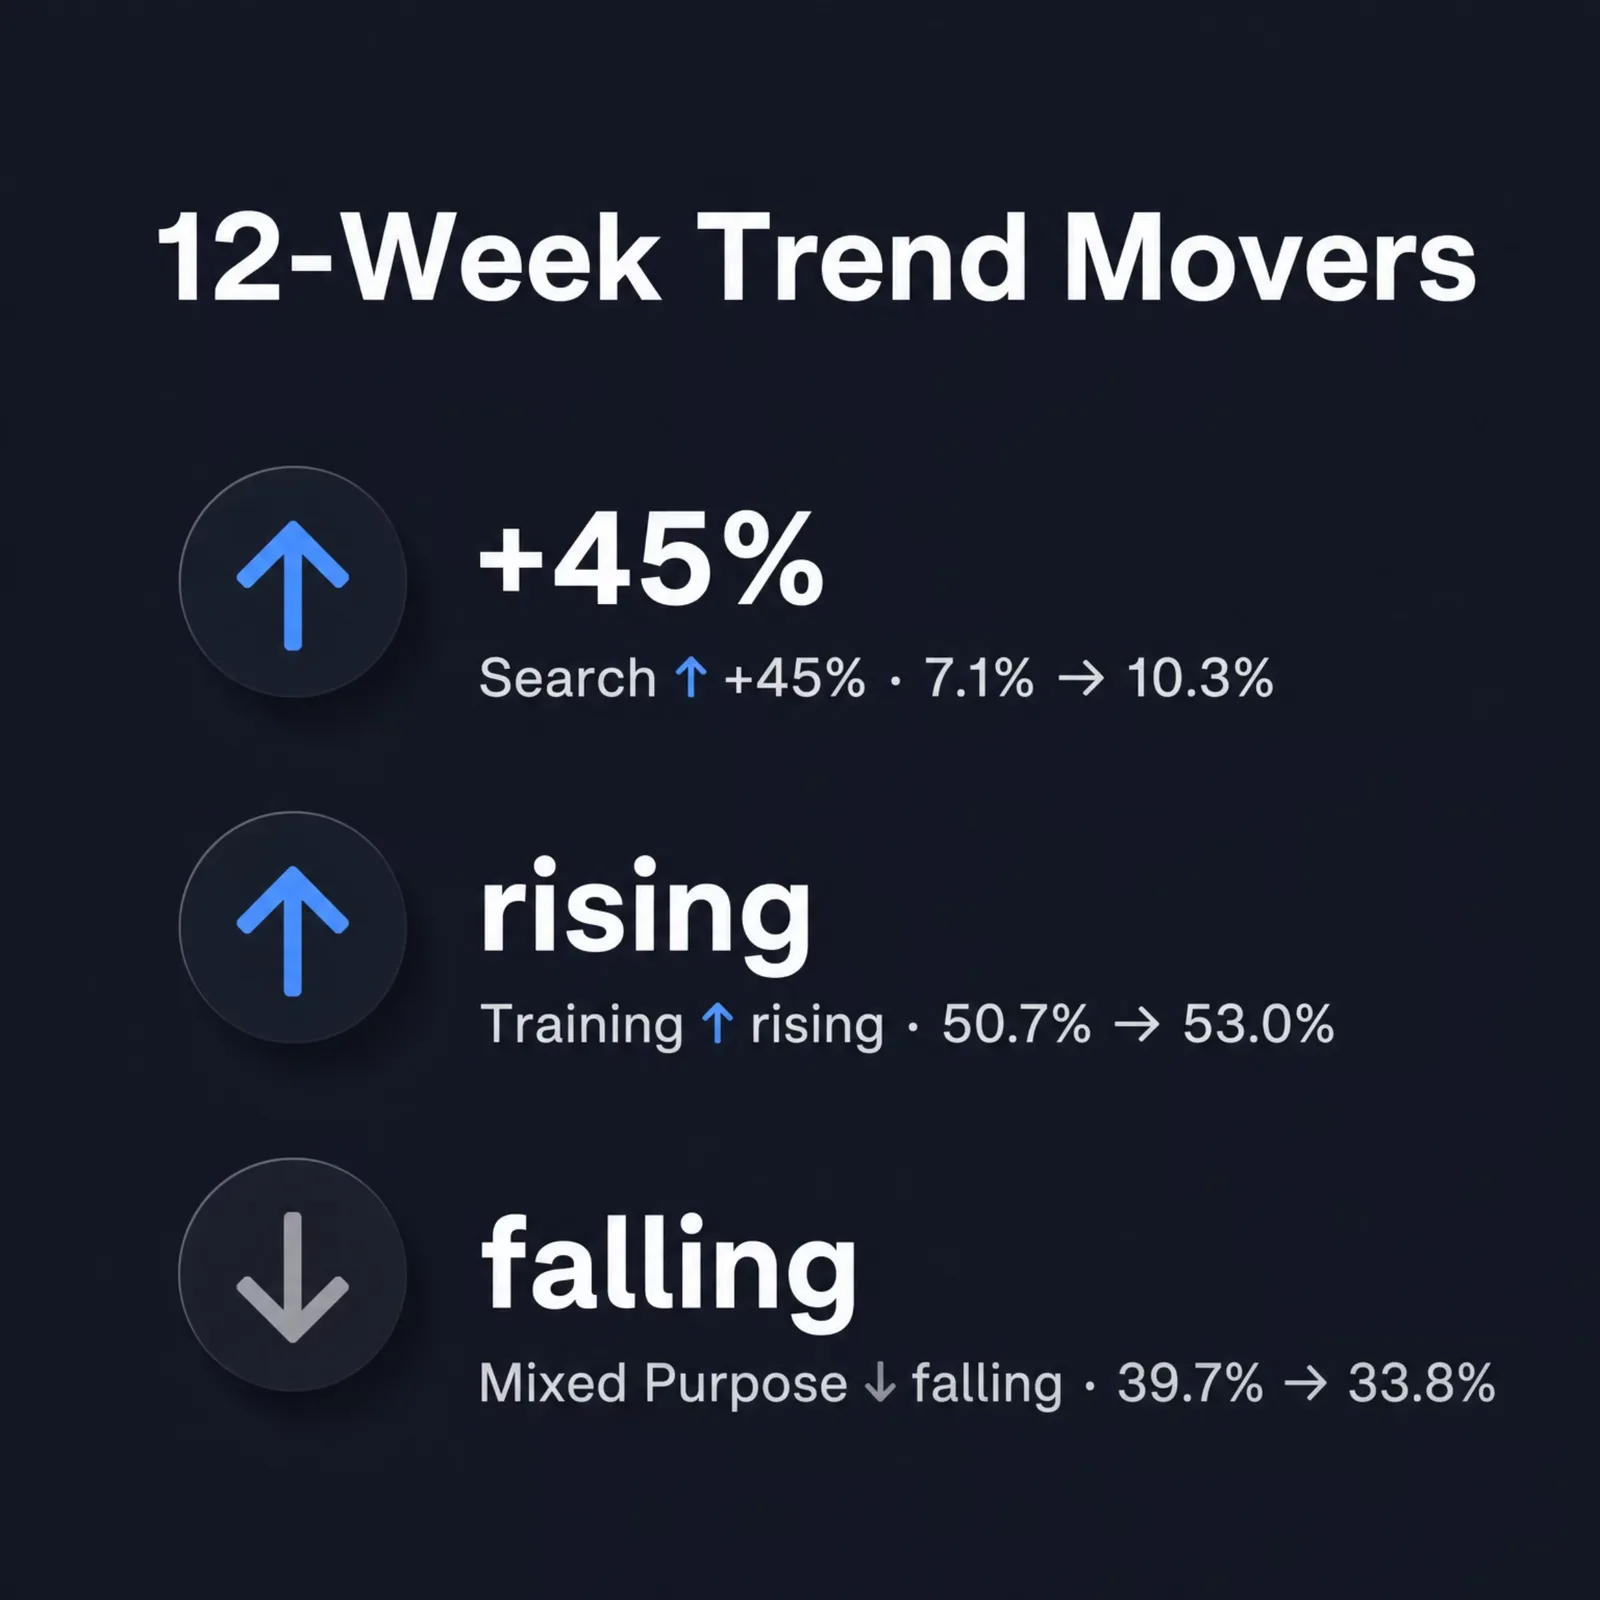
Training already dominates AI crawl traffic, and it's still climbing. Across the first half of 2026, the training share of AI crawler requests rose from 41.1% to 53.3% in Cloudflare's weekly data, a 12-point gain in six months. The bigger shift underneath that number: mixed-purpose crawling, which was actually the single largest purpose back in January at 48.7%, collapsed to 33.0% as operators split their do-everything bots into clearer single-purpose ones. Training is the bot that inherited most of that traffic. The appetite for fresh training data hasn't peaked; every new model generation needs a larger, more current corpus, and the web is where that corpus comes from. Independent trackers point the same way: bot-defense firm HUMAN reported that AI-driven web traffic grew 187% across 2025, so the rising training share sits on top of a fast-growing base of total AI requests.
⚠️ The 41.1% to 53.3% climb is superseded by the August update above; preserved as originally published. On the corrected calendar-month series, training ran 43.93% in March, 42.28% in April, 44.79% in May, 47.25% in June and 44.54% in July, so the six-month gain and the 53.3% endpoint are both gone. The mixed-purpose decline is real and larger over a full year than the weekly series showed: 54.61% in July 2025 to 39.99% in July 2026. The HUMAN figure is a third-party measurement of a different quantity (total AI request volume, not purpose share) and is unaffected.
What does a training crawl take? Text, mostly: the readable content of your pages, harvested in bulk with little regard for whether any single page is "important." That's the indiscriminate part. A training bot isn't trying to find your best page; it's trying to read all of them. For a content-heavy site, that can mean thousands of fetches that produce zero referral traffic and zero attribution.
This is the part of AI crawling site owners find hardest to accept. With Googlebot, the deal was legible: let it crawl, rank in search, get visitors. With a training crawler, the value flows one way. Your words improve a model; the model answers a user; the user never learns your site existed.
⚠️ Superseded by the August update above; preserved as originally published. On current data training peaked at 47.25% in June 2026 and fell to 44.54% in July. The lockstep observation holds; the size and direction of the training leg do not.
For more on how this training demand maps onto real model usage, our ChatGPT usage statistics and Claude adoption data show the consumer side of the same trend: the assistants these crawls ultimately feed.
AI Crawl Purpose in 2026 vs 2025: What Changed in a Year
The "still climbing" trend above is a within-2026 view. Widen the lens to a full year and the shift is starker: the purpose behind AI crawling has been rewritten since 2025. Comparing two same-length calendar quarters, the second quarter of 2025 against the second quarter of 2026, training went from a minority purpose to the dominant one, and the vague "mixed purpose" bot that used to lead collapsed.
| Crawl purpose | Q2 2025 | Q2 2026 | Year-over-year |
|---|---|---|---|
| Training | 28.7% | 44.9% | +16.1pt |
| Mixed Purpose | 65.1% | 43.0% | −22.2pt |
| Search | 4.6% | 9.1% | +4.5pt |
| User Action | 1.1% | 2.5% | +1.4pt |
| Undeclared | 0.4% | 0.6% | +0.2pt |
Source: Cloudflare Radar — ai/bots/summary/crawl_purpose, full calendar quarters (Q2 2025 vs Q2 2026). Pulled 2026-07-03.
✅ Re-verified 2026-08-01: this quarterly table reproduces exactly (Q2 2026 training 44.86%, mixed purpose 42.96%, search 9.13%, User Action 2.45%). The reclassification described in the August update hit the monthly and rolling views, not the quarterly one, which is how we know it was a relabelling rather than a change in measured traffic. The month-level like-for-like for July 2025 against July 2026 is in the August section above.
A year ago, "Mixed Purpose" was 65.1% of AI crawl traffic: one do-everything bot per operator, running training, search, and live fetches under a single user agent you couldn't govern separately. Training was less than a third of the total. In twelve months that inverted. Training grew by more than half (28.7% to 44.9%), Mixed Purpose lost a third of its weight (65.1% to 43.0%), and the two most citable purposes, Search and User Action, both roughly doubled off small bases. This is the same story the intra-2026 weekly data tells, now confirmed across a full year: operators are unbundling the do-everything crawler into single-purpose bots, and training is the bot inheriting the most traffic.
Two things are worth separating, the same way the bot operator league table shifts by window. The full-quarter Q2 2026 training share is 44.9%. The most recent 28-day window (to July 3, 2026) reads 47.7%, and it touched 52 to 53% at the late-June peak the top of this report cites. Those are not contradictions; they are the same climbing metric read over different windows. A calendar quarter averages the whole three months, so it sits below the latest weeks whenever a number is trending up. Week to week the training share oscillates in the high 40s to low 50s; year over year it has climbed unmistakably. The durable signal is the arc, not any single week.
⚠️ The 47.7% and "52 to 53%" figures are superseded by the August update above; preserved as originally published. On current data no window reaches 52%: June 2026 peaks at 47.25% and the trailing 28 days to August 1 read 44.21%. The window-discipline point in this paragraph is the one part that got sharper, not weaker. The year-over-year arc is real (35.74% to 44.54%, July to July); the late-June spike was a classification artifact.
Which industries get crawled most
Industry mix in July 2026
Shopping still leads both cuts of the data, and the two cuts moved in opposite directions across the year. Across all verified crawlers, shopping's share of crawl traffic shrank while the technology verticals took its place:
| Vertical | July 2025 | July 2026 | YoY |
|---|---|---|---|
| Shopping & General Merchandise | 27.93% | 25.67% | −2.26pt |
| Internet and Telecom | 15.21% | 20.61% | +5.39pt |
| Computer and Electronics | 11.93% | 19.19% | +7.26pt |
| News, Media, and Publications | 11.74% | 8.96% | −2.78pt |
| Business and Industry | 6.58% | 3.66% | −2.92pt |
| Gambling | 2.59% | 6.69% | +4.10pt |
Source: Cloudflare Radar — bots/crawlers/summary/vertical, full calendar months (July 2025 vs July 2026). Pulled 2026-08-01. Trailing 28 days to August 1, 2026: shopping 25.47%.
Narrow it to AI crawlers alone and the movement reverses. They went further into shopping while everyone else backed out of it:
| Vertical | July 2025 | July 2026 | YoY |
|---|---|---|---|
| Shopping & General Merchandise | 29.06% | 31.58% | +2.52pt |
| Internet and Telecom | 16.87% | 16.43% | −0.44pt |
| Computer and Electronics | 15.25% | 14.60% | −0.65pt |
| News, Media, and Publications | 9.40% | 9.80% | +0.40pt |
| Business and Industry | 5.43% | 4.95% | −0.48pt |
| Professional Services | 4.36% | 3.22% | −1.14pt |
| Travel and Tourism | 3.81% | 4.28% | +0.47pt |
| Finance | 3.34% | 2.97% | −0.36pt |
Source: Cloudflare Radar — ai/bots/summary/vertical, full calendar months (July 2025 vs July 2026). Pulled 2026-08-01.
That gap is the useful part. Search bots, social preview fetchers and uptime monitors spread out across the technology verticals over the year; AI crawlers concentrated. A retailer reading only the all-bots number would conclude the pressure eased, when the AI-specific pressure went up 2.52 points. Month over month, AI crawling of shopping sites eased from 33.30% in June to 31.58% in July, so June was a local high here too, the same shape the crawl-purpose series shows.
One note on the older tables below: both re-query unchanged. The 26.3% verified-bot figure returns 26.35% when I run its original 28-day window to June 22 again, and the H1 2026 AI-only table returns 31.78% for shopping against the 31.7% published. Only the crawl-purpose series was relabelled, which is the cleanest evidence that Cloudflare corrected a classification rather than restating its traffic.
The June 2026 snapshot, as originally published
Shopping sites get crawled more than any other kind. In the 28 days to June 22, 2026, shopping and general-merchandise sites absorbed 26.3% of all verified bot crawl traffic, the largest share of any industry, and roughly a quarter of everything Cloudflare's bots fetched. The three most-crawled industries together account for about two-thirds of verified bot crawl traffic.
| Industry | Share of verified bot crawl traffic |
|---|---|
| Shopping & General Merchandise | 26.3% |
| Internet & Telecom | 20.8% |
| Computer & Electronics | 18.9% |
| News, Media & Publications | 9.6% |
| Gambling | 6.5% |
| Business & Industry | 3.5% |
| Professional Services | 2.6% |
| Finance | 2.6% |
| Games | 2.2% |
| Other | 7.0% |
Why shopping? Because product catalogs are exactly the kind of structured, frequently-changing, high-volume content that both training and search crawlers reward. Prices move. Inventory turns over. Descriptions, reviews, and specs pile up. A model that wants to answer "what's the best running shoe under $120" needs current product data, and shopping sites are where it lives. The same logic explains why news and media (9.6%) draws heavy crawling. Fresh, factual, constantly-updated text is premium fuel.
The table above counts all verified bots. Narrow the lens to AI crawlers alone, across the entire first half of 2026, and shopping's lead gets sharper, not softer. Here is the AI-only cut from Cloudflare Radar:
| Vertical | Share of AI crawler requests (H1 2026) |
|---|---|
| Shopping & General Merchandise | 31.7% |
| Internet & Telecom | 17.0% |
| Computer & Electronics | 14.7% |
| News, Media & Publications | 9.1% |
| Business & Industry | 5.0% |
| Travel & Tourism | 3.9% |
| Professional Services | 3.3% |
| Finance | 2.9% |
| Gambling | 2.6% |
| Other | 9.9% |
Strip out the search engines and social-preview bots that pad the all-bots numbers, and AI crawlers concentrate on shopping even harder: 31.7% of their requests, versus 26.3% across all verified bots. The reason is the same one that makes product data valuable to a model in the first place. Note one new entrant in the AI-only view: Travel & Tourism (3.9%) cracks the top six, because itineraries, fares, and hotel inventory are exactly the live, structured data AI answer engines now field questions about.
Our own detection data adds the layer Cloudflare's can't: how much of the crawlable web those top industries actually sit on.
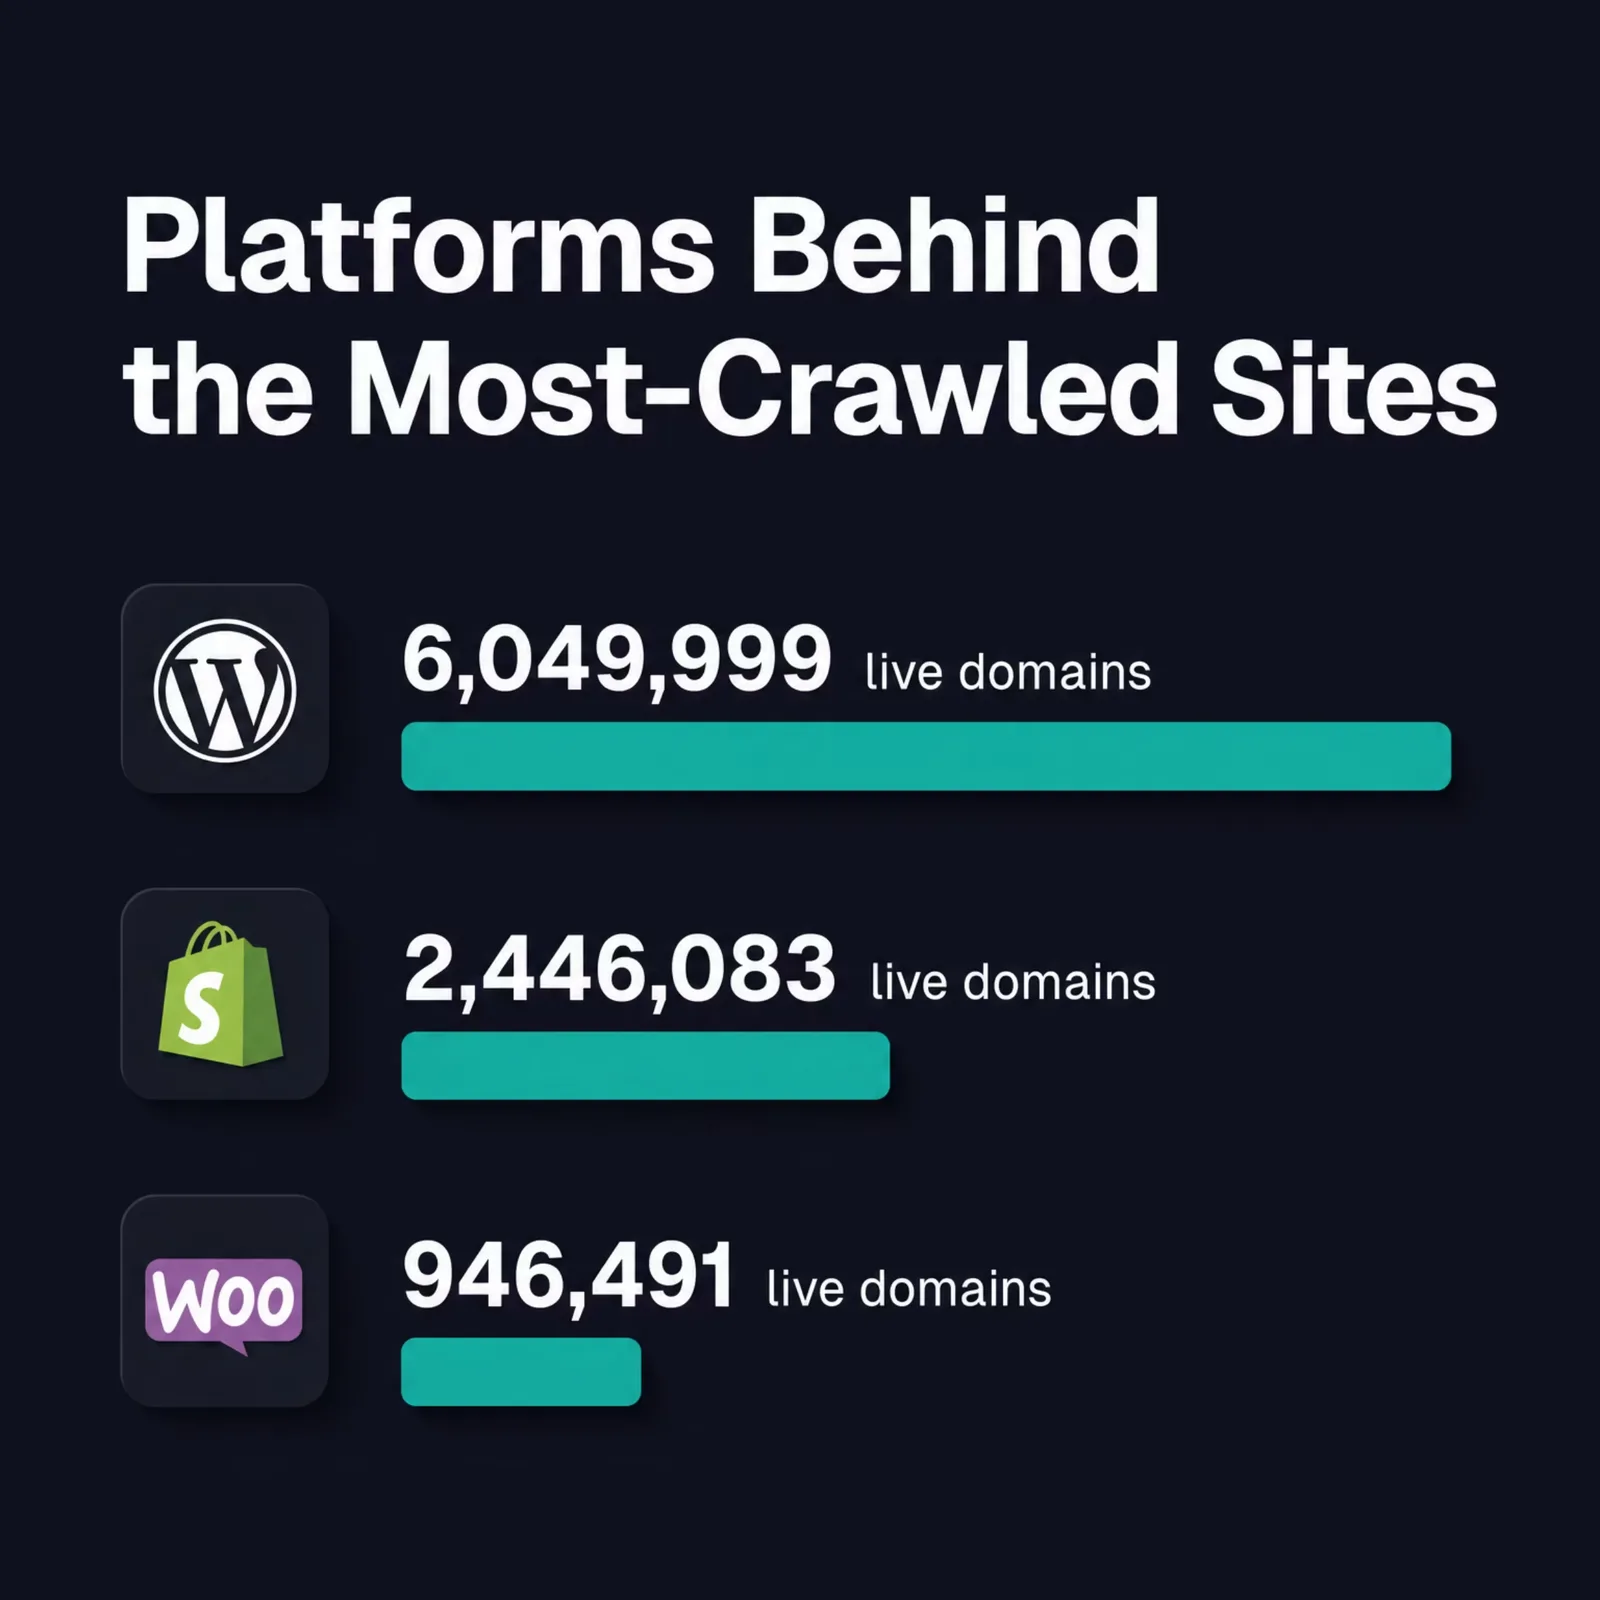
Shopify isn't the only engine behind that 26.3%. We also detect WooCommerce on 1,463,627 live domains, which means well over 3.7 million storefronts across just those two platforms, a deep and structured product corpus that training and search bots both want. The News, Media & Publications slice has a similar backbone: we detect WordPress on 9,555,391 live domains, roughly 64% of the CMS market, and it's the substrate under a large share of the world's editorial content. Content-rich industries get crawled hardest because content-rich platforms are what the open web is built on.
Search crawling is the fastest-growing purpose
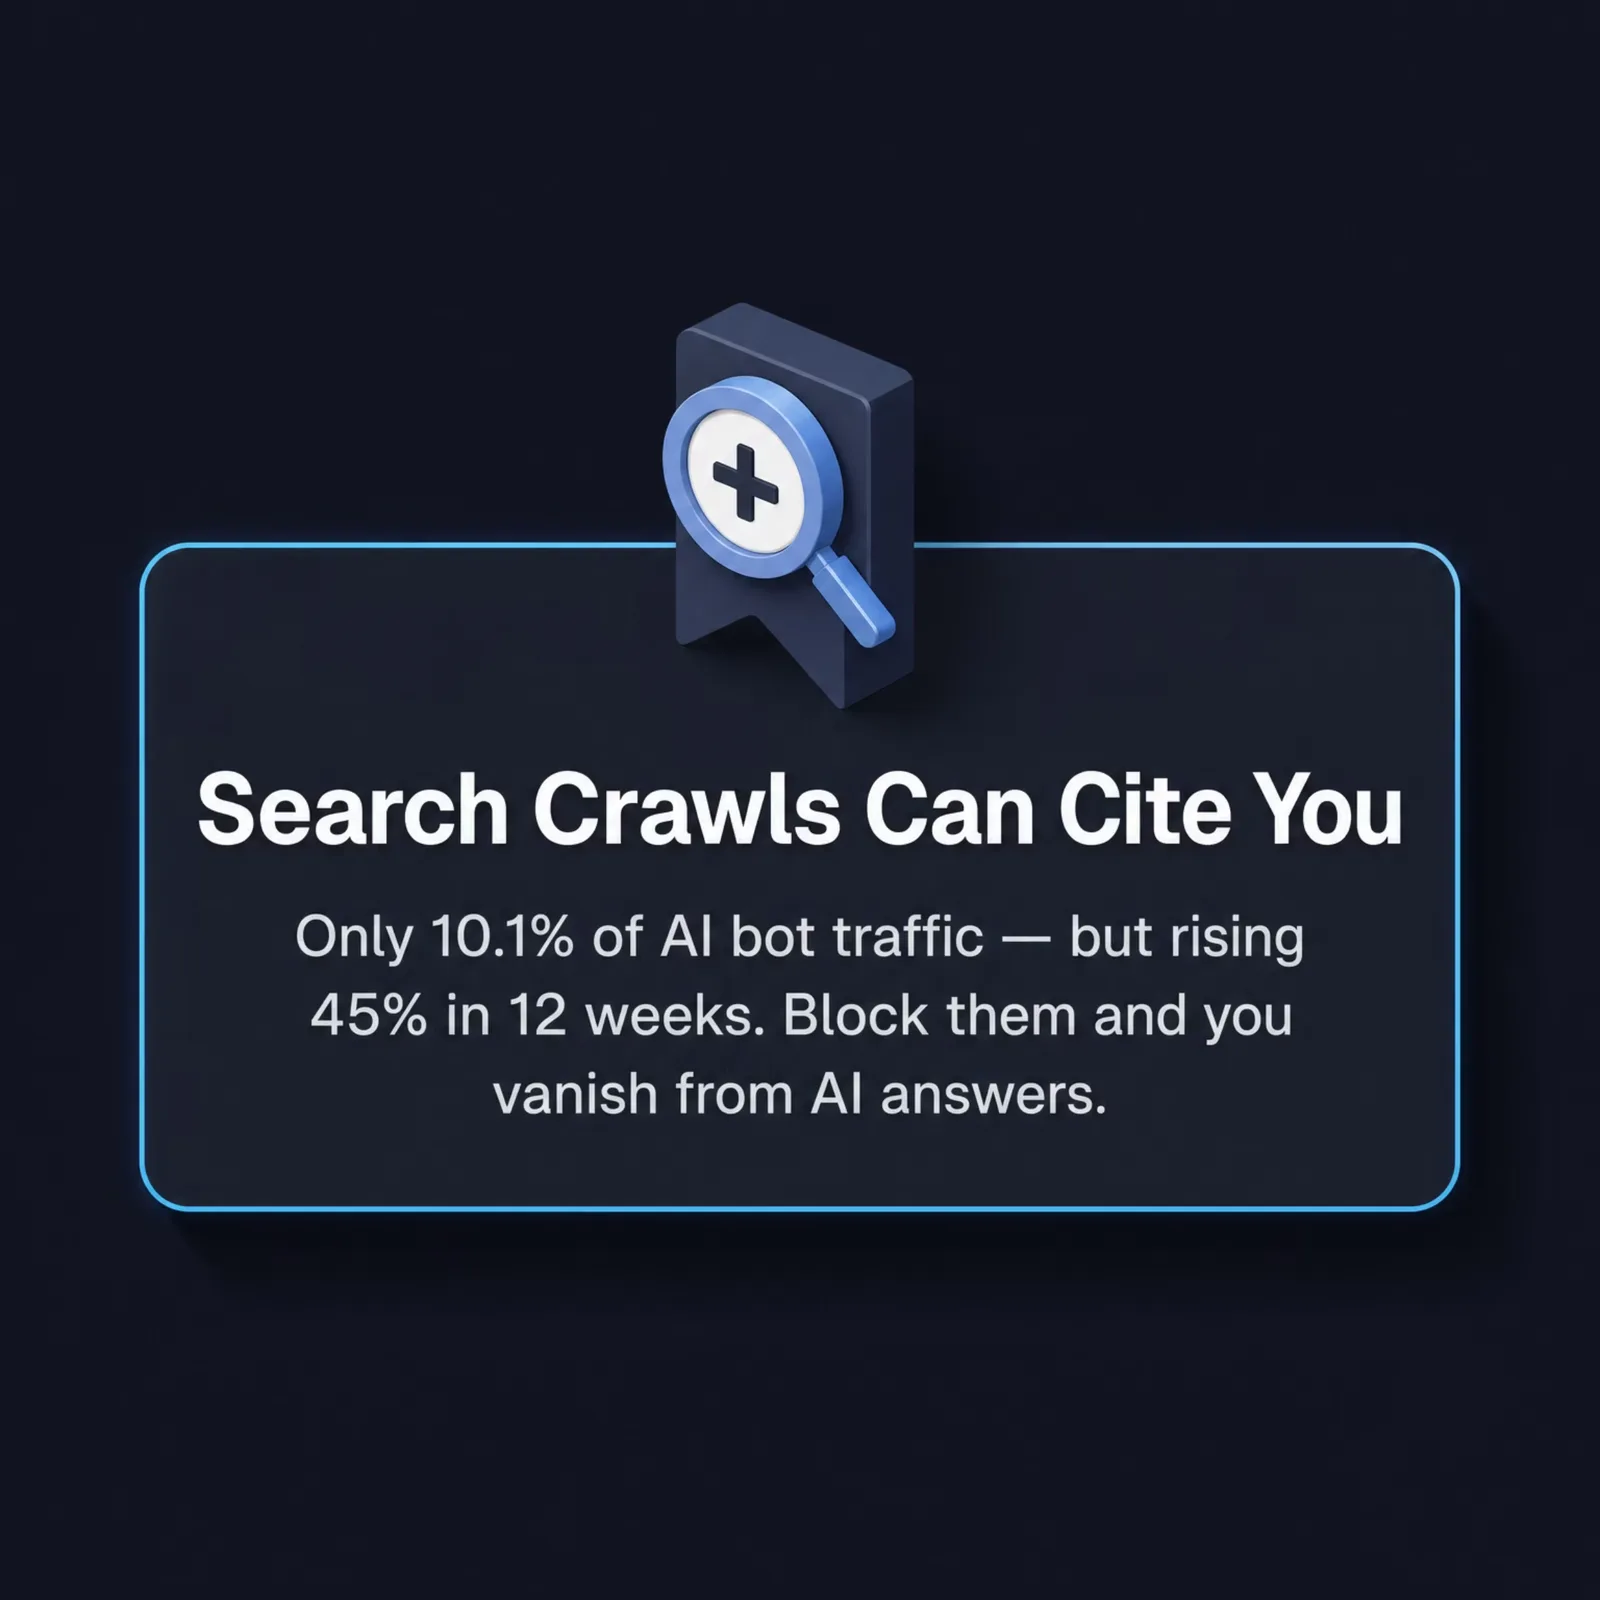
Search-purpose crawling is the fastest mover in the whole dataset. Across the first half of 2026, search crawling climbed from 7.5% to 10.7% of AI bot requests, a 43% relative jump, faster than any other purpose. At the same time, mixed-purpose crawling fell from 48.7% to 33.0%. Operators are splitting one do-everything crawler into clearer single-purpose bots, and the search bot is the one gaining ground.
July extends that line. Search-purpose crawling reached 11.57% of AI crawler requests for the calendar month, up from 10.39% in June and 7.79% in July 2025, which is a 48% year-over-year gain in relative terms. It's the only purpose that rose in both the month-over-month and the year-over-year comparison. It's also the one the reclassification never touched: when I re-ran our original June window, search came back at 10.14% against the 10.1% we published, matching to two decimals while training moved six points. So of the two headline trends in this report, the one that survived audit intact is the one that pays you back.
Source: Cloudflare Radar — ai/bots/summary/crawl_purpose, full calendar months (July 2025, June 2026, July 2026). Pulled 2026-08-01.
This is the trend with the most upside for site owners. A search crawl is the kind that can cite you. When an AI answer engine fetches a live page to build a citation, that's search-purpose crawling. Unlike a training crawl, it can surface your brand inside the answer a user reads. The rise from 7.5% to 10.7% is a small absolute share, but the direction is the point: the slice of AI crawling that can actually send recognition (and sometimes a click) back to you is the one growing fastest.
That's why generative engine optimization, structuring content so AI answer engines can quote it, stops being optional. If more than 10% of AI crawl traffic is now hunting citable pages and that number is climbing, the pages you make easy to cite are the ones that earn visibility in AI answers.
Vercel's December 2024 study, The rise of the AI crawler, was the first widely-cited data on AI bot request volumes. Vercel measured a single crawler, GPTBot, making 569 million requests across its network in one month, with the major AI crawlers together reaching roughly 28% of Googlebot's request volume. It remains a useful benchmark for raw traffic. What it didn't break out was crawl purpose or the industry being crawled, the two dimensions this report leads with, eighteen months fresher.
What file types AI crawlers actually grab
AI crawlers are after words, not pictures. Across the first half of 2026, 72.8% of everything AI crawlers fetched from Cloudflare's network was HTML, the readable text of your pages. Nothing else comes close.
| Content type | Share of AI crawler fetches (H1 2026) |
|---|---|
| HTML | 72.8% |
| JSON | 7.2% |
| JavaScript | 5.4% |
| Images | 5.3% |
| Plain Text | 4.8% |
| XML | 1.9% |
| CSS | 1.6% |
| Other | 1.0% |
This confirms what the crawl-purpose split implies. Training and search crawlers both want language they can model and quote, and that language lives in your HTML. The small image share (5.3%) tells you most AI crawling today is still a text operation, though multimodal models are the reason to expect that number to climb. The slice I'd watch as a site owner is JSON at 7.2%: that is the signature of crawlers reading your structured data and APIs directly, product feeds, schema endpoints, the machine-readable layer an answer engine can parse most cleanly. If you serve clean JSON-LD and well-formed feeds, you are making yourself easier to cite, not just easier to read.
That HTML-first mix has been shifting, and the direction reinforces the point above. A year ago HTML was 83.7% of everything AI crawlers fetched (Q2 2025); by Q2 2026 it had fallen to 71.3% as crawlers reached for more of everything else. JSON rose from 4.8% to 7.1%, JavaScript from 3.0% to 6.1%, plain text from 1.9% to 5.0%, and images from 3.3% to 5.9%. The fastest-growing slices are structured data (JSON) and the machine-readable layers around it, exactly what an answer engine parses to cite you cleanly, with images climbing as multimodal models learn to read pictures too. HTML still dominates, but the corpus AI crawlers pull is diversifying year over year.
Source: Cloudflare Radar — ai/bots/summary/content_type, full calendar quarters (Q2 2025 vs Q2 2026). Pulled 2026-07-03. Re-verified 2026-08-01: both quarters reproduce exactly.
File types in July 2026
Run the same comparison at month granularity, July against July:
| Content type | July 2025 | July 2026 | YoY |
|---|---|---|---|
| HTML | 75.62% | 72.52% | −3.10pt |
| JSON | 7.82% | 6.91% | −0.91pt |
| Plain Text | 3.01% | 5.95% | +2.95pt |
| JavaScript | 4.99% | 5.32% | +0.33pt |
| Images | 3.90% | 5.31% | +1.40pt |
| XML | 1.64% | 1.62% | −0.02pt |
| CSS | 1.42% | 1.24% | −0.18pt |
| Binary | 0.48% | 0.22% | −0.26pt |
Source: Cloudflare Radar — ai/bots/summary/content_type, full calendar months (July 2025 vs July 2026). Pulled 2026-08-01.
HTML's slow retreat holds at month granularity, and images keep climbing as multimodal models learn to use them. JSON is the row to be careful with. The quarterly comparison above has it rising from 4.81% to 7.08%; the monthly comparison has it falling from 7.82% to 6.91%. Both are accurate. July 2025 was simply a high JSON month against a Q2 2025 average of 4.81%, so the direction of the JSON trend depends on which 2025 window you stand in. Treat it as the noisiest line in the table.
The line I'd trust instead is plain text, which nearly doubled year over year (3.01% to 5.95%) and rose again month over month, from 4.51% in June. Plain text is where robots.txt, llms.txt and raw markdown live, so that growth fits crawlers reading the machine-facing files sites have started publishing on purpose.
What your server actually says back to AI crawlers
The figures in this section cover the first half of 2026 and we've left them as published. Response codes and block rates are the subject of our bot traffic report, which carries the refreshed July numbers, and the directives themselves live in the robots.txt blocking report. Rebuilding either here would just give you two versions of the same number to reconcile.
Most AI crawlers get what they came for, but a meaningful slice now get turned away. Across the first half of 2026, 70.4% of AI crawler requests on Cloudflare's network returned a clean 200 OK. The rest is where the story is: 7.9% were met with a 403 Forbidden, the status a server returns when it is deliberately refusing the request, and another 0.7% hit a 429 Too Many Requests. Roughly one in twelve AI crawl requests is now actively refused.
| Server response | Share of AI crawler requests (H1 2026) | What it means |
|---|---|---|
| 200 OK | 70.4% | Request succeeded |
| 301 / 302 redirect | 11.1% | Sent to another URL |
| 403 Forbidden | 7.9% | Server deliberately refused the crawler |
| 404 Not Found | 3.5% | Page does not exist |
| 204 / 206 | 3.2% | No content / partial content |
| 429 Too Many Requests | 0.7% | Crawler was rate-limited |
| 304 Not Modified | 0.6% | Cached copy still valid |
| Other | 2.6% | — |
That 7.9% block rate is the clearest sign in the data that site owners have stopped treating AI crawlers as passive background traffic. A 403 is a choice, usually enforced at the CDN or firewall rather than in robots.txt, which a determined crawler can simply ignore. The 11.1% of requests that get redirected (301/302) are mostly harmless, the crawler following your URL structure, and the 3.5% that hit 404s are a reminder that AI crawlers chase stale links the same way search bots do. But the 403-and-429 combination, about 8.6% of all requests, is the number to watch: it is the open web pushing back, request by request.
Whether refusing crawlers is the right call, and how to do it without accidentally locking out the search bots that can cite you, is the subject of our dedicated guide to block AI crawlers in robots.txt. The response-code data just proves the pushback is already happening at scale.
Why your own logs won't match these numbers
Every percentage in this report counts verified AI crawler requests. Cloudflare confirms a bot's identity against the operator's published IP ranges before the request enters the dataset, so spoofed traffic is filtered out upstream rather than counted and labelled. That is what makes the purpose split above meaningful: a training crawl attributed to GPTBot really came from OpenAI.
Your access logs do not work that way. They record the user-agent string, and that string is typed by whoever sent the request. If you group your own traffic by user agent and hold it up against the tables above, you are comparing confirmed identities to unverified claims, and the two do not describe the same population. I should have said so earlier in this report than the final FAQ, because it changes what every number here means the moment you try to reproduce one.
How wide is the gap? Two security networks measure the claim layer directly, which is precisely the layer Cloudflare discards:
| Measurement | What it counts | AI crawler impersonation found |
|---|---|---|
| Cloudflare Radar (this report) | Verified bots only, identity confirmed before counting | Excluded upstream, so not measurable here |
| HUMAN Security, 16 AI crawlers | Every request carrying an AI crawler user agent | 5.7% spoofed, roughly 1 in 18 |
| DataDome, 7.9 billion agent requests | Every request carrying an AI agent name | Meta-ExternalAgent most impersonated at 16.4M spoofed requests; PerplexityBot the highest rate, near 2.4% |
Sources: HUMAN Security — 2026 State of AI Traffic and Cyberthreat Benchmark Report. DataDome — The AI Traffic Report, 7.9 billion AI agent requests across January and February 2026, published March 16, 2026.
Read those two rows within each vendor, not across them. HUMAN and DataDome set different thresholds for calling a request fraudulent and defend different traffic, so a 5.7% average and a 2.4% peak rate are not in conflict and neither is the correct figure for your site. The rankings are the durable part.
HUMAN's per-bot breakdown is the number worth carrying. Against that 5.7% average, 16.7% of requests claiming to be ChatGPT-User were fake. The agent most likely to represent a real person asking about your page right now is also among the most frequently worn as a disguise, which is a problem precisely because User Action fetches are the tier this report has spent several sections arguing you should welcome.
The ratio at your door depends on how big your door is
Those network figures are averages, and averaging removes the case most site owners are actually in. A large network carries an enormous volume of genuine crawling, and that volume dilutes the forged traffic inside it. A small, obscure site receives almost no genuine crawling and roughly the same background of automated scanners, so the same absolute amount of forgery arrives as a far larger share.
An independent measurement makes that concrete. Daniel Comiza checked every AI-crawler claim reaching one small server between July 28 and August 9, 2026: 100,408 log lines, 9,452 requests naming an AI crawler, and 62.1% of the claims that could be checked at all could not be matched to the vendor's own published address list. Against HUMAN's 5.7%, that is an order of magnitude.
Treat it as an illustration, not a statistic, and the author is the first to say so. It is one server across 13 days, the single busiest unconfirmed address accounts for half of all unconfirmed traffic, and removing that address entirely still leaves 45.3%. A handful of busy scanners move a number like this. They cannot move a network-wide one.
What survives the small sample is the behavior split, because it does not depend on any address list being complete. Requests for .env files, credentials and admin panels were 0.5% of the confirmed group and 41% of the unconfirmed one. Google does not hunt for WordPress login forms on a site that has never run WordPress. Seventeen addresses wore more than one crawler's name inside that window, and the busiest cycled through ten of them while asking for the same environment files each time. No real crawler renames itself ten times.
The conclusion is narrow, and it is the one worth carrying out of this section: a firewall rule that admits anything calling itself GPTBot is not an access policy, it is an honour system. Verification is also cheap. OpenAI, Google, Microsoft and Perplexity publish their crawler address ranges as machine-readable files, and Google and Microsoft support reverse DNS on top of that. Checking costs milliseconds and needs no relationship with anyone.
How AI crawlers differ from traditional search bots
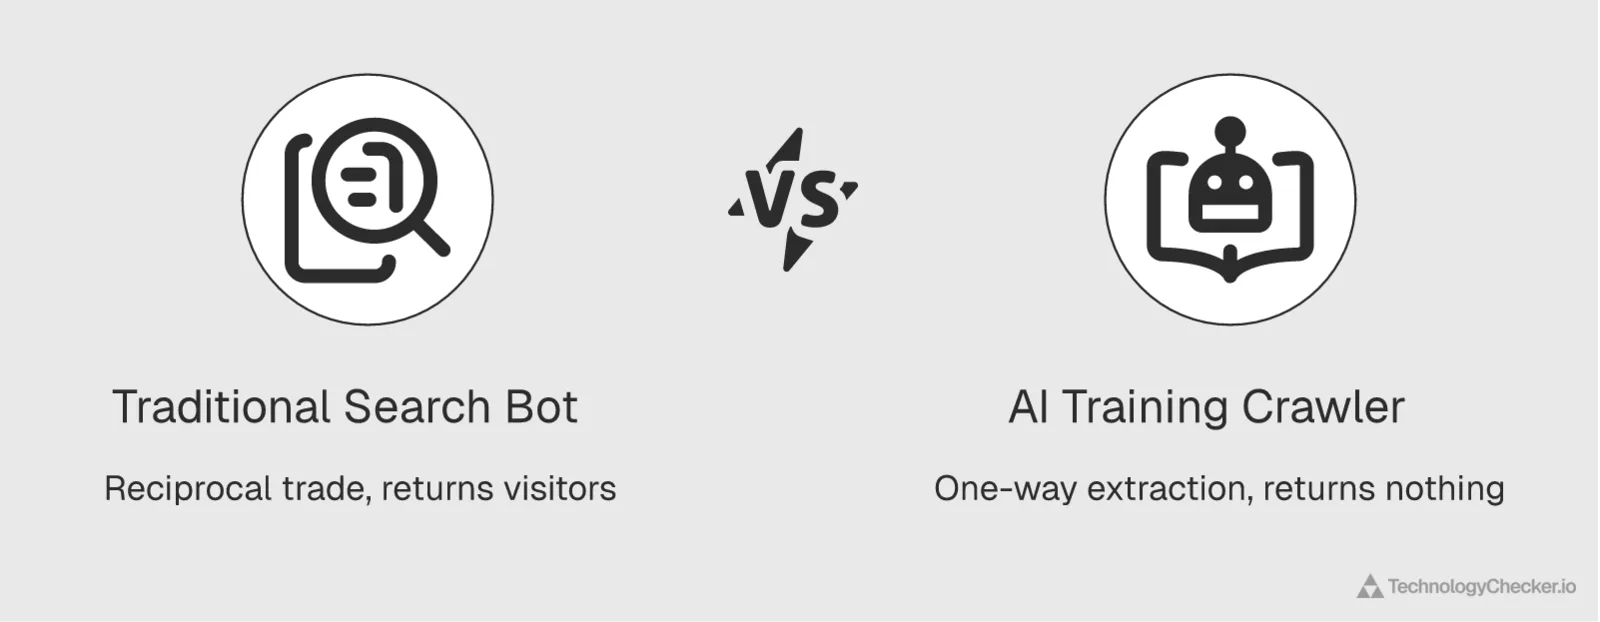
The core difference between an AI crawler and a traditional search bot is the direction of value. Googlebot is a fair trade: it reads your page, indexes it, and sends visitors back through search results. An AI training crawler reads your page and sends nothing back: no visit, no attribution, no ad impression. The data makes the asymmetry concrete: 52.3% of AI crawl traffic is training (no return trip) versus just 2.6% that's a real user fetching your specific page. ⚠️ The 52.3% is superseded by the August update above; preserved as originally published. July 2026 reads 44.54% training against 2.66% User Action. The asymmetry is smaller than we reported and still stark: training outnumbers real-person fetches roughly 17 to 1.
When I was building crawling systems on Google's Search team, the mental model was always reciprocal: a crawler took bandwidth, search sent traffic, and the exchange balanced out over time. That balance is what training crawlers break. They consume the same server resources, sometimes far more because they fetch indiscriminately, without the downstream traffic that made the cost worth paying.
It helps to think of AI crawlers in three tiers, by what they give back:
- Training crawlers, 52.3% of traffic, take your content for model training and return nothing. Pure extraction.
- Search crawlers, 10.1%, can cite you in an AI answer, so there's partial value back and sometimes a click.
- User Action fetches, 2.6%, mean a real person wanted your page right then, the closest thing to a traditional visit.
⚠️ Shares superseded by the August update above; preserved as originally published. On July 2026 data the three tiers read training 44.54%, search 11.57%, User Action 2.66%. The tiers themselves, and what each gives back, are unchanged.
The practical upshot: blanket-blocking "AI bots" throws away the search tier (which can cite you) to stop the training tier (which can't). The two ride in on different user agents, and the policy that makes sense treats them differently. That's exactly where most site owners get it wrong.
What the crawl-purpose split means for site owners
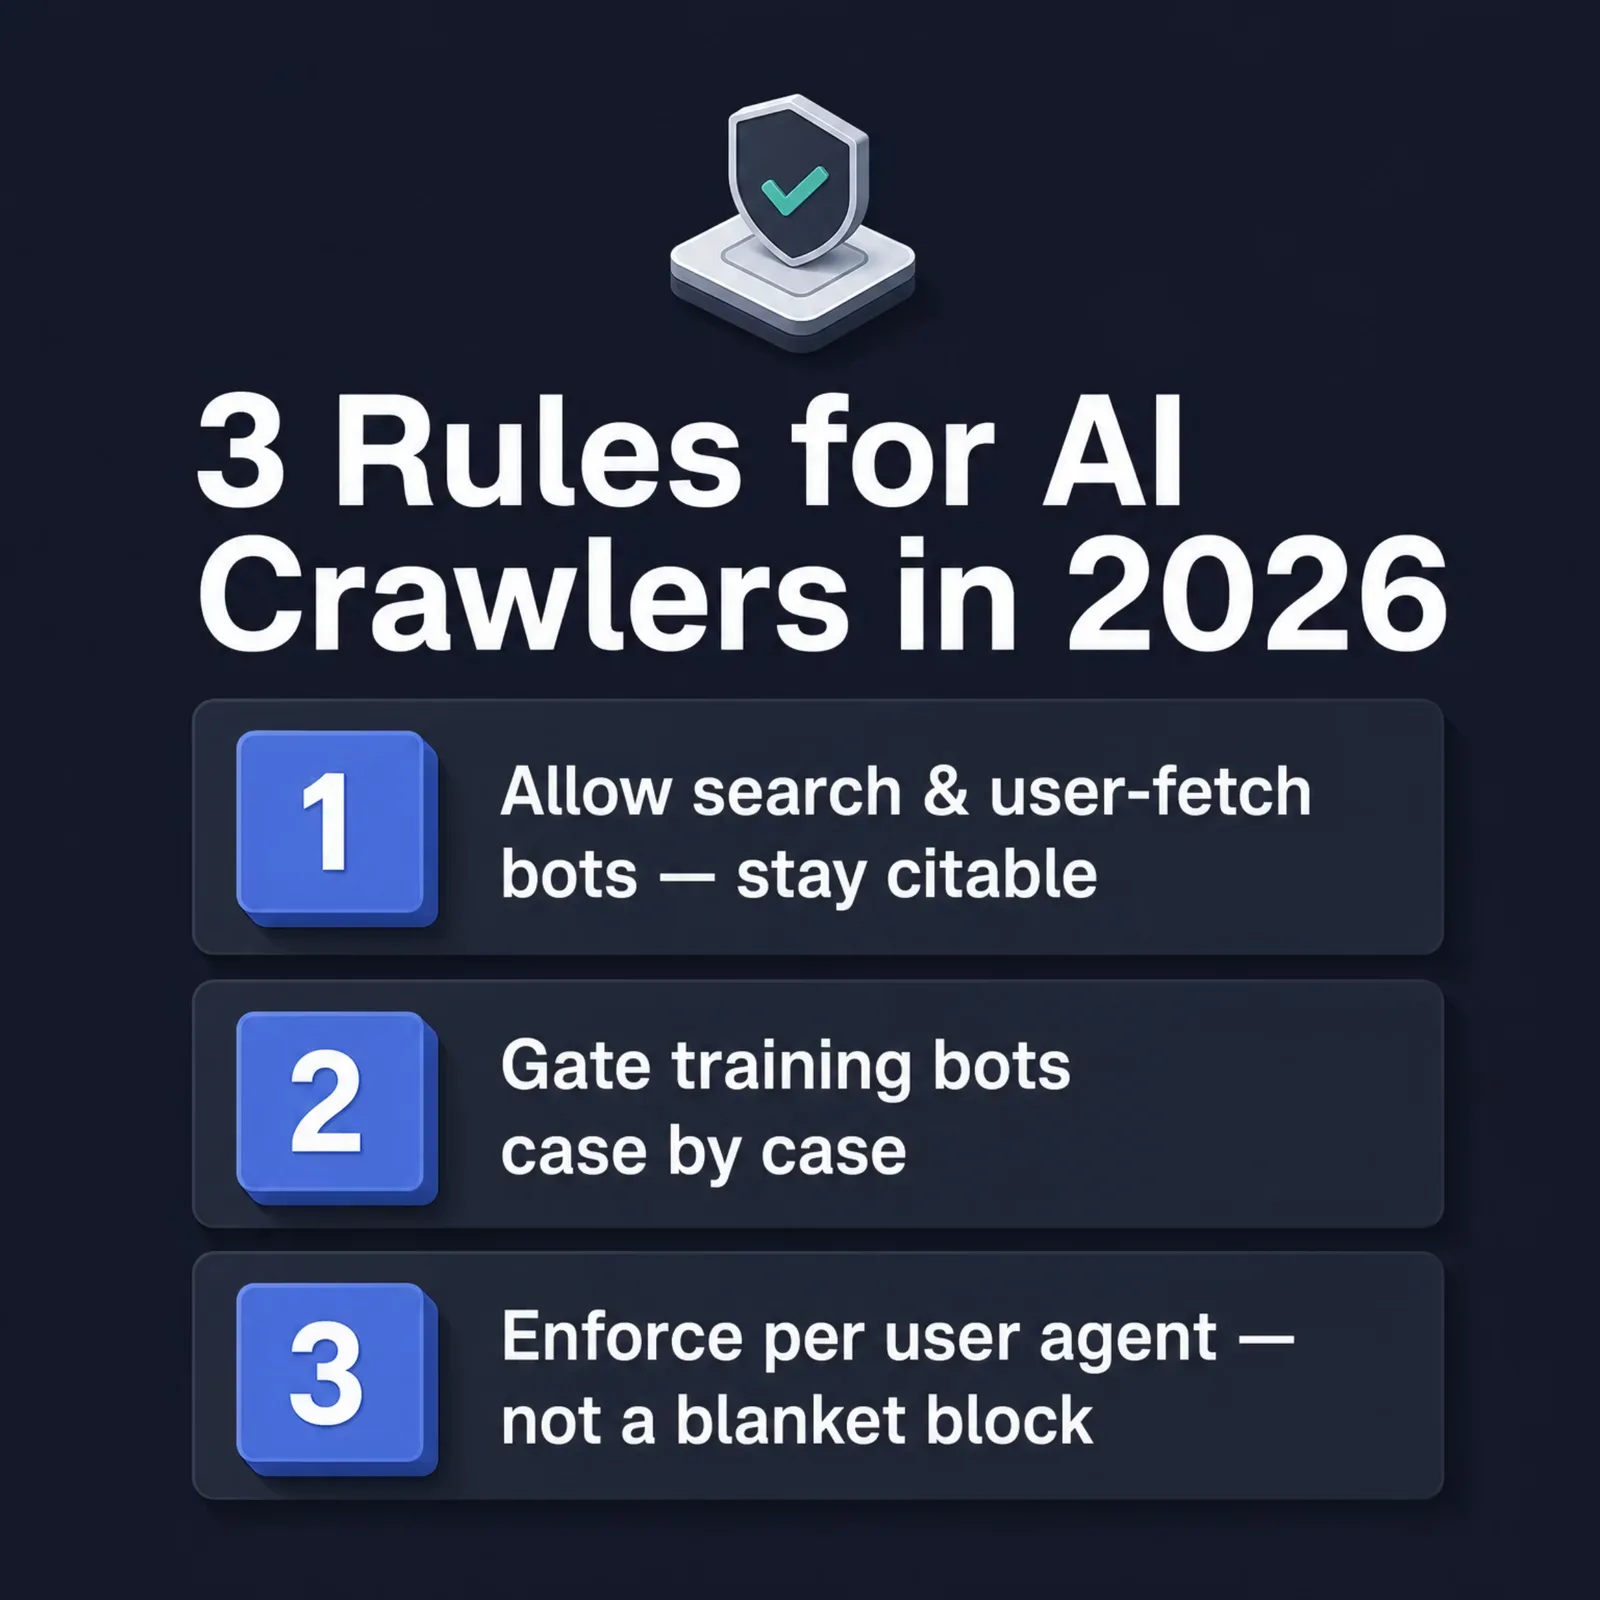
The crawl-purpose split tells you to make a deliberate choice rather than a default one. With training at 52.3% and search at 10.1%, the real decision is whether you want to feed the models (training), be cited by the answer engines (search), or both. Those goals pull in different directions, and the right call depends on what your site is for. ⚠️ Shares superseded by the August update above; preserved as originally published. July 2026 reads training 44.54% and search 11.57%, so the gap narrowed by roughly nine points. The decision the paragraph describes is the same one, with more of your crawl budget now going to the tier that can cite you.
If you sell something, the search tier is your friend and the training tier is a cost to manage. You want AI answer engines citing your product pages when someone asks for a recommendation, which means letting search crawlers in and structuring product data cleanly. Shopping sites already absorb 26.3% of bot crawl traffic, so fighting that entirely means surrendering presence in the AI answers your buyers increasingly trust.
If you publish proprietary research or paywalled analysis, the calculus flips. Training crawlers can absorb your hard-won work into a model that then answers the questions your content was meant to answer, without sending anyone to you. That's the case where restricting training crawlers while keeping search crawlers is the sharper move.
Controlling access is its own topic, and there's a right and wrong way to do it in robots.txt. Block the citation bots by accident and you remove your brand from AI answers entirely. We cover the exact directives, user agents, and pitfalls in our dedicated guide to block AI crawlers in robots.txt, so I won't repeat the how-to here. The one rule to carry over: blocking a training bot does not block the search bot, and the two often share a brand name but not a user agent.
For the bigger picture on how fast AI is moving into everyday business tooling, and the demand pressure behind all this crawling, our AI adoption trends report tracks the curve.
Frequently asked questions
Did AI training crawls ever pass 52% in 2026?
No. We published that figure and it no longer holds. Cloudflare reclassified its crawl-purpose series, moving requests from Training into Mixed Purpose. Re-queried on August 1, 2026, our original 28-day window returns 45.94% training instead of 52.3%. The 2026 high on the corrected series is 47.25%, in June.
What percentage of AI crawler traffic was training in July 2026?
44.54% of AI crawler requests were declared training in July 2026, the largest single purpose (Cloudflare Radar, ai/bots/summary/crawl_purpose). That's down 2.70 points from June's 47.25% and up 8.80 points from 35.74% in July 2025. The trailing 28 days to August 1 read 44.21%.
How much of AI crawling can actually cite your site?
About one request in seven. In July 2026, search-purpose crawling was 11.57% of AI crawler requests and User Action fetches were 2.66%, so 14.23% of AI crawl traffic came from bots that can put your page in front of a person. The other 85.77% returns nothing directly.
What percentage of AI crawlers crawl to train models in 2026?
In July 2026, 44.54% of AI crawler requests were declared training, the largest single purpose, down from 47.25% in June and up from 35.74% in July 2025 (Cloudflare Radar). This answer previously said 52.3%; Cloudflare reclassified that series, and the same window now returns 45.94%.
How do AI crawlers affect shopping and ecommerce sites?
Shopping and general-merchandise sites absorb the heaviest AI crawl load of any industry: 31.58% of AI crawler requests and 25.67% of all verified bot crawl traffic in July 2026 (Cloudflare Radar). The AI-only share rose 2.52 points year over year while the all-bots share fell 2.26 points, so AI crawlers are concentrating on retail even as other bots spread out.
What content do AI crawlers prioritize when crawling?
AI crawlers prioritize fresh, structured, text-rich content such as product catalogs, news, and reference material. In July 2026 the three most-crawled verticals were Shopping (25.67%), Internet and Telecom (20.61%), and Computer and Electronics (19.19%), together about two-thirds of verified bot crawl traffic. Frequently-changing pages with clear, factual text are premium fuel because both training corpora and live AI answers depend on current data.
What file types do AI crawlers request most?
HTML, by a wide margin. In July 2026, 72.52% of what AI crawlers fetched from Cloudflare's network was HTML, the readable text of web pages. The next-largest formats were JSON (6.91%), plain text (5.95%), JavaScript (5.32%), and images (5.31%). Plain text nearly doubled year over year, from 3.01% in July 2025, which fits crawlers reading robots.txt, llms.txt and raw markdown. Clean, semantic HTML is still what AI crawlers mostly consume.
How often do AI crawlers get blocked?
More often than most site owners realize. Across the first half of 2026, 7.9% of AI crawler requests on Cloudflare's network were met with a 403 Forbidden, and another 0.7% were rate-limited with a 429, so roughly one in twelve requests was actively refused. A further 3.5% hit 404 (page not found). The 403 rate is the clearest signal that owners are now enforcing access at the CDN or firewall level, not just asking politely through robots.txt.
Are AI crawlers different from traditional search bots?
Yes. The difference is the value exchange. Googlebot crawls to build a search index that sends visitors back to your page. An AI training crawler, which was 44.54% of AI crawl traffic in July 2026, takes your content into a model and returns no visit and no attribution. Only the search tier (11.57%) and User Action fetches (2.66%) can send anything back. They arrive on different user agents, so they can be governed separately.
Should B2B SaaS sites block AI crawlers?
Not as a blanket policy. Blocking all "AI bots" throws away the search-purpose crawlers (11.57% of traffic in July 2026, up 48% year over year) that can cite you in AI answers, just to stop the training crawlers that can't. Most B2B SaaS sites benefit from allowing search and user-fetch bots while deciding on training bots case by case. The control specifics live in our robots.txt guide.
How do you detect and analyze AI crawler traffic?
AI crawler traffic is identified by user agent and verified against the operator's published IP ranges, the method behind Cloudflare's verified-bot classification. Server logs and a CDN or analytics layer that labels known bots will show you which purposes (training, search, user-fetch) are hitting your site and how often. Verifying the IP, not just trusting the user-agent string, is what separates a real GPTBot from a spoofed one, and the gap is large: HUMAN Security found 5.7% of requests carrying an AI crawler user agent were spoofed across 16 crawlers, rising to 16.7% for ChatGPT-User specifically.
Why don't my server logs match these AI crawler numbers?
Because they count different things. Every figure in this report is a share of verified AI crawler requests, meaning Cloudflare confirmed each bot's identity against the operator's published IP ranges before counting it. Your access logs group by user-agent string, which any client can set to anything it likes. HUMAN Security measured 5.7% of requests carrying an AI crawler user agent as spoofed across 16 crawlers, and 16.7% for ChatGPT-User. On a small site the gap is wider still, because there is far less genuine crawling to dilute the forged traffic: one independently measured server logged 62.1% of checkable AI crawler claims as unconfirmable against the vendors' own address lists. Verify a sample against the published IP ranges before trusting your own totals.
Do AI crawlers respect robots.txt files?
Most major, verified AI crawlers honor robots.txt, but compliance isn't universal and some bots use stealth or undeclared agents. Treat robots.txt as the first layer, not a hard wall, and pair it with CDN or firewall rules if you truly need to block a crawler. Remember that a robots.txt block aimed at a training bot won't stop a separate search bot from the same company unless you name its user agent too.
What is the impact of AI crawlers on SEO and AI visibility?
AI crawlers split your visibility into two tracks. Training crawls (44.54% in July 2026) feed the models behind AI answers but send no direct traffic. Search crawls (11.57%, the fastest-growing purpose) decide whether you get cited in those answers. Classic SEO still wins you the click from search results; making content easy for search-purpose crawlers to quote is what wins you a mention inside the AI answer. That's increasingly a separate, parallel goal.
What are the trends in AI crawler behavior for 2026?
Search crawling is the clearest one: 7.79% of AI crawler requests in July 2025, 10.39% in June 2026, 11.57% in July 2026. Training peaked at 47.25% in June and fell to 44.54% in July, so its climb has stopped. Mixed purpose kept shrinking, 54.61% to 39.99% year over year. Operators are still splitting do-everything crawlers into single-purpose ones, which is what makes per-purpose access policy possible.
How has AI crawler behavior changed since 2025?
The purpose mix has been rewritten in a year. Comparing full calendar quarters, training grew from 28.7% of AI crawl traffic in Q2 2025 to 44.9% in Q2 2026, while "Mixed Purpose" crawling, the single largest category a year ago, fell from 65.1% to 43.0%. Search-purpose and User Action crawling both roughly doubled off small bases (4.6% to 9.1% and 1.1% to 2.5%). What AI crawlers fetch shifted too: HTML's share of their requests eased from 83.7% to 71.3% as they pulled more JSON, JavaScript, and images. The through-line is operators unbundling do-everything bots into single-purpose ones, with training absorbing most of the freed-up volume. These are shares of verified AI-bot requests across Cloudflare's network. At month granularity the same shift reads training 35.74% to 44.54% and mixed purpose 54.61% to 39.99%, July 2025 against July 2026.

CTO
15+ years of experience
David is the CTO of TechnologyChecker, responsible for the engineering and architecture behind the platform's crawling infrastructure.
- MEng Computer Science, University of Edinburgh
- AWS Solutions Architect Professional
- Contributor, Open Source Crawling Frameworks
Never miss our research