Mobile vs Desktop in the UK: We Filtered Out the Bots — Here's the Real Human Split (2026)
UK web traffic is 56% desktop, 43% mobile in 2026 by Cloudflare Radar, but filter out bots and real humans are mobile-first. See the UK device data.
Published •18 min read
In 2026, desktop generates about 56% of UK web traffic and mobile about 43%, according to Cloudflare Radar (28 days to 22 June 2026). But that all-traffic figure is inflated by bots. Filter to real human visitors and the UK flips mobile-first, with 56% of human requests coming from phones.
Key findings from our analysis of Cloudflare Radar data (28 days to 22 June 2026):
- UK all-traffic splits 56.3% desktop / 43.1% mobile — a desktop majority on the raw numbers.
- Filter to likely-human traffic and the UK is mobile-first: 56.4% mobile vs 43.6% desktop.
- UK bot traffic is 85.0% desktop, which is what drags the all-traffic figure toward desktop.
- Britain runs more mobile than the world average: UK mobile 43.1% vs 39.8% globally.
- Apple leads UK mobile: iOS 25.8% of requests vs Android 23.4% — the reverse of the global pattern.
- The Chrome family takes ~54% of UK browser traffic, the Safari family ~27%.
The honest answer to "is the UK mobile or desktop?" depends on what you count. Most pages that try to answer it pick one dataset and stop there. We pulled live Cloudflare Radar data for the United Kingdom, then triangulated it against StatCounter, and the gap between the two tells you more than either number alone. This post walks through the device split, why two trusted sources disagree, how bots distort the picture, and what it all means for the device market share you should design around.
Mobile vs desktop in the UK: the 2026 numbers
In Cloudflare Radar's data for the 28 days to 22 June 2026, desktop devices generated 56.3% of UK web requests and mobile devices 43.1%, with the remaining 0.6% on other device types. That is the all-traffic view: every HTTP request hitting Cloudflare's network and resolver, bots included. StatCounter, which measures a different population, puts the split much closer to even.
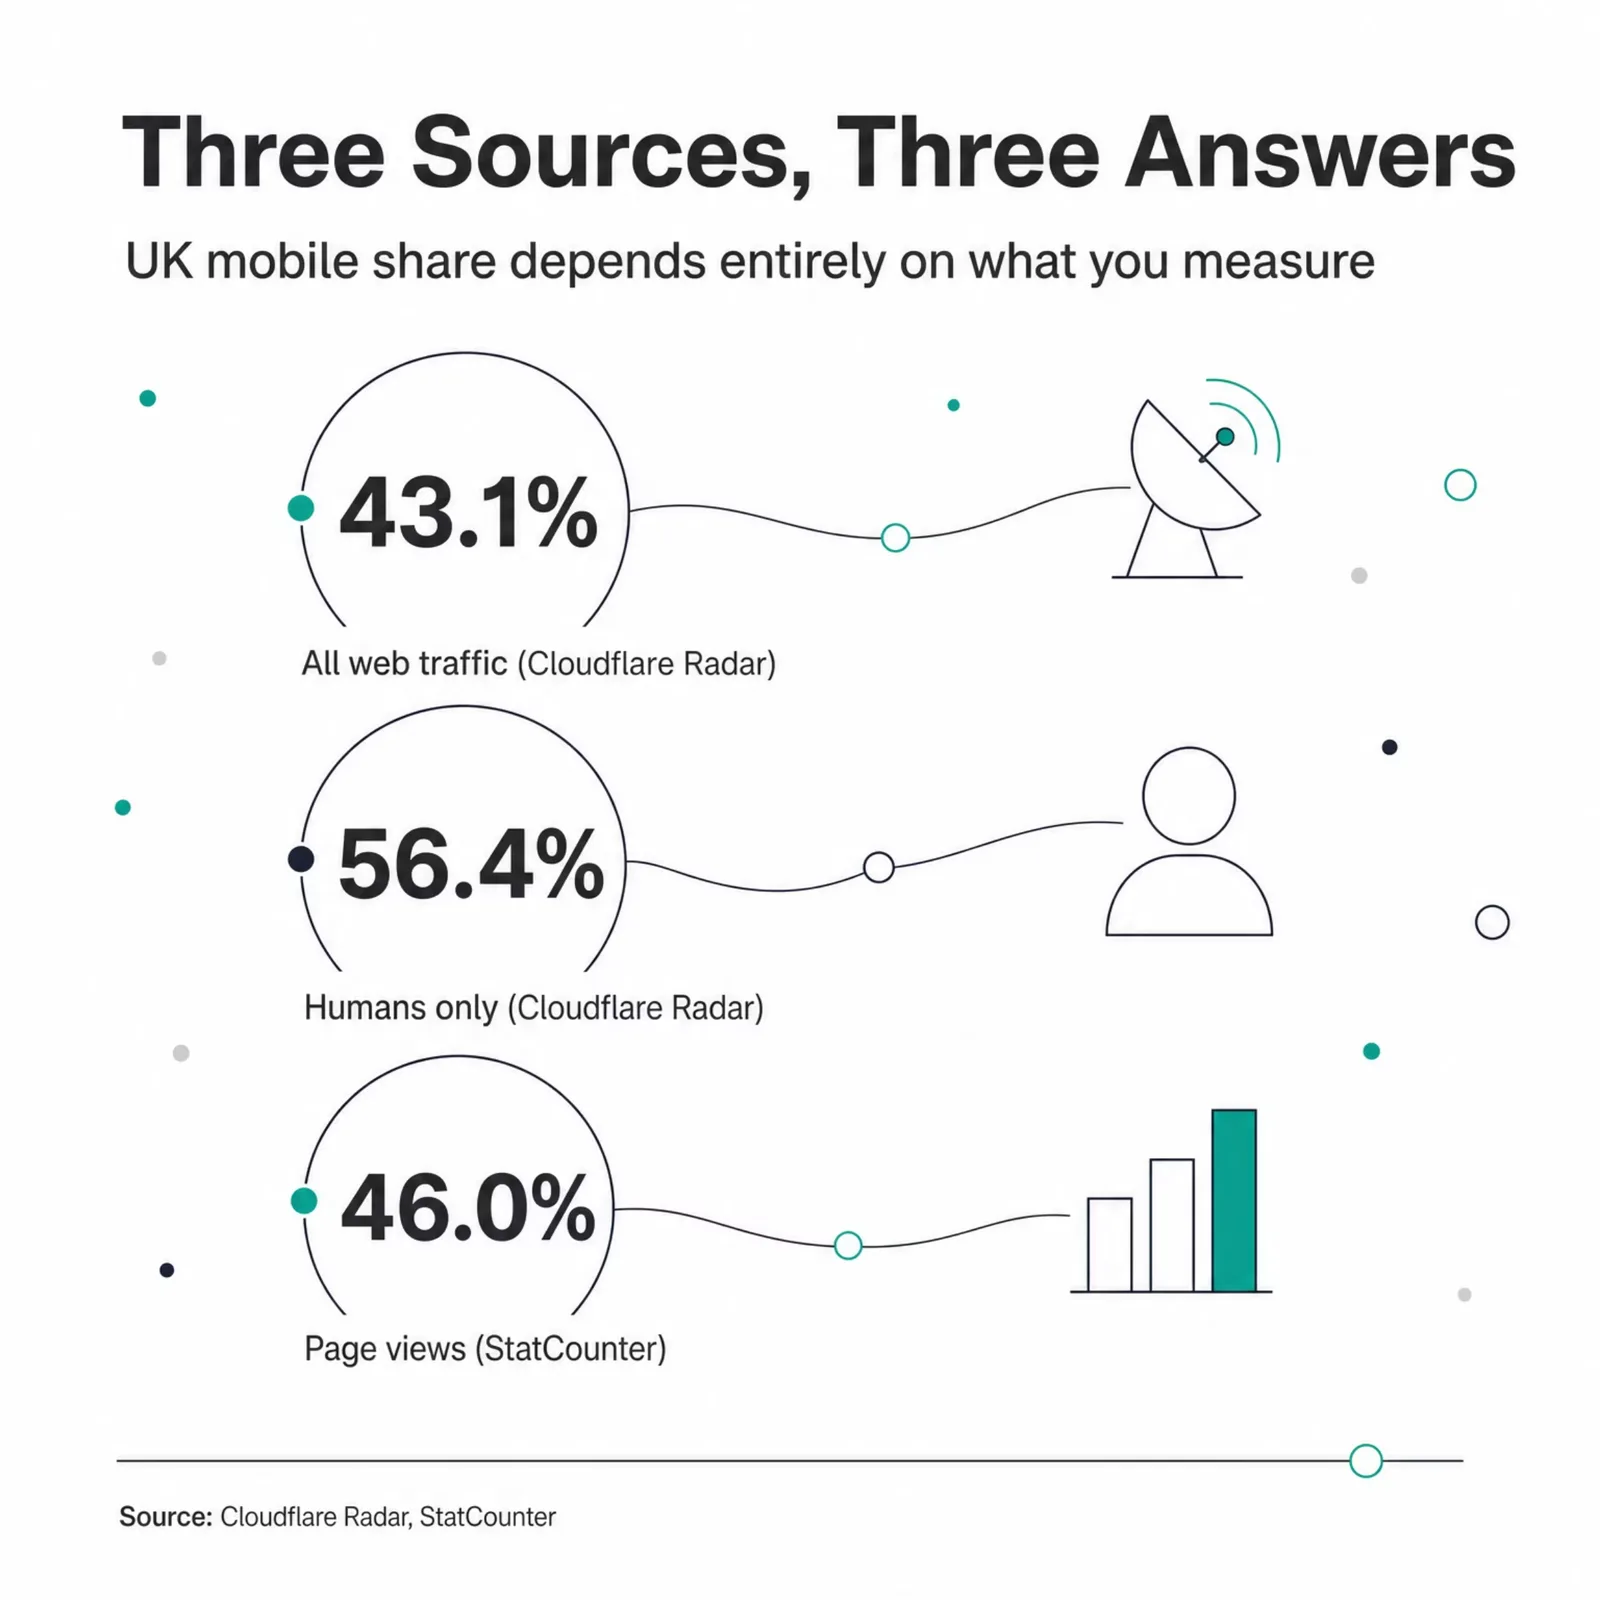
Here are the three measurements side by side. They disagree by design, and the next section explains why.
| Source / Method | Desktop | Mobile | Notes |
|---|---|---|---|
| Cloudflare Radar — all HTTP traffic (incl. bots) | 56.3% | 43.1% | 28 days to 22 June 2026; 0.6% other; no separate tablet |
| Cloudflare Radar — likely-human traffic only | 43.6% | 56.4% | Bot-filtered; the UK flips mobile-first |
| StatCounter — page views, member sites | 49.75% | 46.04% | May 2025–May 2026; tablet counted separately at 4.2% |
Three credible sources, three different splits. None is wrong. They measure different things: all traffic versus humans versus tracked page views. StatCounter's two-way "Desktop vs Mobile" view for the UK actually shows the two near level, which lines up with the bot-filtered Radar number more than the raw one.
The figure you quote should match the question you're answering. Counting machines and crawlers? Desktop wins. Counting people on the UK web right now? Mobile wins, and it isn't close.
Why two trusted sources disagree on the UK device split
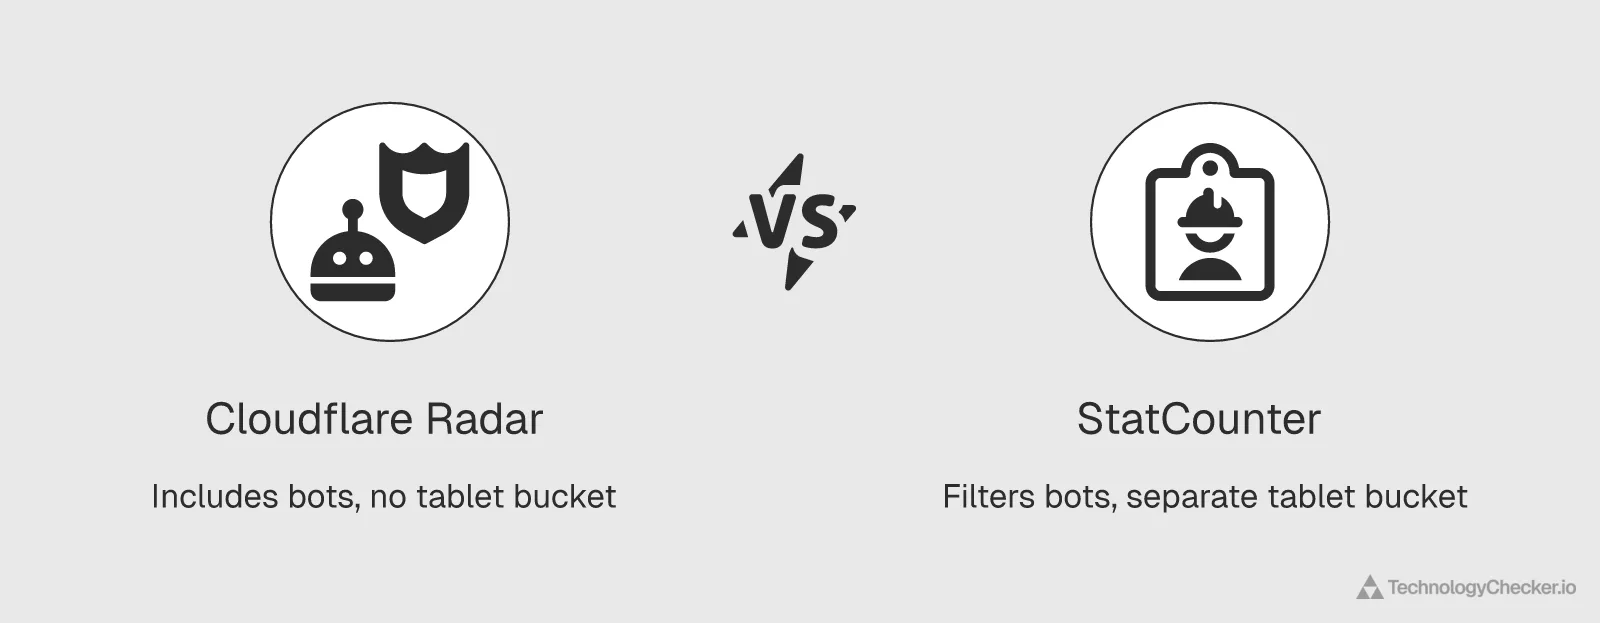
Cloudflare Radar and StatCounter report different UK device shares because they sample different populations with different methods. Cloudflare Radar measures all HTTP requests across Cloudflare's CDN and its 1.1.1.1 resolver, an estimated 20 to 25% of all web traffic. It buckets requests into desktop, mobile, and other (no separate tablet), and it includes automated traffic. StatCounter measures page views via a tracking code embedded on roughly 1.5 million member sites, separates tablet into its own category, and skews toward content publishers who run that code.
Those design choices pull the numbers apart in predictable ways:
- Bots count on Radar, not on StatCounter. Radar logs every request, including the crawlers and scrapers that mostly present as desktop. StatCounter's JavaScript tag fires on real page renders, so most non-human traffic never registers.
- Different surfaces. Radar sees raw network and DNS traffic across millions of sites. StatCounter sees rendered page views on the specific sites running its code.
- Tablet placement. Radar folds tablets into other categories; StatCounter breaks tablet out (4.2%), which shaves a few points off both desktop and mobile in its three-way view.
radar/http for location GB, 28 days to 22 June 2026, normalised as share of HTTP requests. We cite shares, not absolute counts, because Radar reports percentages of the traffic it sees.Neither method is the "true" number, because there isn't one. A bank optimising a logged-in dashboard cares about the human, tracked-pageview view. A security team sizing crawler load cares about the all-traffic view. Knowing which lens produced a stat is what stops you from designing for the wrong audience. For the bigger picture on automated traffic, see our bot traffic statistics.
Humans vs bots: why the UK is more mobile-first than it looks
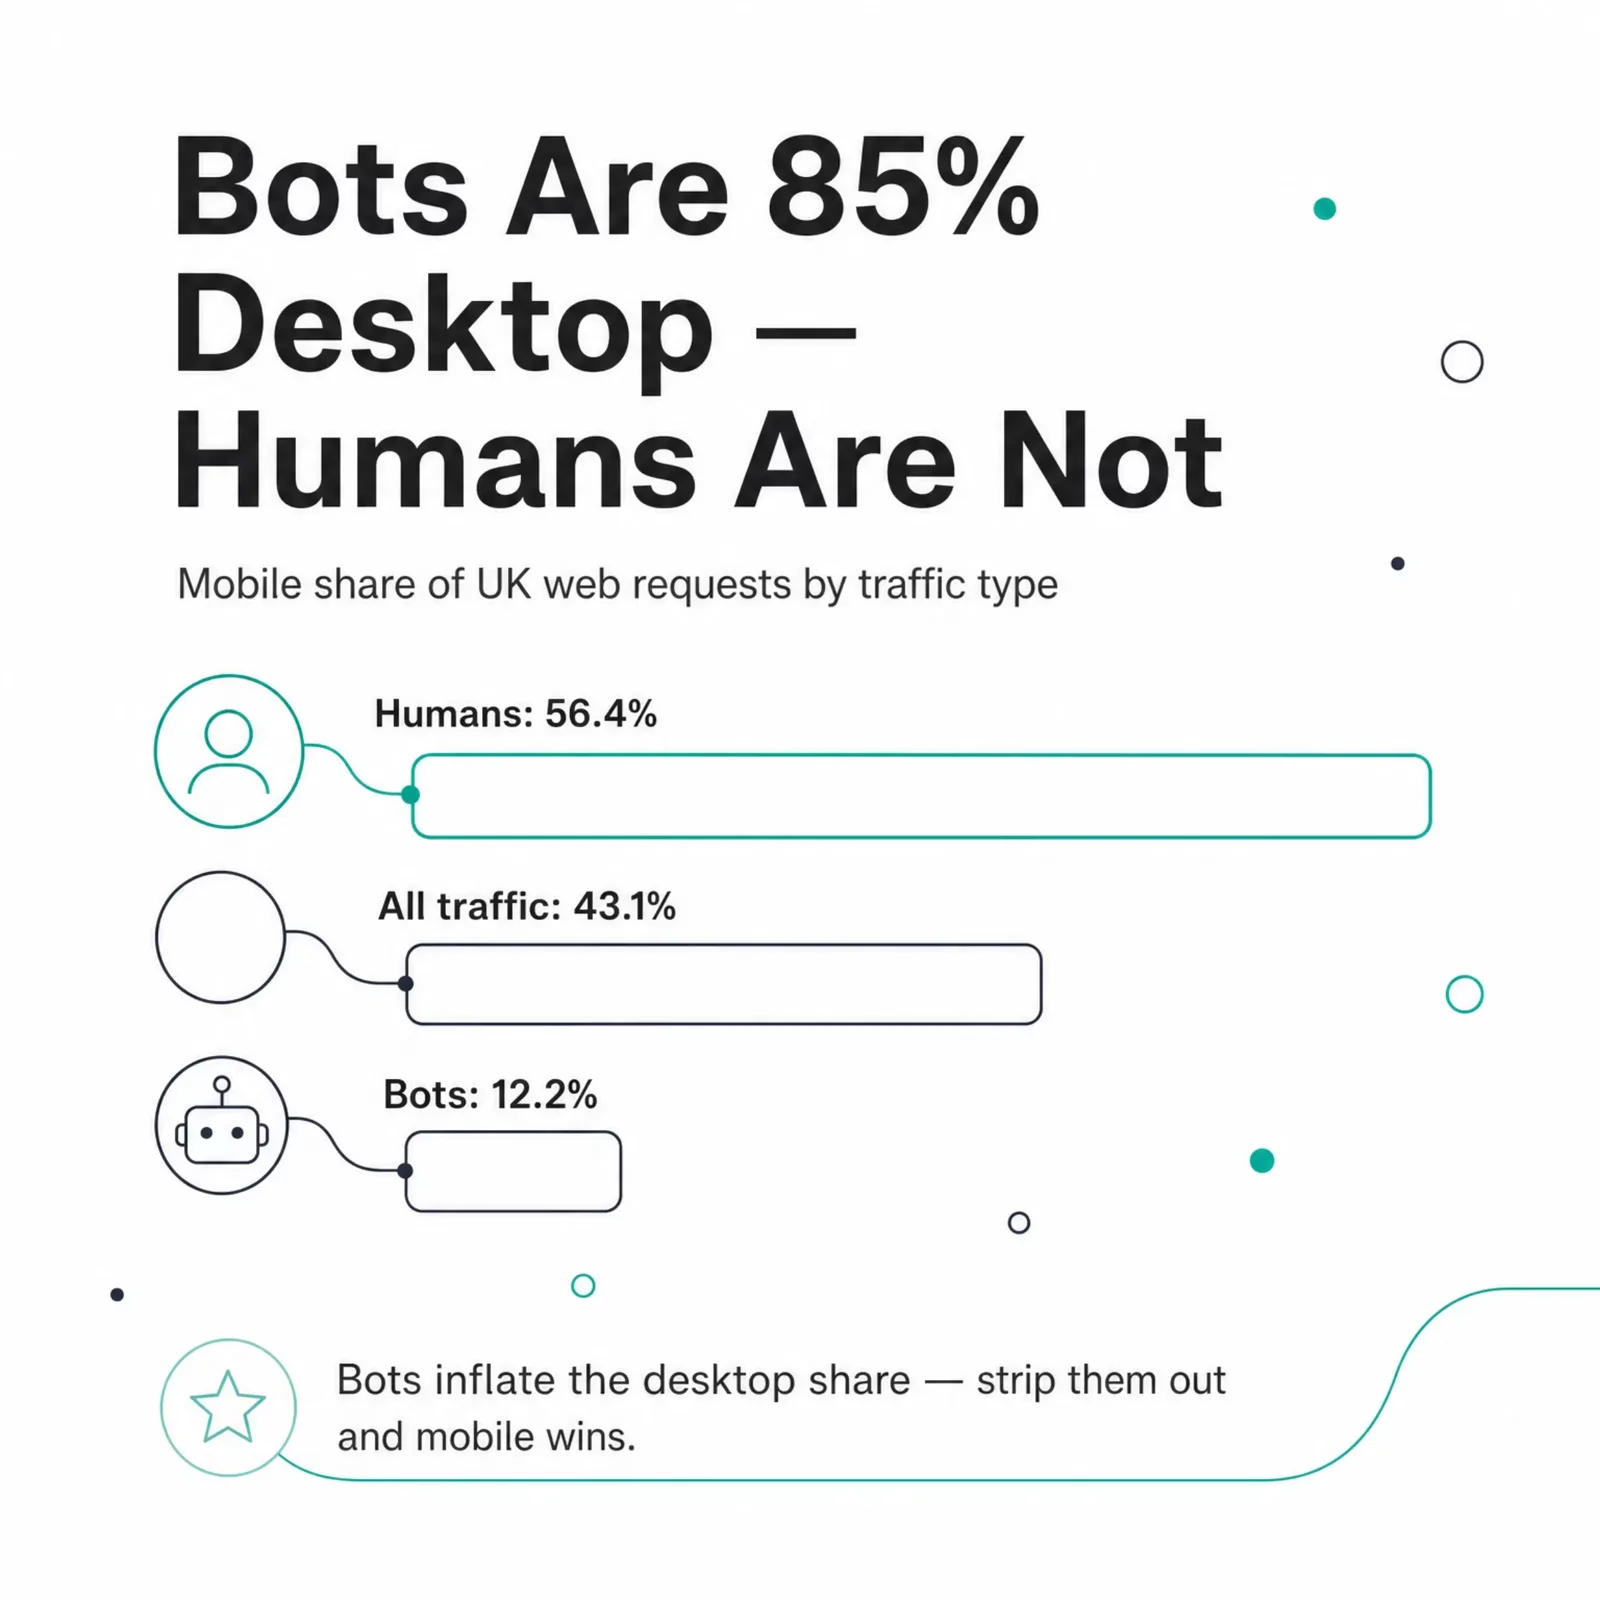
Filtered to likely-human traffic, the UK is mobile-majority: 56.4% of human web requests came from mobile versus 43.6% from desktop (Cloudflare Radar, June 2026). That is the opposite of the all-traffic headline, and the reason is the third bar in the chart above. UK bot traffic is overwhelmingly desktop: 85.0% desktop versus 12.2% mobile. Crawlers, scrapers, monitors, and headless browsers almost all identify as desktop user agents, so they pile weight onto the desktop side of the raw number.
When you blend a mobile-heavy human population with a desktop-heavy bot population, the average lands at desktop-majority even though most actual people are on phones. That's the trap in any single all-traffic stat.
| Traffic type (UK) | Mobile share | Desktop share |
|---|---|---|
| Likely-human | 56.4% | 43.6% |
| All traffic | 43.1% | 56.3% |
| Likely-automated (bots) | 12.2% | 85.0% |
In our analysis of Cloudflare Radar data, this human-versus-bot gap is the single most useful thing the dataset reveals about the UK, and it's exactly what a one-source page misses. If you're deciding where to spend design and engineering time, the human split is the one that matters. Build for the phone first.
How UK mobile and desktop usage shifts by season
UK mobile usage is seasonal. Over the past 52 weeks, mobile briefly drew level with desktop during the 2025 Christmas fortnight and again over the late-August summer break, then desktop reclaimed the lead on every working week. The pattern is intuitive: people swap the work laptop for a phone on the sofa during holidays, and pick it back up at a desk come Monday.
The 12-week trajectory below shows the device split moving week to week. Watch the working-week desktop lead of roughly 55 to 57% across Q1 and Q2 2026.
UK device share by traffic type over the last 12 weeks (Cloudflare Radar, GB). Holiday weeks compress the gap; working weeks widen it back toward desktop.
UK mobile vs desktop: 2025, Q1 2026, Q2 2026
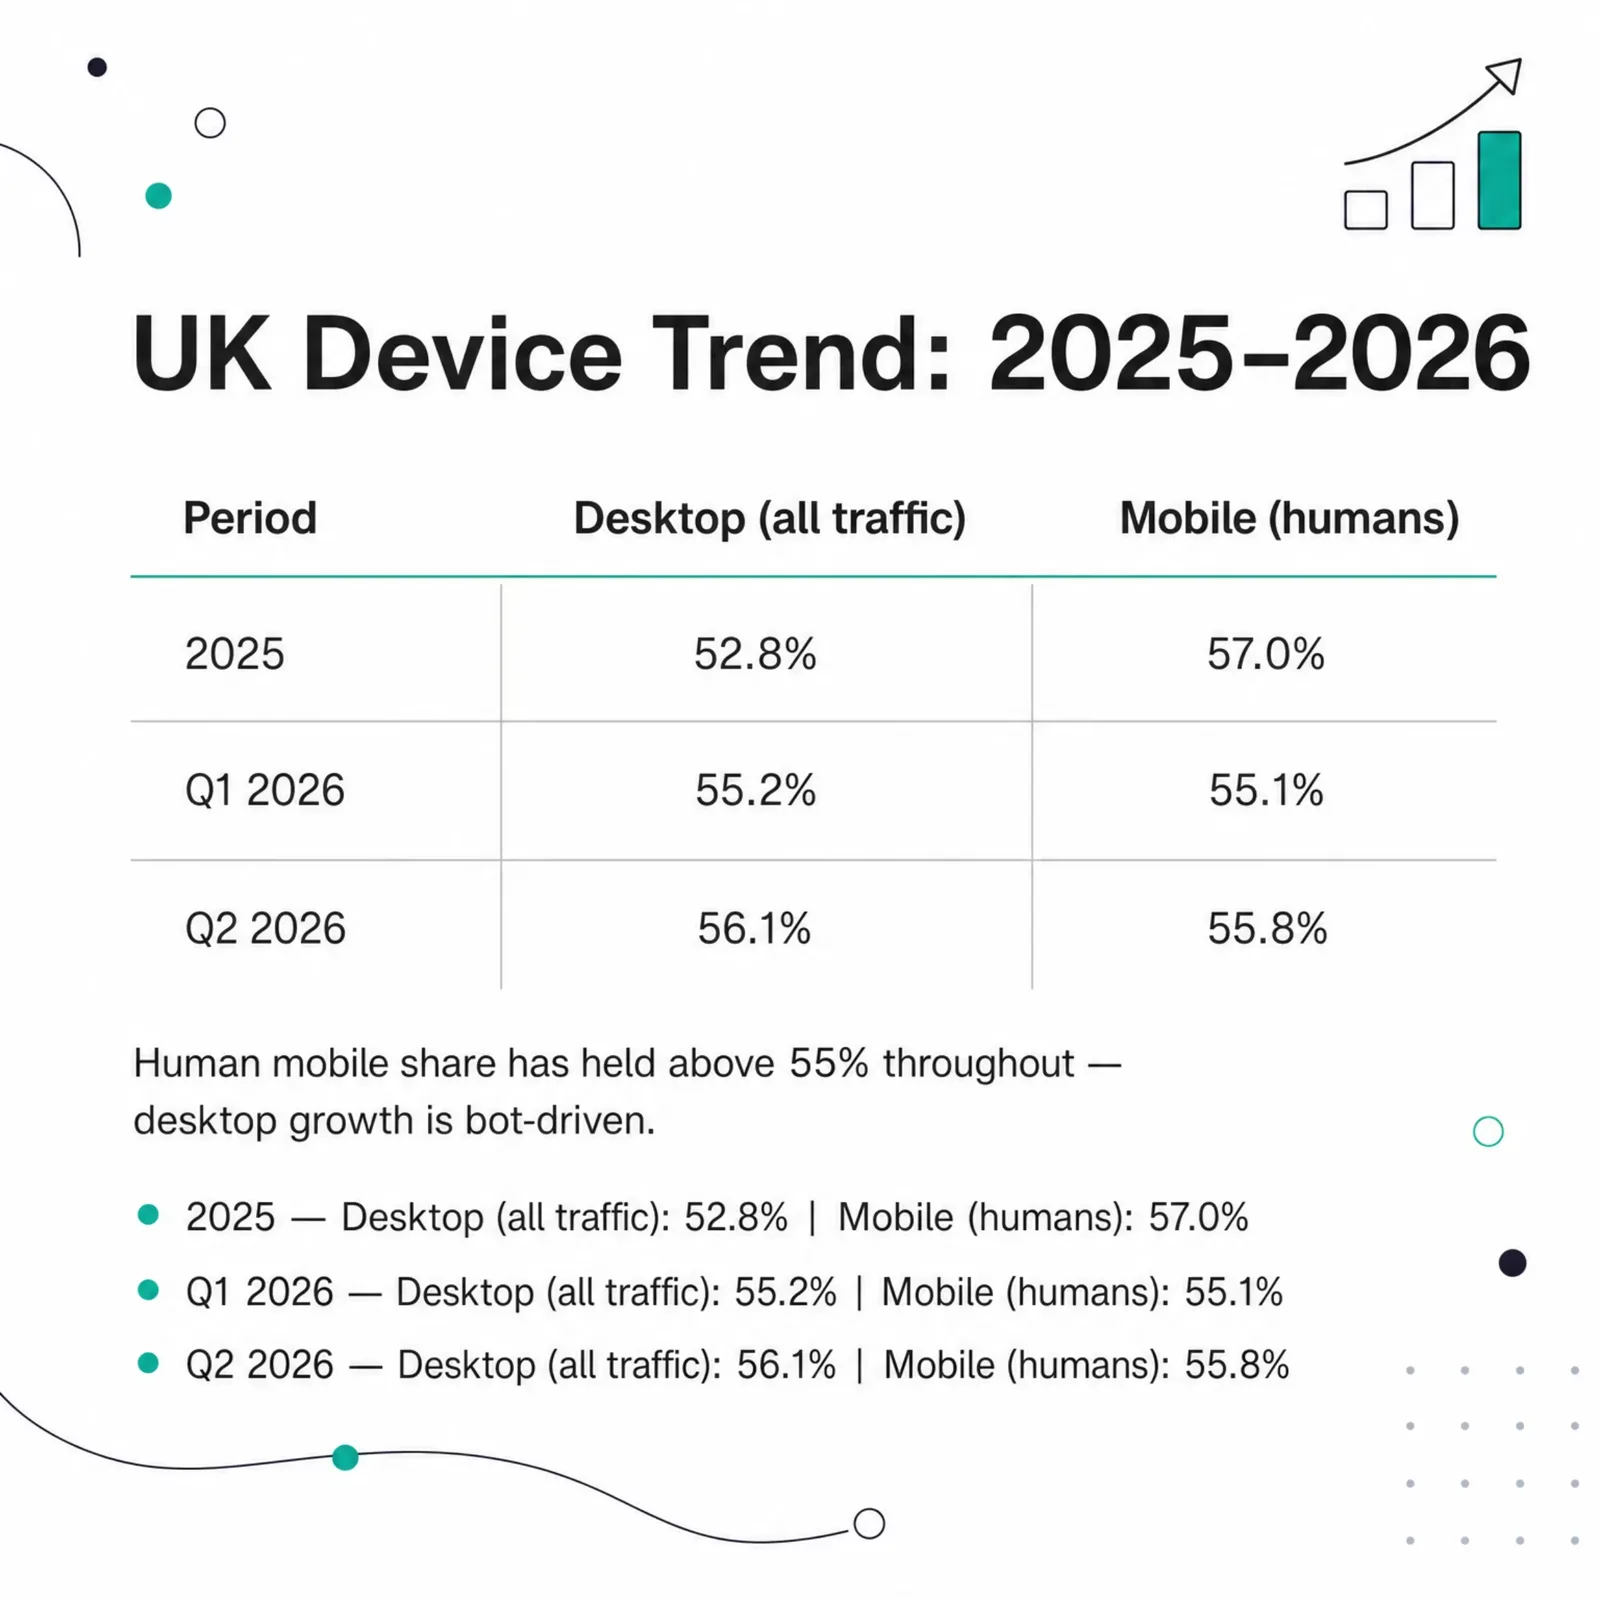
Zoom out from the weekly noise and the same lesson holds across the year. On Cloudflare Radar's all-traffic measure, UK desktop share climbed from 52.8% across 2025 to 56.1% in Q2 2026 (to 22 June). Filtered to real humans, though, mobile held the majority the whole way, from 57.0% in 2025 to 55.8% so far in Q2 2026.
| Period | Desktop (all traffic) | Mobile (all traffic) | Mobile (humans only) |
|---|---|---|---|
| 2025 (full year) | 52.8% | 47.2% | 57.0% |
| Q1 2026 (Jan–Mar) | 55.2% | 44.8% | 55.1% |
| Q2 2026 (to 22 Jun) | 56.1% | 43.7% | 55.8% |
Two trends hide in that table. All-traffic desktop share gained about three points in eighteen months, tracking the rise of desktop-presenting bots and crawlers, not people returning to laptops. Human mobile share eased slightly from its 2025 high but never surrendered the lead, holding in the mid-50s. The honest read is stability: UK people have been, and remain, mobile-first.
One caveat on reading any live device chart: the most recent partial week can look wildly desktop-heavy simply because it holds only a day or so of data. Anchor on the rolling 28-day summary, not the final point on the line.
UK vs the world: how mobile-heavy is Britain?
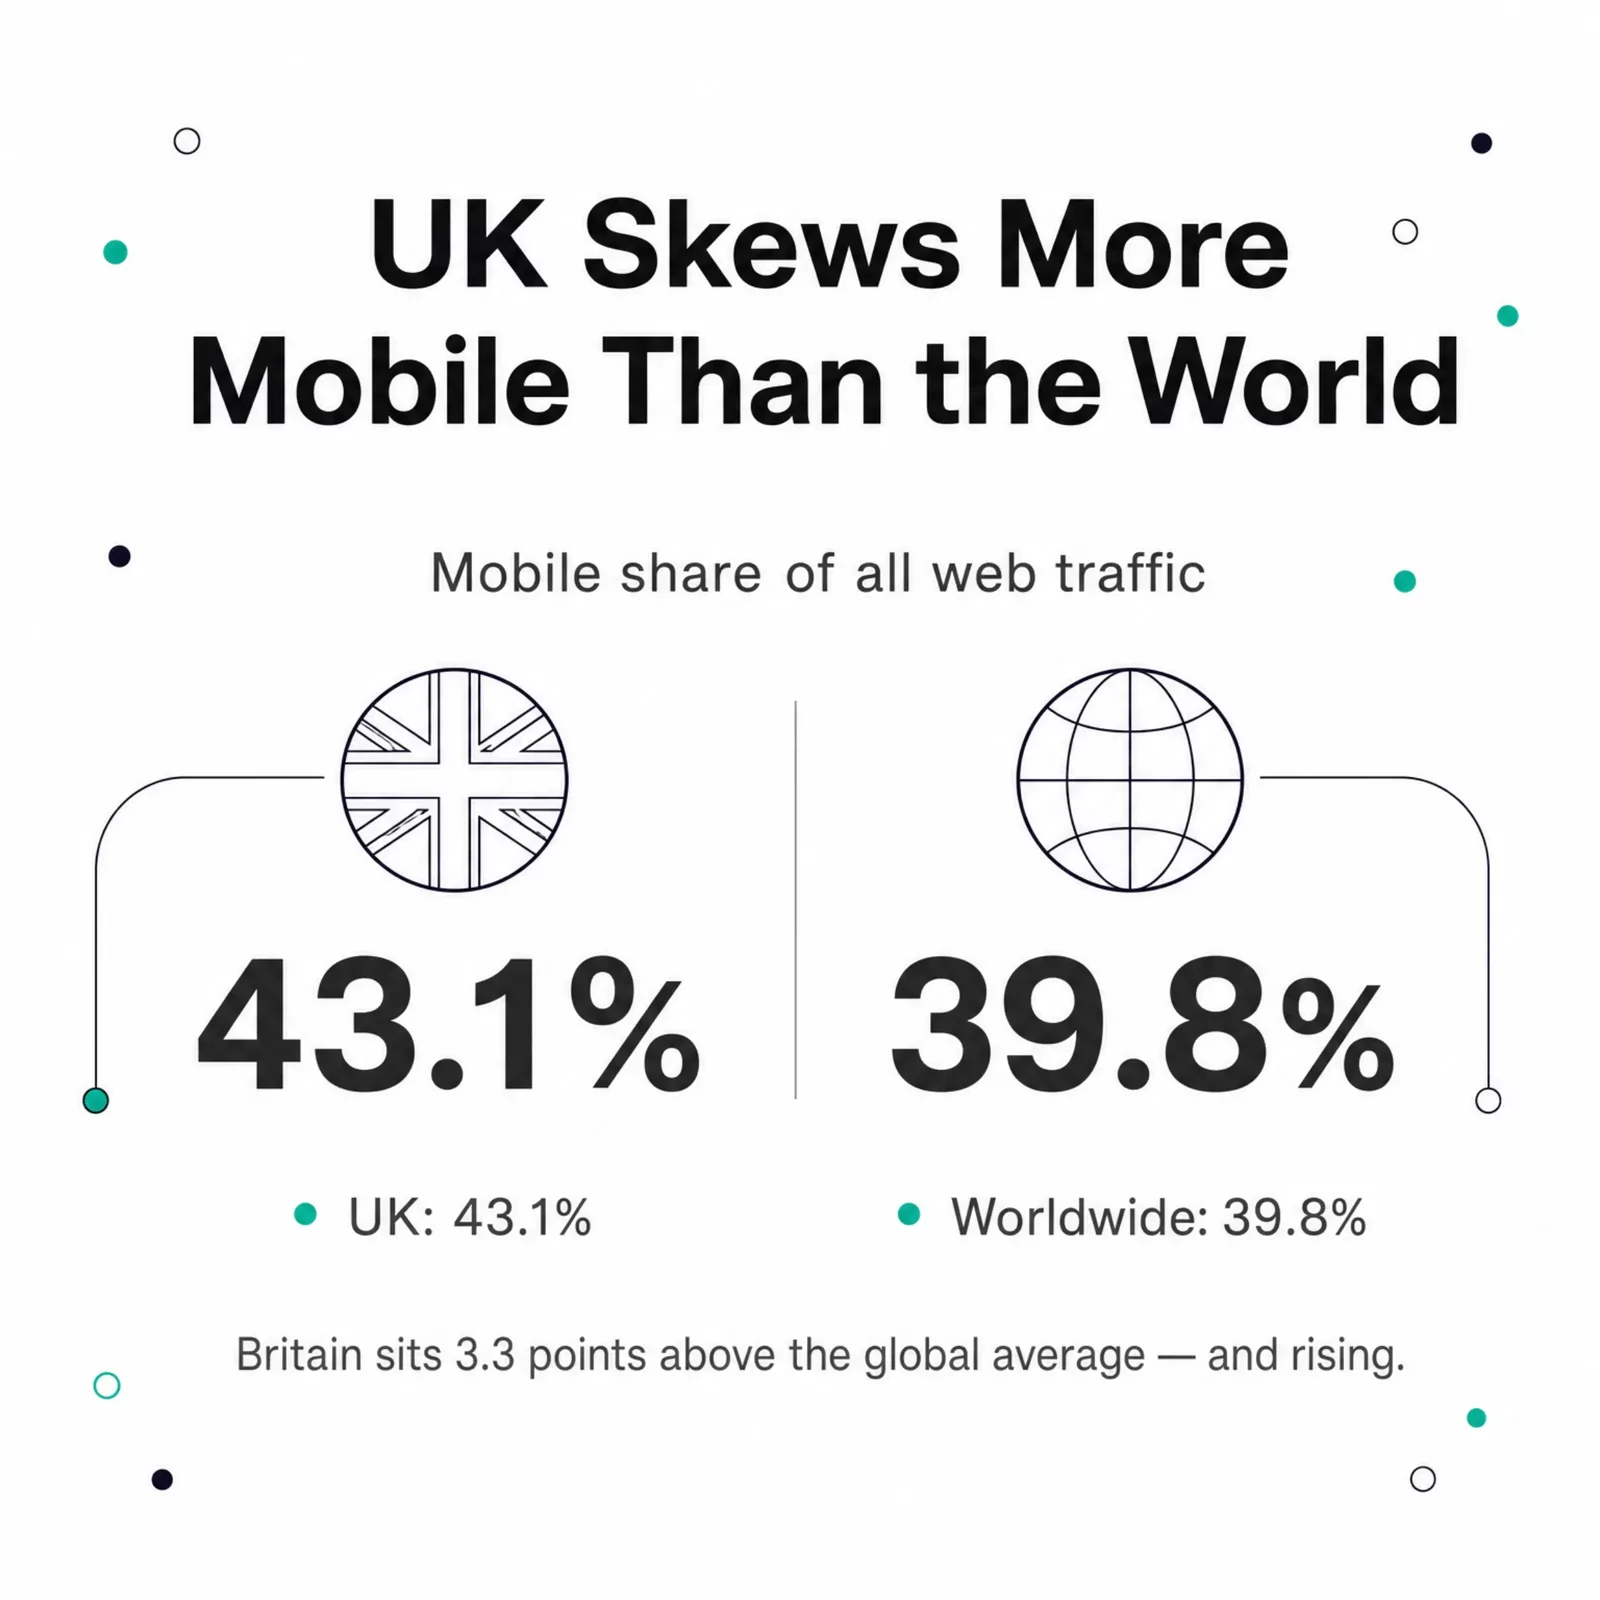
UK web traffic skews more mobile than the global average. UK mobile share was 43.1% versus 39.8% worldwide on Radar's all-traffic measure (Cloudflare Radar, 28 days to 22 June 2026). On the same basis, UK desktop sits at 56.3% against roughly 60% globally. Britain leans a few points more toward the phone than the planet as a whole.
| Measure (all traffic) | United Kingdom | Worldwide |
|---|---|---|
| Mobile share | 43.1% | 39.8% |
| Desktop share | 56.3% | ~60% |
That 3.3-point mobile gap is modest but consistent, and it widens once you bot-filter both populations. High smartphone penetration and fast mobile networks make the UK a mobile-forward market by Western European standards, even if it isn't as mobile-dominant as emerging markets where phones are the primary or only access device. For how that varies country by country, see our breakdown of mobile internet usage by country.
Operating systems: iOS vs Android on the UK web
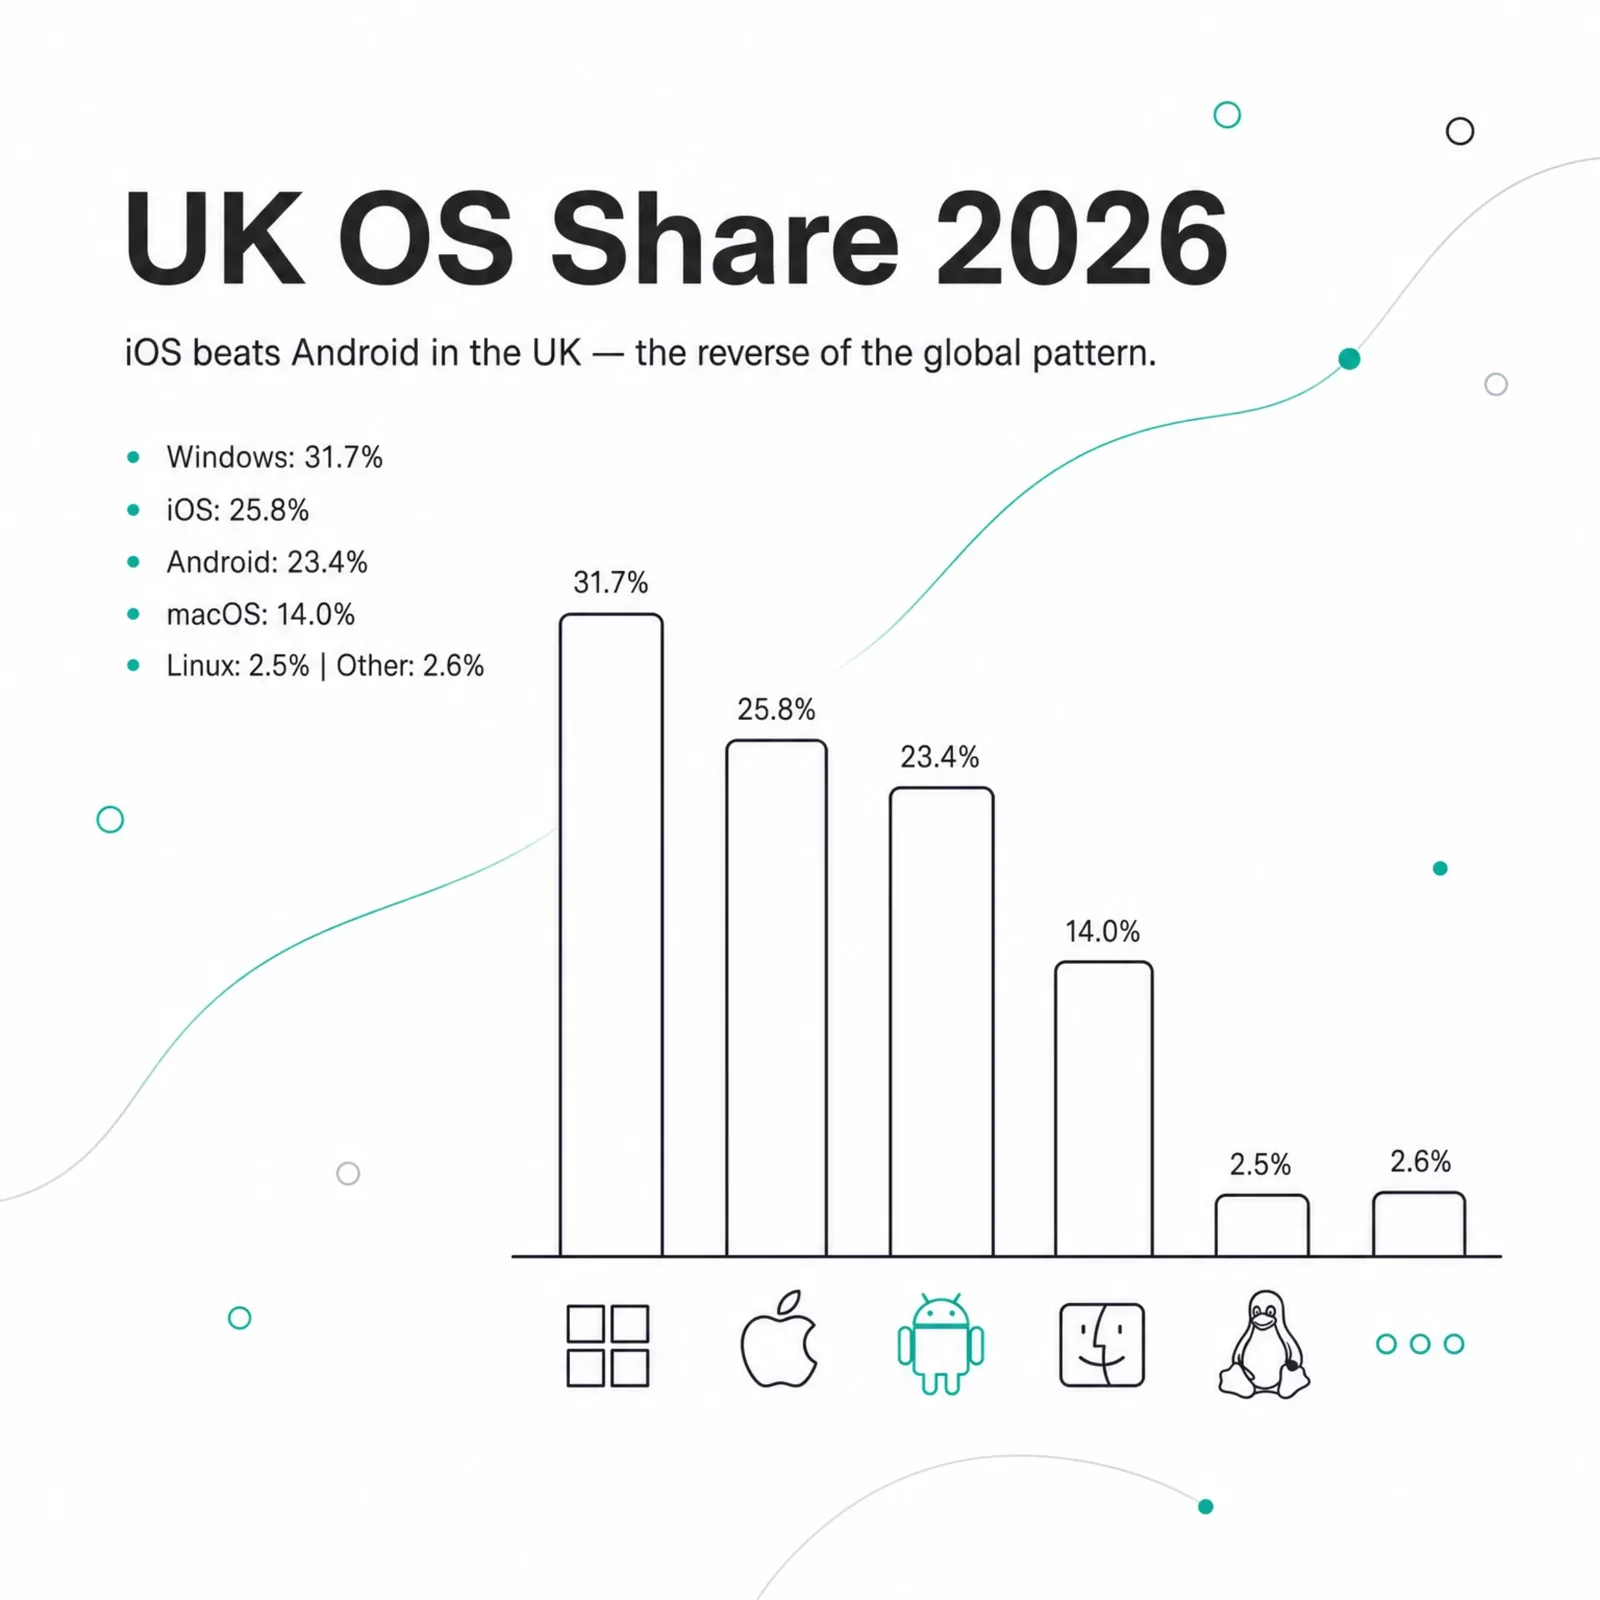
Windows is still the UK's single most common operating system for web requests at 31.7%, ahead of iOS (25.8%) and Android (23.4%), with macOS at 14.0% and Linux at 2.5% (Cloudflare Radar, June 2026). Group them by type and it's a near-perfect tie: desktop operating systems (Windows, macOS, Linux, ChromeOS) total about 49.3%, mobile operating systems (iOS, Android) about 49.2%. The device-type and OS views agree.
| Operating system (UK) | Share of web requests |
|---|---|
| Windows | 31.7% |
| iOS | 25.8% |
| Android | 23.4% |
| macOS | 14.0% |
| Linux | 2.5% |
The standout is the Apple gap on mobile: iOS outweighs Android on the UK web, 25.8% to 23.4%. Globally Android leads handset volume by a wide margin, so the UK reversal reflects both high iPhone ownership and the fact that iPhone users tend to browse the web more actively. Add macOS (14.0%) to iOS and Apple platforms account for roughly 40% of all UK web requests. That's a large, high-intent slice worth testing against, especially given Safari ships as the default on every one of those devices. We unpack the browser side of that in our Safari market share analysis.
Browsers: Chrome and Safari's share of UK traffic
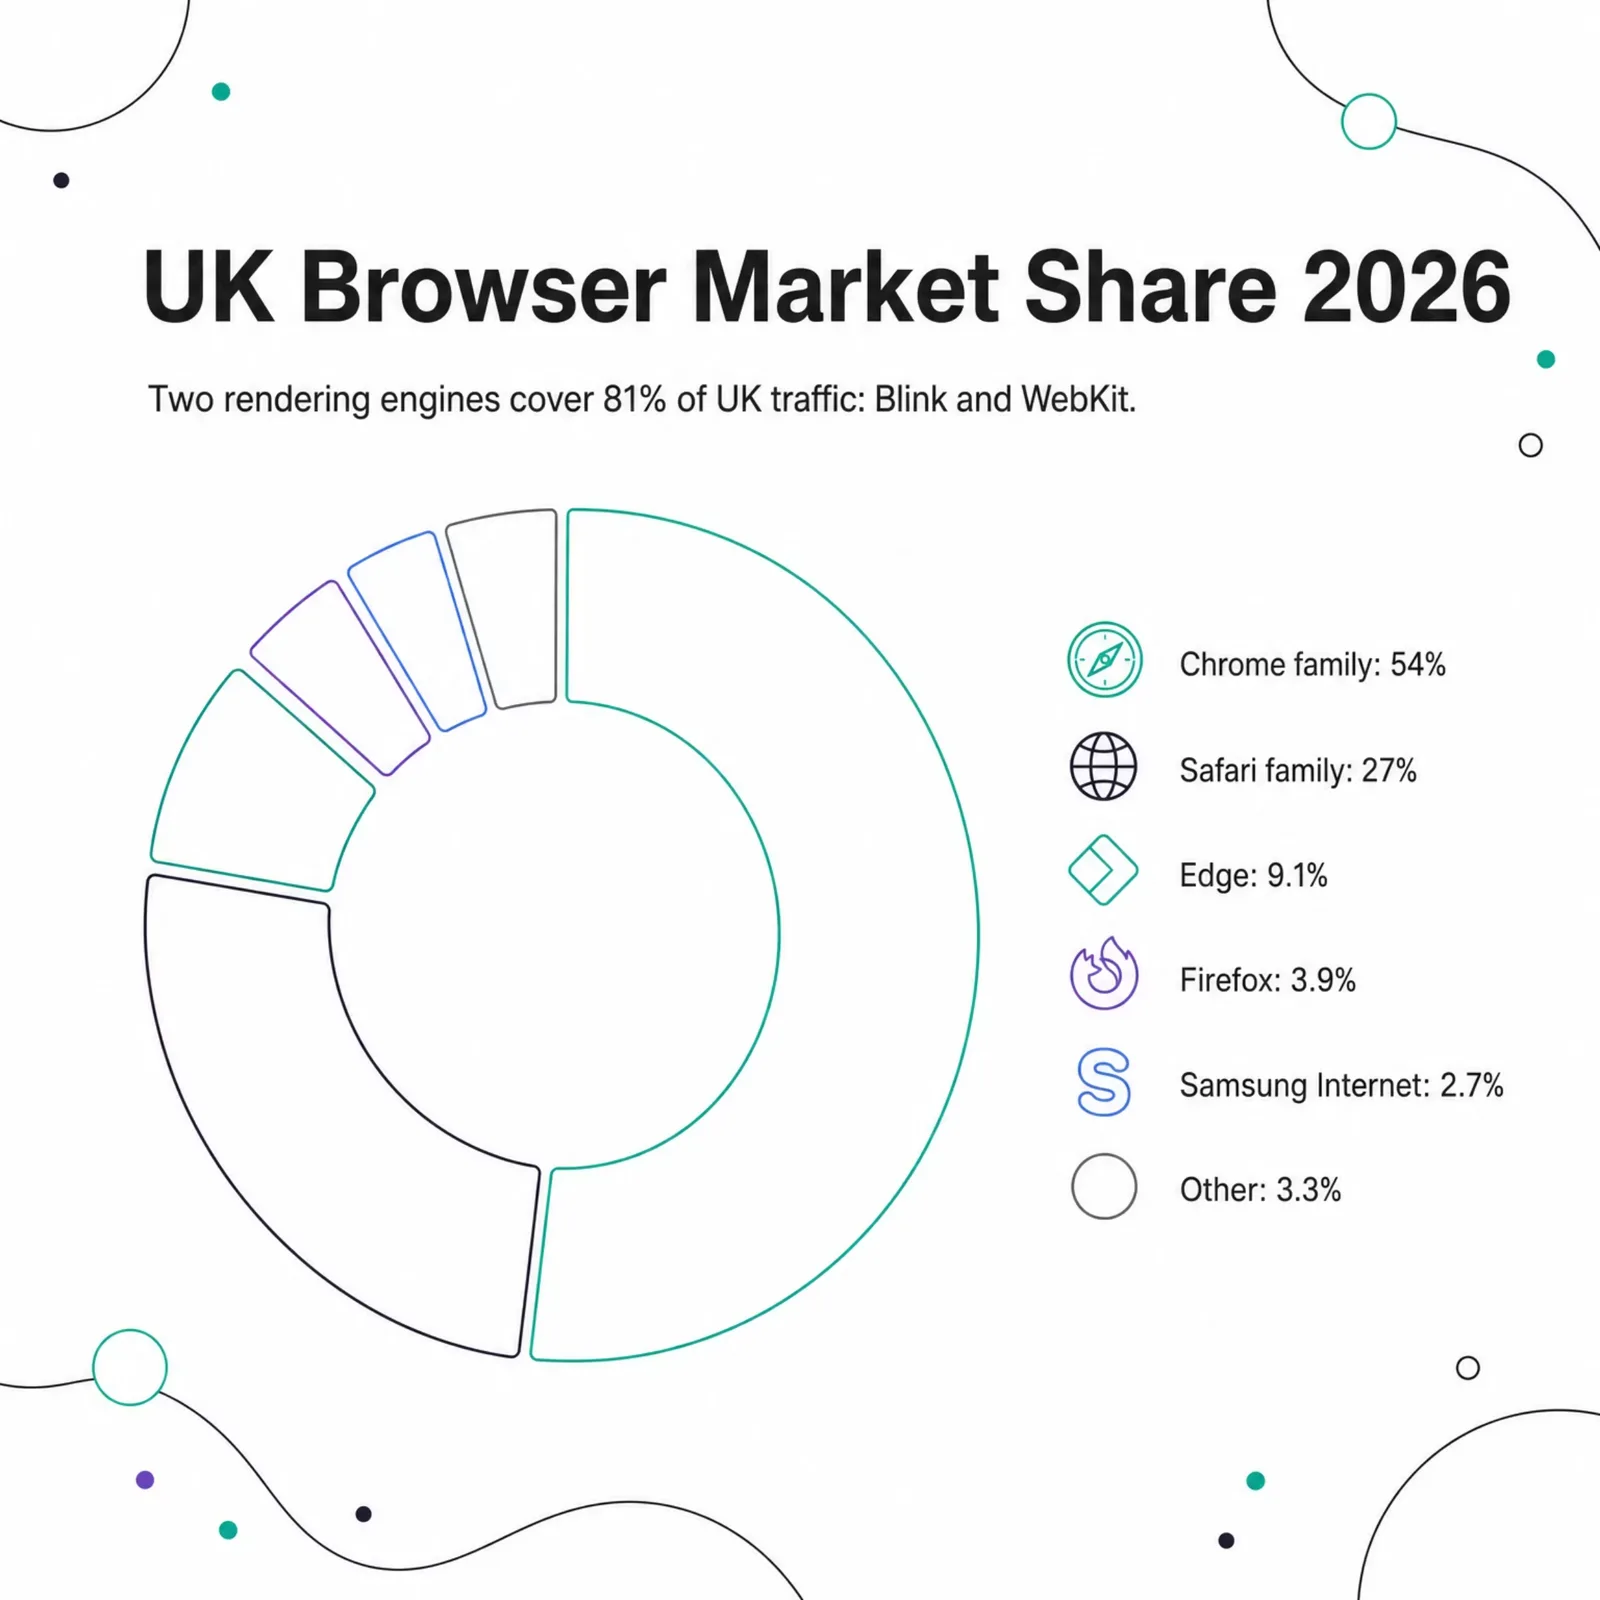
The Chrome family generated roughly 54% of UK web requests and the Safari family about 27% (Cloudflare Radar, June 2026). Those two engines cover more than 80% of the UK web between them. Microsoft Edge takes 9.1%, Firefox 3.9%, and Samsung Internet 2.7%, which rounds out the meaningful players.
| Browser family (UK) | Share of web requests |
|---|---|
| Chrome (desktop + mobile + WebView) | ~54% |
| Safari (desktop + mobile + WebView) | ~27% |
| Edge | 9.1% |
| Firefox | 3.9% |
| Samsung Internet | 2.7% |
Safari's ~27% is bigger than its desktop browser share alone would suggest, because Mobile Safari rides on every iPhone and iPad, and a lot of in-app browsing on iOS routes through the Safari WebView. So Safari's real reach across the UK web is wider than the desktop-only numbers imply. Practically, that means two rendering engines to take seriously: Blink (Chrome, Edge, Samsung) and WebKit (Safari). Test against both. Edge at 9.1% also deserves a glance given its share of Windows desktops. For deeper detail on the leader, see our Chrome market share report.
How fast is the UK internet on mobile vs desktop?

UK fixed broadband, the connection behind most desktops and laptops, runs far faster than the mobile networks phones use on the move. On Cloudflare's speed data (the 90 days to 22 June 2026), the big fixed ISPs deliver 170 to 275 Mbps download at roughly 40 ms latency, while the main mobile carriers manage 47 to 64 Mbps at 70 to 77 ms. The headline UK figure of about 194 Mbps download is really a fixed-line average, because most speed tests run on broadband.
One caveat up front: Cloudflare Radar measures connection speed by network, not by device, so it can't tag a test as "phone" or "laptop." But network type is the real driver of the gap, since phones browse over cellular while desktops sit on fixed broadband. The operator comparison below is the honest stand-in for a true device split.
| Network (UK) | Type | Download | Upload | Idle latency |
|---|---|---|---|---|
| Virgin Media | Fixed broadband | 275 Mbps | 56 Mbps | 43 ms |
| Sky | Fixed broadband | 170 Mbps | 52 Mbps | 37 ms |
| BT | Fixed broadband | 169 Mbps | 53 Mbps | 40 ms |
| Vodafone | Mobile | 64 Mbps | 18 Mbps | 70 ms |
| Three | Mobile | 56 Mbps | 17 Mbps | 77 ms |
| O2 | Mobile | 47 Mbps | 13 Mbps | 72 ms |
This is the missing half of the mobile-first argument. Most UK humans browse on phones, and those phones sit on slower, higher-latency connections. A page that feels instant on a 275 Mbps office desktop can crawl on a 50 Mbps mobile link with 75 ms of lag. It's the clearest reason to weight mobile Core Web Vitals (especially INP and Largest Contentful Paint) above the desktop scores most teams habitually watch.
What the UK mobile vs desktop split means for your website

For UK audiences, design mobile-first and verify on desktop, because real human traffic is mobile-majority (56.4%) while a meaningful, work-hours desktop minority still converts on considered tasks. The data supports building the core experience for the phone, then making sure nothing breaks on the larger screen, rather than the other way round.
A few concrete moves that follow directly from the numbers:
- Treat mobile as the primary layout, not the adaptation. With most UK humans on phones, the mobile view is the main event. Responsive design that starts at the small screen beats a desktop site squeezed down.
- Obsess over mobile performance. Phones face slower networks and weaker CPUs, so Core Web Vitals matter most there. Watch INP (Interaction to Next Paint, the metric that replaced FID) and Largest Contentful Paint on real mobile hardware, not just a fast laptop.
- Test both rendering engines and Apple devices. Chrome/Blink and Safari/WebKit cover 80%-plus of UK traffic, and Apple platforms are ~40% of requests. A WebKit-only or iOS-only bug hits a large share of your audience.
- Keep desktop sharp for work-hours, high-intent sessions. The desktop minority skews toward considered tasks during working weeks. Complex forms, comparison tables, and long reads still deserve a polished large-screen experience.
- Read your own analytics with the methodology in mind. A tag-based tool counts human page views, so it will skew more mobile than Radar's all-traffic split. Don't try to reconcile the two numbers; each answers a different question about who's visiting.
The broader context backs the mobile-first call. According to Finder, 95% of UK residents aged 16 and over owned a smartphone in 2025, around 53 million people. And Uswitch reports that 89% of people used their mobiles to go online in 2023, up from 28% in 2009. Near-universal ownership plus near-universal mobile internet use is exactly the foundation under a mobile-majority human web. Official sources such as Ofcom and the ONS track the same upward trend in mobile internet adoption.
How device usage gets measured matters for your own analytics, too. Whether you run Google Analytics or a privacy-focused alternative, the device buckets you see reflect tracked page views, not raw traffic, so expect them to read closer to StatCounter than to Radar's all-traffic split.
Frequently asked questions
What percentage of UK web traffic is mobile vs desktop?
On Cloudflare Radar's all-traffic measure for the 28 days to 22 June 2026, UK web traffic was 56.3% desktop and 43.1% mobile. Filtered to likely-human visitors, it flips to 56.4% mobile and 43.6% desktop. StatCounter, which counts page views, puts the UK at roughly 49.75% desktop and 46.04% mobile for May 2025 to May 2026.
Is the UK mobile-first or desktop-first?
The UK is mobile-first for real people. Once bot traffic is filtered out, 56.4% of human web requests come from mobile devices versus 43.6% from desktop (Cloudflare Radar, June 2026). Raw all-traffic figures look desktop-majority only because bots, which are 85% desktop, inflate the desktop side. For human behaviour, mobile leads.
Why do Cloudflare Radar and StatCounter report different device shares?
They measure different populations. Cloudflare Radar logs all HTTP requests across its CDN and 1.1.1.1 resolver, bots included, and has no separate tablet category. StatCounter counts page views via a tracking code on about 1.5 million publisher sites and breaks out tablet. Because most bots present as desktop, Radar's raw split skews more desktop than StatCounter's human-pageview panel.
Do more people in the UK access the internet via a smartphone or a laptop?
More via smartphone. Filtered to humans, mobile accounts for 56.4% of UK web requests versus 43.6% for desktop devices like laptops (Cloudflare Radar, June 2026). Survey data agrees: Uswitch reports 89% of UK people used a mobile to go online in 2023, and smartphone ownership reached 95% of those aged 16-plus in 2025 per Finder.
Does a PC use more data than a mobile?
Usually yes, but that's a different question from device share. Cloudflare Radar measures the share of web requests by device, not gigabytes consumed. A desktop session typically loads heavier pages, larger images, and more background requests than a phone on a mobile network, so one PC visit often pulls more data, even though more UK human sessions now happen on mobile (56.4%).
Do iPhones or Android phones dominate UK web traffic?
iPhones. iOS accounted for 25.8% of UK web requests versus Android's 23.4% (Cloudflare Radar, June 2026), the reverse of the global pattern where Android leads. The UK's high iPhone ownership, plus heavier web browsing among iPhone users, tips the web-traffic balance toward iOS even though Android ships on more handsets worldwide.
What is the UK browser market share in 2026?
The Chrome family leads at roughly 54% of UK web requests, followed by the Safari family at about 27%, Edge at 9.1%, Firefox at 3.9%, and Samsung Internet at 2.7% (Cloudflare Radar, June 2026). Chrome and Safari together cover more than 80% of UK traffic, so both the Blink and WebKit rendering engines need testing.
Has UK mobile vs desktop usage changed over the past year?
Yes, but mostly in bot traffic, not human behaviour. On Cloudflare Radar's all-traffic measure, UK desktop share rose from 52.8% across 2025 to 55.2% in Q1 2026 and 56.1% in Q2 2026. Filtered to real humans, mobile stayed in the majority throughout (57.0% in 2025, 55.8% in Q2 2026). The drift toward desktop tracks growing automated traffic, while UK people have remained mobile-first, with the usual seasonal mobile peaks at Christmas and in late summer.
Is the UK more or less mobile than the global average?
Slightly more mobile. UK mobile share was 43.1% on Radar's all-traffic measure versus 39.8% worldwide, with UK desktop at 56.3% against roughly 60% globally (Cloudflare Radar, 28 days to 22 June 2026). Britain is a mature, mobile-forward market, ahead of the global average but not as mobile-dominant as emerging markets where phones are the primary access device.
Is mobile or desktop internet faster in the UK?
Desktop, by a wide margin, because desktops run on fixed broadband. On Cloudflare's speed data, UK fixed ISPs (BT, Sky, Virgin Media) download at 170–275 Mbps with about 40 ms latency, while mobile carriers (Vodafone, Three, O2) manage 47–64 Mbps at 70–77 ms. Radar measures speed by network rather than device, but since phones browse on cellular and desktops on broadband, the gap is real for your mobile-first visitors.
What does the UK mobile vs desktop split mean for web design?
Build mobile-first, then verify on desktop. Because most UK human traffic is mobile, the small-screen layout should be the primary experience, with strong Core Web Vitals (especially INP and LCP) on real mobile hardware. Test both Chrome/Blink and Safari/WebKit, since Apple platforms make up roughly 40% of UK web requests, and keep desktop polished for high-intent, work-hours sessions.
The UK device story isn't a single number, it's a question of who you count. Real people on the UK web are mobile-first at 56.4%, iOS edges Android at 25.8% to 23.4%, and the Chrome and Safari families own more than 80% of browser traffic. The all-traffic desktop majority is mostly bots. Design for the human split, test against Apple devices and both rendering engines, and treat the seasonal mobile peaks as planning signals.
Want to see the technologies, analytics, and platforms behind UK websites across millions of domains? Explore what our pricing and put device and stack data to work on your own market.
Source: Cloudflare Radar (radar.cloudflare.com), 28 days to 22 June 2026.
Emma Davies
Data Analyst

