Chrome Market Share 2026: 68.2% Overall, 69% Mobile, 67% Desktop
Chrome holds 68.2% of human web traffic in 2026, the #1 browser by 4x. It wins every platform but the iPhone. Full country, OS, and device breakdown.
Published •Updated •25 min read
Chrome holds 68.2% of human web traffic worldwide in 2026, making it the world's #1 browser by a 4x margin over Safari's 17.8%. Chrome leads because it runs everywhere. It's the default on Android, installs in seconds on Windows, and even beats Safari on Apple's own Macs. The only platform it doesn't own is the iPhone.
I pulled all of this from Cloudflare Radar for the 28-day window ending 18 June 2026, plus the 52-week trend behind it. Here's what the data actually says, country by country, operating system by operating system, with the breakdowns most browser-share roundups skip.
Pulling technographic cuts like this is what I do most days. I'm a data analyst, and I build prospect lists from technology-adoption data, so browser share is a signal I reach for constantly: the browser a market runs on is a tight proxy for its device mix, and device mix is what decides which bugs break a checkout and which ad formats even render. So I didn't pull these numbers to admire a leaderboard. I read them the way a go-to-market team should, as a map of where to point testing and outreach, and that's the lens I've tried to write the rest of this in.
Chrome is the world's #1 browser by a 4x margin, and still creeping up
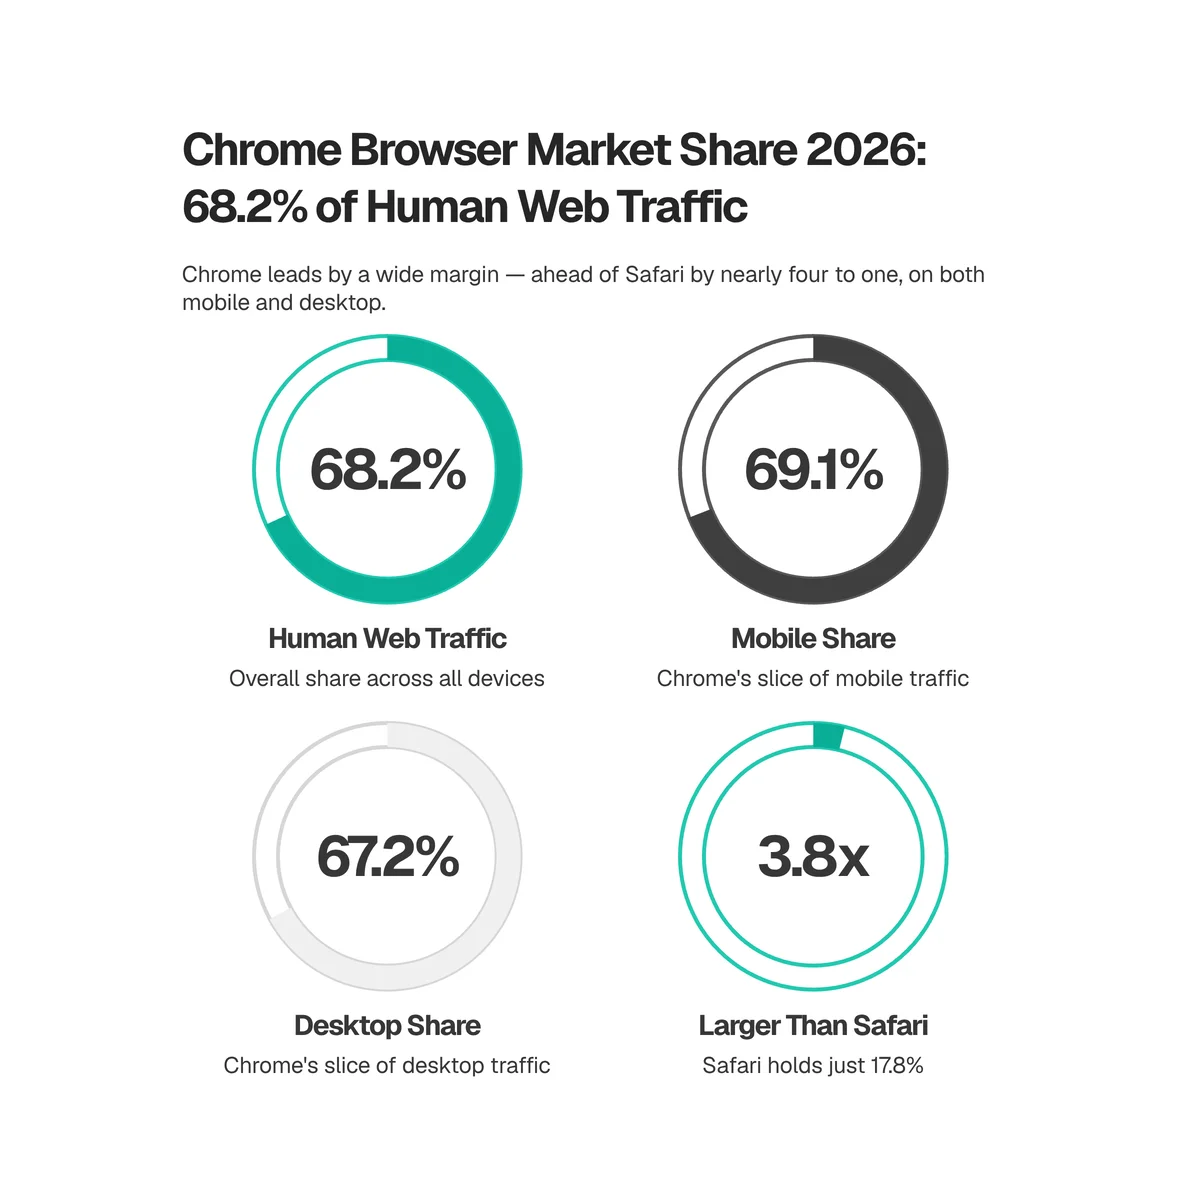
Chrome's market share in 2026 is 68.2% of human web traffic and 69.95% when you count all requests, bots included, per Cloudflare Radar. Either way, it's first by a margin no other browser comes close to.
When I lined up the browser-family numbers, the gap told the story in one row. Chrome runs at 68.2% of human traffic. Safari, in second, sits at 17.8%. That's a 3.8x lead, the kind of distance that doesn't change hands quarter to quarter, or even decade to decade.
The two headline figures differ for a reason worth knowing. Radar measures the share of HTTP requests across Cloudflare's network, and a lot of that traffic isn't people. It's bots, scrapers, and automated agents, and they overwhelmingly identify as Chrome. Filter to human-only traffic and Chrome dips slightly, from 69.95% to 68.2%, because the bot pool leans even more heavily Chrome than people do. I'll use the 68.2% human figure for most of this report, because that's the number that maps to real visitors loading your site.
Here's Chrome's share three ways, depending on what traffic you decide to count:
| Traffic measured | Chrome | Safari |
|---|---|---|
| All requests | 69.95% | 15.7% |
| Human only | 68.2% | 17.8% |
| Bots only | 78.3% | 8.1% |
The bot column is the tell. Automated traffic almost never runs Safari; scrapers and headless agents identify as Chrome 78.3% of the time. So the more bots a dataset includes, the bigger Chrome looks. That's the mirror image of Safari's market share, which shrinks the more bots you count. Chrome is both the human default and the machine default.
My read for product and analytics teams: roughly two in three of your human visitors are on Chrome. It's not a browser you support. It's the baseline you build against, and everything else is a compatibility check on top of it.
Chrome's monthly share: 67.4% to 68.6% across 2025 and 2026
Chrome's human-traffic share rose from 67.4% in June 2025 to 68.6% in June 2026. Just over a point in a year. That's a small move, but the direction matters: a browser this dominant gaining ground at all is the headline, because there's so little room left above it.
Chrome Browser Market Share Trend: 67.4% to 68.6% Over 12 Months
Chrome's share of human web traffic rose from 67.4% in June 2025 to 68.6% in June 2026. The gain wasn't dramatic — Chrome was already dominant — but it stepped up in September-October 2025, exactly when Safari stepped down, and held above 68% for the rest of the year. Chrome absorbed most of the share Safari lost over the same window.
Source: Cloudflare Radar · Jun 2025 – Jun 2026
| Month | Chrome share of human web traffic (%) |
|---|---|
| Jun 2025 | 67.4% |
| Jul 2025 | 67.3% |
| Aug 2025 | 67% |
| Sep 2025 | 67.7% |
| Oct 2025 | 68.3% |
| Nov 2025 | 68% |
| Dec 2025 | 68.6% |
| Jan 2026 | 68.5% |
| Feb 2026 | 68.4% |
| Mar 2026 | 68.5% |
| Apr 2026 | 68.4% |
| May 2026 | 68% |
| Jun 2026 | 68.6% |
- Up 1.2 points in 12 months, from 67.4% to 68.6% of human web traffic
- The step-up landed in September-October 2025 — the mirror image of Safari's decline
- Chrome has held above 68% every month since October 2025
When I plotted the full 52-week series, the rise wasn't steady. It was one step. Chrome spent mid-2025 hovering around 67%, actually dipping to 67.0% in August. Then in September and October 2025 it stepped up hard, clearing 68% and never dropping back below it through 2026. Here's the monthly path across both years:
| Month | Chrome share (human traffic) |
|---|---|
| Jun 2025 | 67.4% |
| Jul 2025 | 67.3% |
| Aug 2025 | 67.0% |
| Sep 2025 | 67.7% |
| Oct 2025 | 68.3% |
| Nov 2025 | 68.0% |
| Dec 2025 | 68.6% |
| Jan 2026 | 68.5% |
| Feb 2026 | 68.4% |
| Mar 2026 | 68.5% |
| Apr 2026 | 68.4% |
| May 2026 | 68.0% |
| Jun 2026 | 68.6% |
What stood out is the timing. That September-October 2025 step-up is the exact mirror of Safari's sharpest decline, which landed in the same weeks. Chrome gained almost precisely what Safari gave up. There's no third browser quietly feeding this. The share moved between the two leaders, and it moved toward Chrome.
A quick honesty note on the numbers. The trend series (67.4% to 68.6%) is a monthly average of weekly data, sampled a little differently from the 28-day snapshot that gives the 68.2% headline. Both come from Radar, both track human traffic, and both agree on direction and rough size. I cite the snapshot for "where we are now" and the weekly series for "how we got here." Here's the same browser-family trend pulled live from Cloudflare Radar, so you can check whether Chrome's line has held above 68% since this went out:
Chrome runs on everything — that's the whole story
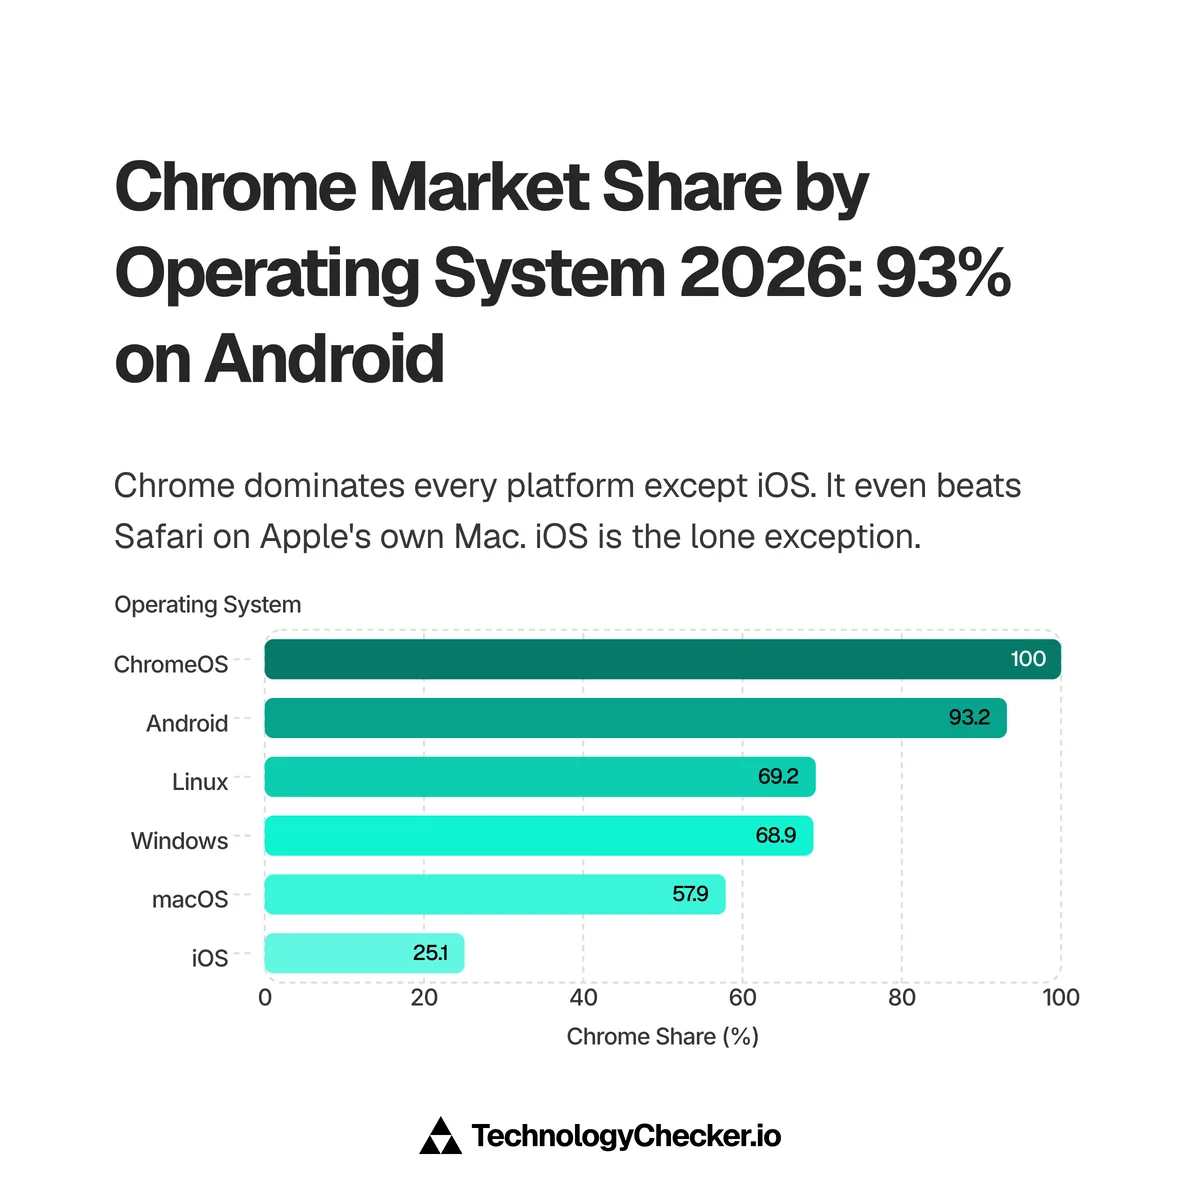
Chrome's dominance comes from one thing Safari can never match: it runs on every operating system, and on most of them it's either the default or the obvious download. Split the browser market by OS and Chrome's reach is almost total.
Here's Chrome's share of human traffic within each operating system:
| Operating system | Chrome share | Runner-up |
|---|---|---|
| ChromeOS | 100% | — |
| Android | 93.2% | Samsung Internet (4.7%) |
| Linux | 69.2% | Firefox (24.8%) |
| Windows | 68.9% | Edge (19.5%) |
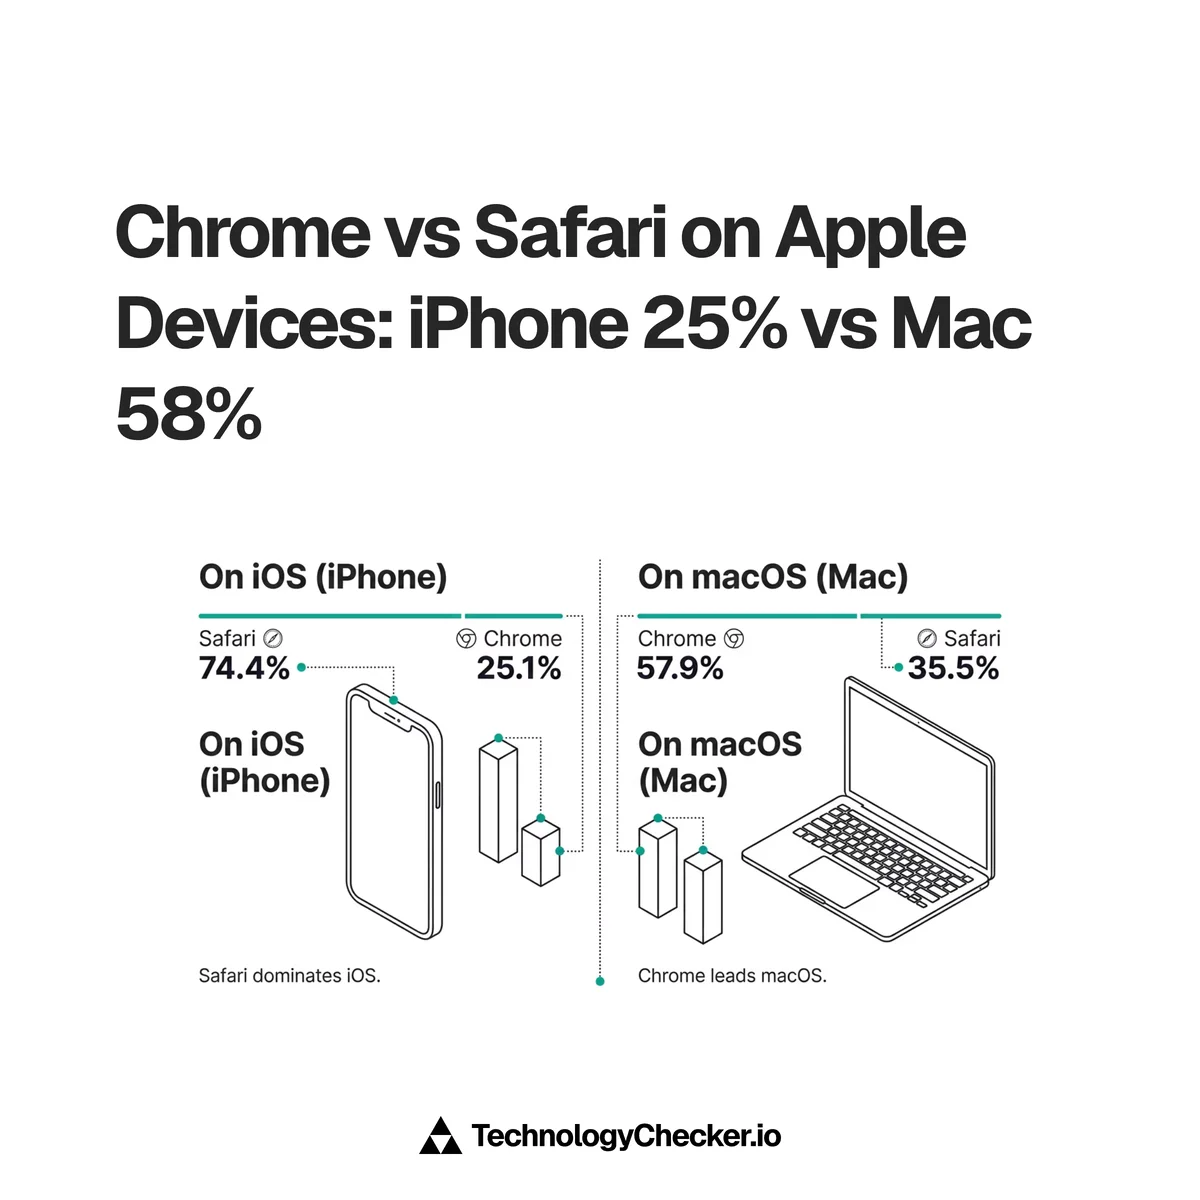
| macOS | 57.9% | Safari (35.5%) |
| iOS | 25.1% | Safari (74.4%) |
Read that table top to bottom and the pattern is unmistakable. On Android, Chrome is the pre-installed default and takes 93.2% of traffic. On Windows, it beats Microsoft's own Edge by more than 3 to 1, even though Edge ships built into the OS. On Linux it doubles up Firefox. And on macOS, Apple's own laptop, Chrome actually leads Safari, 57.9% to 35.5%. Apple ships Safari as the default on the Mac, and still loses its own machine to Chrome.
The mechanism is the same everywhere except one place. Wherever switching is easy and people already live in Chrome on another device, they install it and stay, pulled by synced tabs, passwords, and history. That cross-device gravity is exactly what Windows and macOS users feel, and it's why even Microsoft and Apple can't hold their own desktops against Chrome. The one row that breaks the pattern is iOS, and that break is by design, not by choice.
Chrome's biggest 2026 gain came on the Mac, taken straight from Safari
The table above is a snapshot: where Chrome stands on each platform today. Pull the same within-OS cut for the full quarter a year earlier and you can see which platforms Chrome actually gained on over the year. The answer is a small surprise, because it isn't Chrome's home turf.
| Operating system | Chrome 2025 | Chrome 2026 | Change |
|---|---|---|---|
| macOS | 54.5% | 58.2% | +3.8 pt |
| Linux | 68.4% | 70.1% | +1.8 pt |
| iOS | 23.4% | 25.1% | +1.7 pt |
| Windows | 69.4% | 69.4% | ±0.0 pt |
| Android | 93.2% | 93.0% | −0.2 pt |
Source: Cloudflare Radar — http/summary/browser_family filtered per os, human (LIKELY_HUMAN) traffic, full calendar quarters (Q2 2025 vs Q2 2026). ChromeOS held at ~100% both years. Pulled 2026-07-03.
Chrome barely moved where it's already saturated. On Android it's pinned near 93% and actually slipped a rounding-error 0.2 points, and on Windows it held flat at 69.4% while Edge, not Chrome, was the one gaining ground (Edge rose from 18.5% to 19.6% inside Windows, as Firefox and smaller browsers slipped). Chrome's gains came from the three platforms where it still had room, and two of those three are Apple's.
The standout is the Mac. A year ago Chrome led Safari on macOS by 15 points (54.5% to 39.6%); now it leads by 23 (58.2% to 35.2%). Chrome took 3.8 points of the Mac in a single year, almost all of it straight from Safari, on Apple's own default-Safari hardware. And even on the iPhone, the one platform Chrome loses, it crept up 1.7 points (23.4% to 25.1%), nibbling at the edge of Safari's fortress.
Here's why that matters more than the slow global climb suggests. The operating-system mix moved against Chrome this year: Windows, where Edge lives, grew as a share of all traffic while Android, Chrome's home, shrank (a footprint shift covered in Safari's market share). So Chrome's steady rise wasn't the mix carrying it. It was Chrome tightening its grip inside platforms, hardest on the two devices Apple builds. The "Chrome wins the Mac" line above isn't just still true; the win is widening.
Where Chrome is weakest: the iPhone, by Apple's design
The iPhone is the only platform Chrome loses, and it loses it badly: 25.1% to Safari's 74.4% on iOS. That single row is the entire ceiling on Chrome's global share. If Chrome won iOS the way it wins everything else, it would be pushing 80% of the whole web.
Two things keep Chrome out. First, Safari is the iPhone's default browser, and it holds 74% of iOS traffic as a result, because changing your default is a deliberate, multi-tap settings chore most people never bother with. Second, and less visible: for years Apple required every iOS browser to render pages with WebKit, Safari's engine. So "Chrome on an iPhone" was really Chrome's interface wrapped around Safari's engine underneath. Apple began loosening that rule in the EU under the Digital Markets Act, but on most iPhones worldwide it still effectively holds.
This is the inverse of the macOS story, and the contrast is the whole point. On the Mac, where Apple lets people install whatever engine they want, Chrome wins. On the iPhone, where Apple controlled the default and the engine, Safari wins. Same company, same user base, opposite outcomes. That tells you Chrome's weakness on iOS is about platform control, not about users preferring Safari when they have a real choice.
Chrome's share flips by country: 89% in India, 51% in Germany
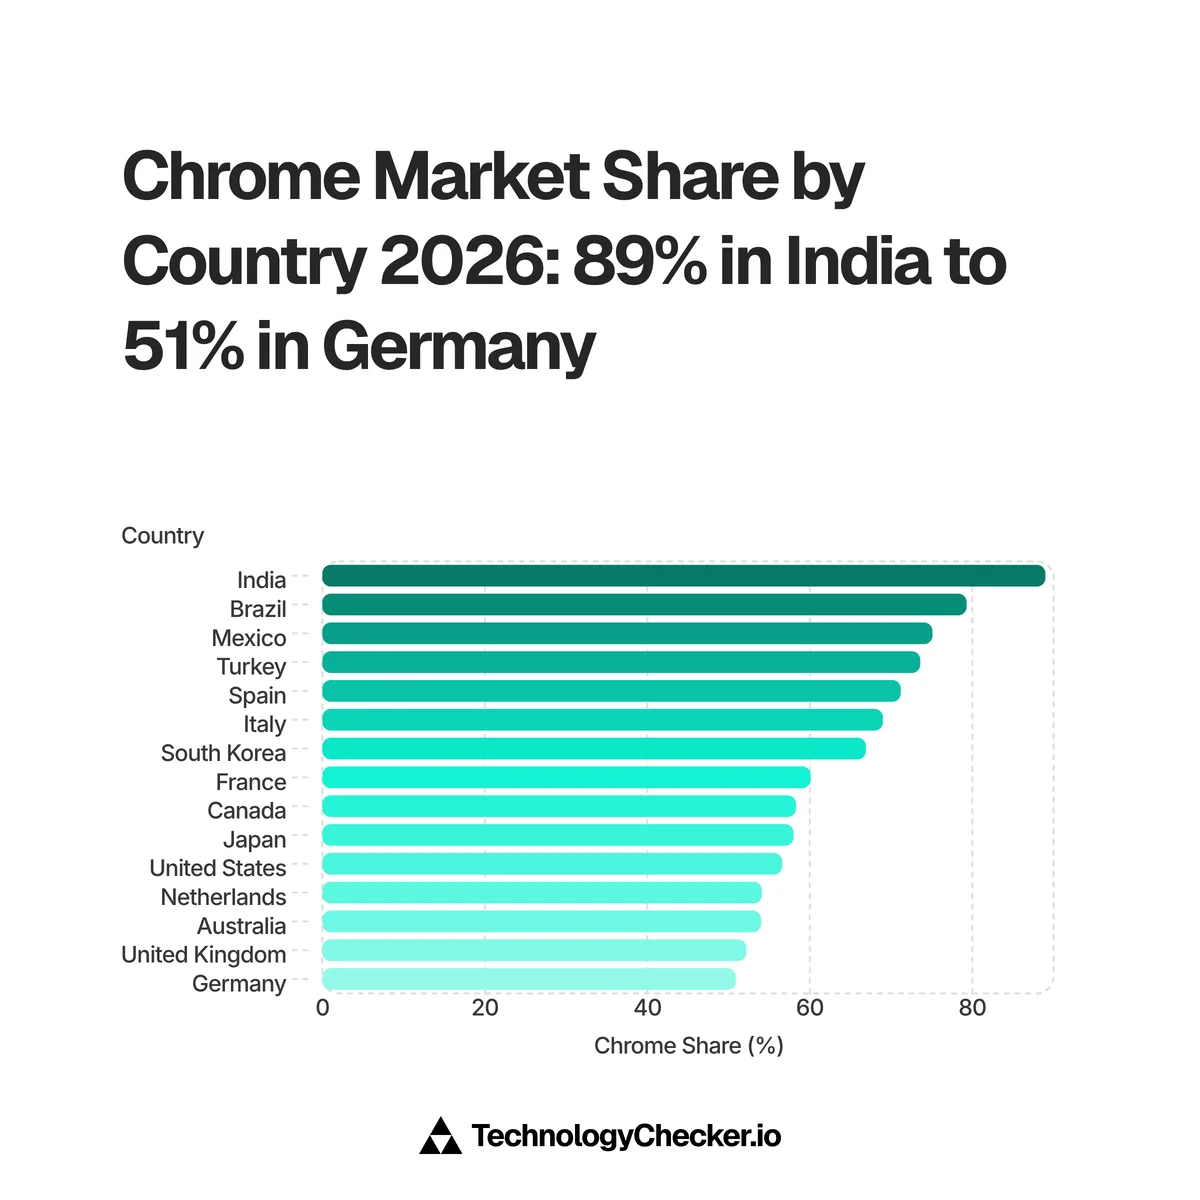
Chrome varies by country more than its global dominance suggests, and the variation runs exactly opposite to Safari's. Chrome is strongest in Android-heavy markets and weakest in iPhone-heavy ones. Among major markets, India tops the list at 89.0% of human traffic, while Germany sits at the bottom at 50.9%.
Here are the top and bottom major markets, ranked by Chrome's share of human web traffic:
| Country | Chrome share (human traffic) |
|---|---|
| India | 89.0% |
| Brazil | 79.3% |
| Mexico | 75.1% |
| Turkey | 73.6% |
| Spain | 71.2% |
| Italy | 69.0% |
| South Korea | 66.9% |
| France | 60.1% |
| Canada | 58.3% |
| Japan | 58.0% |
| United States | 56.6% |
| Netherlands | 54.1% |
| Australia | 54.0% |
| United Kingdom | 52.2% |
| Germany | 50.9% |
The pattern is iPhone penetration, flipped, and it tracks the same device divide we mapped in mobile internet usage by country. In price-sensitive markets where cheap Android handsets dominate, Chrome is the default browser on the default phone, and it clears 75-90%. In wealthy markets where the iPhone is common, Safari eats into Chrome's mobile share and pulls the overall number down toward 50%. India's 89.0% and Germany's 50.9% are the two poles, and the gap between them is almost entirely a story about how many people in each country carry an iPhone.
For teams selling into specific regions, this is the row that matters. A product targeting India, Brazil, or Mexico is shipping to an audience that is 75-90% Chrome, and Chrome-on-Android testing should come first. The same product expanding into Germany, the UK, or the US should treat Chrome as barely half the market and budget real time for Safari, because the other half of those users are on Apple devices.
Country by country: the operating-system mix decides Chrome's share
Chrome's per-country share isn't random. It falls directly out of each market's device and OS mix. I pulled Chrome three ways for 15 countries (overall, mobile-only, and desktop-only), then put the operating-system split underneath so you can watch the browser number track the OS number market by market.
| Country | Overall | Mobile | Desktop |
|---|---|---|---|
| India | 89.0% | 92.1% | 80.7% |
| Brazil | 79.3% | 80.3% | 76.9% |
| Mexico | 75.1% | 78.3% | 70.0% |
| Turkey | 73.6% | 71.1% | 77.2% |
| Spain | 71.2% | 71.6% | 70.8% |
| Italy | 69.0% | 69.9% | 67.8% |
| South Korea | 66.9% | 61.6% | 72.2% |
| France | 60.1% | 63.1% | 57.3% |
| Canada | 58.3% | 50.4% | 64.5% |
| Japan | 58.0% | 57.4% | 58.8% |
| United States | 56.6% | 45.1% | 65.9% |
| Netherlands | 54.1% | 49.8% | 58.4% |
| Australia | 54.0% | 45.9% | 60.4% |
| United Kingdom | 52.2% | 48.3% | 56.6% |
| Germany | 50.9% | 56.2% | 45.8% |
Two patterns jump out. In the wealthy English-speaking markets, Chrome's desktop share runs well above its mobile share. The US is the clearest case, at 65.9% on desktop versus just 45.1% on mobile. The reason is the iPhone: those countries are iPhone-heavy on mobile (so Safari takes a big bite of phone browsing) but Windows-heavy on desktop (where Chrome rules). Germany breaks even that pattern, with Chrome lower on desktop (45.8%) than mobile (56.2%), because German desktops run an unusual amount of Firefox and Edge.
The operating-system mix underneath explains all of it. Chrome's ceiling in any country is whatever isn't locked to Safari, which is to say everything that isn't an iPhone or a Mac:
| Country | Android | Windows | iOS | macOS |
|---|---|---|---|---|
| India | 67.2% | 20.7% | 6.9% | 3.6% |
| Brazil | 57.0% | 25.4% | 14.0% | 2.1% |
| Mexico | 45.3% | 29.7% | 16.3% | 7.3% |
| Turkey | 36.9% | 35.7% | 20.7% | 4.9% |
| Spain | 30.3% | 40.1% | 15.8% | 10.0% |
| Italy | 37.4% | 31.4% | 20.3% | 9.0% |
| South Korea | 34.3% | 41.3% | 15.9% | 6.0% |
| France | 29.9% | 36.2% | 20.1% | 11.2% |
| Canada | 18.3% | 36.7% | 25.6% | 15.6% |
| Japan | 26.4% | 33.8% | 30.5% | 7.9% |
| United States | 16.5% | 35.9% | 28.4% | 15.9% |
| Germany | 28.2% | 35.0% | 21.8% | 11.5% |
| United Kingdom | 24.5% | 29.6% | 29.5% | 13.6% |
Read the two tables together and the mechanism is obvious. A country's Android share plus its Windows share is roughly Chrome's home turf, and its iOS plus macOS share is the territory it has to fight Safari for. India sits on 67.2% Android and just 6.9% iOS, so Chrome runs nearly unopposed at 89.0%. The UK and US sit on 28-30% iOS, so Safari claws back enough mobile share to drag Chrome down to the low-to-mid 50s. South Korea is the interesting middle case: it's wealthy but Samsung's home market, so iOS is only 15.9% and most premium phones run Android, which keeps Chrome and Samsung Internet ahead of Safari even though incomes are high.
Mobile vs desktop: Chrome wins both, but shares the desktop
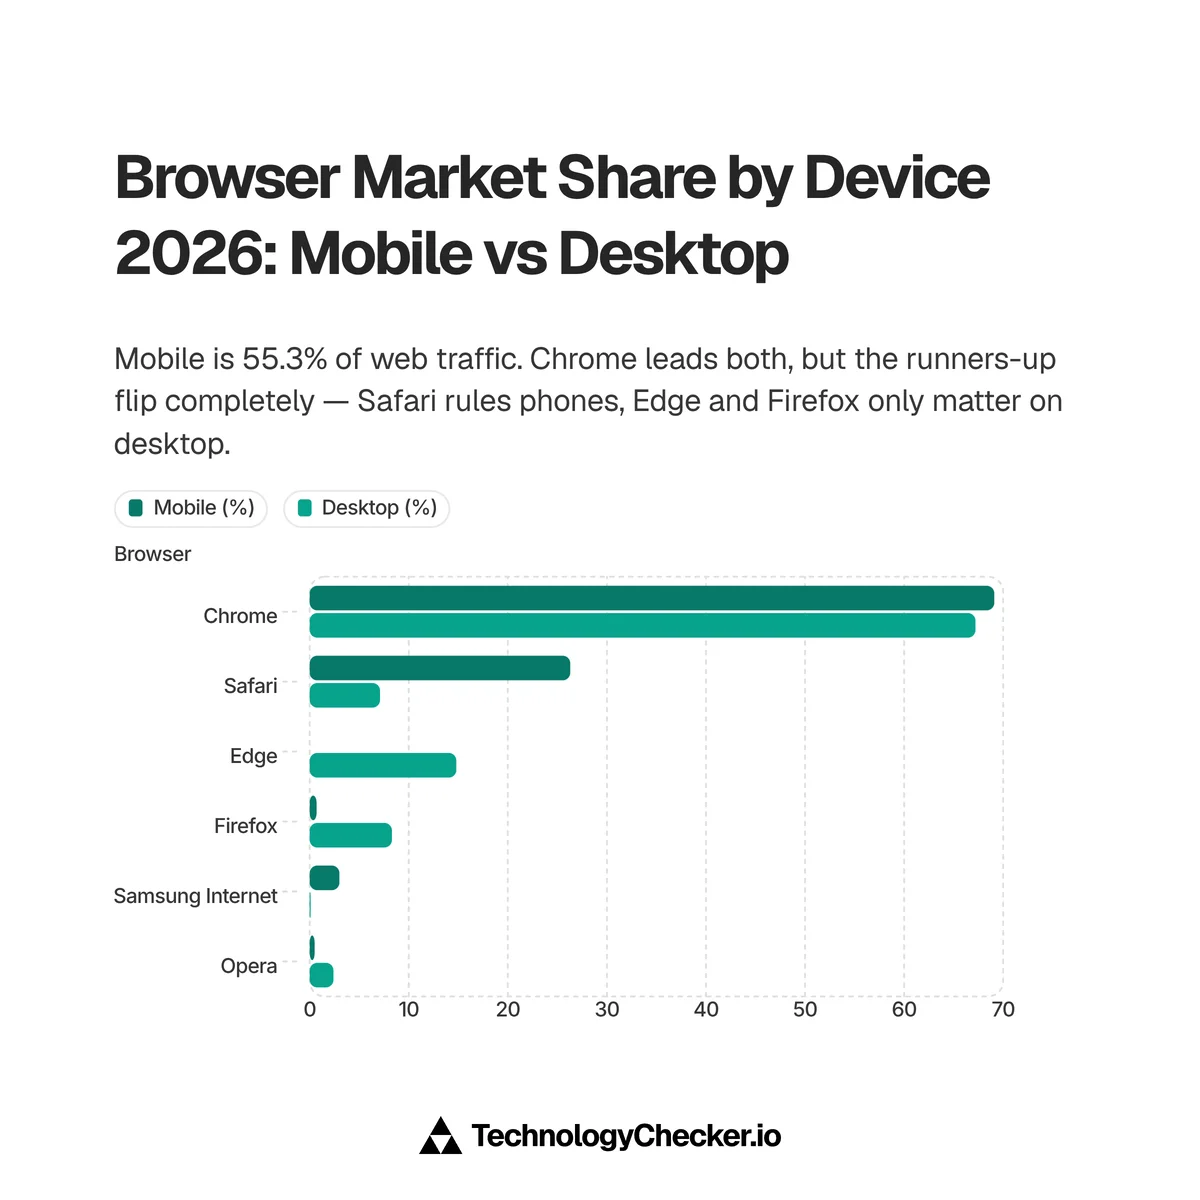
Chrome leads on both halves of the web, but the competition looks completely different depending on the device. Mobile is now 55.3% of human web traffic against 44.7% for desktop, and Chrome rides the larger half comfortably.
Split the browser market by device and Chrome's two environments barely look related:
| Browser | Mobile share | Desktop share |
|---|---|---|
| Chrome | 69.1% | 67.2% |
| Edge | 0.0% | 14.8% |
| Firefox | 0.6% | 8.3% |
| Safari | 26.3% | 7.1% |
| Opera | 0.5% | 2.4% |
| Samsung Internet | 3.0% | 0.1% |
On mobile, Chrome's only real challenger is Safari (26.3%), and that's entirely the iPhone. Samsung Internet adds a sliver. Everything else rounds to zero: Edge and Firefox effectively don't exist on phones. On desktop, the picture is more crowded: Chrome still leads at 67.2%, but Edge (14.8%, the Windows default) and Firefox (8.3%) take real chunks, and Safari falls to 7.1% because it only runs on Macs there.
The practical version: your desktop traffic is more browser-diverse than your mobile traffic. On phones, if it isn't Chrome it's almost certainly Safari, so two-browser testing covers you. On desktop you've got a genuine third and fourth player in Edge and Firefox, and Edge in particular is easy to forget because it has no mobile presence to keep it front of mind.
The bigger story: Chromium engines power ~78% of the web
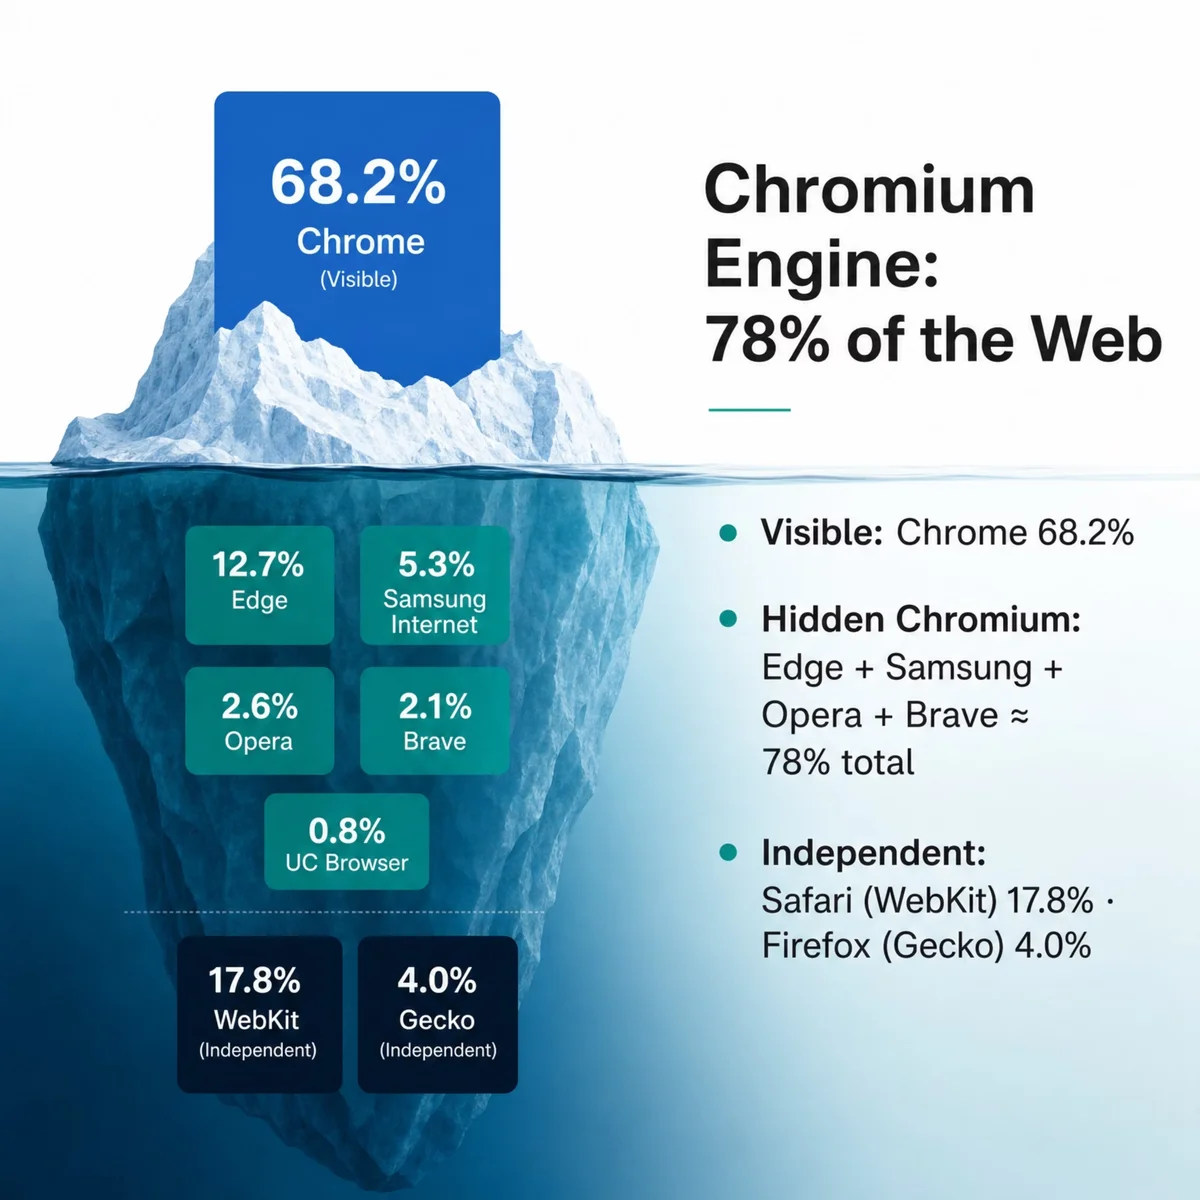
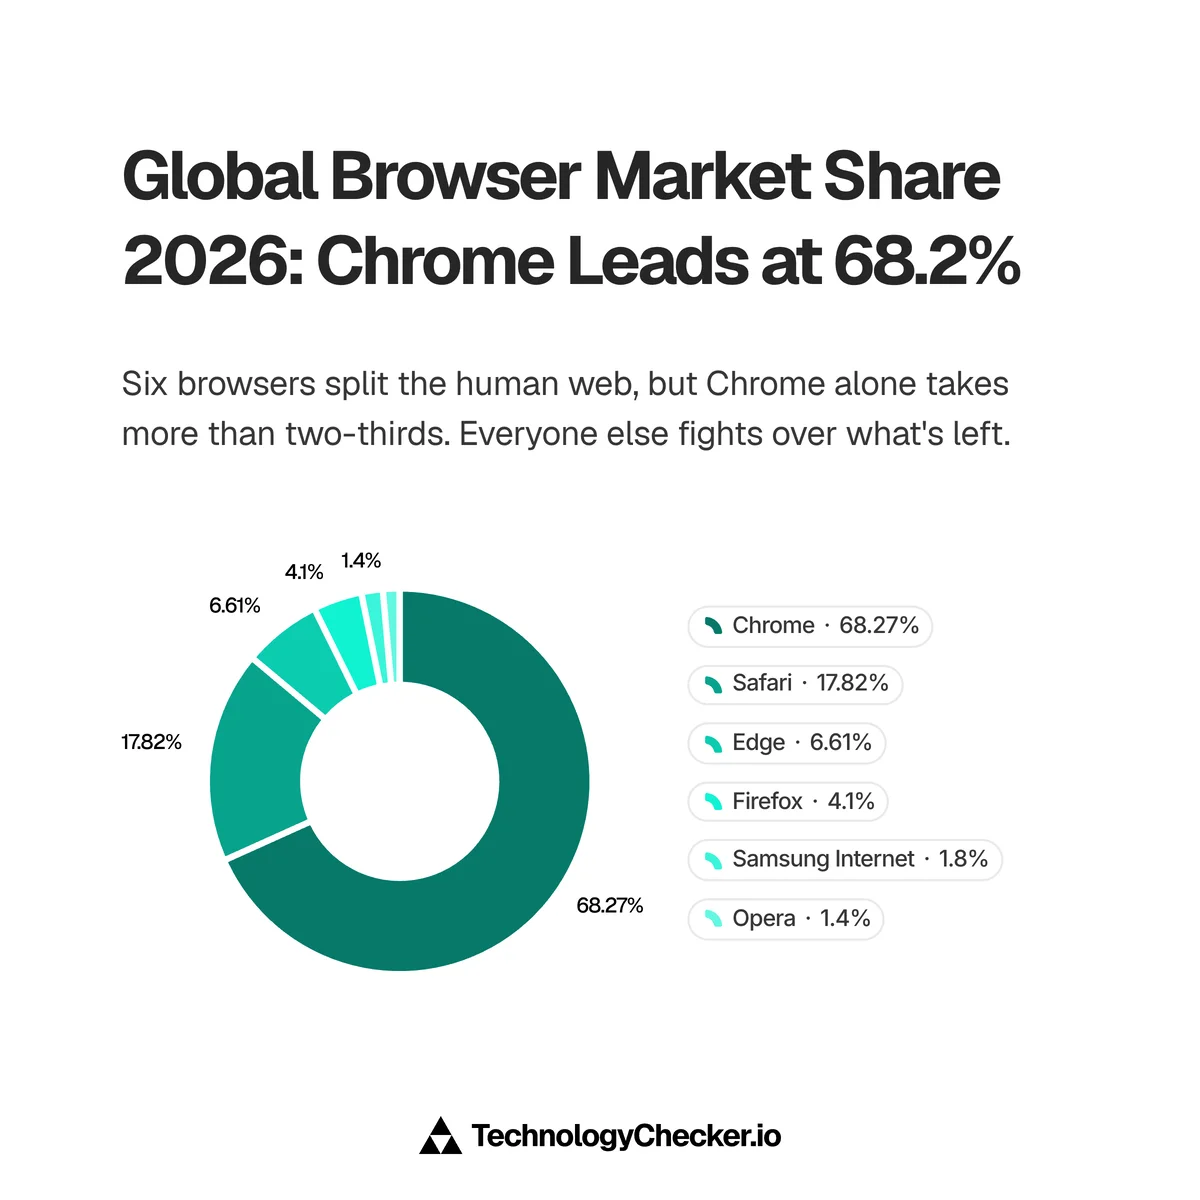
Here's the number that reframes everything above. Chrome's 68.2% is only part of its real footprint, because Chrome's engine, Chromium's Blink, also powers Edge, Opera, Samsung Internet, Brave, and several smaller browsers. Add them up and roughly 78% of all human web traffic runs on a Chromium-based browser.
That leaves just two genuinely independent engines standing: Safari's WebKit (17.8%) and Firefox's Gecko (4.0%). Everything else you can name is, under the hood, Chrome wearing a different coat.
| Engine | Browsers | Share of human traffic |
|---|---|---|
| Chromium / Blink | Chrome, Edge, Opera, Samsung Internet, Brave, UC | ~78% |
| WebKit | Safari | 17.8% |
| Gecko | Firefox | 4.0% |
This is why Chrome's real influence is bigger than its market share. When Google ships a change to Blink, whether a new CSS feature, a deprecated API, or a rendering tweak, it lands not just in Chrome but in every Chromium browser at once. Brave, for instance, doesn't even appear as its own line in Radar's data because it reports as Chrome under the hood; its usage simply folds into the Chrome number. The web you build for is, functionally, a Blink web with two holdouts. Google's grip here rhymes with its hold on search engine market share, where one company again sets the defaults for most of the web.
What I'd do with this if I ran a web or GTM team

Chrome's 68.2% means one thing for engineering: it's your baseline, the environment you develop in and the one most of your traffic lands on. But the trap is treating "it works in Chrome" as "it works." It doesn't, because of the 22% that isn't Chromium.
Here's why Safari still earns disproportionate attention despite trailing Chrome 4 to 1. Safari runs WebKit, the only mainstream engine left that isn't Chromium-based. When you test Chrome, you're effectively testing five browsers at once, because Edge, Opera, Samsung Internet, and Brave share the engine. Safari is the one that renders your CSS differently, mishandles a date input, or breaks a layout in a way nothing else does. For most teams, that 17.8% is the entire WebKit web, and it's where the bugs hide.
The geography point is the go-to-market angle, and it's the opposite of the testing one. If your buyers are in India, Brazil, Mexico, or Turkey, your audience is 75-90% Chrome on Android, so Safari is a rounding error and you can prioritize accordingly. If you sell into Germany, the UK, the US, or Australia, Chrome is only about half the market, and the other half is on Apple devices running Safari. Undersupporting Safari there means a broken experience for a real chunk of high-value prospects.
This part isn't hypothetical for me. When I build a prospect list and the target accounts cluster in Germany or the UK, I flag the Safari exposure to the sales team before anyone writes a line of outbound, because a demo that breaks on a prospect's iPhone reads to them as "bad product," not "untested browser," and that lost deal never shows up in a funnel as a rendering bug. The flip side is the India and Brazil end of the table, where the audience is so heavily Chrome-on-Android that I tell teams to stop spending QA hours chasing Safari and put them somewhere that actually moves the number. The country column above isn't trivia. It's the first thing I check before deciding how much a browser even matters for a given account.
Knowing exactly which browsers, devices, and technologies your prospects run is the foundation of good technographic targeting, the kind of signal our prospect intelligence platform is built around. For the device backdrop driving all of this, our analysis of mobile internet usage by country covers the iPhone-versus-Android split that decides Chrome's share in each market, and our breakdowns of search engine market share and ecommerce marketplace market share show the same one-dominant-player shape.
Methodology and source data
This report runs on first-party measurement from Cloudflare Radar, and the reason to trust it starts with sample size. Cloudflare sits in front of roughly a fifth of all websites and operates 1.1.1.1, one of the world's largest public DNS resolvers, so Radar's view of browser share is built from a slice of real global internet traffic measured in the trillions of requests, spanning effectively every country and network. It isn't a panel anyone opted into. It's a cross-section of the live web, the same source behind our analysis of the most reliable internet by country.
That scale is worth contrasting with how the more familiar browser-share trackers work. Tools like StatCounter measure usage through a JavaScript tag installed on their own network of member websites, then count the visitors who happen to land on those specific sites. It's a legitimate method, but the sample is the traffic of that fixed set of sites rather than a cross-section of the whole internet, which is why two reputable sources can report Chrome a few points apart while still agreeing on the ranking. I lead with Radar here because its denominator is closer to "the internet" than to "the sites running one company's analytics script."
Source: Cloudflare Radar — radar/http (radar.cloudflare.com), 28-day window ending 2026-06-18 (headline figures and the 15-country device and OS tables). Trend figures come from the 52-week weekly series, averaged by month for the chart. All figures are share of HTTP request traffic across Cloudflare's network, traffic-weighted, not installed base or unique users. Headline figures filter to human (LIKELY_HUMAN) traffic except where the all-traffic number is stated explicitly.
Endpoints used: http/summary/browser_family, http/summary/browser (user-agent granularity), http/timeseries_groups/browser_family, http/summary/device_type, and http/summary/os. The breakdown tables come from the same browser_family summary filtered by botClass (human vs bot), deviceType (mobile vs desktop), os (per operating system), and location (per country). The 15-country table pulls Chrome three ways per market — once unfiltered for the overall column and once each with deviceType=MOBILE and deviceType=DESKTOP — and pairs each market with its http/summary/os distribution so the operating-system mix explains the browser share.
Because every figure here comes from one source, I used internal consistency as the cross-check instead of a second vendor: the global number, the per-country cuts, the mobile-versus-desktop split, and the per-OS breakdown all reconcile to the same human-traffic share. When independent slices of the same dataset agree, the headline is carrying real weight rather than riding on one query.
A few honest limitations, because they change how you should read this. Radar is traffic-weighted, so a handful of very active users can carry more weight than many light ones. It's a request-share metric, not a head count of people or installed browsers. Chromium-based browsers like Brave report as Chrome and aren't broken out, so the true Chromium-engine share is if anything understated. And the small difference between the 28-day snapshot (68.2%) and the weekly series (ending near 68.6%) comes from different sampling and smoothing, not a measurement error. Both agree on direction and rough size.
Frequently asked questions
Which browser has the highest market share?
Chrome has the highest market share by a wide margin. In 2026 it accounts for 68.2% of human web traffic globally (69.95% of all traffic), per Cloudflare Radar for the 28-day window ending 18 June 2026. Safari is a distant second at 17.8%, then Edge at 6.6%. No other browser tops 5%.
What is Chrome's market share in 2026?
Chrome's market share in 2026 is 68.2% of human web traffic and 69.95% of all web traffic, based on Cloudflare Radar measurement of HTTP requests across its network. That makes Chrome the world's #1 browser, roughly 3.8 times larger than second-place Safari. Its share has been slowly rising year over year.
Is Chrome's market share growing or declining in 2026?
Chrome's market share is slowly growing. Its human web traffic share rose from 67.4% to 68.6% over the 12 months to June 2026, with the clearest step-up in September-October 2025, the same weeks Safari fell most sharply. Chrome has held above 68% every month since October 2025.
Why is Chrome so dominant?
Chrome dominates because it runs on every platform and ships as a default where it counts. It's the built-in browser on most Android phones, installs in seconds on Windows, and syncs tabs, passwords, and history across every device someone owns. It even beats Safari on Apple's own Macs (57.9% to 35.5%). The only platform Chrome loses is the iPhone, where Apple makes Safari the default.
Do iPhone users use Chrome or Safari?
Most iPhone users stay on Safari. On iOS, Safari takes 74.4% of web traffic against Chrome's 25.1%, per Cloudflare Radar in June 2026. iOS is the only platform where Chrome loses, because Safari is the iPhone default and switching takes deliberate effort. On macOS the result flips: Chrome leads at 57.9% versus Safari's 35.5%.
Is Chrome gaining share on Mac and iPhone?
Yes, slowly, and Apple's devices are where Chrome's 2026 growth is concentrated. Over the year to Q2 2026, Chrome's share of macOS traffic rose from 54.5% to 58.2% (+3.8 points), taken directly from Safari, and on iOS it edged up from 23.4% to 25.1%. Chrome held roughly flat on Windows (69.4%) and Android (93.0%), where it's already near saturation, so its year-over-year gains came almost entirely from Apple's platforms. All figures are human traffic from Cloudflare Radar, full calendar quarters.
What is Chrome's market share on desktop versus mobile?
Chrome leads on both. It takes 69.1% of mobile human web traffic and 67.2% on desktop. The competition differs sharply: on mobile, only Safari (26.3%) is a real rival, while on desktop, Edge (14.8%) and Firefox (8.3%) take meaningful share alongside Chrome. Mobile is now 55.3% of all human web traffic versus 44.7% for desktop.
Which country has the highest Chrome market share?
Among major markets, India has the highest Chrome share at 89.0% of human web traffic, followed by Brazil at 79.3% and Mexico at 75.1%. Chrome peaks in Android-heavy markets where iPhones are rare. It bottoms out in wealthy, iPhone-heavy markets like Germany (50.9%) and the United Kingdom (52.2%).
Why is Chrome's market share lower in Germany and the UK?
Chrome is lower in Germany (50.9%) and the UK (52.2%) because those markets have high iPhone ownership, and the iPhone defaults to Safari. The UK runs 29.5% iOS, so Safari claims a large share of mobile browsing that Chrome can't reach. Germany adds a second factor: German desktops run an unusual amount of Firefox and Edge, pulling Chrome's desktop share down to 45.8%.
How does Chrome compare to Edge?
Chrome dwarfs Edge despite Edge being the Windows default. Chrome holds 68.2% of human web traffic globally to Edge's 6.6%. Even on Windows itself, Chrome leads Edge 68.9% to 19.5%, more than 3 to 1 on Microsoft's own operating system. Edge has effectively no mobile presence, which caps its global share.
What percentage of browsers use Chrome's engine?
Roughly 78% of human web traffic runs on a Chromium-based browser, built on Chrome's engine, Blink. That includes Chrome (68.2%) plus Edge, Opera, Samsung Internet, and Brave, which all build on Chromium. Only Safari's WebKit (17.8%) and Firefox's Gecko (4.0%) are independent engines. This is why a change Google ships to Blink reaches far more of the web than Chrome's own share suggests.
How is browser market share measured, and why do sources disagree?
The figures here come from Cloudflare Radar, which measures the share of HTTP request traffic across Cloudflare's global network rather than surveying users or counting installs. Because Cloudflare sits in front of roughly a fifth of all websites and runs the 1.1.1.1 DNS resolver, that sample spans trillions of requests across nearly every country, not a fixed panel of sites. It's a traffic-weighted, request-share metric, so a very active user carries more weight than a light one, and it isn't a head count of people. We filter to human (non-bot) traffic for the headline numbers. Other trackers like StatCounter count page views from a JavaScript tag on their own network of member sites, a smaller and self-selected sample, which is why exact percentages differ between sources even though the ranking stays the same: Chrome first, Safari second.

Data Analyst
5+ years of experience
Emma is a Data Analyst at TechnologyChecker, where she analyses technology adoption data to build better prospect lists and uncover actionable patterns for sales teams.
- BSc Data Science, Cardiff University
- Google Data Analytics Professional Certificate
- Tableau Desktop Certified Associate
Never miss our research

