Data Center Market Statistics 2026: AI, $416B Market & the Power Ceiling
Data center market statistics for 2026: a $416B market in 2024, the AI segment growing 25%+ a year, Nvidia at $193.7B, and power demand up 165% by 2030.
Published •Updated •21 min read
The data center market hit $416 billion in 2024 and is racing toward $620 billion by 2029. The AI data center segment is the engine: $21–49 billion in 2026, growing 25%+ a year. Nvidia's data center revenue reached $193.7 billion, and Goldman Sachs sees power demand up 165% by 2030. Power, not money, is now the ceiling.
I built this report from a 2026 Statista Data Centers dossier, cross-checked each figure against the primary source behind it, and rebuilt every chart so it credits the original publisher rather than the aggregator. Forecasts are labeled as such. I also added two layers of our own measurement: the cloud and edge platforms we detect across 29.9 million active domains, and live AI-crawler traffic and hyperscaler latency from Cloudflare Radar.
The data center market statistics that matter most:
- The total data center market earned $416.09 billion in 2024, with network infrastructure ($239.68B) the largest segment.
- The dedicated AI data center market is worth $21–49 billion in 2026 and is forecast to reach $133–197 billion by the mid-2030s at a 25%+ CAGR.
- Worldwide data center systems spending is forecast to hit $582.45 billion in 2026, up from $236 billion in 2023.
- Nvidia's data center revenue grew 65x in six years, from $2.98 billion (FY2020) to $193.7 billion (FY2026).
- Hyperscale data centers reached 1,297 worldwide by Q3 2025, up from 700 in 2021.
- Data center power demand could rise 165% by 2030 (Goldman Sachs); the US AI segment alone could hit 123 GW by 2035 (Deloitte).
- The buildout is an investment supercycle worth up to $3 trillion by 2030 (JLL), with average data center PUE plateaued at 1.54.
- Across our own crawl of 29.9 million active domains, Cloudflare's edge (2.34M) and Google Cloud (1.49M) host more of the public web than any other platform, and roughly half of AI-crawler traffic is for model training.
How big is the data center market in 2026?
The total data center market generated $416.09 billion in revenue in 2024 and is forecast to climb past $620 billion by 2029, according to Statista Market Insights. That makes data centers one of the fastest-growing hardware markets in tech, and the curve steepened sharply once generative AI arrived in 2023. A second source agrees on the shape: Precedence Research sizes the market at $386.71 billion in 2025, rising to $1.1 trillion by 2035 at an 11%+ CAGR.
Three hardware segments make up that revenue: servers, storage, and network infrastructure. Network infrastructure is the biggest line by a wide margin, which surprises people who assume servers dominate. Here is the 2024 split:
| Segment | 2024 revenue | Share |
|---|---|---|
| Network infrastructure | $239.68B | 58% |
| Servers | $117.31B | 28% |
| Storage | $59.10B | 14% |
| Total | $416.09B | 100% |
The market is also heavily concentrated by country. The United States led with $123.16 billion in data center market revenue in 2024, ahead of China at $94.40 billion and Japan at $20.60 billion. Germany and the United Kingdom trail the top three.
| Country | 2024 data center market revenue |
|---|---|
| United States | $123.16B |
| China | $94.40B |
| Japan | $20.60B |
A $416 billion market growing a few points a year is a mature industry. A market where AI data center demand is growing 25%+ a year is something else. For the cloud side of the same buildout, our analysis of cloud provider traffic share shows where the workloads actually land.
How big is the AI data center market specifically?
The dedicated AI data center market is much smaller than the total, but it's where almost all the growth is. According to Fortune Business Insights, the global AI data center market was worth $21.27 billion in 2026 and will reach $133.51 billion by 2034, a compound annual growth rate of 25.8%. That is roughly six times growth in eight years.
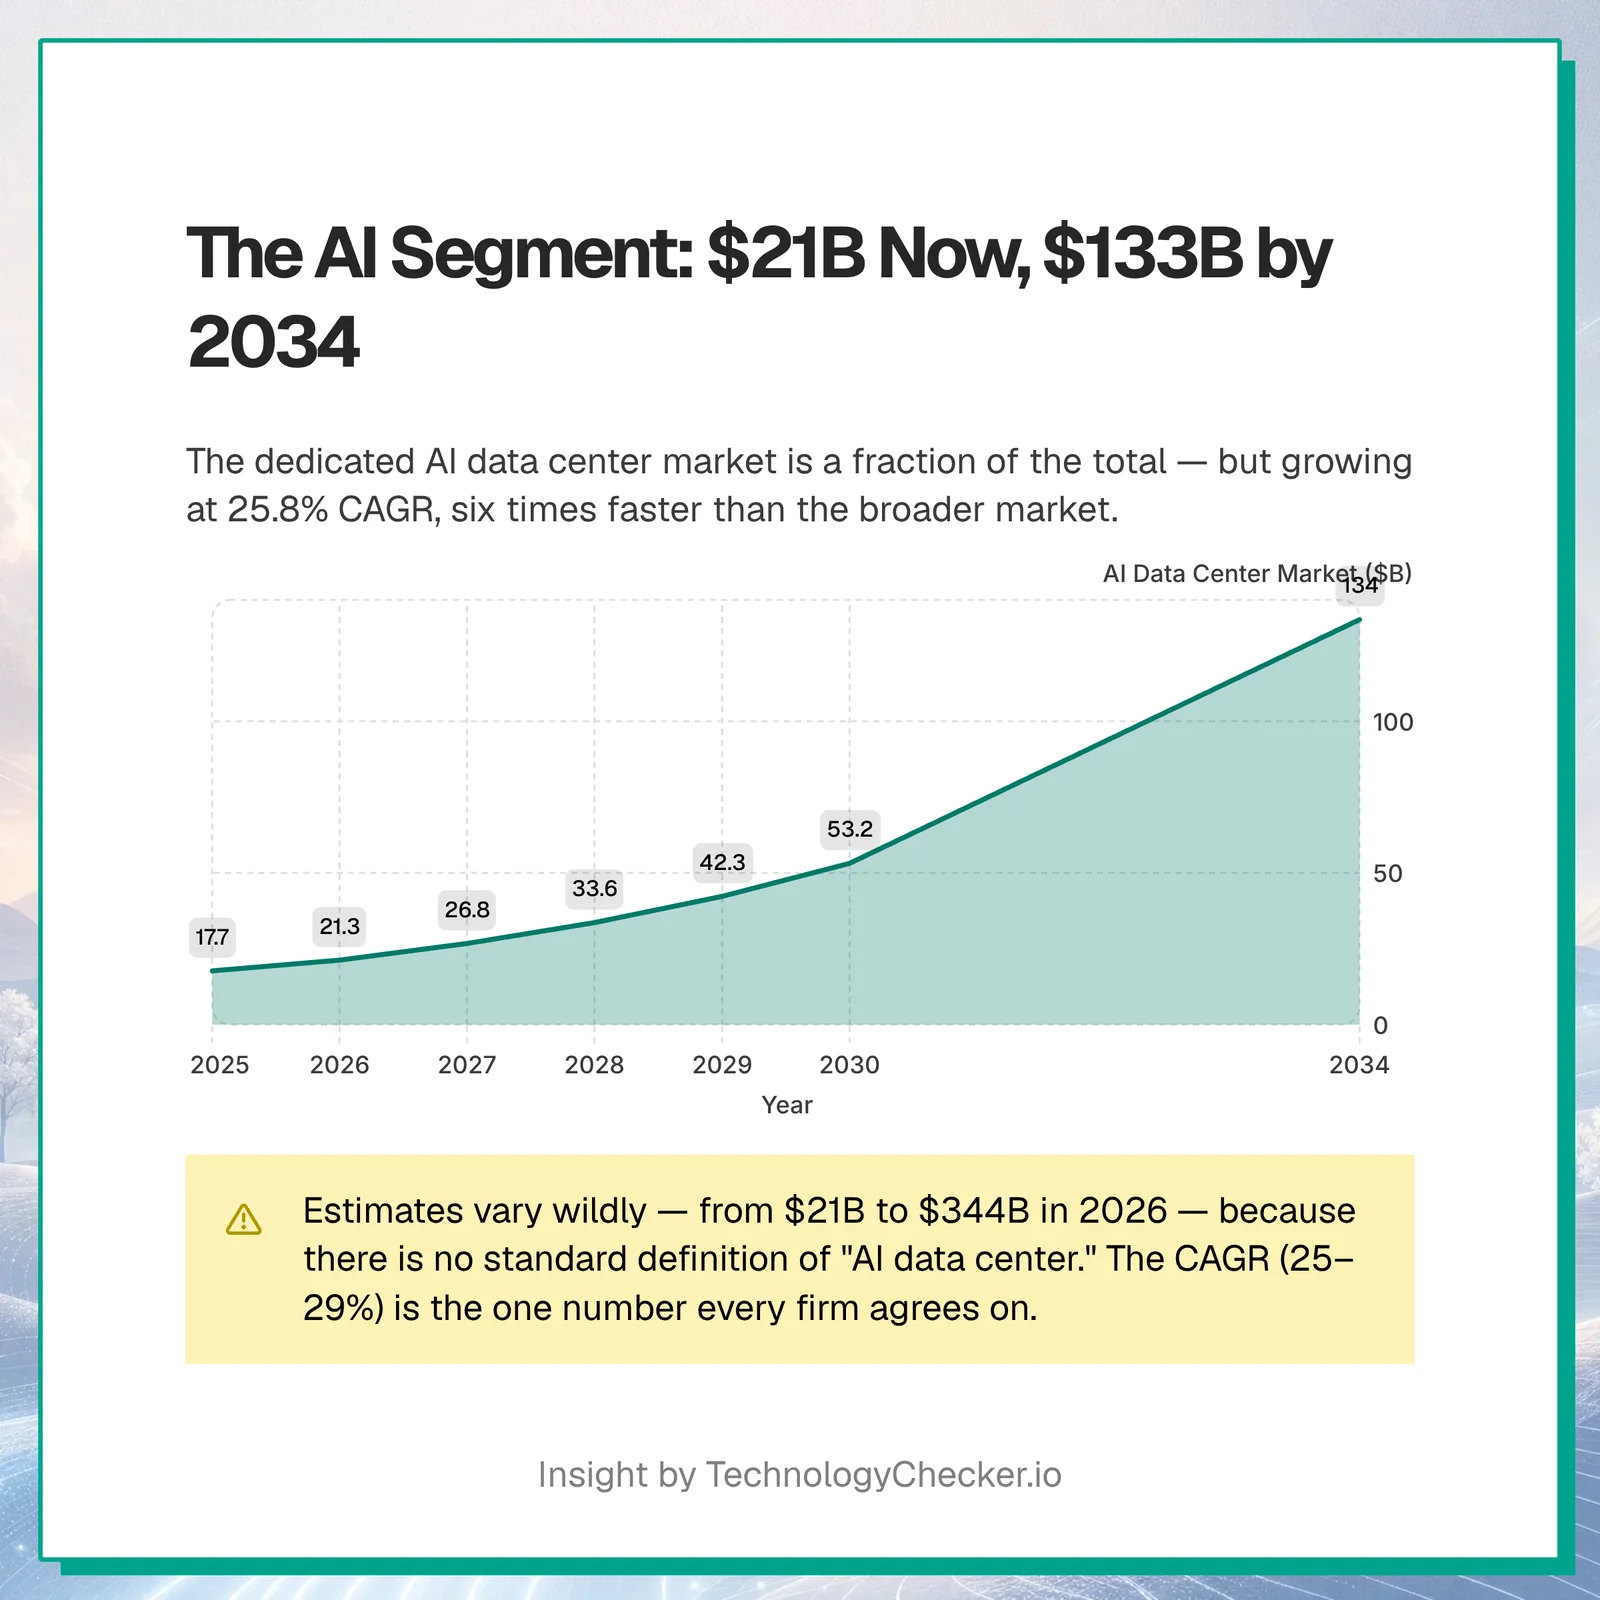
The catch is that "AI data center" has no standard definition, so estimates vary by as much as 10x. A narrow definition counts only purpose-built AI facilities. A broad one counts every server, GPU, and colocation rack serving an AI workload. That is why the 2026 figures below range from $21 billion to $344 billion. The CAGR, though, is consistent: every firm lands between 25% and 29%.
| Research firm | AI data center market (2026) | Future value | CAGR | Horizon |
|---|---|---|---|---|
| Fortune Business Insights | $21.27B | $133.51B | 25.8% | 2034 |
| Mordor Intelligence | $49.49B | $152.91B | 25.3% | 2031 |
| Technavio | +$43.4B (2026–30) | — | 28.6% | 2030 |
| Precedence Research | $22.26B | $197.57B | ~27% | 2035 |
| MarketsandMarkets | $344.24B* | $2,023.52B | 27.5% | 2032 |
*MarketsandMarkets uses a much broader definition (the full AI-serving infrastructure stack), which is why its figure runs ~15x the narrow-segment estimates. North America holds the largest regional share at 35–38%.
Capacity tells the same story in physical terms. ABI Research projects that active data center capacity dedicated to AI workloads will expand from 11.5 GW in 2026 to 43.6 GW in 2031. And nearly all the industry agrees on where demand is heading: in an AlixPartners survey, 98% of respondents said inferencing will be the key driver of future data center demand, not training.
What is driving data center spending in 2026?
AI is driving it, and the gap over every other factor is not close. Worldwide data center systems spending is forecast to reach $582.45 billion in 2026, up from $236.18 billion in 2023, according to Gartner. It took twelve years, from 2012 to 2023, for that figure to rise from $140 billion to $236 billion. The next $346 billion arrives in three.
Data Center Systems Spending 2012-2026: $140B to a Forecast $582B
Worldwide spending on data center systems sat between $140 billion and $236 billion for over a decade, then broke sharply upward: $329.13 billion in 2024, an estimated $489.45 billion in 2025, and a forecast $582.45 billion in 2026. The 2024 to 2026 stretch nearly doubles a number that took 12 years to move from $140 billion to $236 billion. The surge is tied directly to generative-AI infrastructure buildout.
Source: Gartner · 2012-2026
| Year | Data center systems spending (USD billions) |
|---|---|
| 2012 | $140B |
| 2013 | $140B |
| 2014 | $166B |
| 2015 | $171B |
| 2016 | $170B |
| 2017 | $181B |
| 2018 | $210B |
| 2019 | $215B |
| 2020 | $179B |
| 2021 | $189.51B |
| 2022 | $227.02B |
| 2023 | $236.18B |
| 2024 | $329.13B |
| 2025 (est.) | $489.45B |
| 2026 (forecast) | $582.45B |
- Spending jumps from $236B (2023) to a forecast $582B (2026) — a 2.5x rise in three years
- It took 12 years (2012-2023) to add $96B; the next $346B arrives in three
- The inflection lines up with mass generative-AI workload deployment
The growth rate tells the story even more plainly than the dollar totals. Data center systems spending grew 39.4% in 2024 and a record 48.8% in 2025, with a forecast 31.7% in 2026. No other IT category, not software, not devices, not IT services, shows anything close. Total worldwide IT spending is forecast to grow 10.8% in 2026 by comparison.
Data Center Systems IT Spending Growth 2016-2026: -10% to 48.8% Peak
Before 2024, data center systems spending growth typically sat in the -5 to +15 percent range. Then the line breaks upward: +39.4 percent in 2024, a record +48.8 percent in 2025, and a forecast +31.7 percent in 2026. No other IT segment shows a similar pattern. The inflection aligns with the mass adoption of generative AI workloads.
Source: Gartner · 2016-2026
| Year | Data center systems YoY growth |
|---|---|
| 2016 | -9% |
| 2017 | 6% |
| 2018 | 15% |
| 2019 | 1% |
| 2020 | 3% |
| 2021 | 11% |
| 2022 | 12% |
| 2023 | 7% |
| 2024 | 39.4% |
| 2025 | 48.8% |
| 2026* | 31.7% |
- 48.8% growth in 2025 is the steepest single-year jump in the segment's history
- 2024-2026 three-year stretch is historically unprecedented for data center spending
- The inflection point aligns with mass generative-AI workload adoption
You can see the same demand in a single company's results. Nvidia's data center revenue rose from $2.98 billion in fiscal 2020 to $193.7 billion in fiscal 2026, a 65-fold increase, including 68% growth in its most recent fiscal year. Nvidia's data center segment alone now approaches the size of the entire global server market.
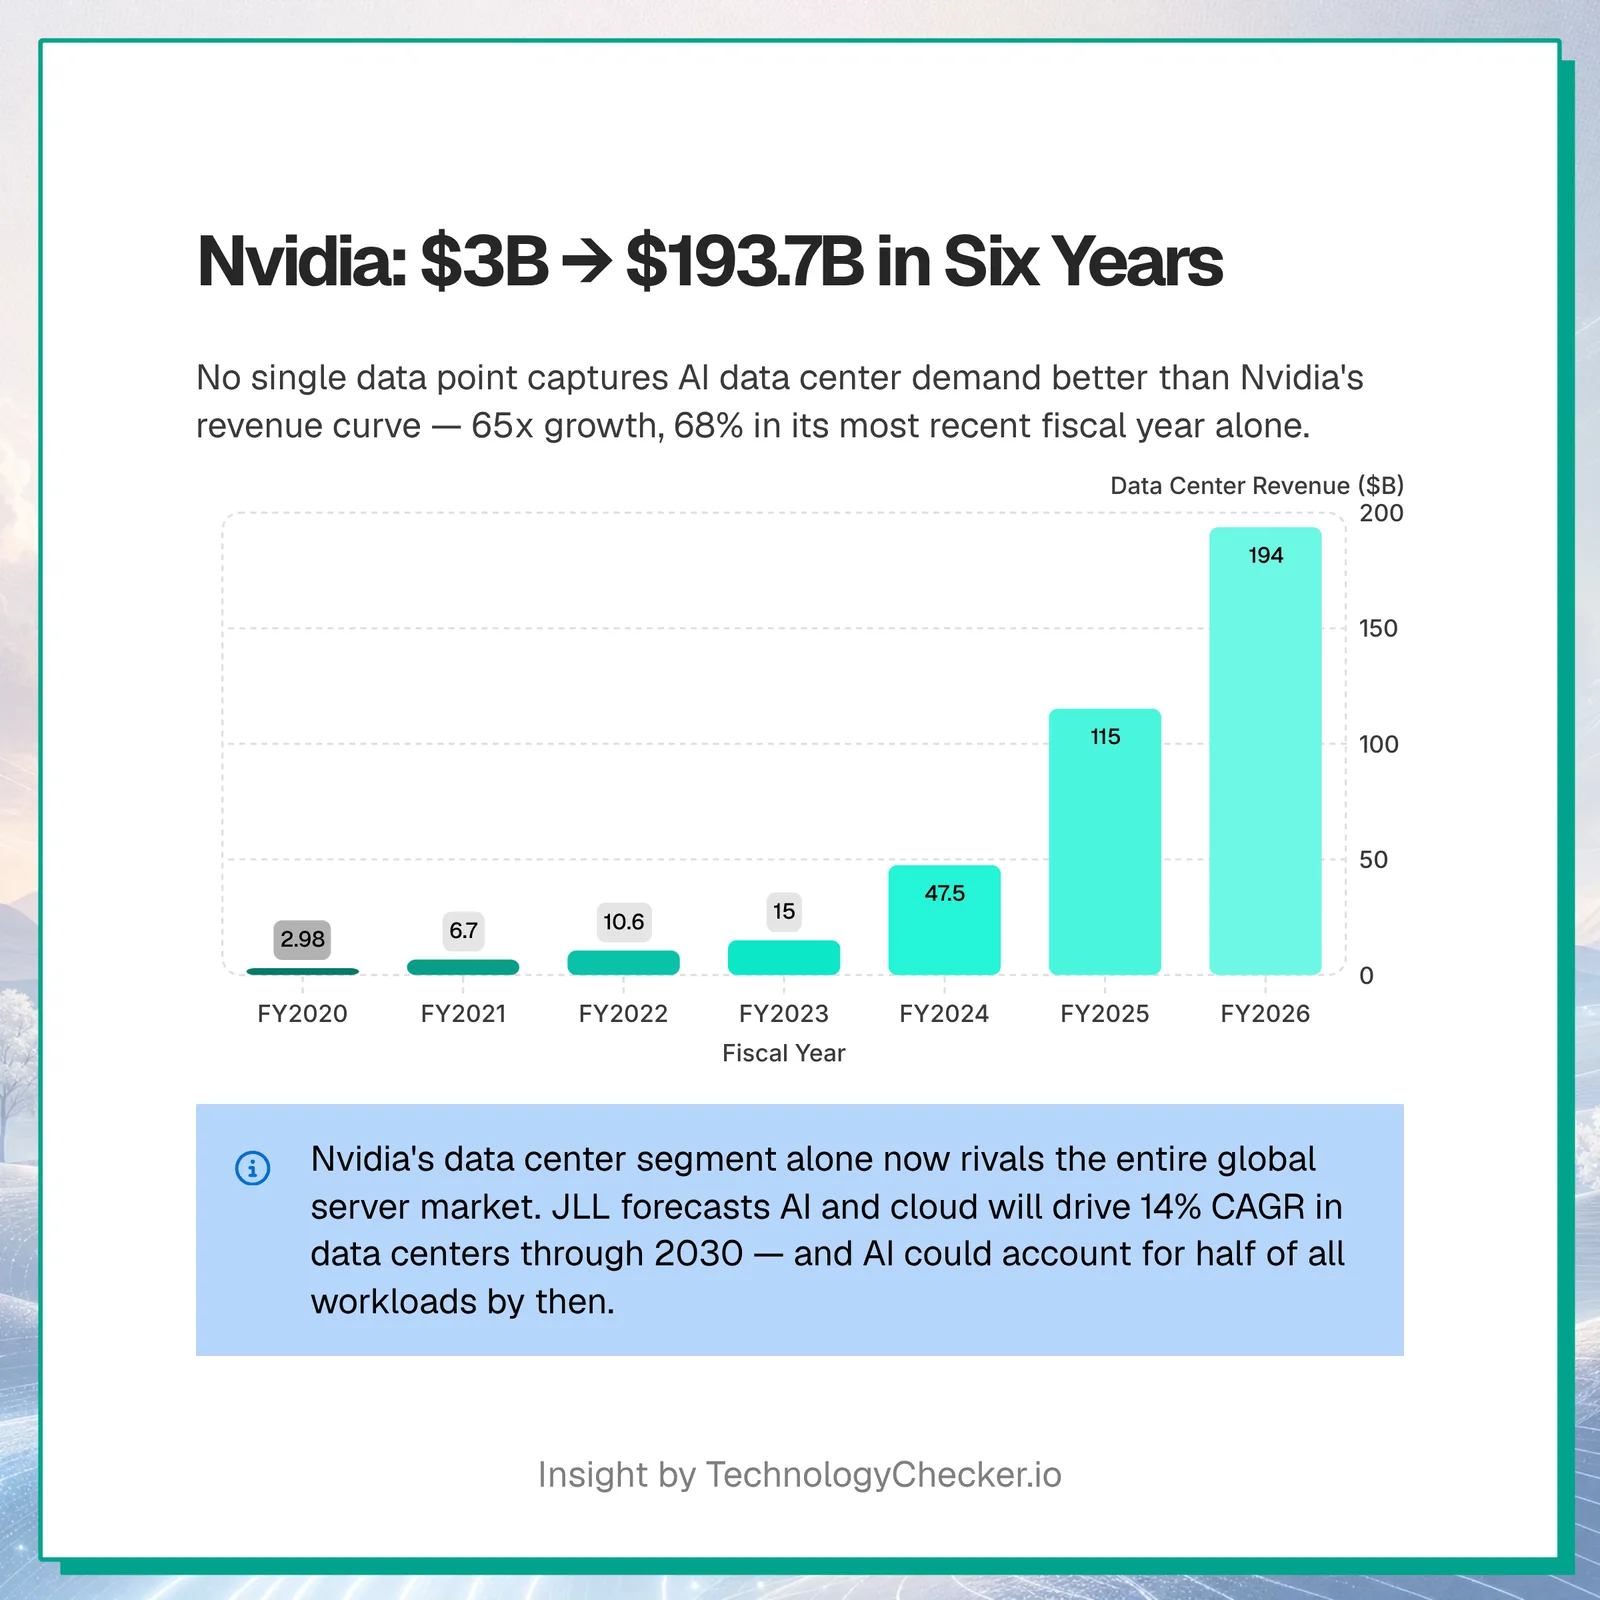
The demand is structural, not a one-year spike. JLL forecasts AI and cloud will drive a 14% CAGR in data centers through 2030, and projects that AI could account for half of all data center workloads by then.
When an industry's spending, a chip vendor's revenue, and a hardware category's growth rate all break upward in the same window, it is one trend wearing three costumes. The open question for 2026 is not whether AI is driving data center spending. It is whether the power grid can keep up.
Where does AI data center demand actually show up?
You can forecast the AI data center market, or you can measure the traffic it already serves — I did the second. The clearest live signal of demand is not a market model but the crawler traffic hitting the open web and the cloud platforms that traffic runs on. Across TechnologyChecker's latest crawl of 29.9 million active domains, the public web concentrates on a handful of clouds, and live AI-crawler traffic reveals what that demand is actually for.
Start with where the workloads live. "The data center market" stays abstract until you ask which operators actually host the internet. In our detection data, Cloudflare's edge and Google Cloud each sit on more than a million live domains, and the US hyperscalers plus Oracle carry most of the rest. This is the consumption side of the buildout — the sites and apps whose requests ultimately terminate inside the facilities the rest of this report measures in dollars and megawatts.
| Cloud / edge platform | Role | Live domains detected (TechnologyChecker, June 2026) |
|---|---|---|
| Cloudflare DNS | Edge DNS / CDN | 2,336,055 |
| Google Cloud | Public cloud (IaaS/PaaS) | 1,493,671 |
| Amazon S3 | Cloud object storage | 398,892 |
| Amazon CloudFront | CDN | 305,650 |
| Oracle Cloud | Public cloud | 162,674 |
| Microsoft Azure | Public cloud | 123,627 |
| AWS Lambda | Serverless compute | 99,491 |
| Netlify | Edge / serverless hosting | 77,663 |
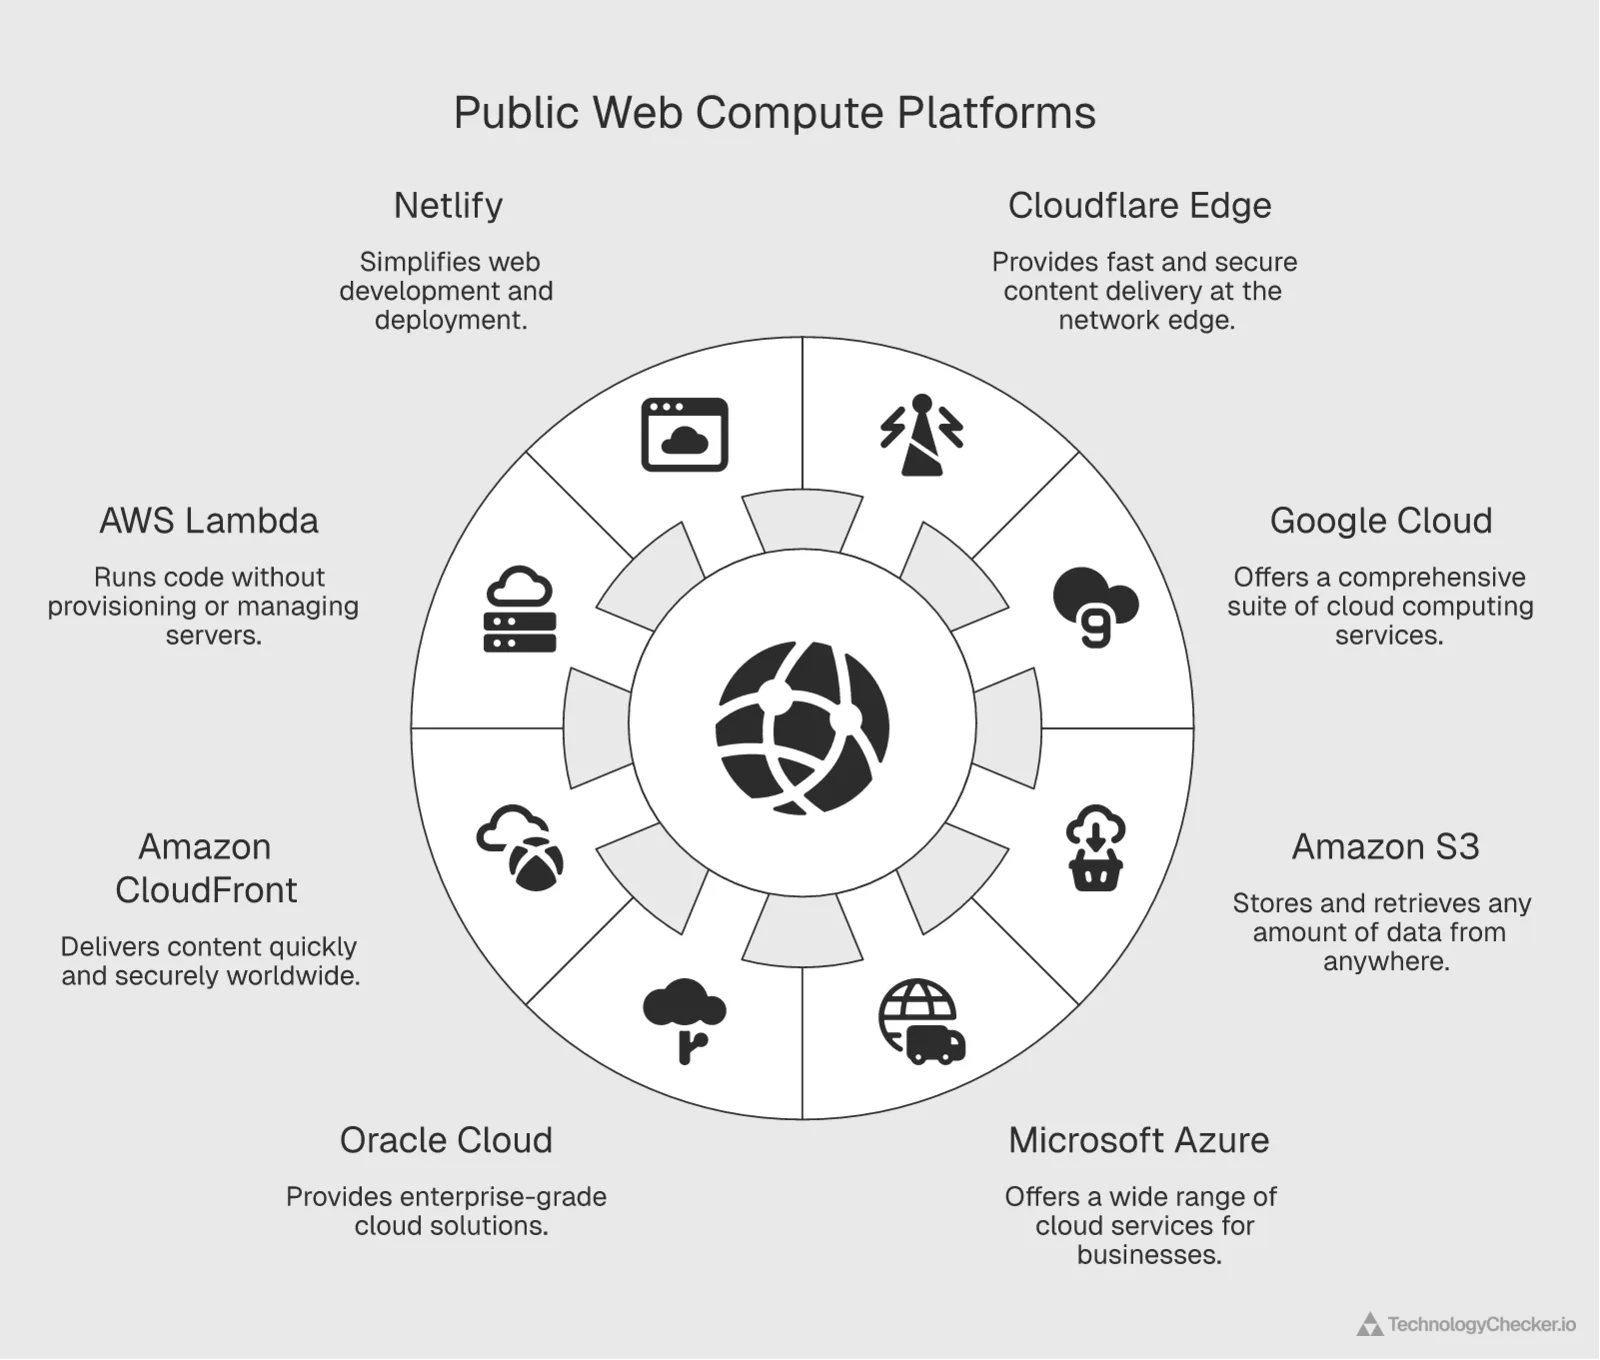
These detections overlap by design — one site often uses Cloudflare for DNS, S3 for storage, and CloudFront for delivery — so the counts measure footprint, not market share. The shape is the point: a small set of operators carries the public web, and those same names (Amazon, Microsoft, Google, Oracle) are the hyperscalers pouring the capital this report tracks into AI-ready capacity. For the traffic-weighted version of this split, see our cloud provider traffic-share breakdown.
Those four operators don't just carry the web — they run measurably different infrastructure. Using Cloudflare's Cloud Observatory, which times connections from Cloudflare's edge to each provider's origins, I pulled the live latency for all four over the 28 days to June 12, 2026:
| Hyperscaler | TCP handshake (ms) | TLS handshake (ms) | TCP round-trip (ms) |
|---|---|---|---|
| Google Cloud | 48.5 | 63.4 | 32.9 |
| Amazon (AWS) | 57.6 | 88.4 | 27.9 |
| Microsoft Azure | 60.4 | 86.0 | 36.5 |
| Oracle Cloud (OCI) | 75.2 | 98.9 | 47.7 |
Google Cloud is the quickest to connect — a 48.5 ms TCP handshake, 35% faster than Oracle's 75.2 ms — and holds the lead through the TLS handshake too. AWS posts the lowest raw round-trip at 27.9 ms. Oracle is the slowest on every measure, a reminder that "hyperscale" is not a single performance tier. These are connection-setup times to each provider's own data centers, so they read as a rough proxy for how well-peered and globally distributed each operator's footprint is — the physical network behind the dollars and megawatts.
Now the demand signal itself. Over the 28 days ending 30 June 2026, Cloudflare Radar attributed AI-crawler traffic across the web like this:
| AI crawler / bot | Operator | Share of AI bot requests (28 days ending 30 June 2026) |
|---|---|---|
| Googlebot | 25.01% | |
| ClaudeBot | Anthropic | 20.07% |
| Meta-ExternalAgent | Meta | 10.14% |
| GPTBot | OpenAI | 9.41% |
| Bingbot | Microsoft | 7.89% |
| Bytespider | ByteDance | 7.59% |
| Applebot | Apple | 5.96% |
| Amazonbot | Amazon | 5.42% |
The more revealing cut is why these bots crawl. 47.43% of AI-crawler requests are for model training, with another 38.86% mixed-purpose and 10.38% for search. Training is the GPU-bound workload that fills AI data centers — the same demand behind Nvidia's $193.7 billion data center year and the 25%+ CAGR every research house forecasts for the AI data center market. The market projections describe the supply being built; this crawler traffic is the demand already arriving.
Where are the world's data centers located?
The United States dominates by raw count, with 4,184 data centers as of April 2026, more than the next ten countries combined. The United Kingdom (515) and Germany (514) are next, followed by China (369) and France (345). Counting facilities is a different lens from counting revenue, and it favors markets with many smaller sites over those with fewer, larger ones.
| Country | Number of data centers (2026) |
|---|---|
| United States | 4,184 |
| United Kingdom | 515 |
| Germany | 514 |
| China | 369 |
| France | 345 |
| India | 296 |
| Canada | 287 |
| Australia | 272 |
| Japan | 257 |
| Italy | 219 |
| Brazil | 205 |
| Spain | 195 |
| Netherlands | 186 |
The largest single-operator sites, hyperscale data centers, tell the capacity story. Hyperscale facilities reached 1,297 worldwide by Q3 2025, up from 700 in 2021 and just 259 in 2015. The count roughly doubles every four years, tracking cloud and AI demand from Amazon, Microsoft, Google, Meta, and a few others.
Hyperscale Data Centers Worldwide 2015-2025: 259 to 1,297 (5x Growth)
The number of hyperscale data centers worldwide reached 1,297 by the end of Q3 2025, up from just 700 in 2021 and 259 in 2015. The count has roughly doubled every four years as cloud and AI providers race to add capacity. Hyperscale facilities are the largest single-operator sites, run mainly by Amazon, Microsoft, Google, Meta, and a handful of others.
Source: Synergy Research Group · 2015-2025
| Year | Number of hyperscale data centers |
|---|---|
| 2015 | 259 |
| 2016 | 338 |
| 2017 | 386 |
| 2018 | 448 |
| 2019 | 504 |
| 2020 | 597 |
| 2021 | 700 |
| 2023 | 992 |
| 2024 | 1136 |
| 2025 | 1297 |
- Hyperscale count crossed 1,297 by Q3 2025, up from 700 in 2021
- The total has 5x'd in a decade (259 in 2015 to 1,297 in 2025)
- Roughly doubles every four years, tracking cloud and AI capacity demand
Capacity is also intensely concentrated by metro. Northern Virginia is the world's largest data center market at 3,046 MW of inventory, more than twice second-place Atlanta, and it runs the lowest vacancy rate of any major market at 0.76%. Pair inventory with vacancy and you see a supply crunch: the biggest markets are also the fullest. Industry occupancy could climb from 85% in 2023 to over 95% by late 2026.
| Market | IT inventory (MW, Q1 2025) | Vacancy rate (2025) |
|---|---|---|
| Northern Virginia | 3,046.1 | 0.76% |
| Atlanta | 1,279.4 | 3.6% |
| London | 1,103.5 | 7.99% |
| Frankfurt | 994.1 | 5.14% |
| Tokyo | 949.2 | 13% |
| Sydney | 767 | 15% |
| Singapore | 738 | 2% |
| Chicago | 661.4 | 3.1% |
| Hong Kong | 647.2 | — |
| Phoenix | 617 | 1.7% |
| Paris | 581.8 | 7.73% |
| Amsterdam | 569.7 | 9.74% |
| São Paulo | 493 | 9.5% |
Where you build matters for cost, too. Tokyo was the most expensive market to build data center capacity in 2025 at $15.15 per watt, ahead of Singapore ($14.53) and Zurich ($14.24). Land prices, labor, and local power costs drive the spread.
| Market | Construction cost (USD per watt, 2025) |
|---|---|
| Tokyo | $15.15 |
| Singapore | $14.53 |
| Zurich | $14.24 |
| Osaka | $14.12 |
| Silicon Valley | $13.31 |
| New Jersey | $12.90 |
| Oslo | $12.41 |
| Auckland | $12.30 |
| Stockholm | $12.29 |
| Helsinki | $12.29 |
| Copenhagen | $12.02 |
| London | $12.02 |
| Vienna | $11.81 |
How much electricity do data centers use?
A lot, and AI is the swing factor. The IEA estimates data centers consume about 415 TWh today, roughly 1.5% of global electricity. In 2022, data centers, crypto, and AI together drew about 455 TWh, with dedicated AI data centers contributing close to zero. By 2026 the IEA's central estimate is around 830 TWh — traditional data centers at 580 TWh, crypto at 160 TWh, and dedicated AI data centers at 90 TWh, up from roughly nothing four years earlier. Depending on the scenario, the total could range as high as 1,050 TWh.
Data Center & Crypto Electricity Demand: 455 TWh (2022) to Forecast 830 TWh (2026)
In 2022, dedicated AI data centers consumed roughly zero terawatt-hours of electricity. By 2026, the IEA forecasts 90 TWh for AI data centers alone, on top of 580 TWh for traditional data centers and 160 TWh for cryptocurrencies. Total demand could hit 1,050 TWh in 2026 depending on scenario — comparable to adding the annual electricity consumption of a mid-sized country.
Source: IEA; Statista estimates · 2022-2026
| Segment | Electricity demand (TWh) |
|---|---|
| 2022 — Traditional | 345 TWh |
| 2022 — Crypto | 110 TWh |
| 2022 — AI | 0 TWh |
| 2026 — Traditional | 580 TWh |
| 2026 — Crypto | 160 TWh |
| 2026 — AI | 90 TWh |
- AI data centers go from ~0 TWh (2022) to 90 TWh (2026)
- Traditional data center demand alone grows 68% in four years
- Total could hit 1,050 TWh — equivalent to a mid-sized country's grid
The longer-term projections are steeper still. Here is what the major research houses forecast for data center power and capacity:
| Projection | Figure | Source |
|---|---|---|
| Global DC power demand growth, 2023→2030 | +165% | Goldman Sachs |
| US AI data center power demand by 2035 | up to 123 GW (30x+ 2024) | Deloitte |
| New DC capacity added, 2026→2030 | ~100 GW (doubles global capacity) | JLL |
| DC demand growth to 2027 | +50% to 92 GW (17% CAGR) | Goldman Sachs |
| DC electricity today | ~415 TWh (~1.5% of global) | IEA |
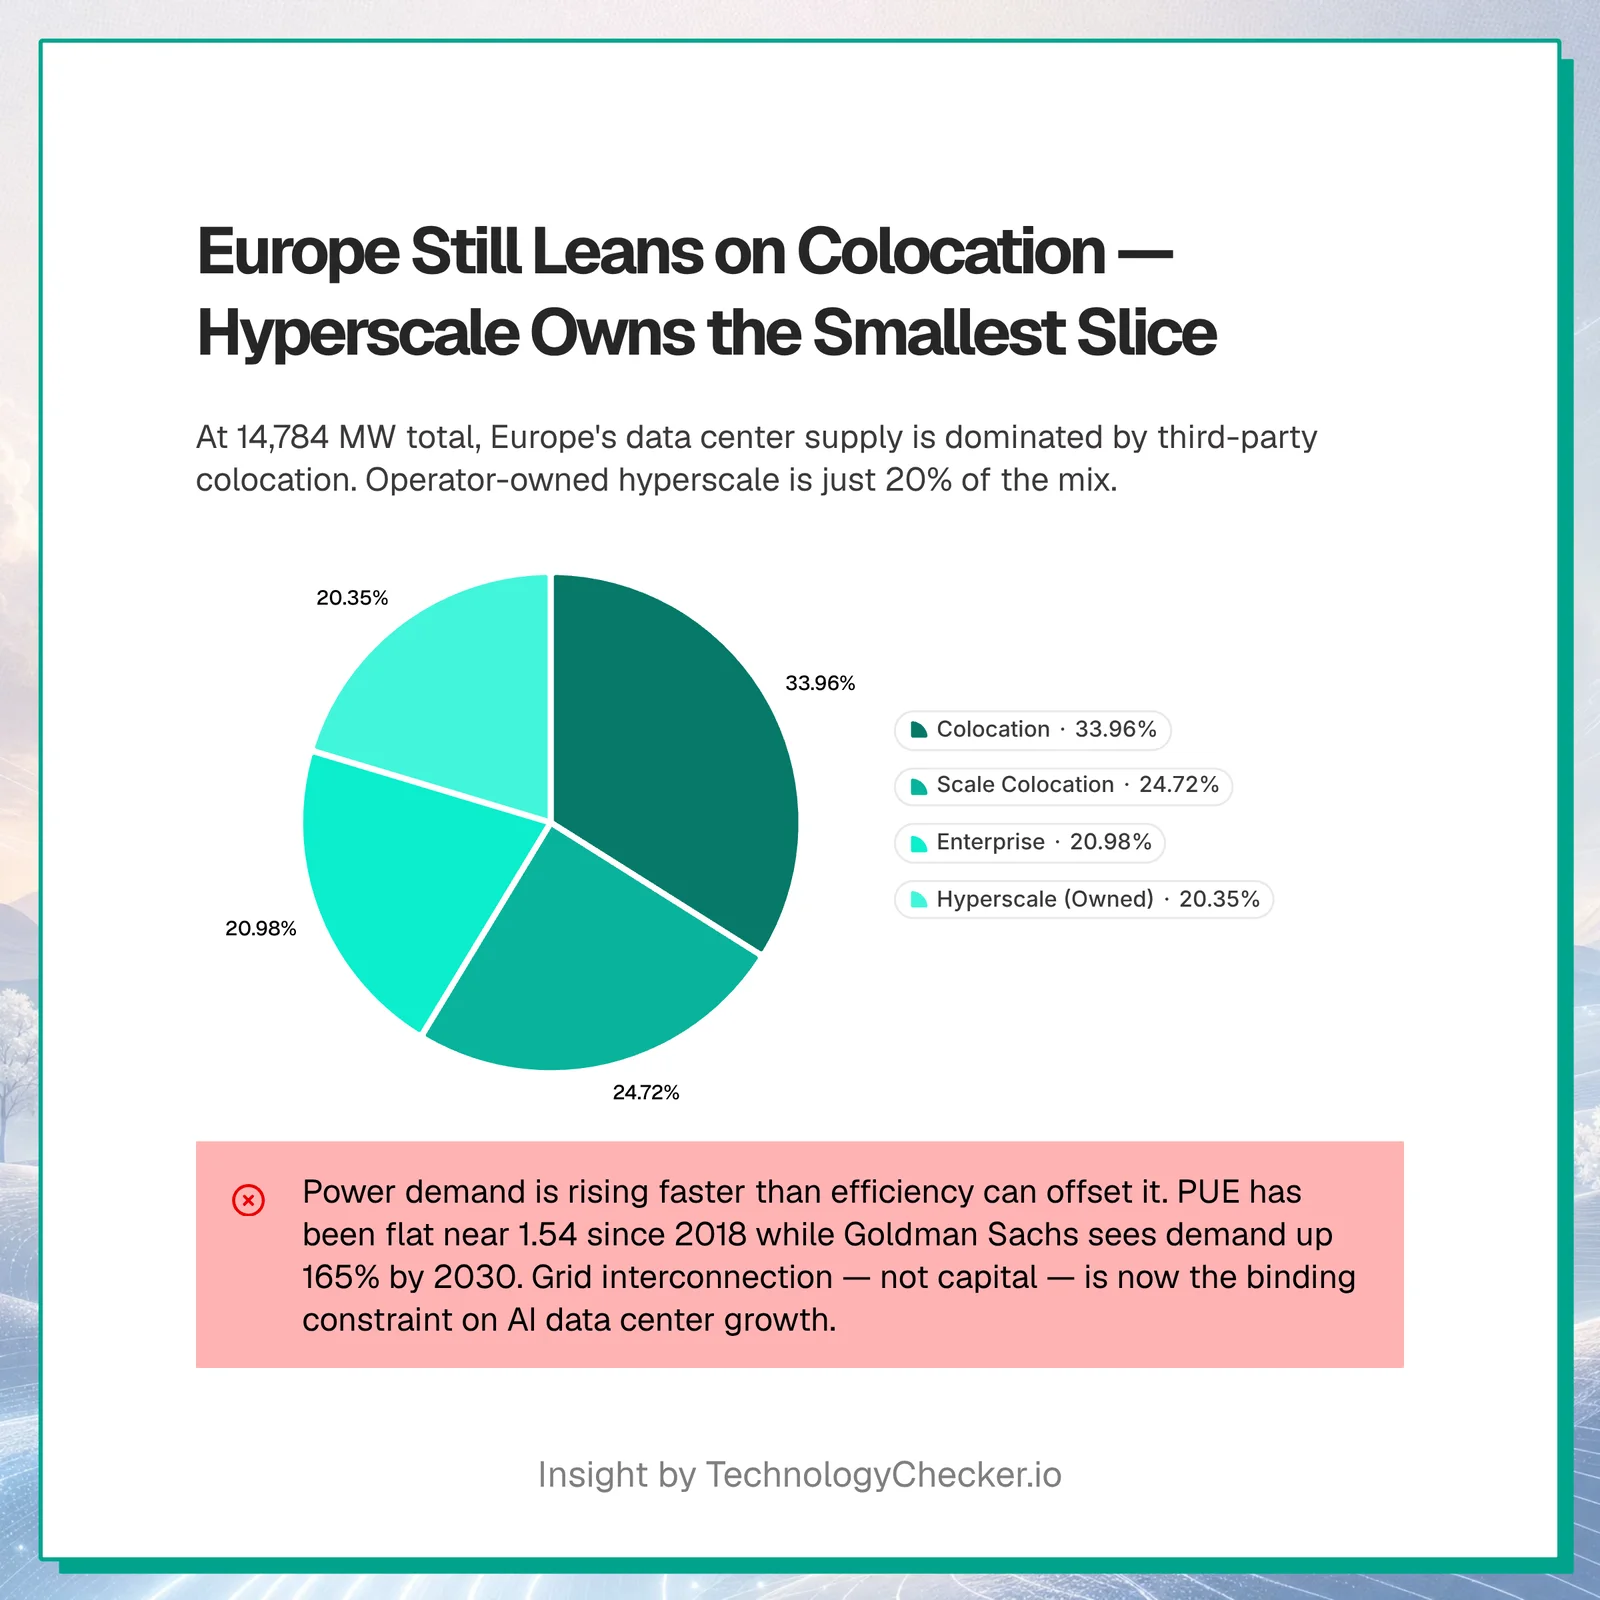
Efficiency is not coming to the rescue fast enough. Power usage effectiveness (PUE), the ratio of total facility power to the power that reaches the IT equipment, improved from 2.5 in 2007 to 1.54 in 2025. But almost all of that gain happened before 2018. Since then the average has been stuck in the 1.5 to 1.6 band, because the cheap wins like hot-aisle containment and free cooling are exhausted. The next step down needs liquid cooling built for high-density AI racks.
Global Data Center PUE 2007-2025: 2.5 to 1.54 (Efficiency Plateau)
Global average data center PUE improved from 2.5 in 2007 to 1.54 in 2025. Almost all of that gain happened before 2018. Since then the curve has flattened in the 1.5 to 1.6 band — the cheap efficiency wins like hot-aisle containment and free cooling are exhausted. Pushing lower now requires liquid cooling and rack designs built for high-density AI workloads.
Source: Uptime Institute · 2007-2025
| Year | PUE (lower is better) |
|---|---|
| 2007 | 2.5 |
| 2011 | 1.98 |
| 2013 | 1.65 |
| 2018 | 1.58 |
| 2019 | 1.67 |
| 2020 | 1.59 |
| 2021 | 1.57 |
| 2022 | 1.55 |
| 2023 | 1.58 |
| 2024 | 1.56 |
| 2025 | 1.54 |
- PUE improved from 2.5 (2007) to 1.54 (2025) — a 38% reduction
- Gains have plateaued since 2018, stuck in the 1.5-1.6 band
- Next improvements require liquid cooling for AI-class rack density
Operators are scrambling for power supply. In a 2025 survey, 35% named onsite renewable energy or battery storage as their primary power solution, ahead of natural gas and fossil fuels at 23%. Notably, 4% already have small modular reactors in their plans.
| Primary power solution | Share of operators (2025) |
|---|---|
| Onsite renewable energy / battery storage | 35% |
| Natural gas / fossil fuels | 23% |
| None of the above | 16% |
| Microgrids | 14% |
| Hydrogen | 4% |
| SMR in plans | 4% |
| Other | 4% |
That nuclear interest is real but early. Just two small modular reactors were operational worldwide as of 2026, with 127 more planned or under construction. The United States leads the pipeline with 45 projects, almost all still in planning.
| Country | SMR projects (2026) | Status |
|---|---|---|
| United States | 45 | 44 planned, 1 under construction |
| Russia | 18 | 1 operational, 2 under construction, 15 planned |
| France | 12 | 12 planned |
| China | 12 | 1 operational, 1 under construction, 10 planned |
| Japan | 10 | 10 planned |
| Canada | 6 | 6 planned |
| South Korea | 6 | 6 planned |
| United Kingdom | 6 | 6 planned |
Power cost also varies sharply by region. Across Asia-Pacific, Singapore is the most expensive market for data center power and Mumbai the cheapest, per Cushman & Wakefield's January 2025 benchmark. One caveat worth stating: these are benchmark figures for a 20 MW facility at PUE 1.5, and the source labels the unit as US dollars per kilowatt-hour. Treat the ranking, not the absolute unit, as the takeaway.
| Market | Power cost benchmark (USD/kWh, as reported) |
|---|---|
| Singapore | 138 |
| New Zealand (Auckland) | 108 |
| Japan (Tokyo) | 102 |
| Taiwan (Taipei) | 99 |
| Philippines (Metro Manila) | 98 |
| Indonesia (Jakarta) | 88 |
| Australia (Sydney) | 86 |
| Thailand (Bangkok) | 75 |
| China (Shanghai) | 73 |
| Hong Kong (Kowloon) | 71 |
| South Korea (Seoul) | 66 |
| Malaysia (Kuala Lumpur) | 53 |
| Vietnam (Ho Chi Minh City) | 52 |
| India (Mumbai) | 48 |
In Europe, the supply still leans on third-party colocation rather than operator-owned sites. Colocation accounts for the largest share of European data center IT power at 5,020 MW, about a third of the region's 14,784 MW total.
Who is winning the data center buildout?
Three different companies lead three different layers of the stack, and the money chasing them is enormous. JLL calls the current moment an "infrastructure investment supercycle" requiring up to $3 trillion by 2030; McKinsey has put the figure as high as $6.7 trillion. Global investment in data centers had already nearly doubled since 2022 to roughly half a trillion dollars in 2024, per the IEA.
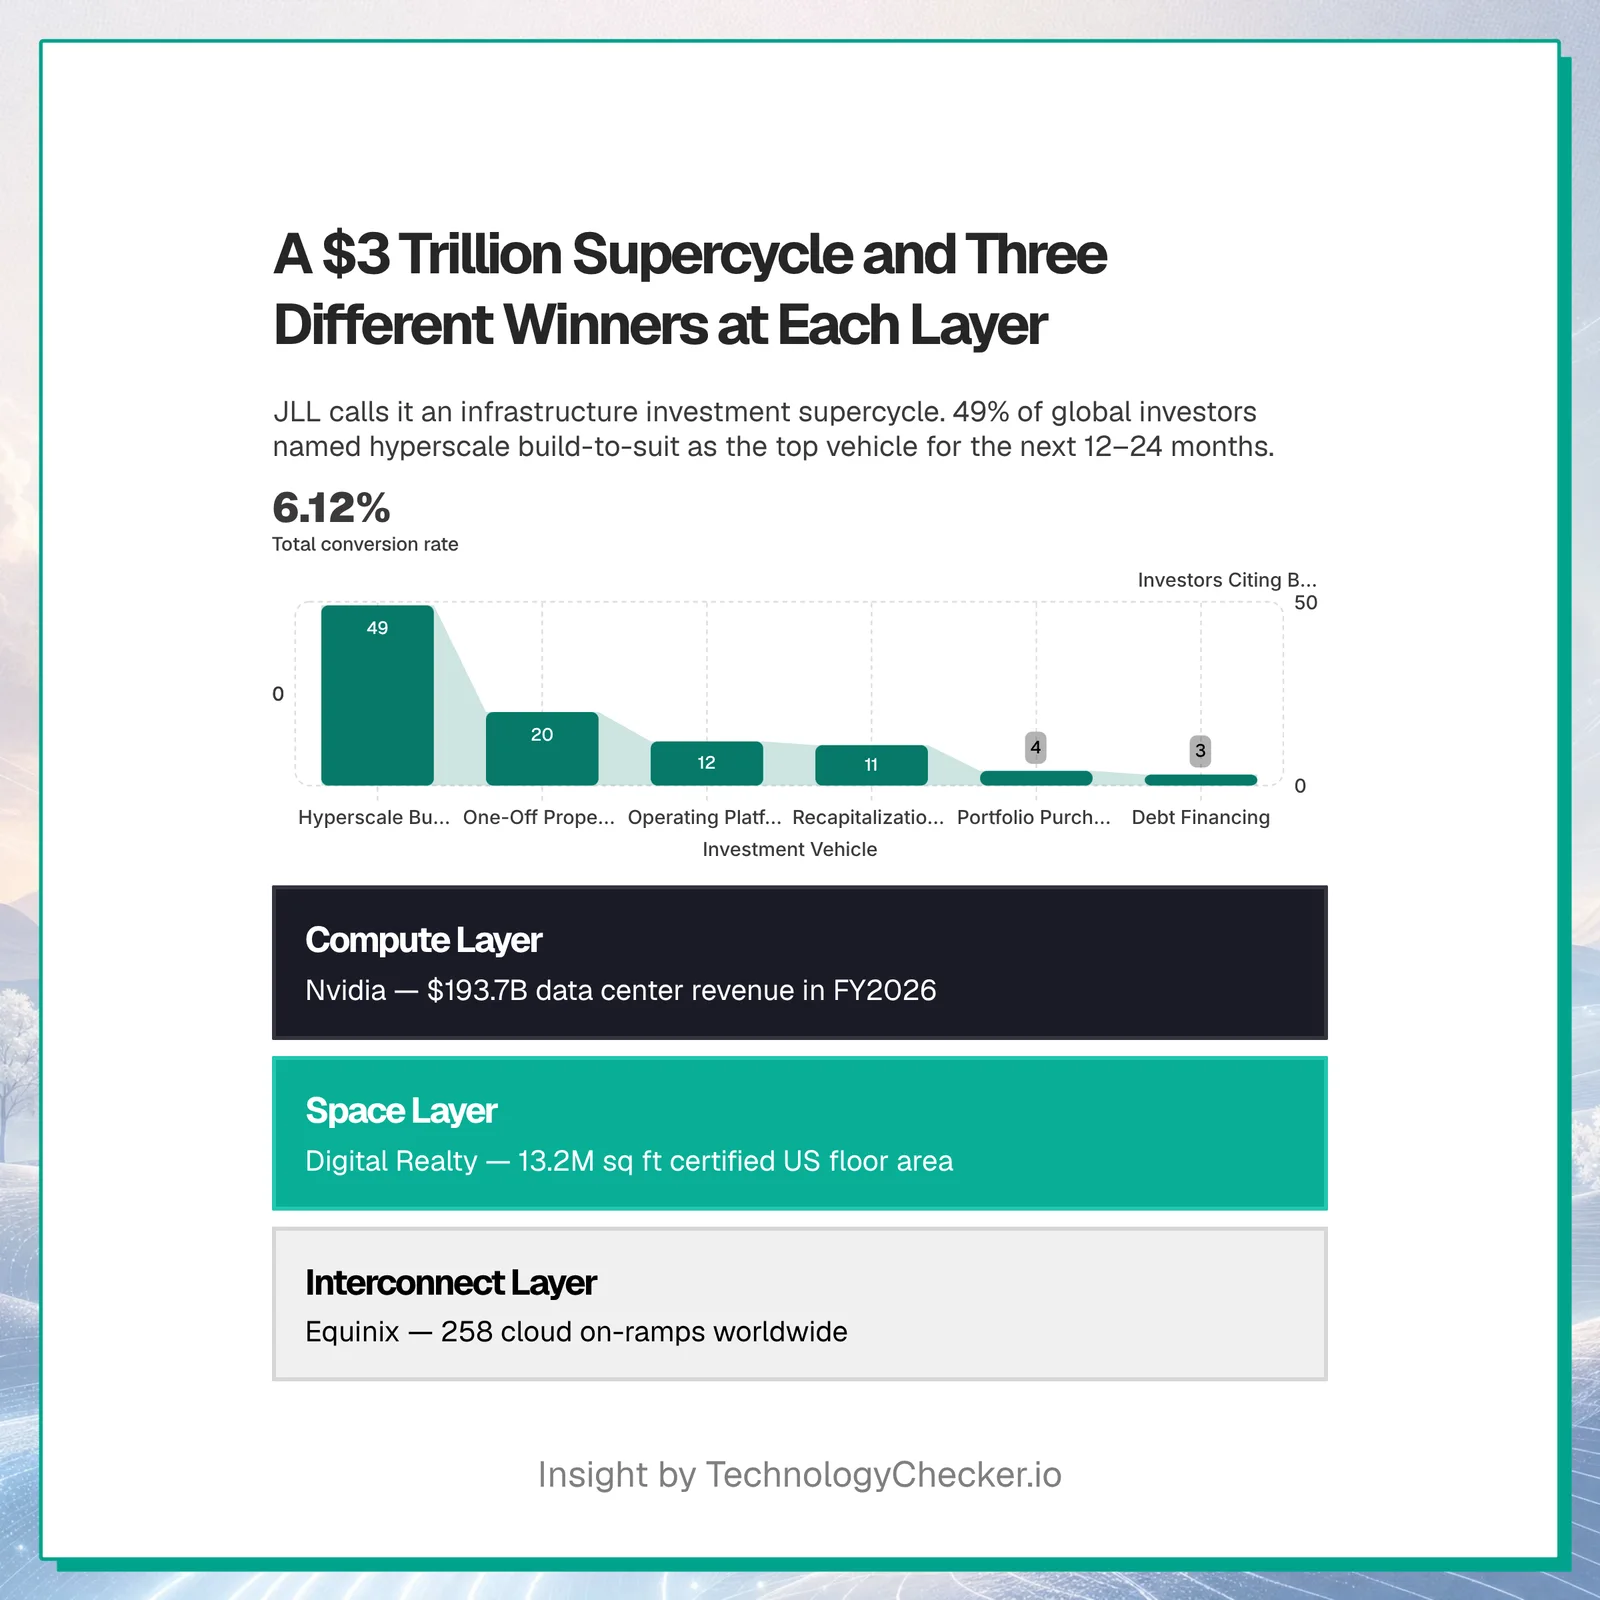
In the survey of where that capital should go, 49% of global investors named hyperscale build-to-suit as the data center vehicle with the best prospects for the next 12 to 24 months, more than twice the next option.
| Investment vehicle | Investors citing best prospects (2025) |
|---|---|
| Hyperscale build-to-suit | 49% |
| One-off property purchases | 20% |
| Operating platform / entity investment | 12% |
| Recapitalization of existing projects | 11% |
| Portfolio property purchases | 4% |
| Debt financing | 3% |
On the real estate side, Digital Realty owns the most Energy Star-certified data center floor area in the US at 13.2 million square feet, four times its nearest competitor, Cyxtera Technologies. The ranking is a decent proxy for who operates the largest certified US footprints.
| Owner | Energy Star-certified floor area (1,000 sq ft, May 2025) |
|---|---|
| Digital Realty | 13,210 |
| Cyxtera Technologies | 3,149 |
| Switch LTD | 2,244 |
| Equinix | 1,642 |
| NTT Global Data Centers Americas | 1,421 |
| QTS Realty Trust | 1,304 |
| EdgeConneX | 1,221 |
| Sabey Data Centers | 1,057 |
| Yahoo | 1,045 |
| QTs | 969 |
For interconnection, the metric is cloud on-ramps, the direct private links into AWS, Azure, and Google Cloud. Equinix leads with 258 cloud on-ramps worldwide, ahead of Digital Realty's 100. Equinix is strongest in North America, while Digital Realty's strength is Europe.
| Operator | Total cloud on-ramps (2025) | Leading region |
|---|---|---|
| Equinix | 258 | North America (113) |
| Digital Realty | 100 | Europe (71) |
| CoreSite | 44 | North America (44) |
| NEXTDC | 13 | Oceania (13) |
| NTT Global Data Centers | 7 | Asia (7) |
| Cirion Technologies | 7 | Latin America (7) |
How was this data compiled?
This report synthesizes a 2026 Statista Data Centers dossier, cross-referenced against the primary source behind each chart, and supplemented with verified 2026 market and power projections from independent research houses. I rebuilt the visualizations from source-labeled values so each chart credits its original publisher rather than the aggregator. Forecast and estimated figures are labeled as such. Two layers come from our own measurement rather than third-party reports: the cloud-infrastructure footprint table is TechnologyChecker detection data, and the AI-crawler figures are pulled live from Cloudflare Radar.
Primary sources by topic:
- Total market revenue and segments: Statista Market Insights; Precedence Research
- AI data center market size: Fortune Business Insights, Mordor Intelligence, Technavio, ABI Research
- IT and data center systems spending: Gartner
- Hyperscale counts: Synergy Research Group
- Market inventory, vacancy, and investment: CBRE Group
- Construction cost per watt: Turner & Townsend
- Power demand and capacity forecasts: Goldman Sachs, Deloitte, JLL, IEA
- Electricity demand and PUE: IEA; Uptime Institute (2025 survey, 526 respondents)
- Nvidia data center revenue: Nvidia
- APAC power cost: Cushman & Wakefield (20 MW facility benchmark, PUE 1.5)
- Facility counts, certified floor area, on-ramps, SMRs: Data Center Map; Energy Star; Cloudscene; World Nuclear Association
- European power volume: European Data Centre Association and Pb7 Research
- Cloud and edge infrastructure footprint: TechnologyChecker.io detection data — our latest monthly crawl of 29.9M active domains (June 2026), fingerprinting cloud, CDN, and edge platforms from HTTP response headers, DNS records, and page markup
- AI-crawler traffic and crawl purpose: Cloudflare Radar AI bots, 28-day window ending 30 June 2026
- Hyperscaler latency: Cloudflare Radar Cloud Observatory origins (edge-to-origin latency for AWS, Google Cloud, Azure, Oracle), 28-day window ending June 12, 2026
For more on the demand side of this buildout, see our AI market size statistics and AI adoption trends, and our internet outage report on infrastructure reliability.
The bottom line
The data center market in 2026 is defined by a single tension. Demand, measured in spending, chips, and physical capacity, is breaking historical records because of AI. Supply, measured in power and efficiency, is hitting hard limits at the same time. A $416 billion total market growing toward $620 billion sounds like steady expansion until you notice that the AI segment inside it is compounding at 25%+ a year and that the efficiency curve meant to absorb it has been flat since 2018.
That is what makes the next few years different from the last decade of data center growth. The constraint is moving from capital to kilowatts. There is $3 trillion or more ready to be spent by 2030, but Goldman Sachs sees power demand rising 165% and Deloitte sees the US AI segment alone needing 123 GW by 2035. Operators are answering with onsite renewables, gas turbines, and early bets on small modular reactors, but only two SMRs are running worldwide so far. The buildout will not slow on its own. Whether the grid can feed it is the open question, and the companies that solve power, not the ones that buy the most GPUs, are the ones to watch.
Frequently asked questions
How big is the data center market? The total data center market generated $416.09 billion in revenue in 2024, according to Statista Market Insights, and is forecast to climb past $620 billion by 2029. Network infrastructure is the largest hardware segment at $239.68 billion.
How big is the AI data center market? The dedicated AI data center market was worth $21–49 billion in 2026 depending on definition, and is projected to reach $133–197 billion by the mid-2030s at a 25%+ CAGR. Fortune Business Insights pegs it at $21.27 billion in 2026 rising to $133.51 billion by 2034.
What is driving data center growth in 2026? Generative AI is the main driver. Data center systems spending grew 48.8% in 2025 and is forecast to reach $582.45 billion in 2026 (Gartner), while Nvidia's data center revenue hit $193.7 billion in fiscal 2026.
How much will data center power demand grow? Goldman Sachs forecasts global data center power demand will rise 165% by 2030 versus 2023. Deloitte estimates US AI data center power demand could grow more than thirtyfold to 123 GW by 2035. Average PUE has plateaued at 1.54.
How much electricity do data centers use today? Data centers consume about 415 TWh, roughly 1.5% of global electricity, per the IEA. Combined demand from data centers, AI, and crypto could reach 1,050 TWh by 2026 in the upper scenario.
Which country has the most data centers? The United States has 4,184 data centers as of April 2026, far ahead of the United Kingdom (515) and Germany (514), and more than the next ten countries combined.
How many hyperscale data centers are there? There were 1,297 hyperscale data centers worldwide by Q3 2025, up from 700 in 2021 and 259 in 2015, according to Synergy Research Group.
Which cloud platforms host the most websites? In TechnologyChecker's June 2026 crawl of 29.9 million active domains, Cloudflare's edge leads at 2,336,055 domains, followed by Google Cloud (1,493,671), Amazon S3 (398,892), and Amazon CloudFront (305,650). These are the operators whose data centers ultimately serve the public web, and they are the same hyperscalers driving the AI data center buildout.
What share of AI crawler traffic is for model training? 47.43% of AI-crawler requests are for model training, per Cloudflare Radar's 28-day window ending 30 June 2026, with 38.86% mixed-purpose and 10.38% for search. Googlebot (25.01%), ClaudeBot (20.07%), and Meta-ExternalAgent (10.14%) are the highest-volume AI crawlers.

Data Analyst
5+ years of experience
Emma is a Data Analyst at TechnologyChecker, where she analyses technology adoption data to build better prospect lists and uncover actionable patterns for sales teams.
- BSc Data Science, Cardiff University
- Google Data Analytics Professional Certificate
- Tableau Desktop Certified Associate
Never miss our research

