Safari Market Share 2026: 17.7% Overall, 26.1% Mobile, 7.1% Desktop
Safari holds 17.7% of web traffic in 2026, #2 but slipping. Apple's devices make 28.2% of all traffic, yet Safari keeps just 17.7%. See the breakdown.
Published •Updated •31 min read

Safari holds 15.7% of all global web traffic in 2026, rising to 17.7% once you count only human requests, not bots. That makes it the world's second browser, far behind Chrome's 68.1% and slowly declining. The twist: Apple's devices generate 28.2% of web traffic, but Safari captures only 17.7% of it.
I pulled all of this from Cloudflare Radar for the 28-day window ending 9 June 2026, plus the 52-week trend behind it. Here's what the data actually says, country by country, with the parts most browser-share roundups skip.
Safari is the world's #2 browser, and it's been sliding all year

Safari's market share in 2026 is 15.7% across all global web traffic and 17.7% when you measure human-only requests, per Cloudflare Radar. It's a clear second place. It's also not close to first.
When I lined up the browser-family numbers, the spread told the story in one row. Chrome runs at 68.1% of human traffic. Safari sits at 17.7%. That's a 3.9x gap between first and second, the kind of lead that doesn't change hands quarter to quarter.
The two figures differ for a reason worth knowing. Radar measures the share of HTTP requests across Cloudflare's network, and a lot of that traffic isn't people. It's bots, scrapers, and automated agents, and they overwhelmingly identify as Chrome or headless engines. Filter to human traffic and Safari climbs about two points, from 15.7% to 17.7%. I'll use the 17.7% human figure for most of this report, because that's the number that maps to people loading your site.
I don't trust a single headline figure until I've rebuilt it from more than one angle. Before writing any of this, I re-pulled Safari from the per-country, per-device, and per-OS cuts you'll see below, and every slice reconciles back to the same 15.7% all-traffic and 17.7% human range. That internal consistency, the same number falling out no matter how I sliced Cloudflare's data, is what tells me the headline is solid rather than an artifact of one query.
Here's Safari's share three ways, depending on what traffic you decide to count:
| Traffic measured | Safari | Chrome |
|---|---|---|
| All requests | 15.7% | 69.8% |
| Human only | 17.7% | 68.1% |
| Bots only | 8.3% | 78.4% |
The bot column is the tell. Automated traffic almost never runs Safari. Scrapers and headless agents identify as Chrome 78.4% of the time, so the more bots a dataset includes, the smaller Safari looks. Safari is a genuinely human browser, which is exactly why the human-only figure is the one worth quoting.
My read for product and analytics teams: roughly one in six of your human visitors is on Safari. Too big to skip in testing, too small to build around. It's a must-support, won't-dominate browser, and that framing matters more than the exact decimal.
Safari lost 2 points in 12 months, and Chrome took almost all of it

Safari's human traffic share fell from 19.4% in June 2025 to 17.4% in June 2026. Two points in a year. Over the same stretch, Chrome went the other way, from roughly 67.6% to 68.7%.
Safari Browser Market Share Trend: 19.4% to 17.4% Over 12 Months
Safari's share of human web traffic fell from 19.4% in June 2025 to 17.4% in June 2026. The decline wasn't a cliff — it was a steady grind, with the sharpest single step-down in September 2025 when share dropped from 19.5% to 18.8%. Chrome absorbed almost all of the lost share over the same window.
Source: Cloudflare Radar · Jun 2025 – Jun 2026
| Month | Safari share of human web traffic (%) |
|---|---|
| Jun 2025 | 19.4% |
| Jul 2025 | 19.5% |
| Aug 2025 | 19.5% |
| Sep 2025 | 18.8% |
| Oct 2025 | 18.2% |
| Nov 2025 | 18.7% |
| Dec 2025 | 18.6% |
| Jan 2026 | 18.1% |
| Feb 2026 | 18% |
| Mar 2026 | 17.8% |
| Apr 2026 | 17.8% |
| May 2026 | 17.7% |
| Jun 2026 | 17.4% |
- Down 2 points in 12 months, from 19.4% to 17.4%
- The sharpest step-down landed in September 2025 (19.5% to 18.8%)
- Chrome gained almost exactly what Safari lost over the same year
When I plotted the full 52-week series, the decline wasn't a cliff. It was a grind. Safari spent mid-2025 hovering near 19.5%, then stepped down hard in September, dropping to 18.8% and never recovering. After that it drifted lower month after month, with a small bounce around November before resuming the slide into 2026.
What stood out is how cleanly the two trends mirror each other. Safari loses about what Chrome gains. There's no third browser quietly eating Safari's lunch. The share is moving between the two leaders, and it's moving in one direction.
The chart above is our frozen snapshot. Here's the same browser-family trend pulled live from Cloudflare Radar, so you can check whether the slide has continued since this went out:
A quick honesty note on the numbers. The trend series (19.4% to 17.4%) is a monthly average of weekly data, sampled a little differently from the 28-day snapshot that gives the 17.7% headline. Both come from Radar, both track human traffic, and both agree on direction and rough size. I cite the snapshot for "where we are now" and the weekly series for "how we got here." If you want the device backdrop driving all of this, our analysis of mobile internet usage by country covers the shift in detail.
The full-quarter view: Safari's lost share split between Chrome and Edge
The section above measures June 2025 against June 2026, point to point. When I re-ran it as full calendar quarters, all of Q2 2025 against all of Q2 2026 on human traffic only, the decline held but the destination changed. Over the quarter Safari fell from 19.3% to 17.9%, about a point and a half, and that share didn't just go to Chrome. It split almost evenly between the two browsers sitting above Safari.
| Browser | Q2 2025 | Q2 2026 | Year-over-year |
|---|---|---|---|
| Chrome | 67.6% | 68.3% | +0.7 pt |
| Safari | 19.3% | 17.9% | −1.4 pt |
| Edge | 5.9% | 6.6% | +0.7 pt |
| Firefox | 3.6% | 3.8% | +0.2 pt |
| Samsung Internet | 1.9% | 1.8% | −0.1 pt |
| Opera | 1.5% | 1.4% | −0.1 pt |
Source: Cloudflare Radar — http/summary/browser_family, human (LIKELY_HUMAN) traffic, full calendar quarters (Q2 2025 vs Q2 2026). Pulled 2026-07-03.
The full-quarter figure lands right on the headline: 17.9% over three months against the 17.7% from the 28-day snapshot up top, so the number this report is built on still holds a month past publication. What the wider window adds is the other half of the "Chrome took it" story. Chrome and Edge each picked up about 0.7 points, which means Edge rose just as fast as Chrome did over the year. The race at the top is still Chrome versus Safari, but there's a quiet third mover, and the operating-system data says exactly why.
Safari only runs on Apple platforms, so its ceiling is Apple's device footprint, and that footprint moved. Here's the same human-traffic cut by operating system, year over year:
| Operating system | Q2 2025 | Q2 2026 | Year-over-year |
|---|---|---|---|
| Android | 37.4% | 36.2% | −1.2 pt |
| Windows | 30.8% | 32.9% | +2.1 pt |
| iOS | 21.5% | 19.6% | −1.9 pt |
| macOS | 8.1% | 8.9% | +0.8 pt |
Source: Cloudflare Radar — http/summary/os, human traffic, full calendar quarters (Q2 2025 vs Q2 2026). Apple combined (iOS + macOS) = 28.5% in Q2 2026, down about 1.2 points year over year. Pulled 2026-07-03.
This is the mechanism behind both moves in the browser table. Apple's combined footprint shrank about 1.2 points over the year, and all of the drop came from iOS, which fell roughly two points while macOS actually edged up. A smaller iOS base is a lower ceiling for Safari, and that accounts for most of its 1.4-point slide. Meanwhile Windows grew more than two points, and Windows is Edge's home turf, so Edge's rise isn't about Safari at all. It's riding a desktop-share gain Safari can never reach. Chrome, which sits on both Android and Windows, banks a slice of each.
So the cleaner one-year read is that Safari isn't so much losing users to Chrome as losing ground while the iPhone's slice of global traffic contracts. The browser is tracking its platform down, and the platform is the number to watch.
One note on where it sits today. The 28-day window ending 3 July 2026, a month past this report's snapshot, reads Safari at 18.0% of human traffic, essentially flat against the 17.7% headline. Quarter over quarter the decline is clean; week to week it's noisy enough that the last month reads sideways. That's the grind the closing section predicts rather than a cliff, and it's still pointed the same way.
Safari's share triples between India and the UK, and it's all about iPhones

Safari varies by country more than any other major browser, because it tracks one thing almost perfectly: how common iPhones are. Among major markets, the UK leads at 30.3% of human traffic, the US sits just behind at 28.8%, and India lands at the bottom at 4.3%.
Here are the top 10 major markets, ranked by Safari's share of human web traffic:
| Country | Safari share (human traffic) |
|---|---|
| United Kingdom | 30.3% |
| United States | 28.8% |
| Japan | 26.0% |
| Australia | 26.0% |
| Canada | 25.0% |
| Germany | 22.3% |
| France | 19.2% |
| Italy | 17.7% |
| Brazil | 11.0% |
| India | 4.3% |
The pattern is iPhone penetration, full stop. In wealthy English-speaking markets where the iPhone is the default phone for a big slice of people, Safari clears 25-30%. In price-sensitive markets where Android rules, it falls off a shelf. India's 4.3% is roughly one-seventh of the UK's, because Chrome runs at 88.9% there on the back of cheap Android handsets. Brazil tells the same story: Chrome 79.3%, Safari 11.0%.
One ranking I want to flag so nobody misreads it. If you sort by Safari's rate within a territory, the top is tiny, wealthy places: Jersey at 36.1%, the Faroe Islands at 34.4%, Kosovo at 31.8%. Those are concentration figures, not global share. They reflect dense Apple ownership in small, high-income populations, not big pools of Safari users. Jersey isn't moving the global needle. Treat it as a curiosity, not a planning input.
For teams selling into specific regions, this is the row that matters. A product targeting UK or US enterprise buyers should treat Safari as a near-30% browser in that market. Those same buyers' device habits, phone versus laptop, show up in our mobile vs desktop usage in the UK breakdown. The same product expanding into India should plan for Safari to be a rounding error and put Chrome-on-Android first.
Chrome 68%, Safari 18%, and everyone else fighting over scraps

In the full 2026 picture, Chrome takes 68.1% of human web traffic, Safari is a distant second at 17.7%, and everyone else splits the remaining 14%. Edge, Firefox, Samsung Internet, and Opera put together don't reach Safari's share.
Here's the global breakdown for human traffic:
| Browser | Share (human traffic) |
|---|---|
| Chrome | 68.1% |
| Safari | 17.7% |
| Edge | 6.7% |
| Firefox | 4.1% |
| Samsung Internet | 1.8% |
| Opera | 1.4% |
Two things jump out. Edge at 6.7% is now the clear #3. It ships as the Windows default, and that alone puts it past Firefox. Firefox at 4.1% keeps fading, a slow story that's been running for a decade. And Samsung Internet at 1.8% is the reminder that on Android, the browser isn't always Chrome.
If you look at all-traffic instead of human-only, the order holds but the values shift: Chrome rises to 69.8% and Safari drops to 15.7%, because bots lean Chrome. Which number you quote depends on the question. For "what do my visitors actually use," the human figure is the honest one. The all-traffic number mostly tells you how botted a sample is, not what real people browse with.
Cloudflare's own Year-in-Review view of the desktop browser market makes the desktop weakness obvious at a glance:
I get asked where Brave is. It doesn't show up as its own line in Radar's browser-family data because it reports as Chrome under the hood. Brave is Chromium-based and carries Chrome's user-agent profile, so its real usage folds into the Chrome number. Worth knowing before you go hunting for a Brave figure that doesn't exist in this dataset. For how concentrated markets like this tend to behave, our breakdowns of search engine market share and ecommerce marketplace market share show the same one-dominant-player shape.
Safari is really a mobile browser that happens to run on a few Macs

Safari's whole position is a mobile story. Mobile is now 55.2% of human web traffic against 44.8% for desktop, and Safari rides that tilt because it's the default browser on every iPhone.
Split the browser market by device and the two worlds barely look related:
| Browser | Mobile share | Desktop share |
|---|---|---|
| Chrome | 69.3% | 66.8% |
| Safari | 26.1% | 7.1% |
| Edge | 0.0% | 15.1% |
| Firefox | 0.7% | 8.5% |
| Samsung Internet | 3.1% | 0.1% |
| Opera | 0.5% | 2.4% |
On phones, Safari is the clear #2 at 26.1%. On desktop, it drops to 7.1% and falls to fourth, behind both Edge (15.1%) and Firefox (8.5%). Edge does the reverse: 15.1% on desktop where it's the Windows default, basically zero on mobile. When I broke Safari down by user agent, the lopsidedness got starker still. Mobile Safari and its in-app webview together make up about 14.4% of all human traffic; desktop Safari is just 3.1%. Roughly four out of every five Safari sessions happen on a phone. And even that mobile base is softening: when I compared the last six months with the prior six, mobile Safari ticked down from 27.7% to 26.4%. It's still a strong second to Chrome, but the floor holding Safari up is settling, not rising.
Filter the live browser trend to mobile devices only and Safari's real position shows up, a strong second to Chrome rather than the also-ran it looks like on desktop:
Look at the two environments separately. On mobile, when someone buys an iPhone, Safari is what opens when they tap a link, and most people never change it. So Safari captures a large slice of iOS browsing by default. On desktop, it flips. Most desktop machines run Windows, where Safari isn't even available. Apple killed Safari for Windows years ago. So on desktop, Safari exists only on Macs, and even there it's in a real fight with Chrome.
That split is why the overall number lands where it does. Safari is strong in the half of the web that's growing and weak in the half that isn't. The 55.2% mobile majority is, in plain terms, the floor holding its share up.
The practical version for web teams: if you test Safari only on a desktop Mac, you're testing the wrong Safari. The Safari that matters is mobile Safari on iOS, and it behaves differently, with its own viewport quirks, gesture handling, and rendering edge cases. Your real Safari audience is overwhelmingly on phones.
Country by country: Safari is a phone browser everywhere and a desktop browser nowhere

The global mobile-versus-desktop split repeats inside every market, but the magnitudes swing hard. I pulled Safari's human-traffic share three ways, overall, mobile-only, and desktop-only, for 15 countries, then put the operating-system mix underneath to show why each number lands where it does. Two patterns hold in all 15: Safari is far bigger on phones than on desktops in every single country, and its desktop share never clears 14% anywhere, even in the most Apple-heavy markets.
| Country | Overall | Mobile | Desktop |
|---|---|---|---|
| United Kingdom | 30.3% | 45.4% | 13.1% |
| United States | 28.8% | 51.8% | 10.5% |
| Japan | 26.0% | 40.4% | 7.1% |
| Australia | 26.0% | 47.7% | 9.8% |
| Canada | 25.0% | 44.6% | 9.6% |
| Germany | 22.3% | 33.4% | 11.3% |
| Netherlands | 21.6% | 34.4% | 9.4% |
| France | 19.2% | 29.2% | 9.1% |
| Italy | 17.7% | 24.4% | 8.7% |
| Turkey | 16.3% | 25.1% | 4.3% |
| Spain | 14.1% | 23.5% | 6.4% |
| Mexico | 13.9% | 19.3% | 5.4% |
| South Korea | 11.7% | 19.7% | 3.6% |
| Brazil | 11.0% | 14.8% | 1.8% |
| India | 4.3% | 4.9% | 2.7% |
The mobile column is the real Safari. In the wealthy English-speaking markets it runs 44-52% of phone browsing, and in the US it's an outright majority. That single column is most of what Safari "is," because the web tilts mobile and iPhone owners overwhelmingly stay on the browser that opened when they tapped a link.
The desktop column is where Safari falls apart, and it falls apart everywhere. Even in the UK, Safari's strongest desktop market, it's only 13.1%. By Brazil and India it's a rounding error at 1.8% and 2.7%. The reason is the same in every country: Windows owns the desktop. A market can be wall-to-wall iPhones on the train and still be wall-to-wall Windows at the desk, because the desktop is usually a work machine someone else bought. That desktop weakness is exactly what drags each country's overall number well below its mobile number.
The operating-system mix underneath explains all of it. Safari only runs where Apple does, so its ceiling in any country is that country's combined iOS plus macOS share, and you can watch the browser number track the OS number market by market.
| Country | iOS | macOS | Android | Windows |
|---|---|---|---|---|
| United Kingdom | 29.1% | 13.7% | 24.5% | 29.9% |
| United States | 28.1% | 16.0% | 16.5% | 35.6% |
| Japan | 30.4% | 7.8% | 26.7% | 33.8% |
| Australia | 26.2% | 17.2% | 17.0% | 37.2% |
| Canada | 25.6% | 15.5% | 18.6% | 36.5% |
| Germany | 21.9% | 11.4% | 28.5% | 34.7% |
| Netherlands | 22.4% | 12.2% | 26.9% | 34.7% |
| France | 20.0% | 11.1% | 30.4% | 36.0% |
| Italy | 20.2% | 9.0% | 37.5% | 31.4% |
| Turkey | 20.9% | 4.8% | 37.6% | 35.0% |
| Spain | 15.4% | 10.1% | 30.4% | 40.2% |
| Mexico | 15.6% | 7.4% | 45.4% | 30.2% |
| South Korea | 16.0% | 5.7% | 34.8% | 41.2% |
| Brazil | 13.9% | 2.1% | 57.0% | 25.6% |
| India | 7.0% | 3.5% | 67.5% | 20.4% |
Read the two tables together and the mechanism is obvious. A country's iOS share sets its mobile Safari share, and its macOS share sets its desktop Safari share. The UK and US sit on roughly 43-44% combined Apple OS share and convert that into 29-30% Safari. India sits on 10.5% Apple share and converts it into 4.3%. Safari never captures all of its Apple footprint, because some of those iPhone and Mac owners run Chrome, but the footprint is the hard ceiling everywhere.
Two markets break the simple "rich country, lots of Safari" intuition, and the OS table says why. South Korea is wealthy but gives Safari just 11.7%, because it's Samsung's home turf: iOS is only 16.0% against 34.8% Android, so most premium phones there are Galaxies, not iPhones. Turkey shows the split cleanly the other way, where iPhones are common enough on mobile to put Safari at 25.1% on phones, but macOS is a tiny 4.8% slice, so desktop Safari craters to 4.3%. Wealth doesn't buy Safari share. iPhones and Macs do.
For teams shipping to specific regions, this is the planning table. If you sell into the UK, US, Japan, Australia, or Canada, treat mobile Safari as a 40-52% browser in your market, not the 17.7% global figure, and test iOS first. Expanding into Brazil, India, Mexico, or South Korea? Safari on the desktop is effectively absent, and even on mobile it's a minority, so Chrome on Android is where almost all your users are.
The stat that stopped me: Apple's OS share is 28%, but Safari gets 18%
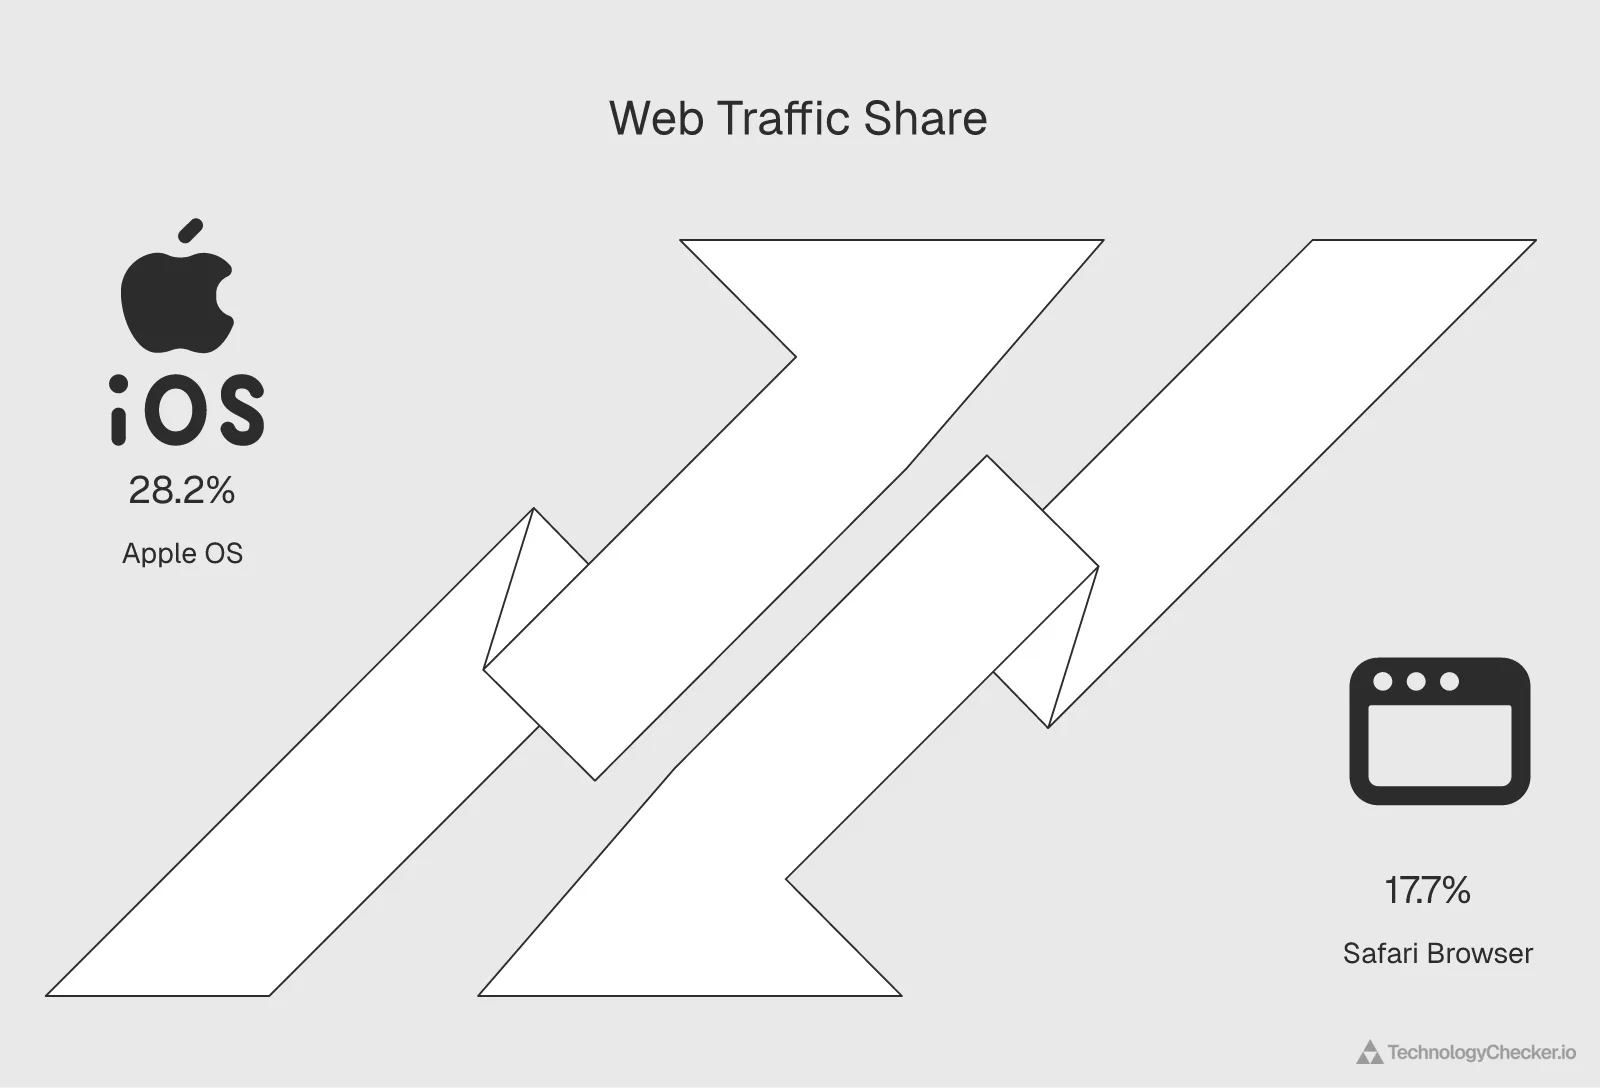
This is the number I keep coming back to. Apple's own operating systems generate 28.2% of human web traffic (iOS at 19.4% plus macOS at 8.8%). Safari captures 17.7%. That's a gap of more than 10 points, and every point of it is an Apple-device owner who opened Chrome instead of the browser their phone or Mac shipped with.
That gap is the real driver of the decline. Safari's ceiling is capped by Apple's hardware footprint, because it only runs on Apple platforms. But inside that footprint, it's leaking. People on iPhones and Macs install Chrome and use it instead, pulled by synced tabs and passwords on their Android or Windows work machine, and by plain habit.
The OS picture also explains the hard ceiling. Android leads globally at 36.7% of human traffic, ahead of Windows at 32.8% and iOS at 19.4%, with macOS at 8.8%. Since Safari ships only on iOS and macOS, its theoretical maximum is that 28.2% combined Apple share. Right now it converts about 63% of that into actual Safari usage. The rest walks to Chrome.
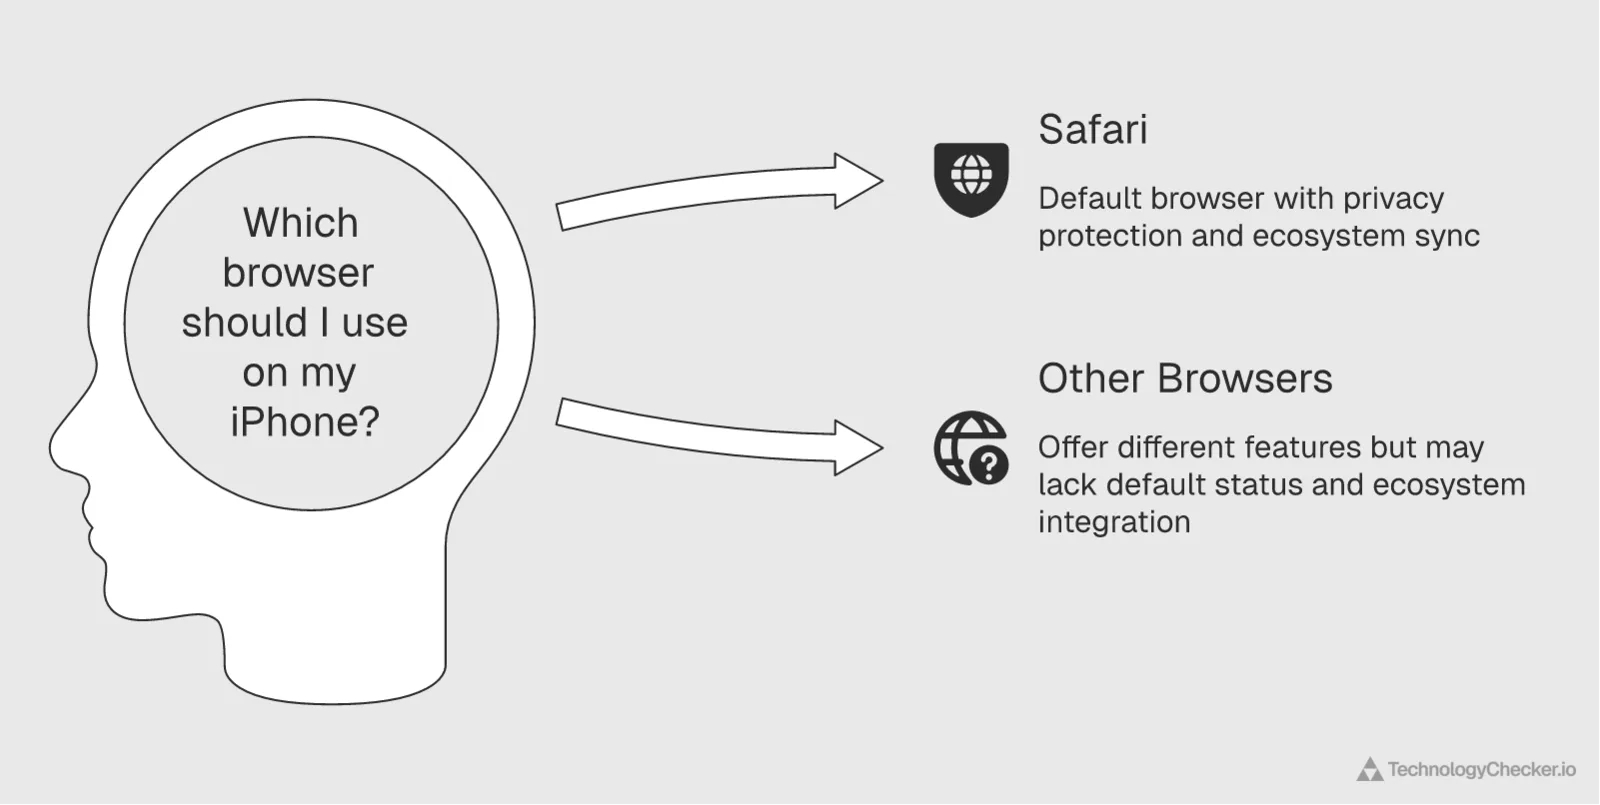
So what keeps Safari's share from falling faster? Three forces, and they're genuinely strong. Default status: most iPhone owners never switch, and defaults are sticky. Privacy: Safari's Intelligent Tracking Prevention and on-by-default posture keep a real segment loyal, especially in regulated industries. Ecosystem gravity: Handoff, iCloud Keychain, and tab sync across Apple devices give people a reason to stay. The decline is slow precisely because those forces hold. Safari isn't collapsing. It's bleeding a fraction of a point a quarter as the marginal Apple user keeps choosing Chrome. My honest prediction: it grinds toward the mid-teens over the next year unless Apple makes leaving Safari harder or its privacy pitch converts more of its own device base.
On iPhones Safari wins; on Macs it loses to Chrome
When I split Apple's own platforms apart, the Apple gap stopped being abstract. The two devices behave like different markets.
| Apple platform | Safari | Chrome |
|---|---|---|
| iPhone & iPad (iOS) | 74.4% | 25.1% |
| Mac (macOS) | 35.5% | 57.9% |
On iOS, Safari does what a default browser should: it takes 74.4% of web traffic, with Chrome a distant 25.1%. But flip to macOS and the result inverts. On Macs, Chrome leads at 57.9% and Safari trails at 35.5%. Apple ships Safari as the default on both, yet it only holds the line on the iPhone. On its own laptop, it's losing to a competitor by 22 points.
Why the split? On a phone, changing your default browser is a deliberate, multi-tap settings chore, and the payoff is smaller because most mobile use is single-app and casual. On a Mac, people already live in Chrome on their work machine, installing it takes ten seconds, and tab-and-password sync makes staying in the Google ecosystem the path of least resistance. The Mac is where Apple's "default advantage" runs out, and it's the clearest preview of where Safari heads if iOS ever loosens up.
The part that surprised me came from pulling the six-month trend inside each platform. The erosion is reaching even Safari's stronghold. On iOS, Safari slipped from 76.2% to 74.6% of web traffic over the past six months while Chrome climbed from 23.4% to 25.0%. On the Mac, Chrome isn't just ahead, its lead is widening, from 57.0% to 57.9% as Safari edged down to 35.7%. Both of Apple's own platforms are drifting the same way, just at different speeds. The one place that bucked it was the US, where Safari nudged up about a point in the last month, a reminder that the slide is a trend, not a straight line.
What I'd do with this if I ran a web or GTM team
Safari's 17.7% means one thing above all: it's a mandatory test target you can't ship around, even though it'll never be your majority browser. And it costs more engineering attention than its share suggests.
Here's why it punches above its weight. Safari runs WebKit, a different rendering engine from the Chromium engine behind Chrome, Edge, Opera, Samsung Internet, and Brave. When you test Chrome, you're effectively testing five browsers at once, because they share an engine. Safari is the only mainstream browser left on a non-Chromium engine, which makes it the one most likely to render your CSS differently, mishandle a date input, or break a layout in a way nothing else does. For most teams, that 17.7% is the entire WebKit web.
The geography point is the GTM angle. If your buyers are UK or US enterprise, Safari is a near-30% browser in your actual market, not the 17.7% global figure. Undersupporting it there means a real chunk of high-value prospects hit a broken experience. Expanding into India or Brazil? Flip the priority. Chrome on Android is where almost everyone is.
The Apple gap even hints at segmentation. The Apple users who stick with Safari skew privacy-conscious, while the ones who moved to Chrome tend to be cross-platform power users. It's a soft signal, not a rule, but worth holding in mind when you read your own analytics. Knowing exactly which browsers and technologies your prospects run is the foundation of good technographic targeting, which is the kind of signal our prospect intelligence platform is built around.
Methodology and source data
This report runs on first-party measurement from Cloudflare Radar, and the reason to trust it starts with sample size. Cloudflare sits in front of roughly a fifth of all websites and operates 1.1.1.1, one of the world's largest public DNS resolvers, so Radar's view of browser share is built from a slice of real global internet traffic measured in the trillions of requests, spanning effectively every country and network. It isn't a panel anyone opted into. It's a cross-section of the live web.
That scale is worth contrasting with how the more familiar browser-share trackers work. Tools like StatCounter measure usage through a JavaScript tag installed on their own network of member websites, then count the visitors who happen to land on those specific sites. It's a legitimate method, but the sample is the traffic of that fixed set of sites, on the order of a million-plus pages, rather than a cross-section of the whole internet, and it can skew toward whatever kinds of sites tend to install that particular script. Different sampling frames are exactly why two reputable sources can report Safari a few points apart while still agreeing on the ranking. I lead with Radar here because its denominator is closer to "the internet" than to "the sites running one company's analytics script."
Source: Cloudflare Radar — radar/http (radar.cloudflare.com), 28-day windows ending 2026-06-09 (headline and trend figures) and 2026-06-10 (the 15-country device and OS tables). Trend figures come from the 52-week weekly series, averaged by month for the chart. All figures are share of HTTP request traffic across Cloudflare's network, traffic-weighted, not installed base or unique users. Headline figures filter to human (LIKELY_HUMAN) traffic except where the all-traffic number is stated explicitly.
Endpoints used: http/summary/browser_family, http/summary/browser (user-agent granularity), http/top/locations/browser_family/safari, http/timeseries_groups/browser_family, http/summary/device_type, and http/summary/os. The breakdown tables come from the same browser_family summary filtered by botClass (human vs bot), deviceType (mobile vs desktop), os (iOS vs macOS), and location (per country). The mobile-only country figures use top/locations/browser_family/safari with a deviceType=MOBILE filter. The 15-country table pulls Safari three ways per market — http/summary/browser_family filtered by location and botClass=LIKELY_HUMAN, once unfiltered for the overall column and once each with deviceType=MOBILE and deviceType=DESKTOP — and pairs each market with its http/summary/os distribution so the operating-system mix explains the browser share.
Because every figure here comes from one source, I used internal consistency as the cross-check instead of a second vendor: the global number, the per-country cuts, the mobile-versus-desktop split, and the iOS-versus-macOS breakdown all reconcile to the same human-traffic share. When independent slices of the same dataset agree, the headline is carrying real weight rather than riding on one query.
A few honest limitations, because they change how you should read this. Radar is traffic-weighted, so a handful of very active users can carry more weight than many light ones. It's a request-share metric, not a head count of people or installed browsers. The concentration rankings (Jersey, Faroe Islands, Kosovo) are Safari's rate within each territory, not those places' share of global Safari traffic. Chromium-based browsers like Brave report as Chrome and aren't broken out. And the small difference between the 28-day snapshot (17.7%) and the weekly series (ending near 17.4%) comes from different sampling and smoothing, not a measurement error. Both agree on direction and rough size.
Frequently asked questions
Which browser has the highest market share?
Chrome has the highest market share by a wide margin. In 2026 it accounts for 68.1% of human web traffic globally (69.8% of all traffic), per Cloudflare Radar for the 28-day window ending 9 June 2026. Safari is second at 17.7%, then Edge at 6.7%. No other browser tops 5%.
What is Safari's market share in 2026?
Safari's market share in 2026 is 15.7% of all global web traffic and 17.7% of human-only web traffic, based on Cloudflare Radar measurement of HTTP requests across its network. That makes Safari the world's second browser, behind Chrome and ahead of Edge. Its share has been slowly declining year over year.
Is Safari market share growing or declining in 2026?
Safari's market share is declining slowly. Its human web traffic share fell from 19.4% to 17.4% over the 12 months to June 2026, with the steepest single drop in September 2025. Chrome absorbed nearly all of that lost share, rising from about 67.6% to 68.7% over the same period.
Did Safari lose market share to Chrome or to Edge in 2026?
Both, roughly evenly. Measured across full calendar quarters, Safari's human traffic share fell from 19.3% in Q2 2025 to 17.9% in Q2 2026, about 1.4 points. Over the same year Chrome rose 0.7 points (67.6% to 68.3%) and Edge rose 0.7 points (5.9% to 6.6%), so Edge gained just as fast as Chrome. The deeper cause is the operating-system mix: iOS fell roughly two points of global human traffic while Windows gained two, which lowers Safari's ceiling and lifts Edge's at the same time. All figures are from Cloudflare Radar.
How does Safari market share differ on desktop versus mobile?
Safari is far stronger on mobile than desktop. It takes 26.1% of mobile human web traffic (second only to Chrome) but just 7.1% on desktop, where it drops to fourth behind Edge and Firefox. The reason is platform: Safari is the iPhone default, but it only exists on Macs on desktop, since Apple no longer ships Safari for Windows. About four in five Safari sessions happen on a phone.
Do iPhone users use Safari or Chrome?
Most iPhone users stay on Safari. On iOS, Safari takes 74.4% of web traffic against Chrome's 25.1%, per Cloudflare Radar in June 2026. But the loyalty is device-specific: on macOS, Chrome actually leads at 57.9% versus Safari's 35.5%. Apple holds the iPhone by default but loses its own Mac to Chrome.
Why is Safari's market share lower than Apple's device share?
Apple operating systems generate 28.2% of human web traffic (iOS 19.4% plus macOS 8.8%), but Safari captures only 17.7%, a gap of more than 10 points. That gap is Apple-device owners choosing Chrome over Safari, even on devices where Safari is the default, pulled by Chrome's cross-platform sync and habit.
How does Firefox market share compare to Safari in 2026?
Firefox trails Safari heavily. In 2026 Firefox holds 4.1% of human web traffic against Safari's 17.7%, so Safari is more than four times larger. Firefox also sits behind Edge at 6.7%, making it the fourth browser globally. Its share has continued a long, gradual decline.
Which country has the highest Safari market share?
Among major markets, the United Kingdom has the highest Safari share at 30.3% of human web traffic, just ahead of the United States at 28.8%, then Japan and Australia at 26.0%. Safari tracks iPhone ownership closely, so it peaks in wealthy markets and bottoms out in Android-heavy ones like India at 4.3%.
Which country has the highest mobile Safari market share?
The United States has the highest mobile Safari share among major markets at 51.8% of human phone traffic, an outright majority, per Cloudflare Radar in June 2026. The UK (45.4%), Australia (47.7%), Canada (44.6%), and Japan (40.4%) all clear 40% on mobile too. Safari's mobile share tracks iPhone ownership, so it peaks in wealthy markets and drops to 4.9% in Android-heavy India. On desktop the picture inverts everywhere: Safari never tops 13.1% (the UK) because Windows dominates desktops even where iPhones dominate phones.
Why is Safari's market share low in wealthy countries like South Korea?
South Korea is rich but gives Safari just 11.7% because it's Samsung's home market. iOS accounts for only 16.0% of South Korean web traffic against 34.8% Android, so most premium phones there are Galaxy devices running Chrome or Samsung Internet, not iPhones running Safari. It's the clearest proof that Safari share tracks iPhone ownership, not wealth: a high-income market with few iPhones gives Safari a small share, while iPhone-heavy markets like the UK and US push it near 30%.
Why should B2B SaaS teams track Safari market share?
Safari runs WebKit, the only mainstream engine that isn't Chromium-based, so it's the browser most likely to break your CSS or layout in ways Chrome never reveals. At 17.7% of human traffic globally, and near 30% in UK and US markets, it's a mandatory test target. Skipping Safari testing risks a broken experience for one in six visitors.
How many people use Safari?
Cloudflare Radar measures traffic rather than headcount, so the honest answer is a share, not a user count: Safari accounts for 17.7% of human web traffic worldwide in 2026, roughly one in six of the people loading a typical site. It's a request-share figure across Cloudflare's network, not a count of installed browsers or unique users, so read it as how much real human browsing runs on Safari, not a literal number of people. At that scale Safari is still the world's second-most-used browser, behind Chrome and ahead of Edge.
Why is Chrome the most popular browser instead of Safari?
Chrome leads at 68.1% of human web traffic because it runs everywhere and ships as a default where it counts. It's the built-in browser on most Android phones, installs in seconds on Windows (where Safari isn't even available), and syncs tabs, passwords, and history across every device someone owns. Safari only exists on Apple's iOS and macOS, which caps its ceiling at Apple's ~28% device footprint. That cross-platform reach is exactly the pull that moves Apple users off Safari and onto Chrome, even on iPhones and Macs.
What percentage of desktop users use Safari?
Safari takes just 7.1% of desktop human web traffic in 2026, which puts it fourth on the desktop behind Chrome (66.8%), Edge (15.1%), and Firefox (8.5%). The reason is platform: most desktops run Windows, where Apple stopped shipping Safari years ago, so Safari survives only on Macs, and even there it loses to Chrome. That desktop weakness is why Safari's overall 17.7% share sits far below its 26.1% mobile share.
How is browser market share measured, and why do sources disagree?
The figures here come from Cloudflare Radar, which measures the share of HTTP request traffic across Cloudflare's global network rather than surveying users or counting installs. Because Cloudflare sits in front of roughly a fifth of all websites and runs the 1.1.1.1 DNS resolver, that sample spans trillions of requests across nearly every country and network, not a fixed panel of sites. It's a traffic-weighted, request-share metric: it reflects real page loads, so a very active user carries more weight than a light one, and it isn't a head count of people. We filter to human (non-bot) traffic for the headline numbers, because automated traffic overwhelmingly identifies as Chrome and would otherwise understate Safari. Other trackers like StatCounter work differently, counting page views from a JavaScript tag on their own network of member sites, a much smaller and self-selected sample, which is why exact percentages differ between sources even though the ranking, Chrome first, Safari second, stays the same.

Data Analyst
5+ years of experience
Emma is a Data Analyst at TechnologyChecker, where she analyses technology adoption data to build better prospect lists and uncover actionable patterns for sales teams.
- BSc Data Science, Cardiff University
- Google Data Analytics Professional Certificate
- Tableau Desktop Certified Associate
Never miss our research

