Bot Traffic Statistics 2026: How Much of the Web Is Bots?
Live Cloudflare Radar data (June 2026): bots are 35% of web traffic and Anthropic now runs more bots than OpenAI or Meta. Verified 2026 bot statistics.
Published •25 min read

One AI company now out-crawls every rival relative to what it gives back: Anthropic reads roughly 4,580 pages for every visitor it refers. Overall, bots make up 35.2% of all web traffic as of June 2026, with humans still the majority at 64.8%, according to Cloudflare Radar. Other estimates exceed 50%, explained below.

Last updated June 2026.
These figures come from data we pulled from Cloudflare Radar on June 22, 2026, and re-pull on publish. As a team that runs crawlers across more than 50 million domains every month, we read other operators' crawl behavior directly in this data. The pattern that jumps out isn't the headline percentage. It's who is doing the crawling, and how little they return.
Bot Traffic in 2026: Key Findings
Here are the headline numbers from our June 2026 Cloudflare Radar pull. Each one is attributed to a specific endpoint below, so you can lift any single stat and keep its source.
- Bots are 35.2% of all web traffic; humans are 64.8%. By Cloudflare's measure, humans are still the majority. Source: Cloudflare Radar — radar/http/summary/bot_class (radar.cloudflare.com), 7d (2026-06-15 to 2026-06-22).
- Anthropic is the #2 bot operator at 13.2% of verified bot traffic, ahead of Meta (12.2%) and nearly double OpenAI (7.2%). Only Google (28.4%) runs more.
- Claude-User is the web's #2 busiest individual bot at 11.3%, behind GoogleBot (14.2%) and nearly double GPTBot (5.8%).
- Anthropic crawls ~4,580 pages per referral it sends back, vs OpenAI's 848, Perplexity's 186, and Google's 5. This is a ratio, not a percentage.
- AI-related bots are 33.8% of all bot traffic. Crawlers, assistants, and AI search combined now rival traditional search-engine crawlers (26.8%).
- More than 1 in 3 crawler requests (36.9%) gets a 4xx error. Only 46.8% get a successful 2xx response.
- 52.3% of AI crawling is for model training, not live search indexing (10.1%).
- Bot share swings from 76.6% in Singapore to 11.8% in Mexico. The most-automated countries are data-center hubs (Singapore, Ireland, the Netherlands); the most-human are mobile-first consumer markets. The US sits at 49.4%.
- Humans browse on phones; bots run on servers. Human web traffic is 55% mobile, but bot traffic is 84% desktop, and bots claim Chrome (78.6%) even more often than humans do (68.3%).
How Much of the Web Is Bots in 2026?
Bots account for 35.2% of all web traffic as of June 2026 (roughly one in three requests), while humans account for 64.8%. That's the verified-and-likely-automated share Cloudflare sees across its global network. Source: Cloudflare Radar — radar/http/summary/bot_class (radar.cloudflare.com), 7d (2026-06-15 to 2026-06-22).
So why do you keep reading that bots have "overtaken humans"? Because different measurements ask different questions. Bot traffic share is the percentage of web requests that come from automated clients rather than people. But what counts as "automated," and which slice of the internet you measure, changes the answer a lot. Cloudflare measures requests across a large neutral network and separates verified bots and likely-automated traffic from human sessions. Security vendors like Imperva (owned by Thales) and HUMAN Security report higher figures because they weight toward the application-layer attack surface they defend (login endpoints, checkout flows, APIs) where automated abuse concentrates, and they fold more "likely-automated" requests into a broader bucket. Same internet, different lens.
Here's the reconciliation no single-source news post offers. Every major 2026 estimate sits side by side below, with how each one is measured.
| Source | Reported bot / automated share | How it's measured | Date |
|---|---|---|---|
| Cloudflare Radar | 35.2% | Verified + likely-automated requests across a global CDN network (general web traffic) | June 2026 |
| Imperva / Thales Bad Bot Report | Roughly half (more than 50% by their measure) | "Automated traffic" across application-layer traffic the firm defends; broader bot definition weighted to attack surface | 2026 annual |
| HUMAN Security | More than half of traffic by some measures | Enterprise fraud/bot-defense telemetry; emphasis on sophisticated and malicious automation | 2026 |
Treat the precise figure (35.2%) as the network-wide measurement and the "around half" figures as attack-surface-weighted estimates. According to the Imperva (Thales) Bad Bot Report, automated traffic sits near half of all traffic by their definition. That's directionally consistent with Cloudflare's growth trend, just measured against a different denominator. Both can be true at once.
For the human side of this split, see the country, device, and browser breakdowns later in this report, plus our web traffic statistics post on the 64.8% that isn't a bot.
The Extraction Gap: Which AI Companies Take the Most and Give Back the Least
The extraction gap is the ratio of pages an AI crawler reads to visitors it refers back to the open web, and Anthropic's is the widest of any major operator. Anthropic crawls roughly 4,580 pages for every 1 referral it sends back, versus OpenAI's 848, Perplexity's 186, and Google's 5. Source: Cloudflare Radar — radar/bots/crawlers/summary/crawl_refer_ratio (radar.cloudflare.com), 28d (2026-05-25 to 2026-06-22).
Read this table as "pages crawled per 1 referral," not as a percentage. It's a ratio, so a bigger number means a more one-sided exchange, not a larger share of traffic.
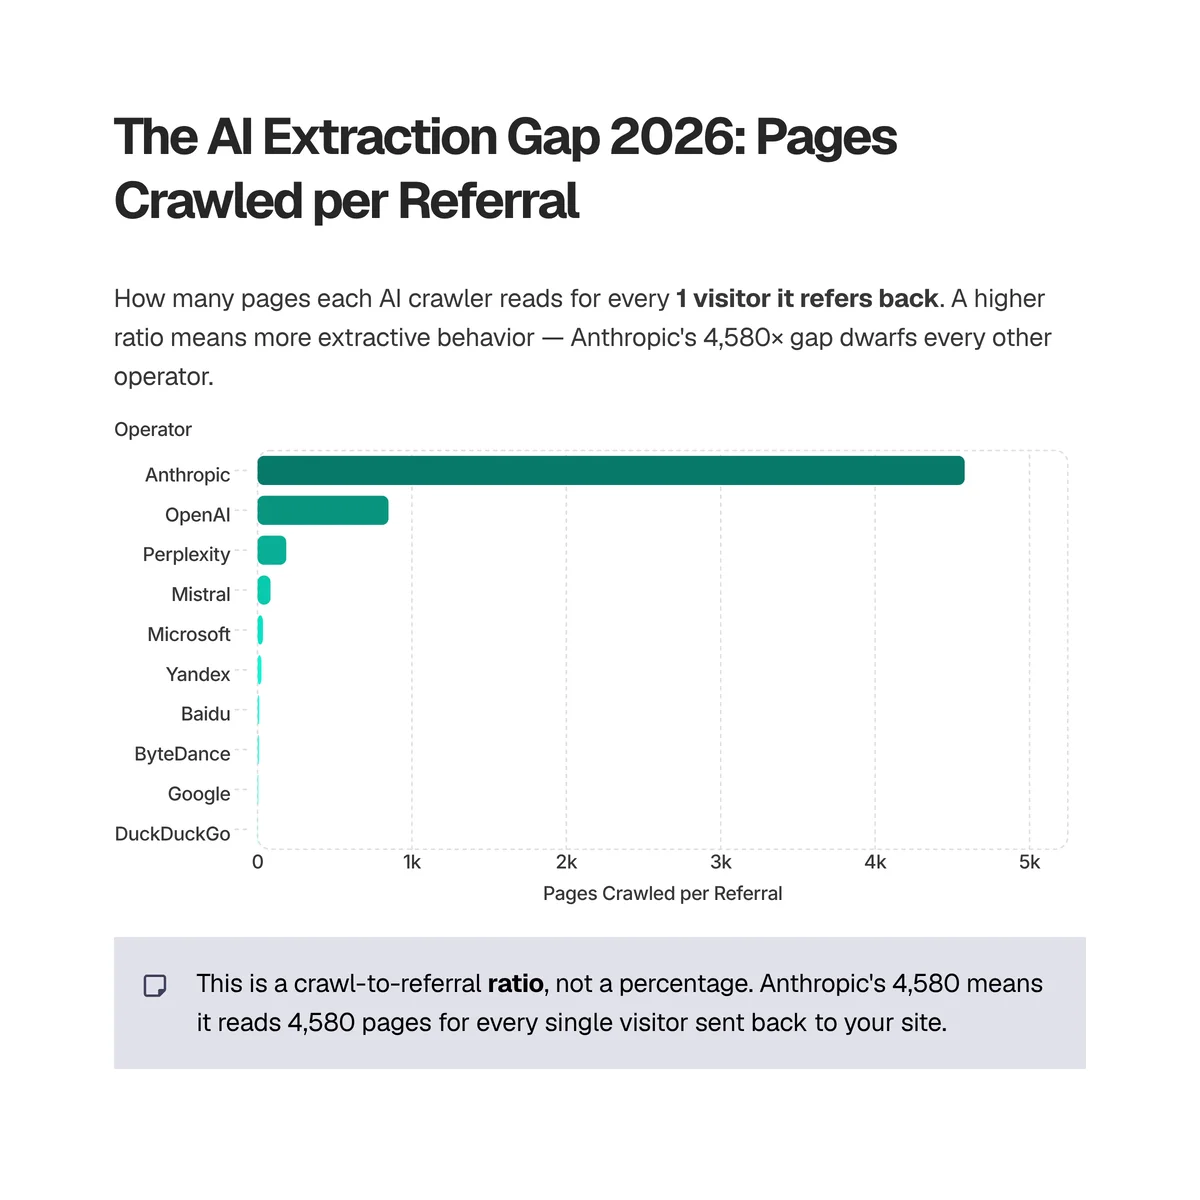
| AI operator | Pages crawled per 1 referral | Reading |
|---|---|---|
| Anthropic | 4,580 | Reads ~4,580 pages for each visitor sent back |
| OpenAI | 848 | Reads ~848 pages per referral |
| Perplexity | 186 | Reads ~186 pages per referral |
| Mistral | 84 | Reads ~84 pages per referral |
| Microsoft | 35 | Reads ~35 pages per referral |
| Yandex | 25 | Reads ~25 pages per referral |
| Baidu | 11 | Reads ~11 pages per referral |
| ByteDance | 10 | Reads ~10 pages per referral |
| 5 | Reads ~5 pages per referral | |
| DuckDuckGo | 2 | Reads ~2 pages per referral |
Google sits at 5:1 because its crawl still feeds a search engine that sends clicks back to publishers. The ratio is roughly the old bargain of the open web: you let the crawler in, it sends you traffic. AI assistants break that bargain. They read your page to answer a question inside a chat window, and the user rarely clicks through. Anthropic's 4,580:1 is that broken bargain at its most extreme, nearly a thousand times more lopsided than Google's.
This isn't a moral verdict. It's the mechanics of how answer engines work, and it's the same shift driving our Claude usage statistics and ChatGPT statistics. If your content fuels AI answers without earning a click, the referral ratio is where you see it first.
Who Operates the Internet's Bots?
Google operates the largest share of verified bot traffic at 28.4%, and Anthropic is now second at 13.2%, ahead of Meta and nearly double OpenAI. The operator league below counts each company's share of verified-bot requests. Source: Cloudflare Radar — radar/bots/summary/bot_operator (radar.cloudflare.com), 7d (2026-06-15 to 2026-06-22).
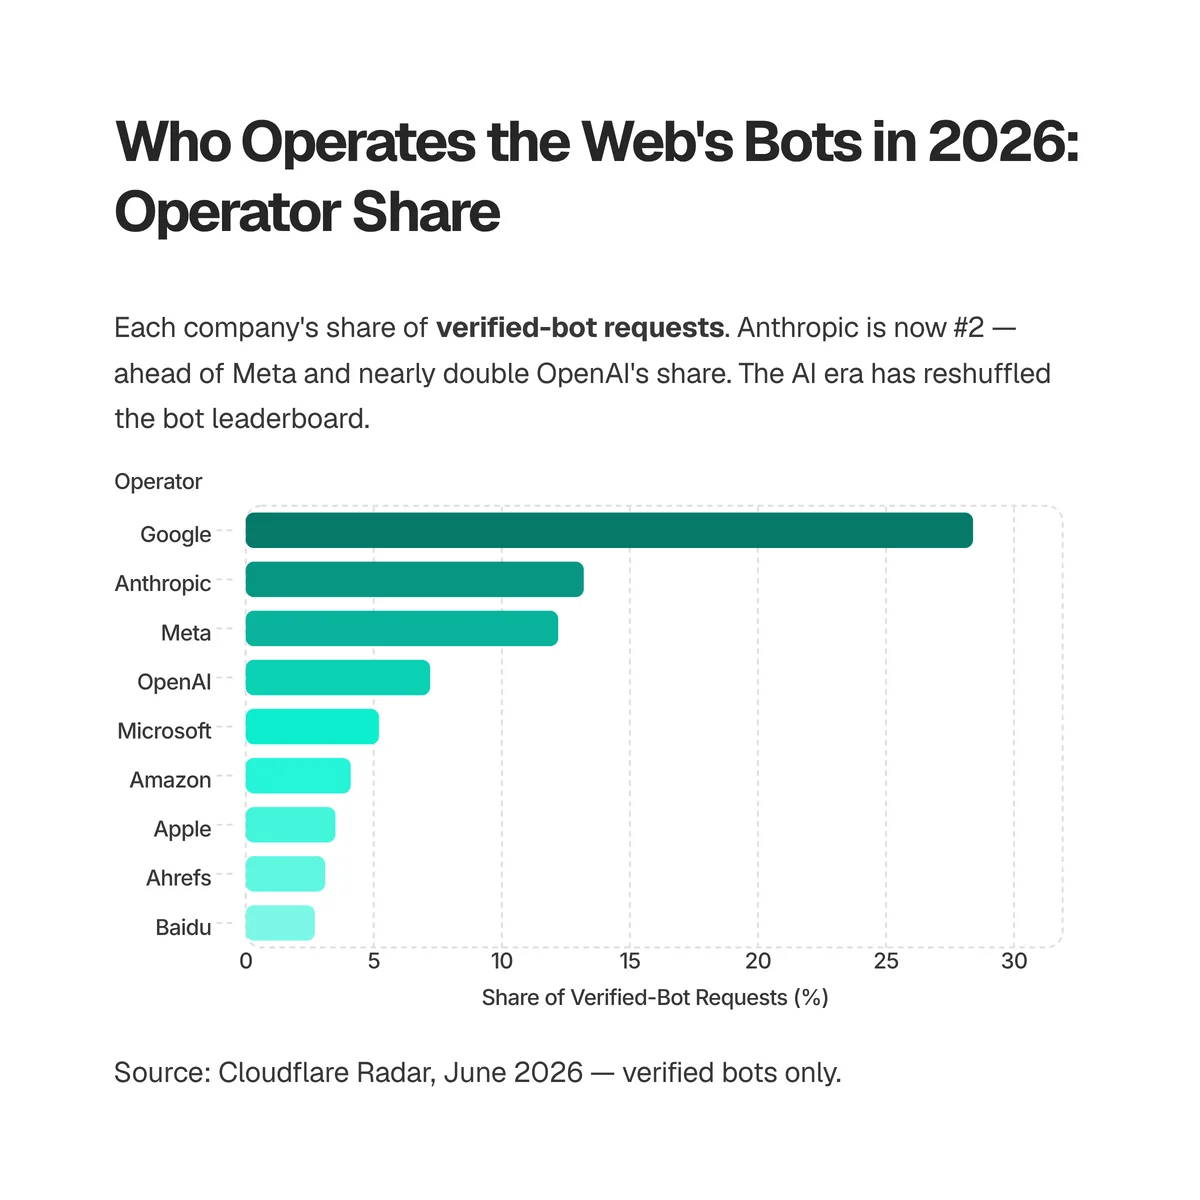
| Rank | Operator | Share of verified-bot requests |
|---|---|---|
| 1 | 28.4% | |
| 2 | Anthropic | 13.2% |
| 3 | Meta | 12.2% |
| 4 | OpenAI | 7.2% |
| 5 | Microsoft | 5.2% |
| 6 | Amazon | 4.1% |
| 7 | Apple | 3.5% |
| 8 | Ahrefs | 3.1% |
| 9 | Baidu | 2.7% |
| — | Others | 20.4% |
A year ago, the runner-up to Google in any bot-operator chart would have been Microsoft (Bing) or Amazon. Now it's Anthropic, a company with no search engine and no ad network, whose bots exist almost entirely to read pages for an AI assistant. That single fact reshapes how site owners should think about their server logs. The second-heaviest crawler hitting your site probably isn't indexing you for search; it's reading you for a chatbot.
We track which companies sit behind the technology and crawlers on millions of sites. See how we detect technologies and crawlers for the methods behind reads like this.
The Busiest Bots on the Web Right Now
GoogleBot is still the single busiest bot at 14.2% of verified-bot requests, but Claude-User is now #2 at 11.3%, nearly double GPTBot (5.8%). An AI assistant agent now out-crawls every search engine except Google. Source: Cloudflare Radar — radar/bots/summary/bot (radar.cloudflare.com), 7d (2026-06-15 to 2026-06-22).
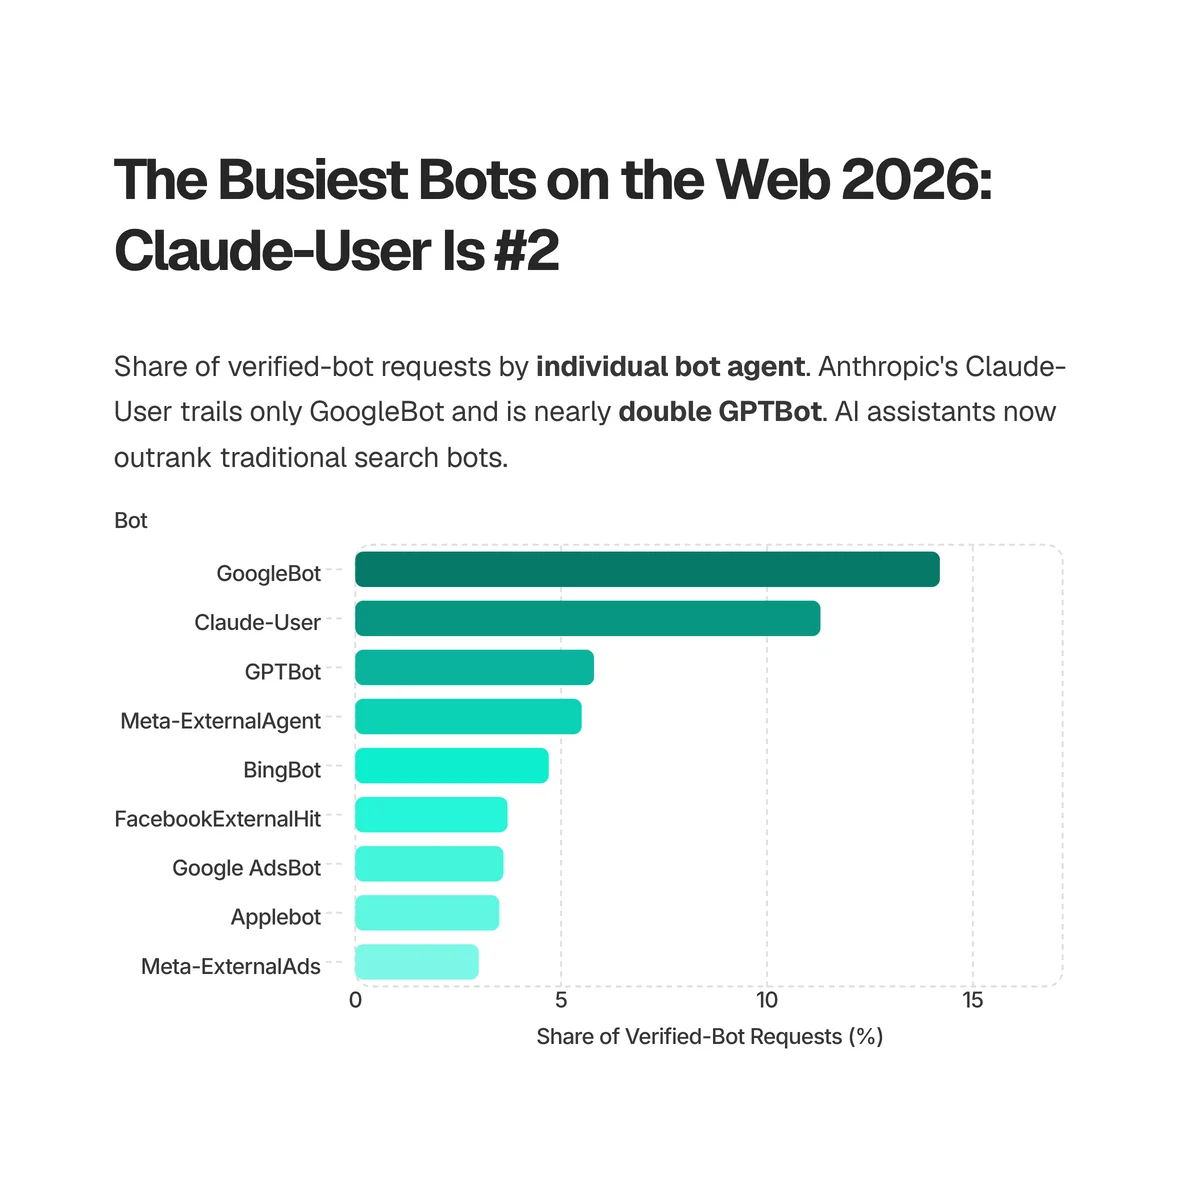
| Rank | Bot | Operator | Share of verified-bot requests |
|---|---|---|---|
| 1 | GoogleBot | 14.2% | |
| 2 | Claude-User | Anthropic | 11.3% |
| 3 | GPTBot | OpenAI | 5.8% |
| 4 | Meta-ExternalAgent | Meta | 5.5% |
| 5 | BingBot | Microsoft | 4.7% |
| 6 | FacebookExternalHit | Meta | 3.7% |
| 7 | Google AdsBot | 3.6% | |
| 8 | Applebot | Apple | 3.5% |
| 9 | Meta-ExternalAds | Meta | 3.0% |
The name to sit with is Claude-User. The "-User" suffix means these are user-initiated fetches: a person asks Claude a question, and Claude goes and reads live pages to answer. That's different from a training crawler quietly building a dataset. It means Claude's reach into the live web is being pulled by real demand, in real time, at a volume that now trails only GoogleBot. GPTBot, OpenAI's heavier crawler, sits at less than half Claude-User's share. The agentic web isn't a forecast anymore; it's the #2 entry in this table.
What AI Crawlers Actually Want: Training vs Search
More than half of AI crawler activity (52.3%) is for model training, while only 10.1% is for live search indexing. The rest is mixed-purpose (34.2%) or unspecified. Source: Cloudflare Radar — radar/ai/bots/summary/crawl_purpose (radar.cloudflare.com), 28d (2026-05-25 to 2026-06-22).

Most AI crawling feeds model training (52.3%), not live search (10.1%).
| Crawl purpose | Share of AI crawler activity |
|---|---|
| Training | 52.3% |
| Mixed purpose | 34.2% |
| Search | 10.1% |
| User action | 2.6% |
| Undeclared | 0.8% |
This breakdown matters for one practical reason: the page an AI reads today to train on shapes the answer it gives a user tomorrow. When training is 52.3% of AI crawling and live search is only 10.1%, most of what assistants "know" about your brand is being baked in during training runs, not fetched fresh at query time. If your content isn't in the training pass, you may simply be absent from the answer, with no live-search step to recover the omission. The same dynamic shows up in our open-source AI adoption data, where models trained on public code and docs inherit whatever was crawlable.
AI Bots Are Now a Third of All Bot Traffic
AI-related bots make up 33.8% of all bot traffic, combining AI crawlers (17.7%), AI assistants (9.0%), and AI search (7.0%), rivaling traditional search-engine crawlers at 26.8%. Source: Cloudflare Radar — radar/bots/summary/bot_category (radar.cloudflare.com), 28d (2026-05-25 to 2026-06-22).
| Bot category | Share of bot traffic |
|---|---|
| Search-engine crawler | 26.8% |
| AI crawler | 17.7% |
| SEO | 12.5% |
| AI assistant | 9.0% |
| Advertising & marketing | 7.5% |
| Page preview | 7.1% |
| AI search | 7.0% |
| Webhooks | 4.6% |
| Monitoring & analytics | 3.2% |
| Other | 4.4% |
Add the three AI rows and you get 33.8%. A third of every automated request hitting the web is now AI-driven. Stack that against the single largest traditional category, search-engine crawlers at 26.8%, and the direction is clear: AI has already passed classic search crawling as a category of bot traffic. For most of the web's history, "a bot is crawling my site" meant a search engine wanted to rank you. In 2026, it's more likely an AI system wants to read you. That reframes AI adoption trends from a product story into an infrastructure one: the adoption is visible in raw crawl volume.
Bot Traffic by Country: Where the Web Is Most Automated
Bot share is wildly uneven by country, from more than 76% of requests in Singapore to under 12% in Mexico. The countries with the highest bot share are the ones that host the internet's data centers, not the places where the most "attacks" originate. Source: Cloudflare Radar — radar/http/summary/bot_class with a per-country location filter (radar.cloudflare.com), 7d (2026-06-15 to 2026-06-22).
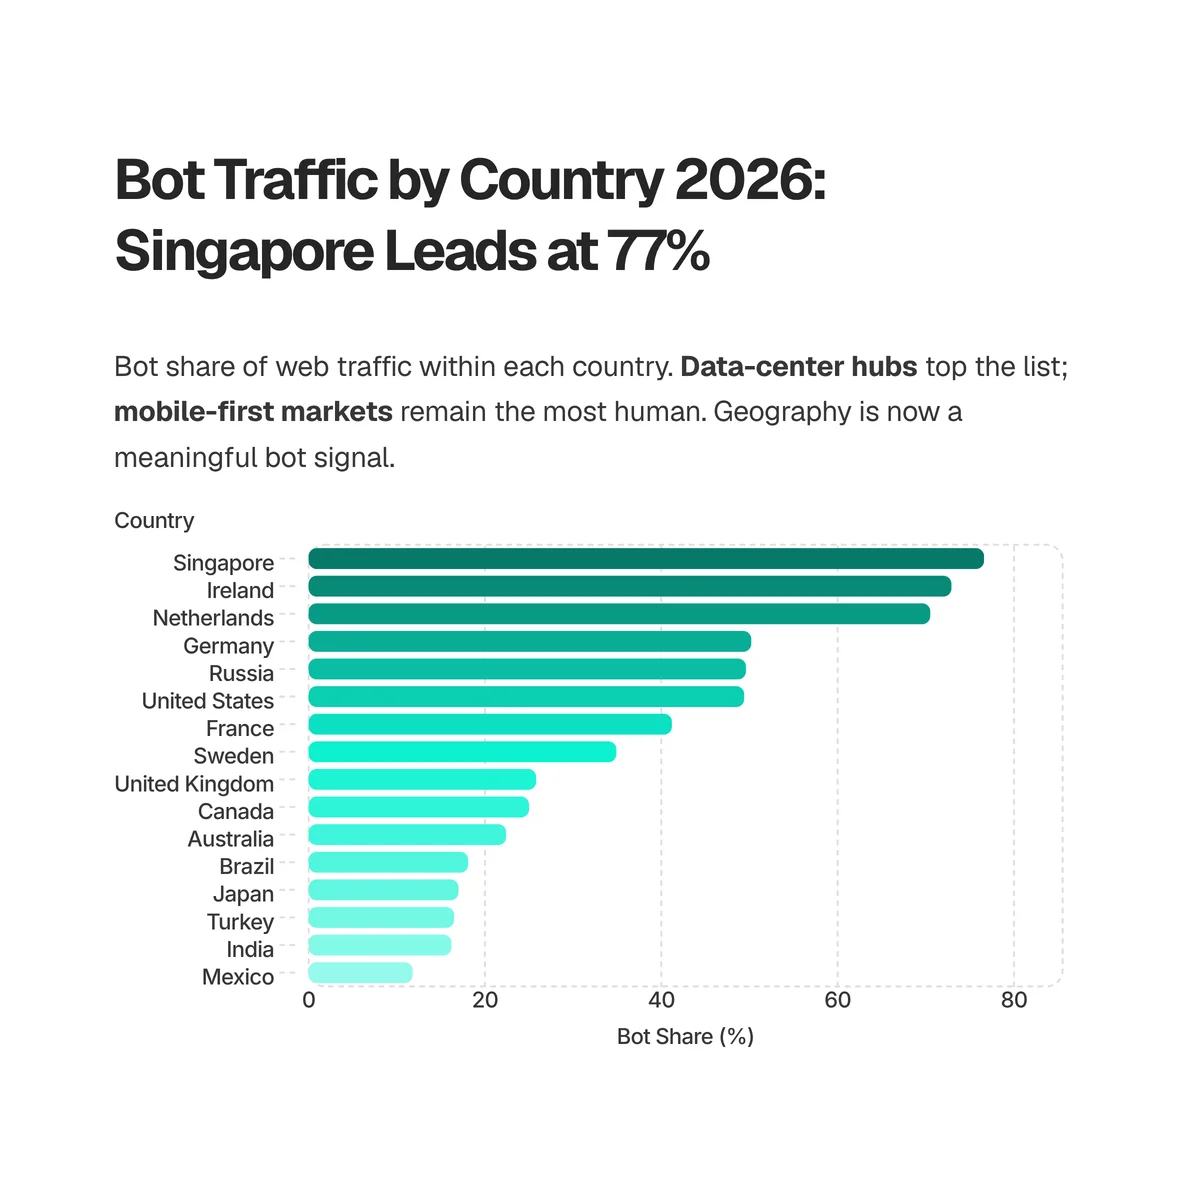
| Country | Bot share | Human share |
|---|---|---|
| Singapore | 76.6% | 23.4% |
| Ireland | 72.9% | 27.1% |
| Netherlands | 70.5% | 29.5% |
| Germany | 50.2% | 49.8% |
| Russia | 49.6% | 50.4% |
| United States | 49.4% | 50.6% |
| France | 41.2% | 58.8% |
| Sweden | 34.9% | 65.1% |
| United Kingdom | 25.8% | 74.2% |
| Canada | 25.0% | 75.0% |
| Australia | 22.4% | 77.6% |
| Brazil | 18.1% | 81.9% |
| Japan | 17.0% | 83.0% |
| Turkey | 16.5% | 83.5% |
| India | 16.2% | 83.8% |
| Mexico | 11.8% | 88.2% |
The top of this list is a map of cloud infrastructure. Singapore, Ireland, and the Netherlands are majority-bot because they host hyperscale data-center regions for AWS, Google Cloud, and Azure, and bots run inside those data centers, so their traffic originates there. That's why "which country has the most bot traffic" is really asking "which country hosts the most servers," not "which country is under attack." It also explains the headline gap from earlier: the United States reads at 49.4% bot and Germany at 50.2%, right around the "half the internet is bots" figure security vendors report, because both are huge economies that also host enormous data-center capacity. Measure a server-dense country and you get roughly half; measure the whole neutral network and you get 35.2%. At the other end, mobile-first consumer markets like Mexico (11.8%), India (16.2%), and Turkey (16.5%) are the most human, because they generate huge volumes of real phone browsing and host comparatively few data centers. One caveat: a few mid-table countries (Russia here, and Nigeria at 53%) rank high less because of hosting and more because of proxy and VPN exit nodes plus lower human request volume, so read single countries with care.
Bots vs Humans by Device and Browser
Humans and bots look completely different at the device level: human web traffic is 55% mobile, but bot traffic is 84% desktop. People browse on phones; bots run on servers. Source: Cloudflare Radar — radar/http/summary/device_type, split by likely-human and likely-automated (radar.cloudflare.com), 7d (2026-06-15 to 2026-06-22).
| Device | Human traffic | Bot traffic |
|---|---|---|
| Mobile | 55.0% | 15.0% |
| Desktop | 45.0% | 84.4% |
That single contrast is one of the more dependable ways to tell automated traffic from people. A user-agent string is trivial to fake, but the overall shape of traffic is not: humans skew mobile because that's where real browsing happens, while bots skew desktop because they run on servers and headless browsers that present as desktop clients. The operating-system mix underneath confirms it: among human traffic, Android leads at 36.0%, ahead of Windows (32.9%), iOS (20.1%), and macOS (8.8%), so mobile operating systems (Android plus iOS) now carry roughly 56% of human browsing.
Browser share tells a subtler story. Among humans, Chrome leads at 68.3%, followed by Safari (18.2%), Edge (6.5%), and Firefox (3.7%). Bots claim a similar lineup, but they over-index on Chrome and barely touch Safari.
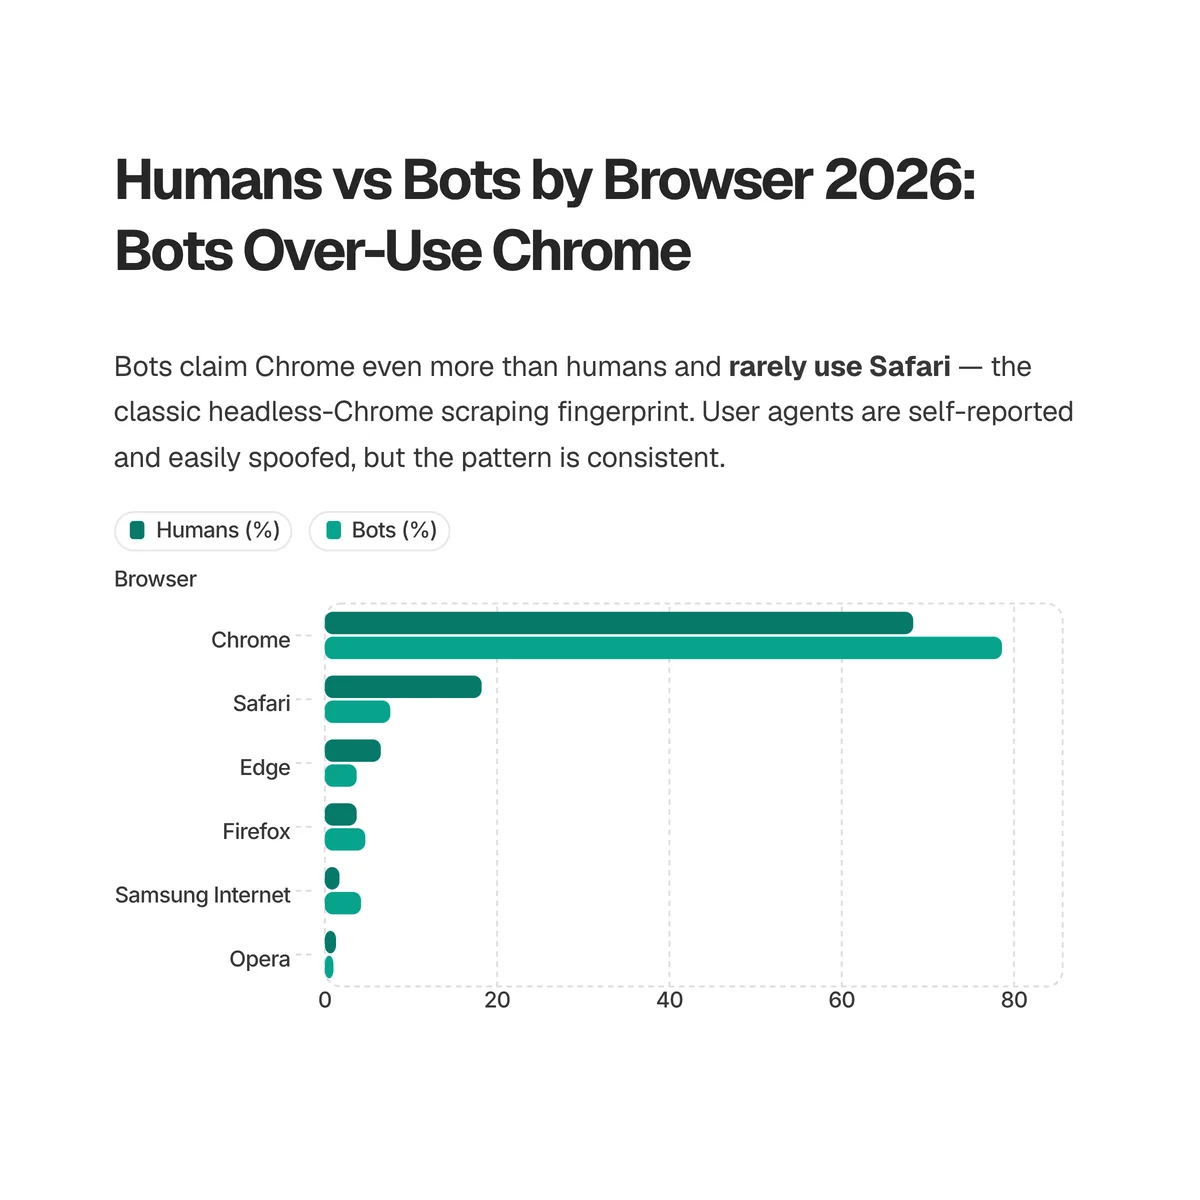
| Browser | Human traffic | Bot traffic |
|---|---|---|
| Chrome | 68.3% | 78.6% |
| Safari | 18.2% | 7.6% |
| Edge | 6.5% | 3.7% |
| Firefox | 3.7% | 4.7% |
| Samsung Internet | 1.7% | 4.2% |
| Opera | 1.3% | 1.0% |
Bots report Chrome even more often than humans (78.6% vs 68.3%) because headless Chrome, driven by automation frameworks like Puppeteer and Playwright, is the default tool for scraping and AI fetching. Safari, by contrast, is far rarer among bots (7.6% vs 18.2%): almost nobody automates WebKit at scale. The practical read for site owners is that a desktop client claiming the latest Chrome, with no matching mobile traffic, is a classic headless-scraper fingerprint. Just remember these browser labels come from user-agent strings, which bots can set to anything, so treat the bot-side browser numbers as claimed identity rather than verified fact. For the human side, our Chrome market share and Safari market share reports track those browsers over time.
More Than 1 in 3 Crawler Requests Gets Blocked
About 37% of crawler requests now receive a 4xx error (more than one in three), while only 46.8% get a successful 2xx response. Source: Cloudflare Radar — radar/bots/crawlers/summary/response_status_category (radar.cloudflare.com), 7d (2026-06-15 to 2026-06-22).

More than 1 in 3 crawler requests (about 37%) now gets a 4xx block.
| Response status | Share of crawler requests | Meaning |
|---|---|---|
| 2xx (success) | 46.8% | Request served |
| 4xx (client error / blocked) | 36.9% | Rejected, forbidden, or not found |
| 3xx (redirect) | 14.0% | Redirected |
| 5xx (server error) | 2.3% | Server failure |
A 4xx response on more than a third of crawler requests is the web pushing back. Sites are returning 403s and 429s to crawlers they don't want, and a lot of that pushback now targets AI crawlers specifically, through robots.txt rules, firewall rules, and CDN toggles. We dug into exactly who's blocking which AI bots in our robots.txt AI crawler blocking report, and the short version is that blocking has gone mainstream among large publishers. The tension is real: block too aggressively and you vanish from AI answers; allow everything and you hand over your content for a referral ratio of 4,580:1.
Good Bots vs Bad Bots: Not All Automated Traffic Is Equal
Not all automated traffic is equal: "good bots" identify themselves and obey rules, while "bad bots" spoof user agents, ignore robots.txt, and drive scraping, credential stuffing, and fraud. The 35.2% bot share isn't one undifferentiated swarm. It's search crawlers and AI assistants on one end, and impersonators on the other.
The cleanest signal here is verification. A verified bot proves its identity (Cloudflare and others confirm it via published IP ranges or signed requests), so GoogleBot, Claude-User, and BingBot in the tables above are bots you can trust to be what they claim. An unverified or spoofed bot sets a user-agent string it has no right to, pretending to be GoogleBot to slip past filters, and these are where most scraping and attack traffic hides. That's exactly why security vendors report higher bot percentages: they're counting the malicious, often-spoofed layer that a verified-bot view filters out.
So should you block bots? It depends on which ones. Blocking verified search and AI-search crawlers costs you visibility in both Google and AI answers. Blocking spoofed and abusive automation protects your infrastructure and data. The honest position is that "block bots" is the wrong instruction. "Block the right bots, by verified identity" is the right one. Getting that distinction wrong is how sites accidentally delist themselves while leaving the actual scrapers untouched.
Frequently Asked Questions
What is bot traffic?
Bot traffic is any web traffic generated by automated software (bots) rather than a person using a browser. It spans search-engine crawlers, AI crawlers, monitoring tools, link previewers, and scrapers. As of June 2026, bots account for 35.2% of all web traffic and humans for the other 64.8%, according to Cloudflare Radar. Bot traffic can be legitimate (verified crawlers that identify themselves) or malicious (spoofed scrapers, credential-stuffing, and attack bots).
What percentage of internet traffic is bots in 2026?
Bots account for 35.2% of all web traffic as of June 2026, with humans making up the remaining 64.8%, according to Cloudflare Radar's 7-day measurement across its global network. Other reports put automated traffic above 50%, but those estimates use broader definitions weighted toward application-layer attack surface. The 35.2% figure reflects verified and likely-automated requests across general web traffic.
Do bots outnumber humans on the internet?
By Cloudflare Radar's network-wide measurement, no: humans are still the majority at 64.8% of web traffic versus 35.2% for bots in June 2026. Security vendors such as Imperva (Thales) and HUMAN Security report automated traffic at or above 50%, because they measure the attack surface they defend with a broader "automated traffic" definition. Whether bots "outnumber humans" depends entirely on what you measure.
Which company operates the most bots?
Google operates the largest share of verified bot traffic at 28.4%, followed by Anthropic at 13.2%, Meta at 12.2%, and OpenAI at 7.2%, per Cloudflare Radar (June 2026). Anthropic is now the #2 bot operator on the web despite having no search engine or ad network. Its bots exist primarily to read pages for the Claude AI assistant.
What is the most active bot on the web?
GoogleBot is the single busiest bot at 14.2% of verified-bot requests, followed by Anthropic's Claude-User at 11.3%, nearly double OpenAI's GPTBot at 5.8% (Cloudflare Radar, June 2026). Claude-User performs user-initiated fetches, meaning it reads live pages in response to real Claude queries, which now puts it second only to GoogleBot in raw activity.
How much of bot traffic is AI?
AI-related bots make up 33.8% of all bot traffic as of June 2026, combining AI crawlers (17.7%), AI assistants (9.0%), and AI search (7.0%), per Cloudflare Radar's 28-day data. That total now exceeds traditional search-engine crawlers (26.8%), making AI the largest category of automated traffic on the web.
What do AI crawlers do with the data they collect?
Most AI crawling, 52.3%, collects data for model training, while only 10.1% is for live search indexing, with 34.2% mixed-purpose (Cloudflare Radar, June 2026). In practice, the pages an AI crawler reads during training shape the answers an assistant gives later. Content absent from the training pass risks being missing from AI answers entirely.
Why do estimates of bot traffic range from 35% to 50%?
The range comes from different measurement methods, not contradictory facts. Cloudflare Radar measures verified and likely-automated requests across a neutral global network, reporting 35.2% in June 2026. Security vendors like Imperva (Thales) and HUMAN Security report roughly half or more, because they weight toward login pages, checkout flows, and APIs where automated abuse concentrates, using a broader automated-traffic definition.
Are good bots or bad bots more common?
The most active individual bots on the web are verified "good bots": GoogleBot, Claude-User, and BingBot lead the rankings (Cloudflare Radar, June 2026). But security vendors report large volumes of "bad bots" that spoof user agents and ignore robots.txt, which a verified-bot view filters out. The answer depends on whether you measure verified identity or total automated activity including impersonators.
How much of AI crawling is for training versus search?
AI crawling is 52.3% training and 10.1% live search, with 34.2% mixed-purpose and the remainder user-action or undeclared (Cloudflare Radar, 28-day, June 2026). Training dominates by a roughly 5-to-1 margin over search. That means most of what AI assistants "know" is set during training rather than fetched fresh when a user asks a question.
How often are AI crawlers blocked?
About 36.9% of crawler requests receive a 4xx error, more than one in three, while 46.8% get a successful 2xx response (Cloudflare Radar, 7-day, June 2026). Much of this pushback now targets AI crawlers through robots.txt rules and CDN settings. Blocking has gone mainstream among large publishers, though over-blocking can remove a site from AI answers along with the unwanted scrapers.
Which country has the most bot traffic?
Singapore has the highest bot share of any major country at 76.6% of web traffic, followed by Ireland (72.9%) and the Netherlands (70.5%), because all three host large cloud data-center regions where automated traffic concentrates (Cloudflare Radar, June 2026). The United States (49.4%) and Germany (50.2%) sit near 50/50, while mobile-first markets like Mexico (11.8%), India (16.2%), and Turkey (16.5%) are the most human.
Do bots use mobile or desktop?
Bots are overwhelmingly desktop: 84% of bot traffic is desktop-class versus just 15% mobile, because automated clients run on servers rather than phones (Cloudflare Radar, June 2026). Human traffic is the reverse, at 55% mobile and 45% desktop. Because device type is harder to fake than a user-agent string, the mobile-versus-desktop split is one of the more reliable ways to distinguish bots from people.
What web browser do most people use?
Among human web traffic, Chrome is the most-used browser at 68.3%, followed by Safari (18.2%), Edge (6.5%), and Firefox (3.7%) (Cloudflare Radar, human-only, June 2026). Bots claim Chrome even more often (78.6%), because headless Chrome dominates scraping and AI fetching, so a very high Chrome share with no matching mobile traffic can itself be a sign of automation.
What is the bot-to-human ratio on the internet?
The bot-to-human ratio is roughly 1 to 2: bots make up 35.2% of web traffic and humans 64.8%, so there is about one automated request for every two human ones (Cloudflare Radar, June 2026). The ratio is far higher in data-center-heavy countries (in the United States it is nearly 1 to 1, at 49.4% bot) and much lower in mobile-first markets like Mexico, where bots are just 11.8% of traffic.
How can you tell bot traffic from human traffic?
The most reliable signals are device type and verification. Human traffic is 55% mobile, but bot traffic is 84% desktop, because bots run on servers rather than phones (Cloudflare Radar, June 2026). Bots also over-claim Chrome (78.6% vs humans' 68.3%) and rarely use Safari. The strongest tell is identity: verified bots like GoogleBot and Claude-User confirm themselves through published IP ranges, while spoofed bots set a user-agent string they cannot prove.
What is the difference between a crawler and a bot?
A bot is any automated program that makes web requests; a crawler (or spider) is a specific type of bot that systematically fetches pages to index or collect them. All crawlers are bots, but not all bots are crawlers — chat-fetch agents, monitoring tools, and webhooks are bots that don't crawl. In Cloudflare's June 2026 data, the two largest bot categories are search-engine crawlers (26.8% of bot traffic) and AI bots (33.8% combined).
Are AI crawlers legal?
AI crawling sits in a legal gray area. robots.txt is a voluntary standard, not a binding law in most jurisdictions, so ignoring it is not automatically illegal — but copyright lawsuits against major AI labs and rules like the EU AI Act are actively testing the limits. In practice, the enforceable control is technical: more than 1 in 3 crawler requests (37%) already gets a 4xx block, and many sites restrict AI bots by user agent. See which sites block which AI bots in our robots.txt blocking report.
Methodology and Data Sources
Every figure in this report comes from the Cloudflare Radar API, pulled on June 22, 2026. We re-pull these endpoints on publish and update the date stamps, because bot traffic shifts week to week and a year-old number is a stale number. Cloudflare Radar reports aggregate, anonymized traffic observed across Cloudflare's global network; it is one large, neutral vantage point on the web, not a census of all internet traffic. Read it as a high-quality sample, and read the security-vendor estimates as a different, attack-surface-weighted sample.
Watch one technical detail: Cloudflare normalizes some datasets as percentages and one as a ratio. The bot-vs-human, operator, busiest-bot, crawl-purpose, category, block-rate, country, device, and browser figures are all percentages. The crawl-to-refer figure is a ratio (pages crawled per referral), so it is never expressed as a percentage and never charted as a share. A value of 4,580 means 4,580 pages per referral, not 4,580%.
The endpoints and windows used:
- Bot vs human: radar/http/summary/bot_class — 7d (2026-06-15 to 2026-06-22)
- Operator league: radar/bots/summary/bot_operator — 7d (2026-06-15 to 2026-06-22)
- Busiest bots: radar/bots/summary/bot — 7d (2026-06-15 to 2026-06-22)
- Crawl-to-refer ratio: radar/bots/crawlers/summary/crawl_refer_ratio — 28d (2026-05-25 to 2026-06-22)
- Crawl purpose: radar/ai/bots/summary/crawl_purpose — 28d (2026-05-25 to 2026-06-22)
- Bot category: radar/bots/summary/bot_category — 28d (2026-05-25 to 2026-06-22)
- Crawler block rate: radar/bots/crawlers/summary/response_status_category — 7d (2026-06-15 to 2026-06-22)
- Bot share by country: radar/http/summary/bot_class with a per-country
locationfilter — 7d (2026-06-15 to 2026-06-22) - Human vs bot device: radar/http/summary/device_type, filtered by
botClass=likely_humanandbotClass=likely_automated— 7d (2026-06-15 to 2026-06-22) - Human vs bot browser: radar/http/summary/browser_family, filtered by
botClass— 7d (2026-06-15 to 2026-06-22) - Human operating system: radar/http/summary/os, filtered by
botClass=likely_human— 7d (2026-06-15 to 2026-06-22)
The country, device, browser, and OS splits use Cloudflare's botClass filter to separate likely-human from likely-automated requests. Browser and OS are read from user-agent strings, which bots can spoof, so the bot-side browser figures reflect claimed identity rather than verified bots.
Source for all Cloudflare figures: Cloudflare Radar (radar.cloudflare.com). The Imperva (Thales) and HUMAN Security estimates are cited for the methodology reconciliation only and use those firms' own broader definitions of automated traffic.
We bring our own vantage point to this too. TechnologyChecker detects the technologies and crawlers behind more than 50 million domains every month, which is how we read operator patterns like these directly rather than secondhand. If you want to see what's running on a specific site, or which companies use a given technology, start with our technology detection & lookup data, or read how the detection works in our technology detection methods guide. For the broader picture of who is building on what, our most popular technologies by category rankings cover the live web behind these bots.
David Thomson
CTO

