Technology Detection Methods: How We Scan 50M+ Domains
Technology detection explained: we match 6,675 technologies across 14 signal types on a 50M-domain database, re-crawled monthly and scored 0–100.
Published •Updated •30 min read

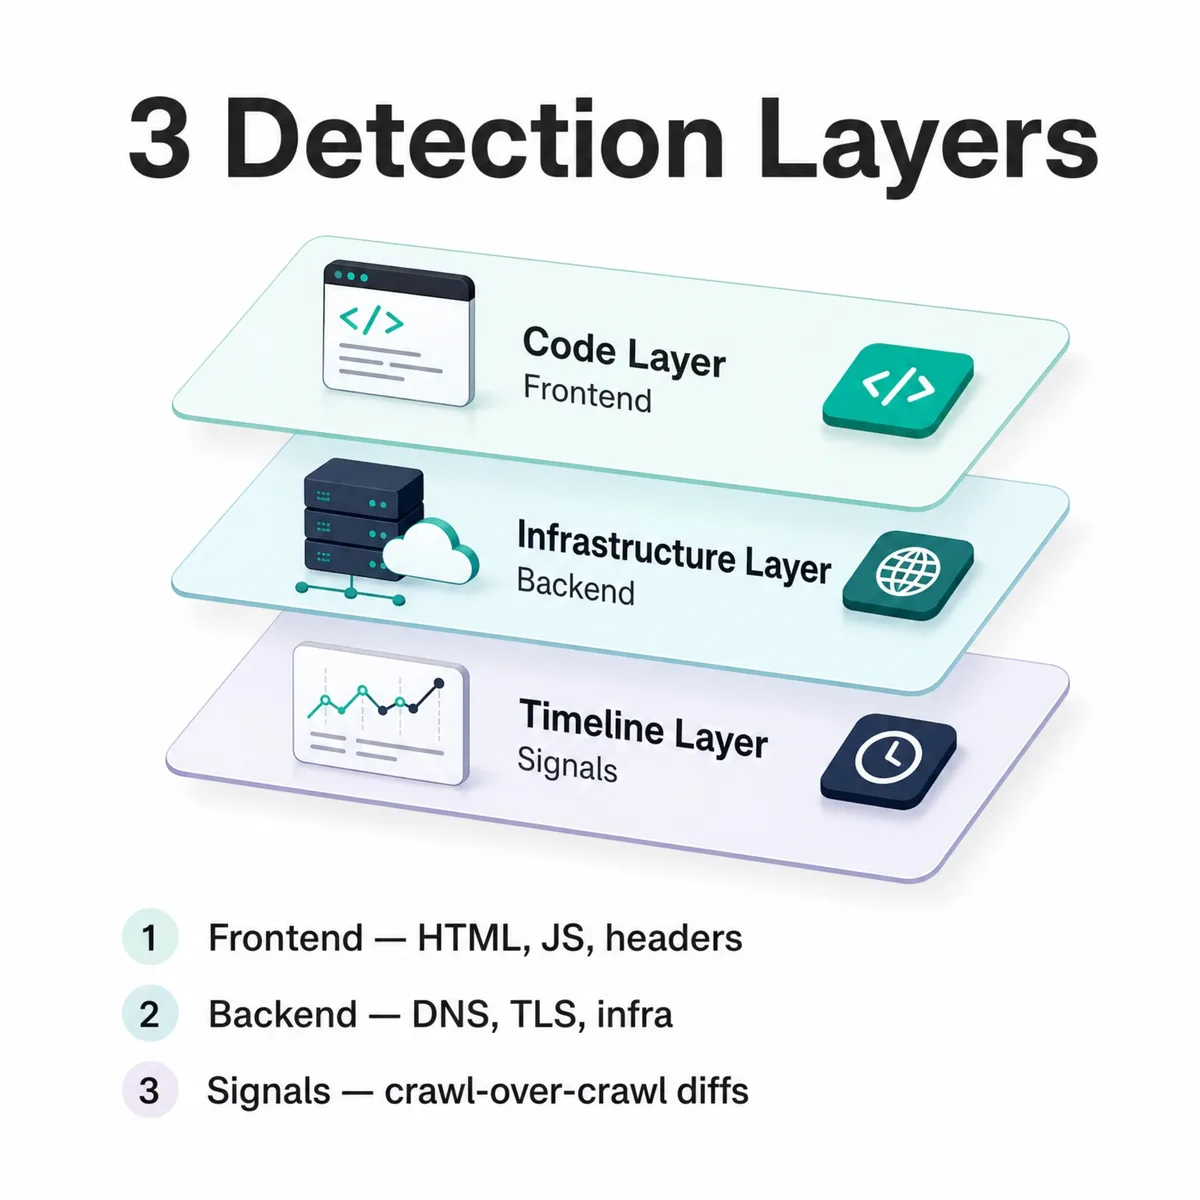
Technology detection methods identify the software a website runs by reading public signals across three layers: frontend code (HTML, JavaScript, headers), backend infrastructure (DNS, TLS, server responses), and change signals (crawl-over-crawl diffs). Our engine detects WordPress on 6,049,999 live domains, matching public signals against a bundled fingerprint ruleset of 6,675 technologies inside the 40,000+ we track overall.
I run the detection engine here, so this guide breaks down each layer, the data sources feeding them, how we score a match from 0 to 100, and what the data looks like at scale. Every number comes from our own published methodology (technologychecker.io/docs) and our detection database, dated where it matters. It covers the signals and confidence math most "tech stack" tool pages skip.
What are technology detection methods?
Technology detection methods are the techniques used to identify which technologies a website runs without insider access, by reading signals the site exposes publicly. A detection engine fetches a page, inspects its code and infrastructure, and matches what it finds against a database of known fingerprints. The result is a list of technologies with confidence scores.
There are three method families, and a strong engine uses all three together rather than relying on one:
- Frontend (client-side) detection reads what the browser sees: HTML markup, JavaScript globals, response headers, cookies, URL paths, and favicon hashes.
- Backend (server-side) detection reads infrastructure that the page itself doesn't show: DNS records, TLS certificates, server response profiles, and reverse-proxy headers.
- Signal-based detection watches a site over time, comparing crawls to catch adoptions, removals, and switches, the changes that reveal buying intent.
Frontend signals tell you what a site is built with. Backend signals confirm it and catch the SaaS platforms a generic frontend hides. Signal-based detection adds the time dimension. We track 40,000+ technologies this way, and the methodology behind it is documented publicly at technologychecker.io/docs so the counts can be checked, not just claimed.
/wp-content/ path alone can be a leftover from an old build. Treat any tool's output as a hypothesis until two independent signals agree.Frontend detection: how we read client-side signals
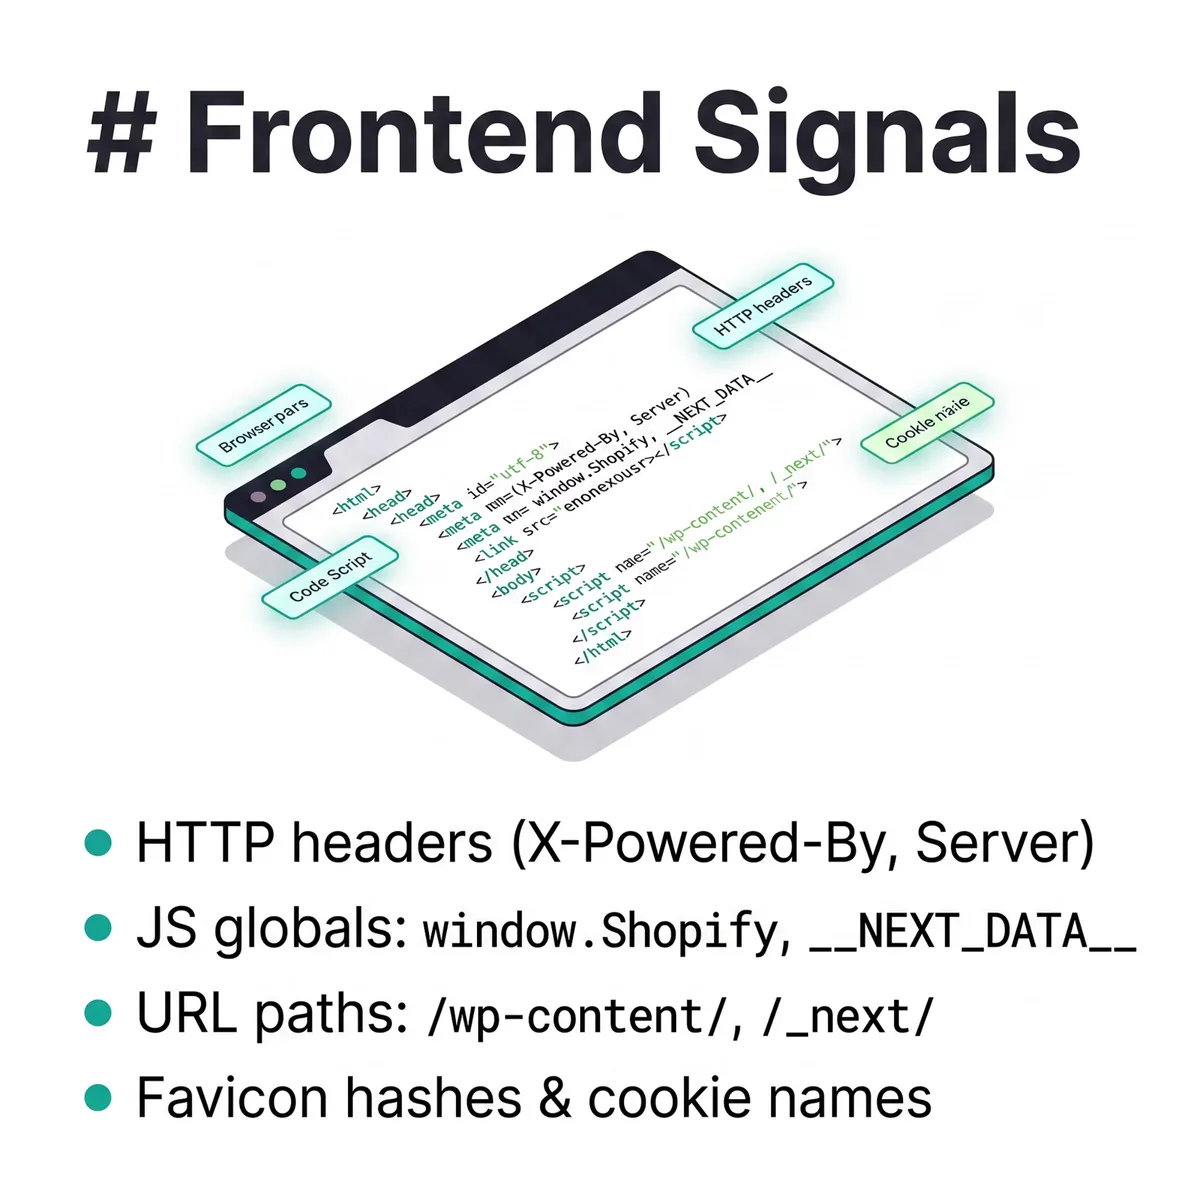
Frontend detection identifies technologies from everything a browser receives when it loads a page: the HTML source, the executed JavaScript, the response headers, cookies, and the URLs of assets. Our crawl fleet renders pages in a real browser, so we capture not just the raw HTML but the DOM after JavaScript runs, which is where most modern frameworks reveal themselves.
Six client-side signal types do most of the work:
- HTTP response headers like
X-Powered-By,Server,X-Generator, andContent-Security-Policy. TheServerresponse header often names the web server software outright, andX-Powered-Byfrequently leaks the application framework. - HTML patterns: meta tags such as
<meta name="generator">, plus<script src>and<link href>paths, and class or ID naming conventions a platform ships by default. - JavaScript globals the page defines at runtime:
window.Shopify,window.wp,window.ga,window.__NEXT_DATA__. These are strong because they only exist when the platform is actually executing. - Cookie names: platform-specific session cookies set on the response.
- URL paths baked into asset references:
/wp-content/for WordPress,/_next/for Next.js,/__nuxt__/for Nuxt. - Favicon hashes: an MD5 or perceptual match against a known platform's favicon.
A meta generator tag is high-value because it's explicit. A lone CSS class is weak because anyone can copy a theme. The real skill is in weighting each signal by how easy it is to fake, then combining them, which is exactly what backend detection lets us cross-check.
window.ga through a tag manager long after the analytics tool was removed. Pair the global with a live network request to confirm the tool is actually firing.Backend detection: server headers, DNS, and infrastructure signals
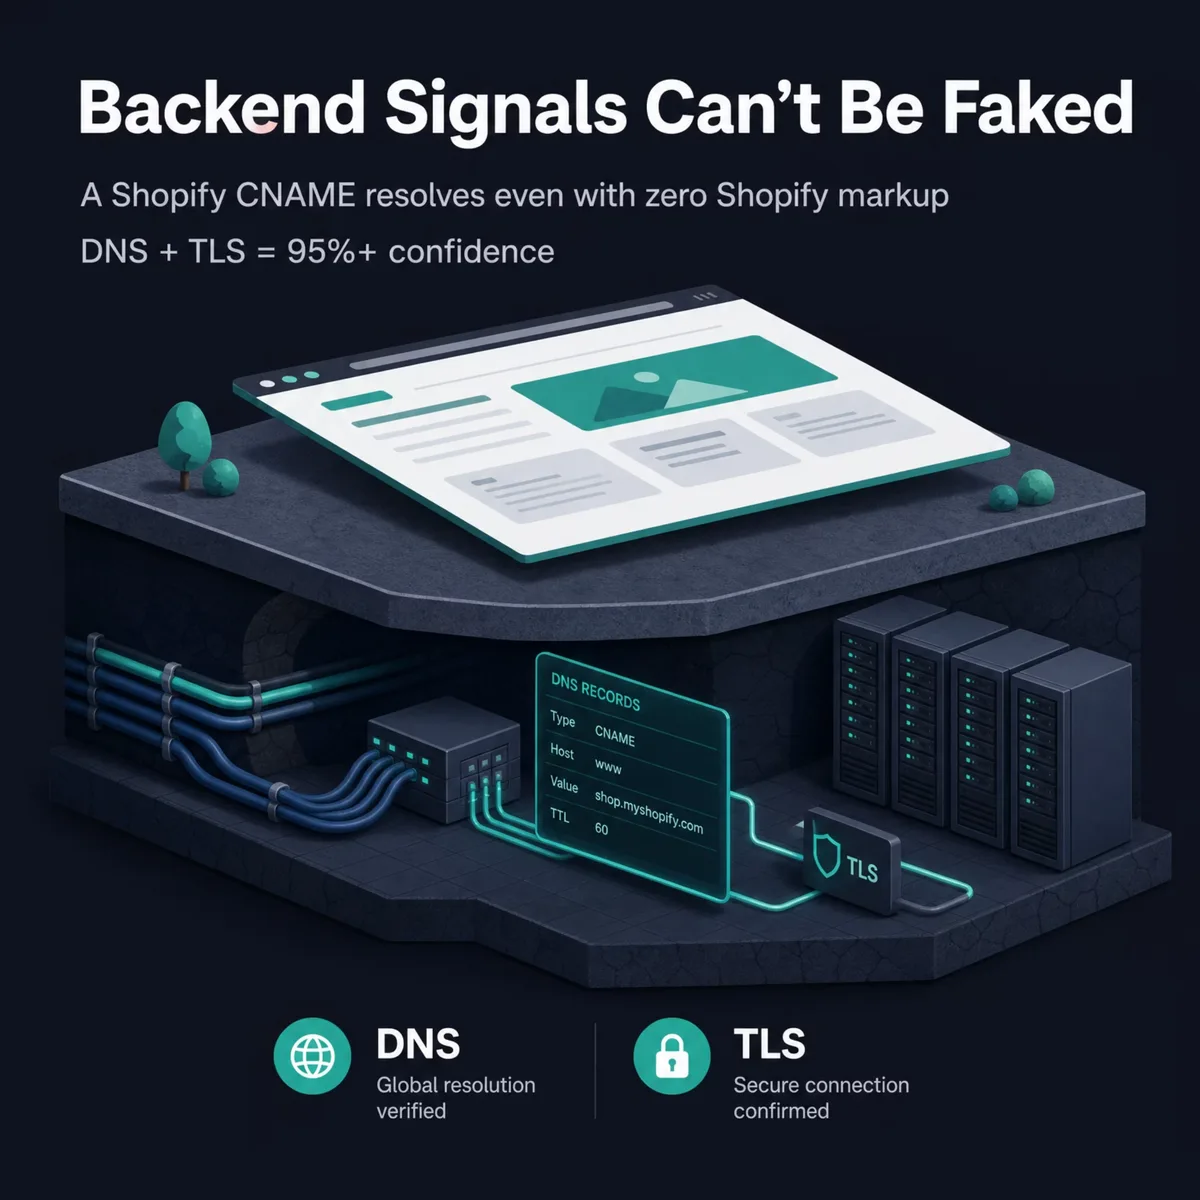
Backend detection identifies technologies from infrastructure the page never displays: DNS records, TLS certificates, server response profiles, and proxy headers. This layer matters because a polished, generic frontend can hide the platform underneath, but the infrastructure almost always gives it away. A storefront with no obvious Shopify markup still resolves to a Shopify CNAME.
The highest-value backend signals are infrastructure records rather than page content:
| Signal | What it reveals | Example |
|---|---|---|
| DNS CNAME target | SaaS platform behind a custom domain | *.myshopify.com, *.hubspot.com |
| A / AAAA + ASN lookup | Hosting provider and CDN | IP mapped to a known cloud or CDN ASN |
| MX records | Email platform | Google Workspace, Microsoft 365 |
| TXT records (SPF/DKIM) | SaaS adoption via mail authorization | Tool-specific include directives |
| TLS certificate SANs + issuer | Linked domains and cert provider | Shared SAN sets across a platform |
| Server response profile | CDN, hosting, reverse proxy | Header order and proxy fingerprints |
DNS-based detection is the most reliable single method we run, because a CNAME pointing at *.myshopify.com is hard to fake by accident. TLS certificates are the other signal in that top tier. A certificate's issuer and its Subject Alternative Names give the platform away: a wildcard cert from a platform's own certificate authority, or a SAN set shared across thousands of tenants, points at the host behind a custom domain even when the page looks generic. That's why we score DNS and SSL evidence at the same 95%+ confidence. When a CNAME, a TLS SAN, and a frontend global all name the same platform, the score climbs fast.
Signal-based detection: adoption, churn, and replacement
Signal-based detection finds technology changes over time by comparing one crawl against the next and flagging what moved. A signal is a technology change that suggests a company is in an active evaluation or purchasing cycle: adopting a tool, dropping one, or switching from one to a competitor. This is the layer that turns a static stack snapshot into intent data.
We detect six signal types from crawl-over-crawl diffs:
- Subscriber / adoption — a technology newly appears on a domain.
- Churn — a technology disappears, with an estimated removal date.
- Replacement detection — what the company switched to after dropping a tool.
- Competitive displacement — a rival platform takes a competitor's place.
- Customer-churn monitoring — tracking removals across an account list.
- Backend / standalone changes — shifts in tools like n8n, Airtable, or Notion that have little frontend footprint.
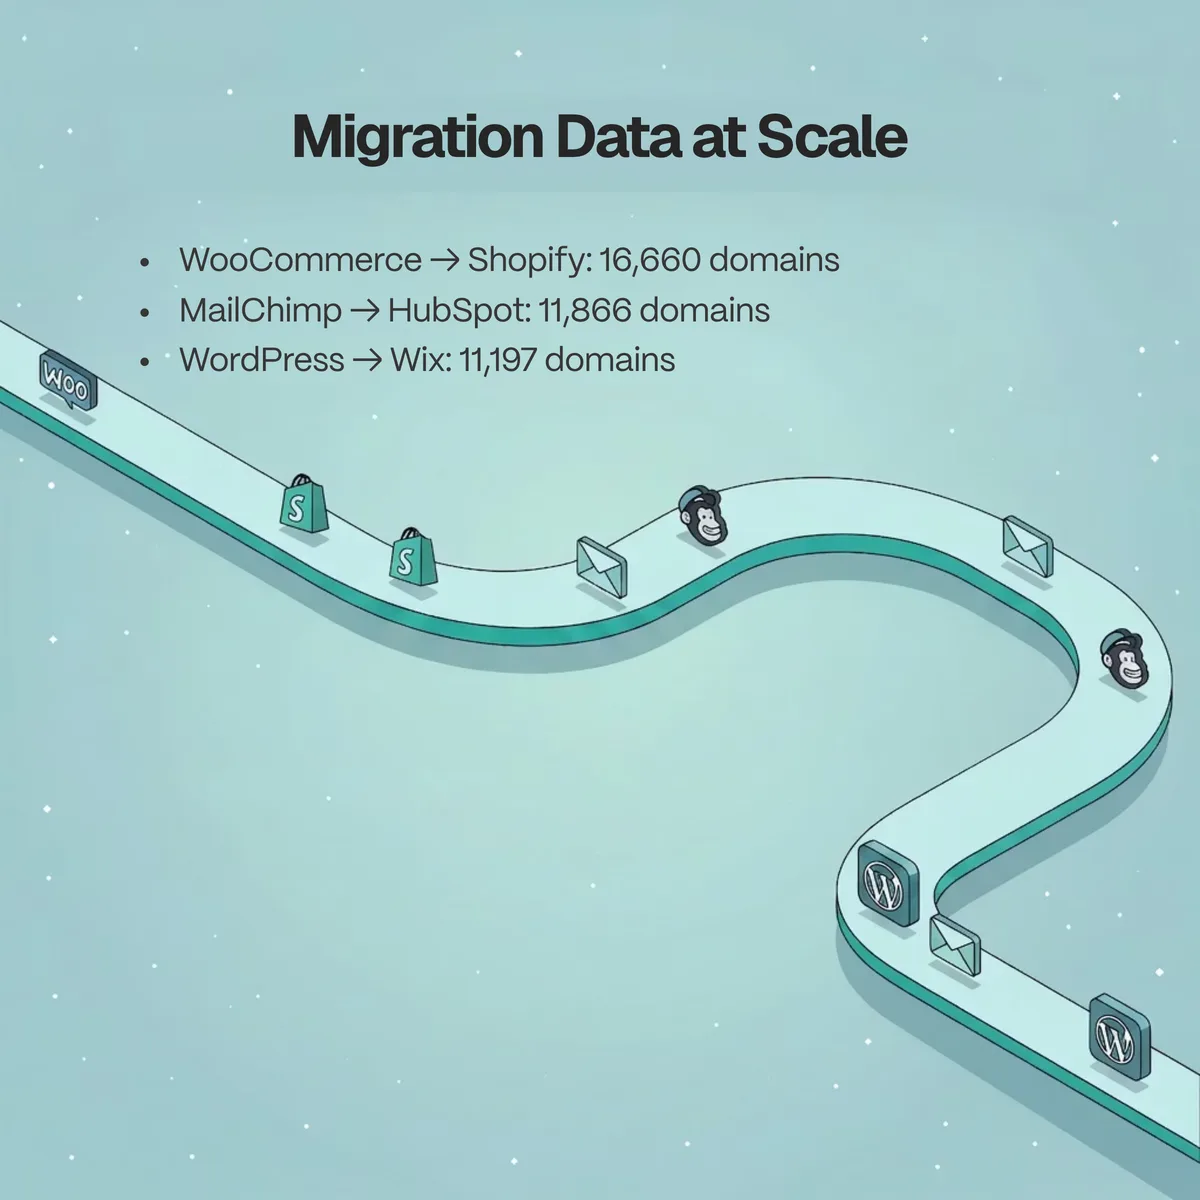
Replacement detection is the sharpest of these because it names both ends of a move. In our data, the biggest inbound source for Shopify is WooCommerce, with 16,660 domains switching across, and HubSpot's biggest inbound source is MailChimp, with 11,866 switches. The reverse direction matters too: WordPress's largest outbound moves go to Wix (11,197 domains) and Squarespace (10,342). These are concrete migration counts, not estimates.
| Replacement move | Direction | Domains switched |
|---|---|---|
| WooCommerce → Shopify | Inbound to Shopify | 16,660 |
| MailChimp → HubSpot | Inbound to HubSpot | 11,866 |
| WordPress → Wix | Outbound from WordPress | 11,197 |
| WordPress → Squarespace | Outbound from WordPress | 10,342 |
| Magento → Shopify | Inbound to Shopify | 5,186 |
Which detection methods cover the most technologies?
The three method families don't carry equal weight, and the actual distribution is published rather than hand-waved. Our live engine tracks 40,000+ technologies overall and currently ships active fingerprints for 6,675 of them — the bundled ruleset that runs on every crawl. Each fingerprint uses one or more of fourteen pattern methods, and those methods split into two camps: fetch-compatible methods that resolve from a plain HTTP response, and browser-required methods that only fire once JavaScript executes.
Here is every method, ranked by how many technologies depend on it, with a real example of what each one matches:
| Method | What it matches | Example |
|---|---|---|
scriptSrc |
<script src> URLs, by regex |
cdn.shopify.com |
js |
JavaScript globals the page defines | window.__NEXT_DATA__, window.Shopify |
dom |
rendered elements, by CSS selector | div[id*='react-root'] |
scripts |
inline <script> body, by regex |
a config object a tag injects |
meta |
<meta> name/content pairs |
<meta name="generator"> → WordPress |
headers |
HTTP response headers | X-Powered-By: Next.js, Server: nginx |
cookies |
cookie names and values | _shopify_s, __cfduid |
dns |
DNS MX / TXT / NS records | MX → aspmx.l.google.com |
xhr |
network requests the page fires | a tracking pixel or third-party API call |
url |
the page URL itself | a path a platform forces |
text |
visible text content | a default footer string |
css |
stylesheet content | a framework's generated class rule |
html |
raw HTML source | a comment a CMS leaves behind |
robots |
robots.txt content |
a platform-specific directive |
scriptSrc is the highest-yield method (3,281 of the 6,675 technologies rely on it) because script URLs like cdn.shopify.com are stable and match without rendering a thing. But the next two, js (3,014) and dom (1,351), both need a browser: a global like window.__NEXT_DATA__ only exists after the script runs, and a selector like div[id*='react-root'] only matches against the DOM once React has built it.
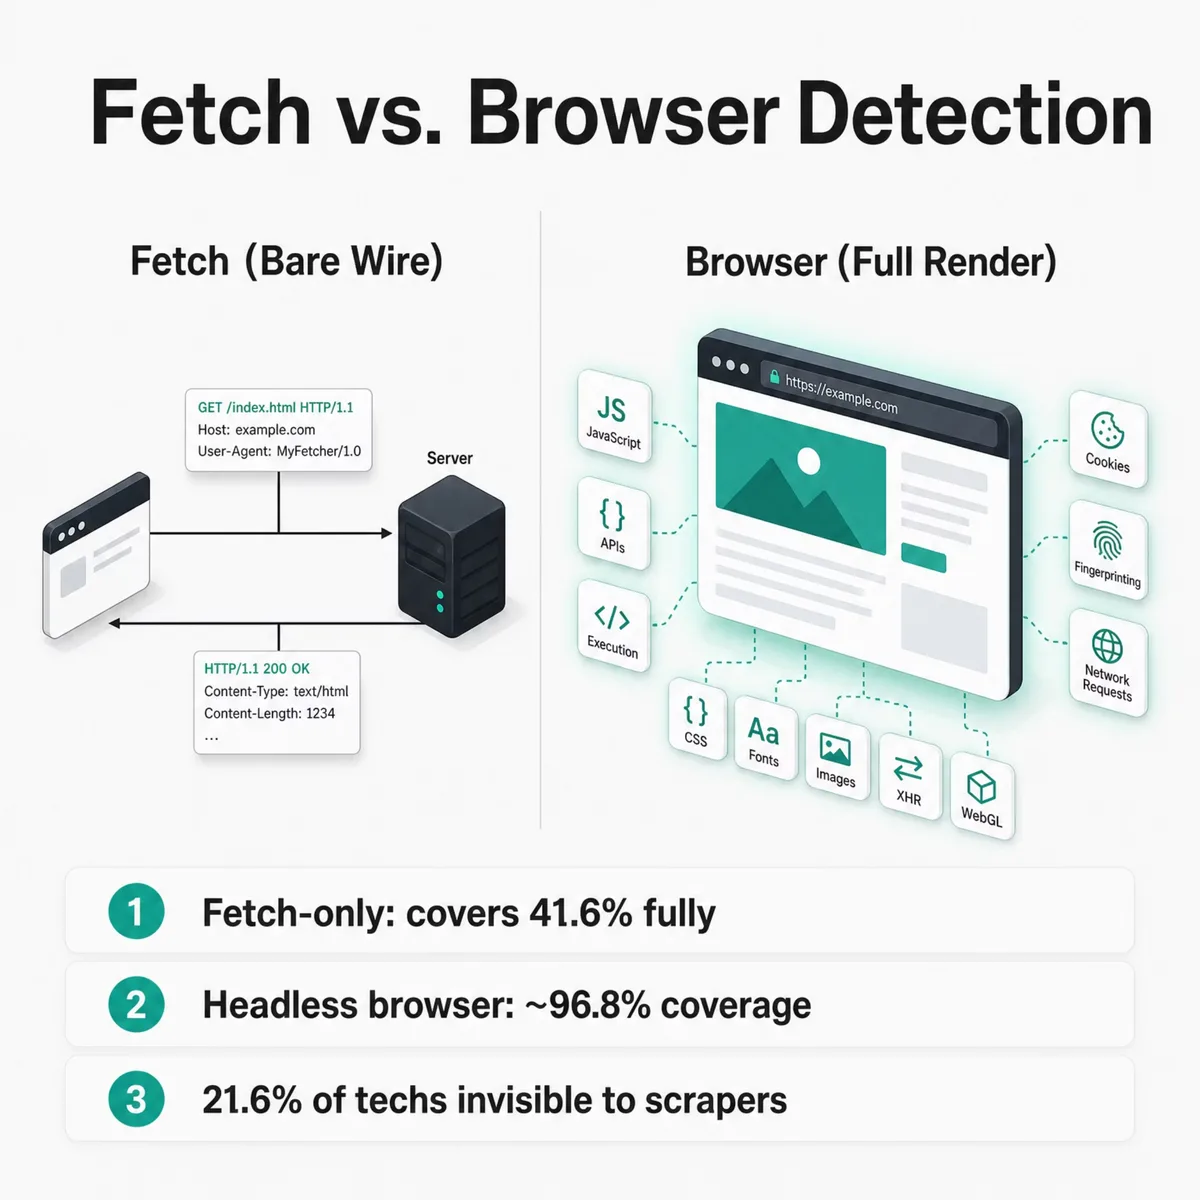
That split has a consequence most "tech stack" tools skip over. Group the 6,675 fingerprints by what they require to fire:
| Detection mode | Technologies | Share | Detectable without a browser? |
|---|---|---|---|
| Fetch-only | 2,779 | 41.6% | Fully |
| Mixed (fetch + browser) | 2,454 | 36.8% | Partially |
| Browser-only | 1,442 | 21.6% | Not at all |
More than one in five technologies — 1,442, or 21.6% — are invisible to a fetch-only scraper. They carry no fetch-compatible pattern at all, so a tool that reads raw HTML without rendering simply never sees them. That's why our detection API exposes three modes, and why our crawl defaults to real rendering rather than plain fetches:
| Mode | How it fetches | JS execution | Coverage of the 6,675 |
|---|---|---|---|
fetch |
Plain HTTP request | No | 41.6% fully, up to 78.4% partially |
light |
Headless browser API | Yes | ~96.8% (js + dom + all fetch methods) |
full |
Puppeteer with request interception | Yes | 100% — all 6,675 |
light mode covers js and dom but can't intercept network traffic, so the 101 xhr-only technologies need full mode. The pattern underneath is the part worth internalizing: the cheaper a detector is to run, the more it misses, and the gap concentrates in exactly the modern, JavaScript-heavy tools buyers care about most. We render every page in a real browser for that reason, not only to dodge blocks.
Coverage isn't the only thing a method decides. It also sets how trustworthy a removal is, the churn reliability behind the signal data above. A method's absence only counts as real churn if that method is deterministic across every response:
| Reliability | Methods | Why |
|---|---|---|
| High | dns, headers, robots, html, meta, css, url |
server- or markup-controlled; present on every response, so absence means real removal |
| Medium | scripts, cookies, text |
in the HTTP body but can be injected, consent-gated, or vary by page |
| Low | scriptSrc, js, dom, xhr |
conditional, async, or page-specific; absence doesn't prove removal |
This is a different axis from the fetch-versus-browser split: scriptSrc is the single highest-volume method, yet it's low churn-reliability, because a script tag can drop off one page and still load on the next. A technology scores by its most reliable method, since genuine churn requires all of its patterns to miss at once. Across the ruleset that lands at 1,513 high-reliability, 910 medium, and 4,245 low, which is why a churn alert backed by a DNS or header method carries more weight than one resting on a script URL alone.
Inside our multi-layered detection architecture
Our detection runs on four data sources that feed and cross-check each other, so no single point of failure silently corrupts a result. Each has a different strength: live crawling sees current code, DNS monitoring catches infrastructure shifts fast, real-time signals trigger fresh crawls, and Common Crawl archives extend the history further back.
| Data source | What it captures | Cadence |
|---|---|---|
| Live web crawling | Headers, HTML, executed JS, network requests, rendered DOM | Tier 1: every 24–72h; Tier 2: weekly; Tier 3: monthly/on-demand |
| Passive DNS monitoring | CNAME, NS, MX, A/AAAA, TXT record changes | Significant mutations trigger a re-crawl, typically within 15 minutes |
| Real-time signals | TLS certificate issuances, HTTP infra signals, new-domain detection | Automatically queues crawls |
| Common Crawl archives | Historical pages 2008–present via byte-range fetches | Enriches ~35% of historical timeline records |
We crawl approximately 50M domains in total — 29.9M of them currently active company domains, the rest dead or transitional after years of crawling — and re-crawl that full detection database every month, refreshing high-priority segments daily, so a record is rarely more than a crawl cycle out of date. Run that cadence long enough and the crawls become an archive in their own right: we now hold about two years of our own crawl-over-crawl history, and that first-party time-series is what powers the adoption, churn, and migration timelines elsewhere in this post. The Common Crawl corpus extends those timelines further back, to 2008, but it enriches only about 35% of our historical records. The majority come from our own crawls, so our history doesn't hinge on a third party. Passive DNS is the speed layer: when a CNAME changes, that's often the first sign of a hosting migration, and a significant mutation pushes the domain back into the crawl queue within minutes instead of waiting for the next scheduled pass.
Monitoring Certificate Transparency logs is how we find sites in the first place. Every TLS certificate a publicly trusted authority issues gets appended to these open, append-only Certificate Transparency logs, a system that exists so browsers can audit misissued certificates. Millions of new certificates land there every day, and we tail that stream. A certificate from a known platform's certificate authority triggers domain discovery and schedules a crawl, so a property can enter our pipeline the moment it goes live, before anyone links to it or a search engine indexes it. The certificate's SANs matter as much as the domain on it. They routinely list subdomains, so a cert for app.newproduct.example.com surfaces a subdomain a homepage crawl would never reach. Tailing certificate logs at that volume is its own data job, but it's the difference between waiting to stumble onto a site and being told the moment it exists.
The scale behind this is large enough that freshness and coverage stop trading off against each other.
A practical example is the domain lookup, the website technology checker at the front of our product. It runs in two stages: an instant check against the 50M+ pre-crawled database, and, if there's no match, a live detection that renders the page and runs pattern matching in 5 to 15 seconds. Either way it returns each technology's name, category, and first- and last-detected dates on a timeline, separating active tools from removed ones.
How we crawl 50M+ domains reliably

Crawling at this scale only works if the crawler reaches sites the way a real visitor does. Two things make that possible: a large, rotating proxy pool and full browser rendering.
We route requests through a pool of 40M+ IPs, rotating them and spreading load across networks so no single address hammers a host. Each page is then fetched by a real browser engine, not a bare HTTP client. That matters more than it sounds. A real browser runs the page's JavaScript, sends the headers a browser sends, and presents a genuine TLS and browser fingerprint, so the request reads like an actual visit instead of a script. Most blocks exist to stop naive scrapers that skip all of that, so a real-browser crawl on a clean IP rarely trips them in the first place.
We also crawl politely, which is the other half of staying unblocked. We honor robots.txt, pace requests instead of flooding a server, and back off when a host signals it's busy. When a page does sit behind a challenge or a rate limit, we don't fight it: we reschedule it, serve the last good result from the pre-crawled database, or pull the page from our Common Crawl archive instead. Between live rendering, proxy rotation, and those fallbacks, coverage across 50M+ domains stays high without depending on any single path.
How we score detection confidence and avoid false positives
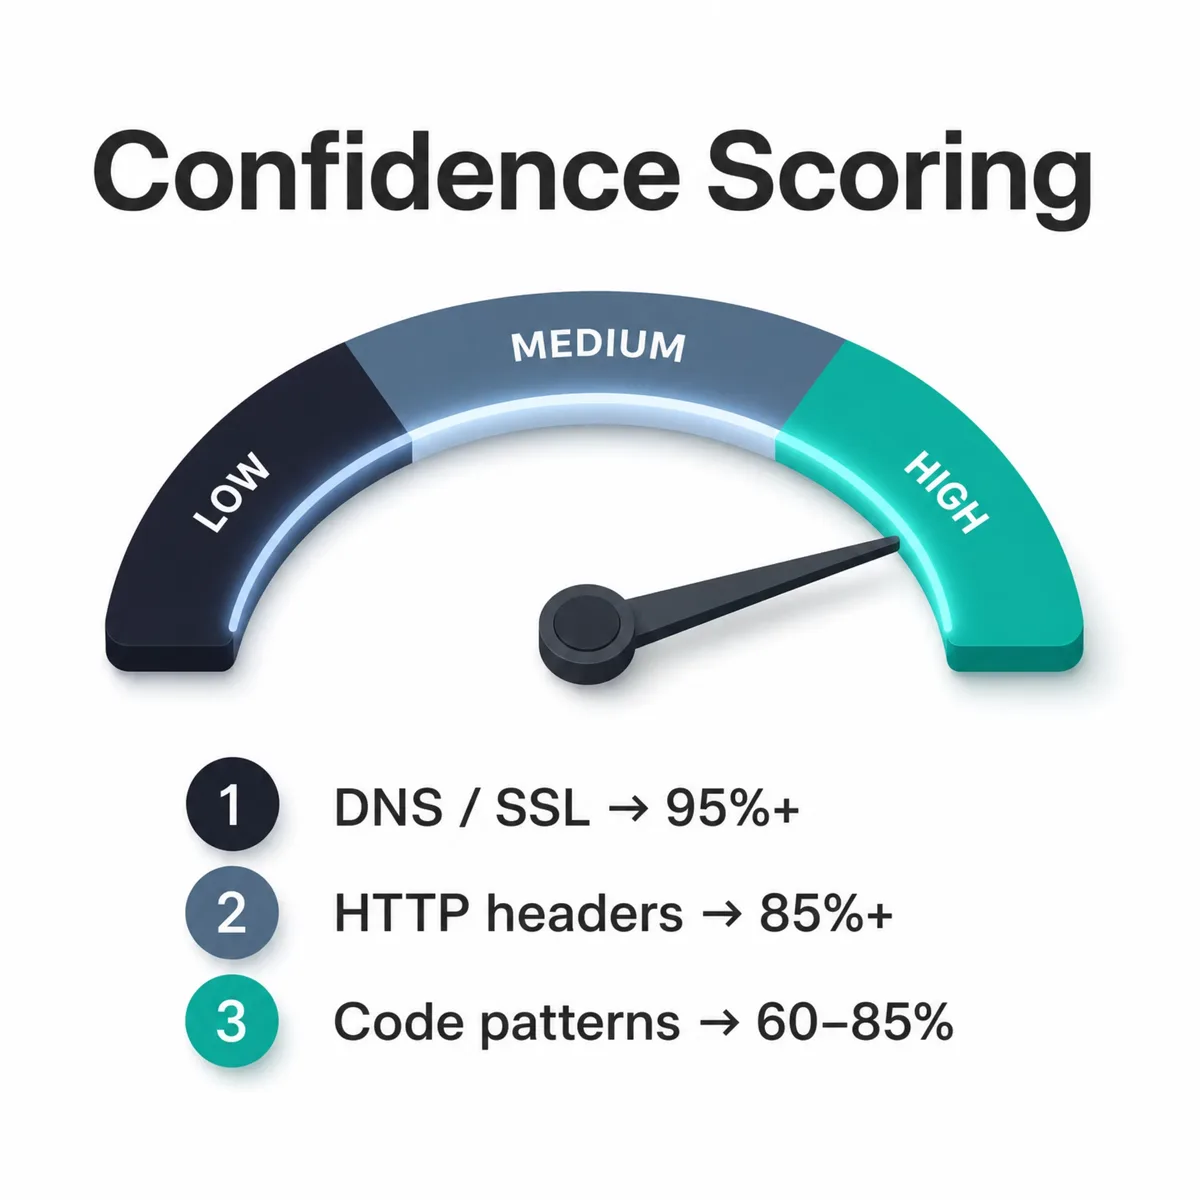
Every detection carries a confidence score from 0 to 100, and that number is the honest part of the system, where we admit not every signal is equally trustworthy. A match built on one weak signal scores low and may be excluded entirely; a match corroborated across the frontend, backend, and DNS layers scores high. Signals are weighted by reliability, and evidence from different layers compounds the score.
Per-method confidence is published, so you can see why a score lands where it does:
| Detection method | Typical confidence | Why |
|---|---|---|
| DNS / SSL-based | 95%+ | CNAME targets and certificate data are hard to fake by accident |
| HTTP-header-based | 85%+ | Headers are explicit but can be modified or stripped |
| Code / infrastructure inference | 60–85% | Patterns are suggestive; weighted and combined, not trusted alone |
A score above 80 means the detection is backed by multiple independent signal sources, not a single lucky match. Matches below a minimum threshold are dropped before they ever reach the database, which is the main lever for keeping false positives down.
Honesty about limits matters here. Detection reflects only what's publicly observable, so a tool fired purely server-side with no client footprint is harder to catch. Different platforms use different methods, which is why counts vary between tools. None is "the" truth; each measures what its signals can reach.
Technology detection in action: what the data shows
Detection methods are only as good as the numbers they produce, so here's what ours look like across three well-known platforms. WordPress leads its category, Shopify leads ecommerce, and HubSpot sits third in its space, each with a live count, a category share, and a churn figure pulled directly from our detection database.
| Technology | Live domains | Category share | Category rank | As of |
|---|---|---|---|---|
| WordPress | 6,049,999 | 63.04% | #1 | 2026-02-28 |
| Shopify | 2,446,083 | 45.99% | #1 | 2026-05-11 |
| HubSpot | 121,300 | 7.76% | #3 | 2026-03-01 |
WordPress holding a 63.04% category share matches the broader consensus that it's the most widely used CMS on the web, a finding independent usage rankings corroborate from an entirely separate methodology. When two independent detection approaches agree on the leader, that's a good sign both are reading real signals.
The churn side is where detection gets interesting, because removals tell you as much as adoptions:
| Technology | Previously used (removed) | Relative to live base |
|---|---|---|
| WordPress | 4,395,002 | 73% of its live base |
| Shopify | 1,324,454 | 54% of its live base |
| HubSpot | 289,752 | 239% of its live base |
HubSpot's removed-domain count running to 239% of its live base is the standout — far more domains have dropped HubSpot over time than currently run it. That pattern is only visible because signal-based detection records removals with estimated dates, not just what's live right now.
Geography adds another readable dimension. The United States is the single largest market for all three platforms in our crawl:
| Country | WordPress domains | Shopify domains | HubSpot domains |
|---|---|---|---|
| United States | 44,004 | 34,324 | 38,400 |
| United Kingdom | 11,350 | 8,550 | 9,510 |
| Australia | 5,126 | 6,252 | 3,810 |
These are detected-domain samples by merchant country, so read them as a ranking of where each platform is concentrated, not as a global total. For the full picture on one platform's switching behavior, our Shopify migration data breakdown tracks every store moving in and out across seven rival platforms.
What we extract and enrich beyond the technology stack
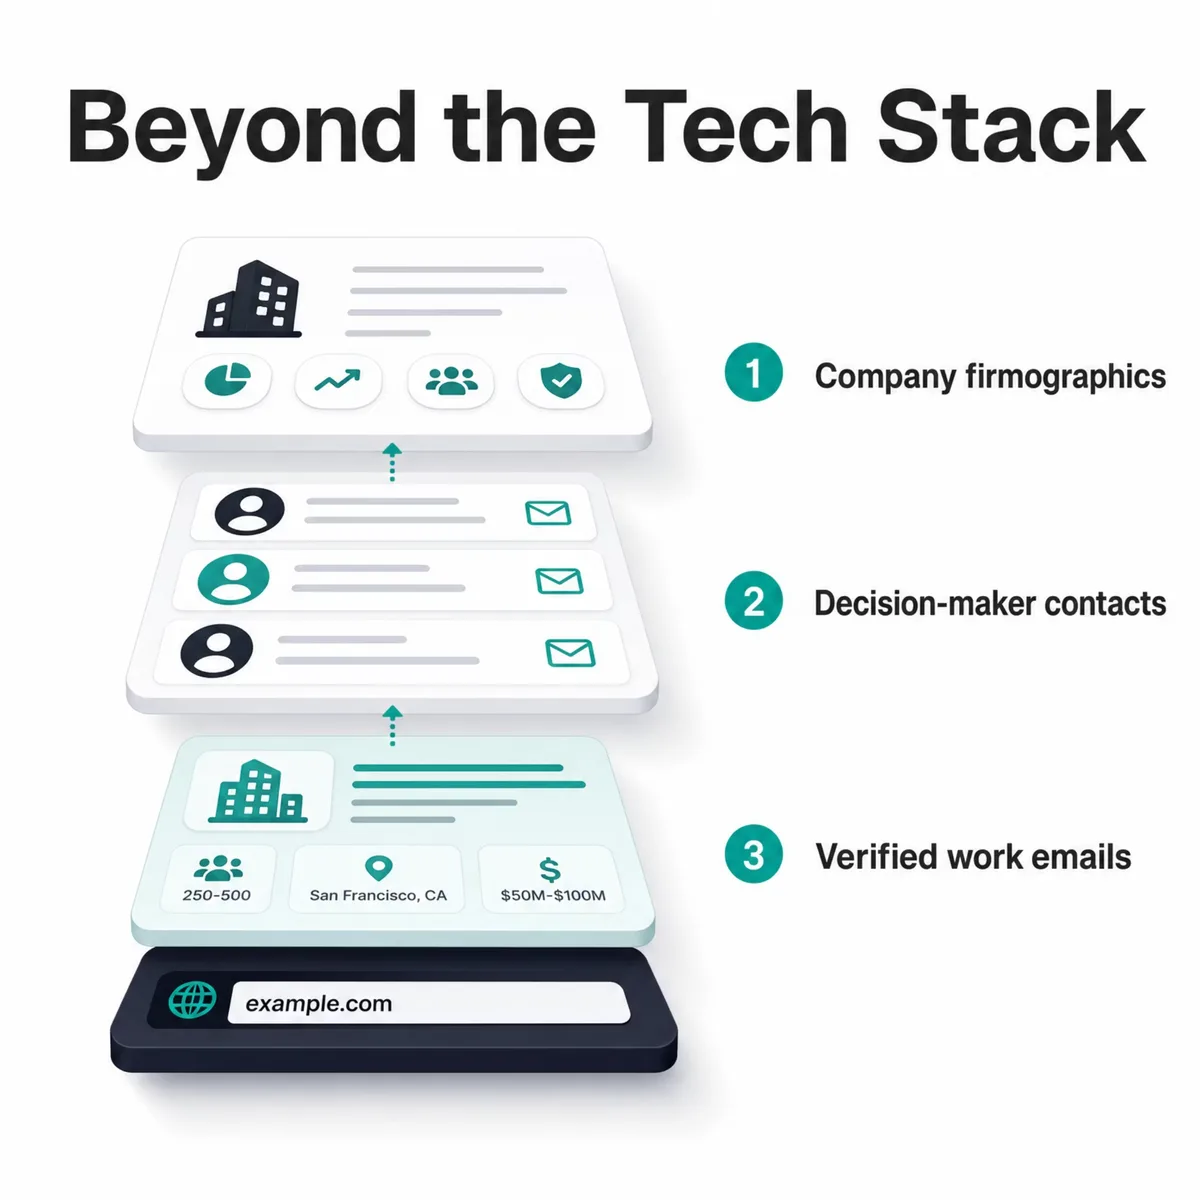
Detection tells you what a site runs. To act on that, you also need to know who the site belongs to, and that takes a second layer: extraction and enrichment. We run both on every domain we crawl, so a detected technology arrives attached to a usable company record instead of a bare URL.
During the same render that reads technology signals, the crawl pulls a page's structured data. That includes schema.org and JSON-LD blocks (Organization, Product, LocalBusiness), Open Graph and Twitter Card tags (og:title, og:image, twitter:card), and the meta title and description. These are fields a site publishes about itself, so they give a clean, machine-readable profile we use to categorize the company, pull its logo and description, and reconcile everything to one record.
Then we resolve that domain to a company and enrich it with firmographics from sources like LinkedIn and Crunchbase. This is the step that turns "this domain runs Shopify" into "a 50-to-200-person retail brand in Austin, Series B, running Shopify alongside Klaviyo."
| Enrichment layer | What we add | Pulled from |
|---|---|---|
| Page data | schema.org / JSON-LD, Open Graph + Twitter tags, meta title and description | The rendered page |
| Company firmographics | Employee count, industry, HQ location, revenue range, founded year, funding stage | LinkedIn, Crunchbase |
| Decision-maker contacts | Names, titles, department and seniority, verified work emails, LinkedIn profiles | Verified B2B contact data |
This enrichment is also what lets the WordPress, Shopify, and HubSpot counts earlier in this post break down by country and company size. The detected technology is the trigger; the enriched record is what a GTM team actually works.
How job postings reveal the tools a website hides
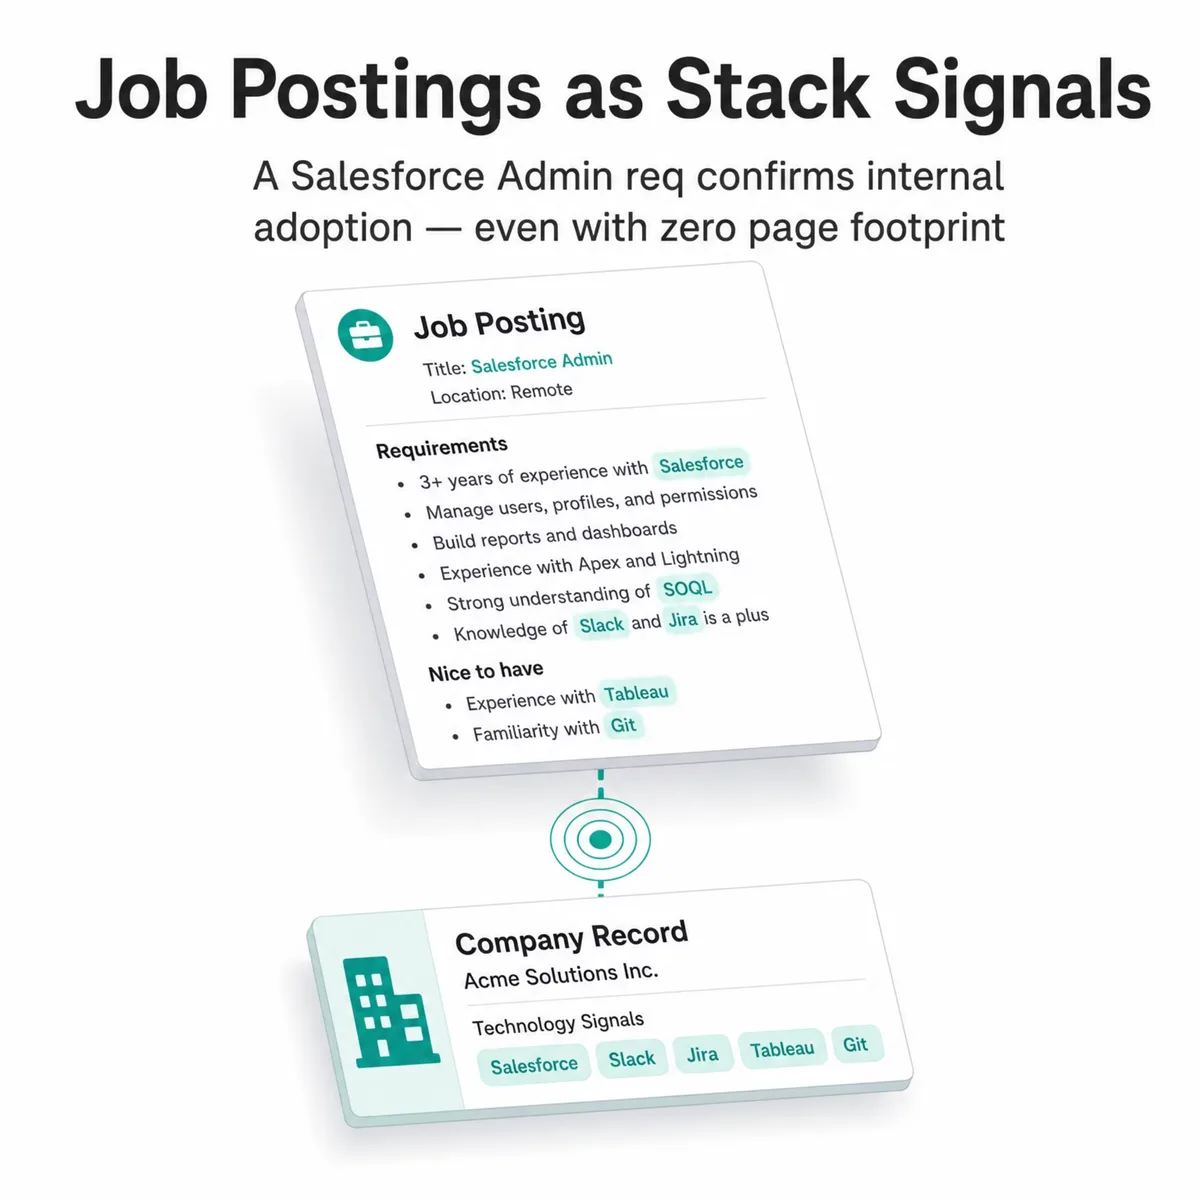
The three method families all read the same surface: a company's own site and infrastructure. That leaves a real gap. A tool used purely internally, a data warehouse, an HR platform, a marketing-ops system with no public widget, can run a business every day and never touch a single byte the crawl can see. Detection that only reads the website will miss it every time.
Hiring closes that gap. When a company staffs up around a tool, it says so in writing: a posting for a "Marketo Certified Specialist," or a req that asks for "3+ years administering Salesforce," is a company naming the software it runs. So we read those too. We scrape major job boards and companies' own careers pages, then use AI to pull the named technologies out of unstructured job descriptions, separating a tool the role requires from one that's merely nice to have or a competitor's product mentioned in passing.
A stated requirement is a strong adoption signal, but it's still a claim, so we treat it like one. We reconcile each hiring mention against two other things: what we actually detect on the company's site, and what the company says about its own stack elsewhere. When a job post asks for Salesforce and we also resolve a Salesforce signal on the domain, the detection is corroborated from two independent angles. When the post names a tool we can't see on the site, that's the valuable case — because it's usually the internal, no-footprint software the crawl was never going to find.
That adds two things at once. It extends coverage to tools that leave no technical trace, and it adds intent: a company hiring around a platform is actively invested in it, not just running it quietly in the background. Both feed the same confidence model as every other signal, weighted by source, corroborated across layers, and never trusted on its own.
How to put technology detection to work in your GTM strategy
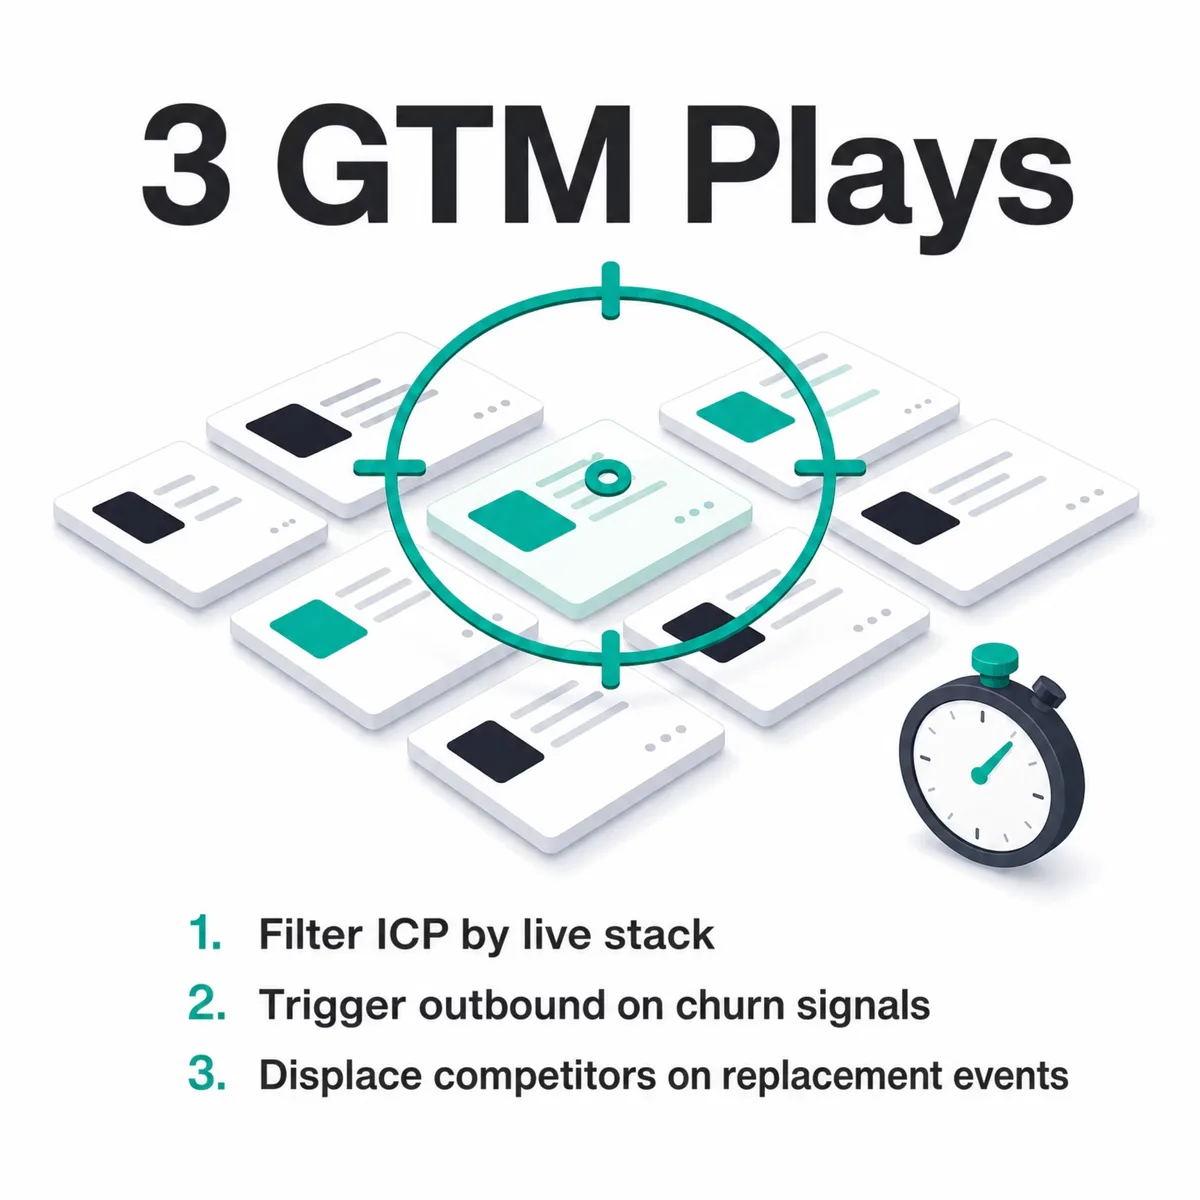
Technology detection earns its keep in go-to-market when you stop treating it as trivia and start triggering action on it. The three method layers map cleanly to three plays: frontend and backend data define who fits your ideal customer profile, and signal-based detection times the outreach. Here's how to run each.
Build a precise ICP filter. Frontend and backend detection together tell you exactly what a prospect runs. If you sell a Shopify app, a filter on live Shopify domains gives you a clean total addressable market — 2,446,083 domains in our data — segmentable by country. Layer in a second technology (say, a specific email tool) to narrow to your best-fit pattern, since cross-stack combinations are where ICP precision lives.
Trigger outbound on churn and replacement signals. This is the play with the highest payoff. A company that just dropped a competitor is in-market by definition. When our engine flags 16,660 stores leaving WooCommerce for Shopify, a Shopify-adjacent vendor has a timed list of accounts that just voted with their stack. Replacement signals name the destination, so you know whether a switch helps or hurts your pitch.
Run competitive displacement campaigns. Customer-churn monitoring against your own win list tells you when an account leaves a rival, and competitive displacement signals show where your category is gaining or losing ground. Teams that act on switching data tend to time outreach better than teams working from static firmographics, a pattern we dug into in our analysis of why SaaS companies switch CRMs.
If you want to run these plays against live detection data, our pricing and plans page lays out what API and lead-list access looks like. For a wider view of how technographic tools fit together, the technology lookup software industry overview compares the broader market.
Frequently Asked Questions
What are the main detection methodologies?
The main technology detection methodologies fall into three layers: frontend detection (reading HTML, JavaScript globals, headers, cookies, and URL paths), backend detection (DNS records, TLS certificates, and server response profiles), and signal-based detection (comparing crawls over time to catch adoptions, removals, and switches). Strong engines combine all three and score each match by confidence rather than relying on one method.
Which technology is used to detect a website's tech stack?
A detection engine combines a browser-based crawler, a DNS monitor, and a fingerprint database. The crawler renders pages to capture executed JavaScript and headers, the DNS monitor watches CNAME, MX, and TXT records, and the fingerprint database matches those signals against known patterns. Our engine ships bundled fingerprints for 6,675 technologies, part of the 40,000+ we track overall, and scores every match from 0 to 100.
What are technology detection methods examples?
Concrete examples include matching a <meta name="generator"> tag for a CMS, reading the window.Shopify JavaScript global for Shopify, resolving a *.hubspot.com CNAME to confirm HubSpot, checking a /wp-content/ URL path for WordPress, and hashing a site's favicon against known platforms. Backend examples include MX records revealing an email platform and TLS certificate logs flagging a new property.
How do frontend detection methods work?
Frontend detection works by inspecting everything a browser receives when loading a page. The crawler captures the rendered DOM, response headers, cookies, asset URLs, and JavaScript globals, then matches them against fingerprints. A window.__NEXT_DATA__ global indicates Next.js, a /_next/ path corroborates it, and a Server header may name the host. Multiple agreeing signals raise the confidence score.
What backend signals are used for technology detection?
Backend signals come from infrastructure, not page content. The key ones are DNS CNAME targets (a *.myshopify.com record reveals Shopify), MX records (which email platform a domain uses), TXT records like SPF and DKIM (SaaS adoption), A/AAAA records with ASN lookups (hosting and CDN), and TLS certificate SANs and issuers. DNS and SSL-based detection are the most reliable methods, scoring 95%+ confidence.
How are new domains and subdomains discovered?
New properties surface through Certificate Transparency logs. Every publicly trusted TLS certificate is appended to these open logs, so when a domain or subdomain gets a certificate from a known platform authority, that issuance triggers domain discovery and schedules a crawl, often before the site is linked or indexed anywhere. A certificate's SANs also expose subdomains a homepage crawl would never reach, which is why we monitor the log stream continuously instead of waiting to find sites by following links.
What company data is attached to a detected domain?
Each detected domain is resolved to a company and enriched beyond the tech stack. From the page itself we extract structured data: schema.org / JSON-LD, Open Graph and Twitter tags, and the meta title and description. From firmographic sources like LinkedIn and Crunchbase we add employee count, industry, location, revenue range, founded year, and funding stage, plus decision-maker contacts with titles and verified work emails. That's what makes a technology filter return company records rather than a list of URLs.
How do you crawl 50M+ domains without getting blocked?
Most blocks target naive scrapers, so we avoid looking like one. Every page is fetched by a real browser engine (real JavaScript execution, real headers, a genuine browser fingerprint) through a rotating pool of 40M+ IPs, so requests read like ordinary visits and no single address overloads a host. We also honor robots.txt and pace the crawl. When a page does sit behind a challenge or rate limit, we back off and fall back to the pre-crawled database or our Common Crawl archive instead of forcing it.
Can technology detection work without a real browser?
Only partly. Of the 6,675 technologies in our detection ruleset, 41.6% can be fully identified from a plain HTTP response and up to 78.4% can be detected at least partially, but 21.6% are browser-only: they carry no fetch-compatible pattern and stay invisible unless JavaScript executes. A headless browser raises coverage to roughly 96.8%, and only full rendering with network interception catches the remaining xhr-based tools. That's why our crawl renders every page in a real browser instead of reading raw HTML.
How accurate is technology detection?
Accuracy varies by method, which is why responsible engines report per-method confidence instead of one figure. DNS and SSL-based detection scores 95%+, HTTP-header-based detection 85%+, and code or infrastructure inference 60–85%. A combined score above 80 means multiple independent signals agree. We deliberately publish no single "accuracy %" because it would obscure this real variance between signal types.
What is the difference between frontend, backend, and signal detection?
Frontend detection reads client-side code the browser receives (HTML, JavaScript, headers). Backend detection reads infrastructure the page doesn't display (DNS, TLS, server responses), which catches platforms a generic frontend hides. Signal-based detection adds time, comparing crawls to flag adoptions, removals, and switches. The first two identify the current stack; the third reveals change and buying intent.
How can SaaS companies use technology detection for lead generation?
SaaS companies use detection three ways. They build an ICP filter from frontend and backend data to find accounts running a specific stack, they trigger outbound on churn and replacement signals when a prospect drops a competitor, and they run displacement campaigns by monitoring removals across a target list. The signal layer is the most actionable because a company that just switched tools is in-market.
What are the limitations of technology detection?
Detection only sees what's publicly observable, so a tool running purely server-side with no client footprint is hard to catch. Counts also differ between tools because each uses different signals and thresholds, so no single number is definitive. Confidence varies by layer, which is why per-detection scoring exists. Honest engines exclude low-confidence matches rather than inflate coverage.
Can you detect technologies that have no website footprint?
Partly, and not from the website. A tool used purely internally, a data warehouse, an HR system, or a marketing-ops platform with no public widget, can leave no trace the crawl can read. To reach those, we read hiring signals: we scrape major job boards and company careers pages and use AI to extract the technologies a role requires, then reconcile each mention against what we detect on the site and what the company claims about its own stack. A posting for a "Marketo Specialist" is a strong adoption signal even when Marketo never appears in the page code, which is how technology detection extends past what a crawler alone can see.
How does signal-based detection reveal buying intent?
Signal-based detection compares one crawl against the next and flags technology changes: a tool appearing, disappearing, or being replaced. A company that just removed a competitor's product is, by definition, evaluating alternatives. Replacement detection names the destination too, so when 11,866 domains move from MailChimp to HubSpot, that's a dated, directional intent signal.
The bottom line on technology detection methods
Reliable technology detection runs on three layers that cross-check each other. Frontend signals read the code a browser sees, backend signals read the infrastructure a page hides, and signal-based detection adds the time dimension that turns a stack snapshot into intent data. The confidence score ties them together, weighting DNS and SSL evidence above header tweaks above raw code inference.
The proof is in the counts: 6,049,999 WordPress domains, 2,446,083 Shopify domains, and dated churn and replacement figures behind each. If you're choosing a detection source, ask how it layers its signals and whether it's honest about per-method confidence, then start with one play and add a churn trigger once it's working.
Where to go deeper
Every method and number in this guide comes from our product documentation. If you want the full technical detail, or to run detection against your own list, these are the best next stops.
From our documentation:
- Our data: how detection works — the full methodology behind this post: live crawling, passive DNS, certificate transparency, and Common Crawl across 500M+ domains.
- Domain lookup — scan any website for its full stack, with company firmographics and an adoption timeline.
- Real-time buying signals — adoption, churn, and replacement signals with confidence scoring and verified contacts.
- Technologies we track — browse the 40,000+ technologies we detect, with market-share and trend charts.
- Market share and migration — category share, quarterly growth, and migration analysis across 50M+ domains.
- Lead lists — pair detection with firmographic filters and export verified contacts.
- How we compare — TechnologyChecker side by side with Wappalyzer, BuiltWith, and other tools.
- Quickstart — scan your first domain and make your first API call in a couple of minutes.
Related research:

CTO
15+ years of experience
David is the CTO of TechnologyChecker, responsible for the engineering and architecture behind the platform's crawling infrastructure.
- MEng Computer Science, University of Edinburgh
- AWS Solutions Architect Professional
- Contributor, Open Source Crawling Frameworks
Never miss our research

