Google Cloud Statistics: Market Share & Competition Report 2026
Google Cloud revenue hit $24.8B in Q2 2026, up 82%. But only 19% of enterprises run significant workloads on it. Full market share and competition data.
Published •Updated •31 min read

Google Cloud generated $24.8 billion in Q2 2026, up 82% year over year — an acceleration on Q1's 63%. Yet only 19% of enterprise cloud decision makers run significant workloads on it, against 53% for AWS. Google Cloud is growing faster than any hyperscaler and converting trials into production more slowly than either rival.
Report scope: worldwide, 2015 to Q2 2026. Primary sources are Alphabet, Gartner, Flexera, Wikibon, Synergy Research Group, Canalys and Google, plus TechnologyChecker.io's own detection data. Methodology, limitations and the full source table are at the end.
Key findings
- Google Cloud revenue reached $24.8 billion in Q2 2026, up 82% year over year, taking the segment to a $99 billion annual run rate (Alphabet).
- Growth accelerated through 2026 — 63% in Q1, 82% in Q2 — after a full-year 2025 rate of 35.8%.
- Google Cloud's committed-but-unbilled backlog reached $514 billion, up from $106 billion a year earlier (Alphabet).
- Its share of cloud infrastructure spend rose to 14% in Q1 2026 and 15% in Q2 2026, up from 10% in Q4 2024, in quarters worth $128.6bn and $143.4bn (Synergy Research Group).
- Only 19% of cloud decision makers run significant workloads on Google Cloud, against 53% for AWS and 46% for Azure — measured winter 2024 and not re-measured since (Flexera).
- Google Cloud has the highest experimentation rate of any major provider at 20%, and 37% of its usage base is still at trial or planning stage versus 11% for AWS.
- Google's share of worldwide IaaS spending rose from 3.3% in 2017 to 9.0% in 2024 — the only top-three vendor to gain share in every year of that span (Gartner).
- Google Cloud Marketplace lists 1,920 virtual machine products but only 46 generative AI listings (Google).
- In our own crawl, the US accounts for 56.95% of Google Cloud's detected base against 36.94% of Azure's, making Google Cloud the more US-concentrated of the two, while Japan and India both reach Google Cloud's top eight and neither reaches Azure's (TechnologyChecker.io).
The 2026 update: growth accelerated, and the gap got more interesting
Most of the structural data in this report runs through 2024 and 2025, because that is where the survey and market-share series end. Alphabet has since reported two quarters of 2026, and they change the revenue picture sharply enough that they belong at the front rather than buried in a footnote.
| Quarter | Revenue | YoY growth | Operating income |
|---|---|---|---|
| Q4 2025 | $17.66B | +47.7% | — |
| Q1 2026 | $20.0B | +63% | $6.6B |
| Q2 2026 | $24.8B | +82% | $8.8B |
Source: Alphabet, reported results, via CRN. Q2 2026 operating margin 35.6%.
Growth did not merely continue, it accelerated: 35.8% across full-year 2025, then 63%, then 82%. Google Cloud's first half of 2026 alone ($44.8 billion) brought in more than the whole of 2024 ($43.2 billion), and Q2 puts the segment at a $99 billion annual run rate. Synergy Research Group measured the wider market growing 43% year over year in Q2 2026, the fastest in eight years, which its chief analyst John Dinsdale attributed to AI demand having "lit a fire under the cloud market."
Cloud Market Share Q1 2026: AWS 28%, Azure 21%, Google Cloud 14%
Enterprise spending on cloud infrastructure services reached $128.6 billion in Q1 2026. Amazon Web Services held 28% of that spending, Microsoft Azure 21% and Google Cloud 14%, putting the big three at 63%. Figures are from Synergy Research Group's own release of 29 April 2026.
Source: Synergy Research Group · Q1 2026
| Cloud provider | Share of global cloud infrastructure spend (%) |
|---|---|
| AWS | 28% |
| Microsoft Azure | 21% |
| Google Cloud | 14% |
| All other providers | 37% |
- The big three hold 63% of cloud infrastructure spending
- Q1 2026 spending reached $128.6 billion worldwide
- Google Cloud at 14% is the only one of the three to have gained share every year since 2017
| Vendor | Q1 2026 share | Q4 2024 share |
|---|---|---|
| AWS | 28% | 33% |
| Microsoft Azure | 21% | 20% |
| Google Cloud | 14% | 10% |
| All other providers | 37% | 37% |
Sources: Synergy Research Group (Q1 2026), Canalys (Q4 2024). Worldwide cloud infrastructure services spend.
Share moved with it. Google Cloud reached 14% of global cloud infrastructure spend in Q1 2026, up from the 10% Canalys measured in Q4 2024, inside a $128.6 billion quarter, and 15% in Q2 2026 on $143.4 billion. AWS slipped to 28% from 33%. The Big Three held 63% of spend, level with Q4 2024 — the three are redistributing share among themselves rather than taking it from the long tail.
Does the 2026 surge invalidate the commitment gap?
No — and this is the part worth being careful about, because the obvious reading is wrong.
The commitment-gap finding below says Google Cloud converts trials into production workloads at roughly 26% where AWS manages 60%. A naive reading of 82% growth says that gap must have closed. The available evidence says something different: revenue accelerated through concentration, not breadth.
Two data points point that way. First, the backlog. Google Cloud finished Q2 2026 with $514 billion in committed-but-unbilled revenue, up from $106 billion a year earlier and up more than $50 billion in a single quarter. A backlog roughly five times annualised revenue is the signature of a small number of very large multi-year commitments, not of many mid-sized customers standardising. Second, UBS analysts estimate that 27% of Google Cloud's 2026 revenue comes from OpenAI and Anthropic alone, rising toward 48% next year. That figure is a third-party estimate rather than a reported number and should be treated as such — but it is directionally consistent with the backlog shape.
If both hold, the 2026 surge is the commitment gap's mirror image rather than its refutation: an extremely committed handful of AI-native customers spending enormous sums, sitting on top of a broad enterprise base that still mostly runs Google Cloud for one or two workloads. The Flexera workload-depth survey was taken in winter 2024 and has not been re-run since, so the honest position is that nobody has yet measured whether the AI boom widened Google Cloud's enterprise base or only deepened it among customers it already had. That is the single most valuable question in this report, and the next Flexera wave will answer it.
Google Cloud's revenue trajectory
Google Cloud is the fastest-compounding line item Alphabet reports. In 2017 it was a rounding error against Google's advertising business. In 2025 it cleared $58 billion, which would make it a Fortune 100 company on its own.
Google Cloud Revenue Reached $58.7 Billion in 2025
Google Cloud generated 58.7 billion U.S. dollars in 2025, up almost 36 percent on the previous year. The segment has grown more than fourteenfold since 2017, when it brought in just over 4 billion dollars, making it the fastest-compounding line item in Alphabet's reporting.
Source: Alphabet · 2017-2025
| Year | Revenue (million U.S. dollars) |
|---|---|
| 2017 | $4056 |
| 2018 | $5838 |
| 2019 | $8918 |
| 2020 | $13059 |
| 2021 | $19206 |
| 2022 | $26280 |
| 2023 | $33088 |
| 2024 | $43229 |
| 2025 | $58705 |
- Google Cloud revenue grew 35.8% in 2025, to $58.7 billion
- The segment is 14.5x larger than it was in 2017
- 2025 added $15.5 billion of new revenue — more than the segment's entire 2020 total
| Year | Revenue (billion USD) | YoY growth |
|---|---|---|
| 2017 | $4.06 | — |
| 2018 | $5.84 | +43.9% |
| 2019 | $8.92 | +52.8% |
| 2020 | $13.06 | +46.4% |
| 2021 | $19.21 | +47.1% |
| 2022 | $26.28 | +36.8% |
| 2023 | $33.09 | +25.9% |
| 2024 | $43.23 | +30.6% |
| 2025 | $58.71 | +35.8% |
Source: Alphabet, via Statista. Worldwide, 2017 to 2025.
The compounding here is unusually steady. Google Cloud has not had a single down year since Alphabet began breaking the segment out, and the absolute increments keep getting larger: 2025 added $15.5 billion of new revenue, which is more than the segment's entire 2020 total. Growth rates that hold near 35% at a $58 billion base are rare, and they are the single strongest argument that Google Cloud's market position is better than its share numbers suggest.
The quarterly series shows where the acceleration happened.
Google Cloud Quarterly Revenue Hit $24.8 Billion in Q2 2026
Google Cloud earned 24.8 billion U.S. dollars in the second quarter of 2026, up 82 percent year over year and an acceleration on Q1 2026's 63 percent. The segment has now grown in every quarter since Q1 2020 without a single sequential decline, and the first half of 2026 alone brought in more revenue than the whole of 2024.
Source: Alphabet · Q1 2020 - Q2 2026
| Quarter | Revenue (billion U.S. dollars) |
|---|---|
| Q1 '20 | $2.78B |
| Q2 '20 | $3.01B |
| Q3 '20 | $3.44B |
| Q4 '20 | $3.83B |
| Q1 '21 | $4.05B |
| Q2 '21 | $4.63B |
| Q3 '21 | $4.99B |
| Q4 '21 | $5.54B |
| Q1 '22 | $5.82B |
| Q2 '22 | $6.28B |
| Q3 '22 | $6.87B |
| Q4 '22 | $7.32B |
| Q1 '23 | $7.45B |
| Q2 '23 | $8.03B |
| Q3 '23 | $8.41B |
| Q4 '23 | $9.19B |
| Q1 '24 | $9.57B |
| Q2 '24 | $10.35B |
| Q3 '24 | $11.35B |
| Q4 '24 | $11.96B |
| Q1 '25 | $12.26B |
| Q2 '25 | $13.62B |
| Q3 '25 | $15.16B |
| Q4 '25 | $17.66B |
| Q1 '26 | $20B |
| Q2 '26 | $24.8B |
- Q2 2026 revenue of $24.8 billion grew 82% year over year
- Growth accelerated through 2026, from 63% in Q1 to 82% in Q2
- The first half of 2026 alone ($44.8B) exceeded all of 2024 ($43.2B)
| Year | Q1 | Q2 | Q3 | Q4 |
|---|---|---|---|---|
| 2020 | $2.78B | $3.01B | $3.44B | $3.83B |
| 2021 | $4.05B | $4.63B | $4.99B | $5.54B |
| 2022 | $5.82B | $6.28B | $6.87B | $7.32B |
| 2023 | $7.45B | $8.03B | $8.41B | $9.19B |
| 2024 | $9.57B | $10.35B | $11.35B | $11.96B |
| 2025 | $12.26B | $13.62B | $15.16B | $17.66B |
| 2026 | $20.00B | $24.80B | — | — |
Source: Alphabet, via Statista (through Q4 2025) and Alphabet reported results (2026).
Every quarter since Q1 2020 has topped the one before it — 26 consecutive periods without a sequential decline. The curve visibly bends at the end. Q4 2025 added $2.50 billion over Q3, which was then the largest single-quarter step in the segment's history; Q2 2026 added $4.80 billion over Q1 and nearly doubled that record. Google Cloud is not just growing, it is growing faster in absolute terms each quarter than it did the quarter before, and through 2026 that acceleration itself accelerated.
Google Cloud in the context of Alphabet
Alphabet's segment table puts the cloud business in proportion. Advertising is still the engine, but its share of the total is slipping as cloud climbs.
| Segment (in million USD) | 2017 | 2020 | 2022 | 2024 |
|---|---|---|---|---|
| Google Search & other | 69,811 | 104,062 | 162,450 | 198,084 |
| YouTube ads | 8,150 | 19,772 | 29,243 | 36,147 |
| Google Network Members' properties | 17,616 | 23,090 | 32,780 | 30,359 |
| [TOTAL] Google advertising | 95,577 | 146,924 | 224,473 | 264,590 |
| Google Cloud | 4,056 | 13,059 | 26,280 | 43,229 |
| Google subscriptions, platforms, and devices | 10,914 | 21,711 | 29,055 | 40,340 |
| [TOTAL] Google revenues | 110,547 | 181,694 | 279,808 | 348,159 |
| Other Bets revenues | 477 | 657 | 1,068 | 1,648 |
Source: Alphabet, via Statista. Worldwide, 2017 to 2024, excluding hedging gains and losses.
In 2024 Google Cloud overtook the "subscriptions, platforms, and devices" segment for the first time, making it Alphabet's second-largest business by revenue. It is worth noting that the Google Cloud segment as Alphabet reports it bundles Google Cloud Platform infrastructure with Google Workspace subscriptions, so it is not a like-for-like comparison with AWS, which is infrastructure only.
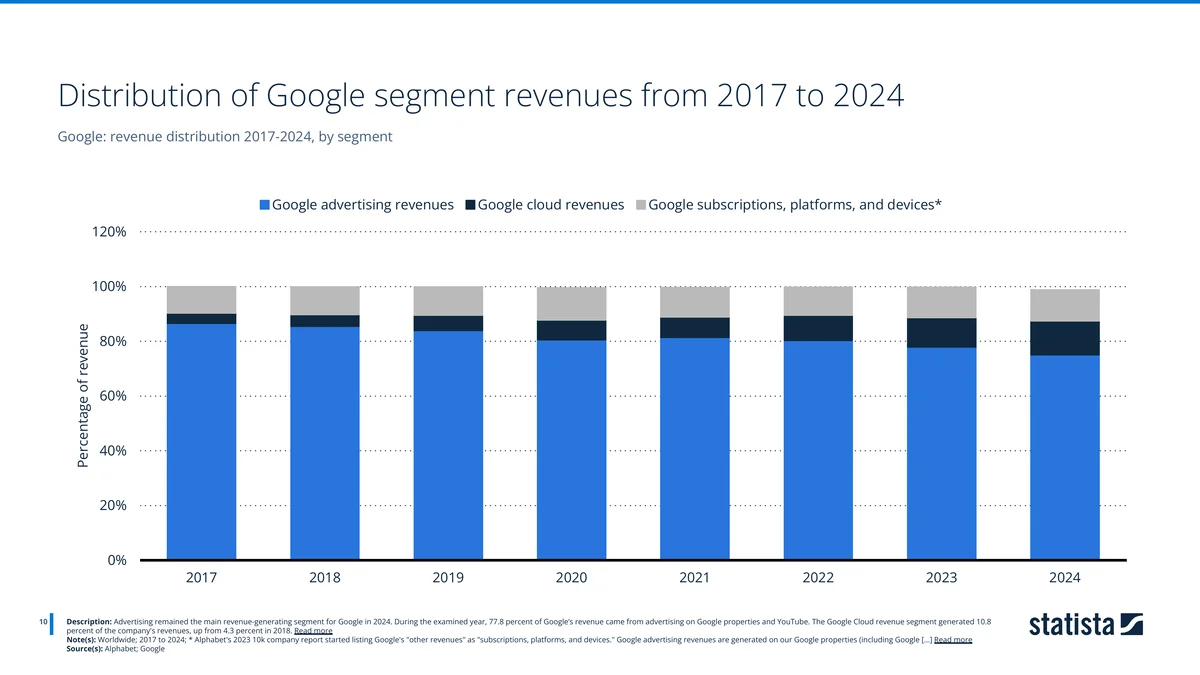
Computed from the segment table above, advertising fell from 86.5% of Google's revenue in 2017 to 76.0% in 2024, while Google Cloud rose from 3.7% to 12.4%. Alphabet crossing the point where an eighth of Google's revenue comes from cloud is a genuine structural change in what the company is, even if the ad business still funds everything.
One correction worth flagging for anyone working from the same dossier: the caption Statista prints beneath this chart cites 77.8% for advertising and 10.8% for cloud. Those are the 2023 figures, not 2024 — they reconcile exactly against the 2023 column of the segment table. The percentages above are recomputed from the labelled data.
Where Google Cloud actually sits in the market
This is where the picture gets less flattering, and where a lot of published cloud commentary goes wrong.
A caveat on the "top 10 cloud vendors" ranking
The most widely circulated cloud vendor ranking looks like this:
| Rank | Vendor | Revenue (billion USD) |
|---|---|---|
| 1 | Microsoft | 42.4 |
| 2 | Amazon | 29.3 |
| 3 | Google Cloud | 12.3 |
| 4 | Salesforce | 10.0 |
| 5 | Oracle | 6.2 |
| 6 | SAP | 5.4 |
| 7 | ServiceNow | 3.0 |
| 8 | Workday | 2.1 |
| 9 | IBM | 1.6 |
| 10 | Snowflake | 1.0 |
Source: cloudwars.co, via Statista. Worldwide, 2025.
Two things about this table matter more than the ordering. First, these are quarterly figures, not annual ones, despite frequently being reproduced as full-year revenue — Google Cloud's $12.3 billion matches its Q1 2025 result of $12.26 billion almost exactly. Second, the vendors are not measured on the same basis. Microsoft's $42.4 billion is its entire commercial cloud, which includes Microsoft 365 subscriptions; Amazon's $29.3 billion is AWS infrastructure. Reading this table as "Microsoft's cloud infrastructure is 1.4x AWS" is a mistake, and it is a mistake made often.
The share data below is a better guide to competitive position.
IaaS market share: Google is gaining, slowly
Google's Share of the Global IaaS Market Nearly Tripled Since 2017
Google held 9.0 percent of the global infrastructure as a service market in 2024, up from 3.3 percent in 2017. Its share has risen in every single year of the period without exception — the only one of the top three vendors that can claim an unbroken climb. Amazon fell from 51.8 to 37.7 percent over the same years while Microsoft rose from 13.3 to 23.9 percent.
Source: Gartner · 2017-2024
| Year | Google's share of global IaaS market (%) |
|---|---|
| 2017 | 3.3% |
| 2018 | 4% |
| 2019 | 5.2% |
| 2020 | 6.1% |
| 2021 | 7.1% |
| 2022 | 7.5% |
| 2023 | 8.2% |
| 2024 | 9% |
- Google's IaaS share rose from 3.3% in 2017 to 9.0% in 2024
- It is the only top-three vendor whose share grew every year of the period
- Even after tripling, Google's share is roughly a quarter of Amazon's 37.7%
Google's IaaS share nearly tripled over eight years. That is real progress, and Google is the only one of the top three vendors whose share increased in every single year of the period. But the base is small enough that tripling still leaves it at roughly a quarter of Amazon's share.
The full vendor picture shows where the movement came from:
| Year | Amazon | Microsoft | All other vendors | |
|---|---|---|---|---|
| 2017 | 51.8% | 13.3% | 3.3% | 31.6% |
| 2018 | 47.8% | 15.5% | 4.0% | 32.7% |
| 2019 | 44.6% | 17.4% | 5.2% | 32.8% |
| 2020 | 40.8% | 19.7% | 6.1% | 33.4% |
| 2021 | 38.9% | 21.1% | 7.1% | 32.9% |
| 2022 | 40.0% | 21.5% | 7.5% | 31.0% |
| 2023 | 39.0% | 23.0% | 8.2% | 29.8% |
| 2024 | 37.7% | 23.9% | 9.0% | 29.4% |
Source: Gartner, via Statista. Worldwide, 2017 to 2024. "All other vendors" is the residual after the three named vendors and includes Alibaba Group, Huawei, IBM, Rackspace and smaller providers.
Amazon shed 14.1 points of share between 2017 and 2024. Microsoft picked up 10.6 and Google 5.7. Combined, the three grew from 68.4% to 70.6% of the market, so the losses came out of the long tail as well as out of Amazon — the budget end of that tail, where providers such as Hetzner compete on price rather than on managed services, absorbed the rest. The concentration story and the Amazon-decline story are the same story.
The hyperscaler-only view
Narrowing to just the four hyperscale vendors magnifies the same trend.
AWS Has Given Up 7 Points of Hyperscaler Share Since 2020
Measured across the four hyperscale vendors, AWS held 51.3 percent of combined IaaS and PaaS spending in 2024, down from 58.3 percent in 2020 and falling in every year of the period. Microsoft Azure absorbed 8.5 points of that shift, more than AWS actually lost, with the remainder coming out of Alibaba Cloud. Google Cloud Platform gained 2.5 points to reach 9.8 percent.
Source: Wikibon · 2020-2024
| Year | AWS share of hyperscaler IaaS + PaaS market (%) |
|---|---|
| 2020 | 58.3% |
| 2021 | 57.2% |
| 2022 | 55.8% |
| 2023 | 53.6% |
| 2024 | 51.3% |
- AWS fell from 58.3% to 51.3% of hyperscaler share between 2020 and 2024
- Azure gained 8.5 points over the same period — more than AWS lost
- AWS is on track to drop below half of hyperscaler spending
| Year | AWS | Microsoft Azure | Google Cloud Platform | Alibaba Cloud |
|---|---|---|---|---|
| 2020 | 58.3% | 23.9% | 7.3% | 10.5% |
| 2021 | 57.2% | 25.0% | 8.1% | 9.7% |
| 2022 | 55.8% | 27.2% | 8.6% | 8.4% |
| 2023 | 53.6% | 29.9% | 9.1% | 7.3% |
| 2024 | 51.3% | 32.4% | 9.8% | 6.5% |
Source: Wikibon, via Statista. Worldwide, 2020 to 2024; 2024 figures are forecast. Shares are calculated across four hyperscale vendors only and therefore run higher than whole-market figures.
Azure gained 8.5 points here while AWS lost 7.0, meaning Azure took share from Alibaba as well. Google Cloud Platform's 2.5-point gain is the smallest of the two Western challengers. On this measure Google is not closing on Azure; Azure is pulling away from AWS while Google inches up from a distant third.
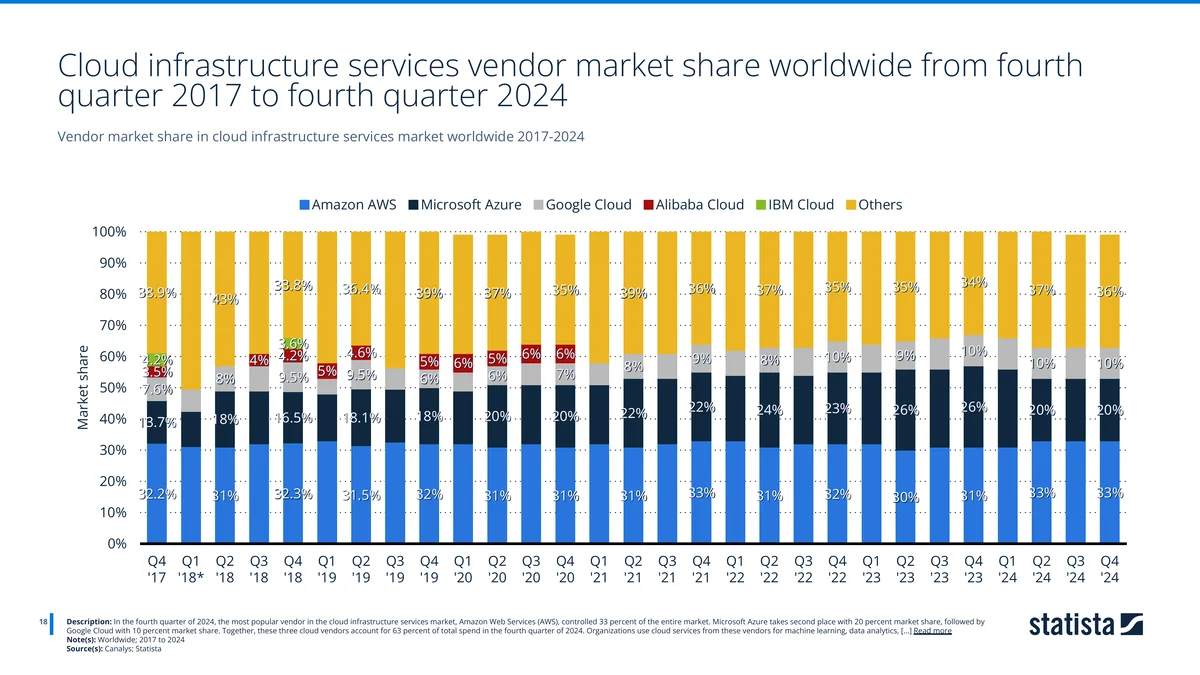
Canalys measures the same market on a quarterly basis and lands on a similar structure: in Q4 2024, AWS held 33%, Azure 20% and Google Cloud 10%, with the three together accounting for 63% of total spend. The remaining 36% to 37% sits with the long tail of all other providers, a share that has compressed steadily from 38.9% in Q4 2017.
The commitment gap
Here is the finding that reframes everything above, and the one the source dossier never states directly.
Market share tells you how spending is distributed. It does not tell you how deeply a provider is embedded in the organisations that use it. Flexera's survey of 759 cloud decision makers separates respondents by depth of usage, and Google Cloud's profile is structurally different from its competitors'.
Only 19% of Enterprises Run Significant Workloads on Google Cloud
AWS and Azure convert trial into commitment: 53 and 46 percent of cloud decision makers respectively run significant workloads on them. Google Cloud Platform reaches only 19 percent, despite being evaluated by a far larger share of the market — 27 percent run some workloads on GCP and another 20 percent are still experimenting, the highest experimentation rate of any major provider.
Source: Flexera · 2024
| Cloud provider | Share of respondents (%) |
|---|---|
| AWS | 53% |
| Microsoft Azure | 46% |
| Google Cloud Platform | 19% |
| Oracle Cloud | 9% |
| IBM Cloud | 6% |
| Alibaba Cloud | 4% |
- Only 19% of cloud decision makers run significant workloads on Google Cloud, vs 53% on AWS
- GCP has the highest experimentation rate of any provider at 20%
- 37% of GCP's usage base is still at trial or planning stage, against 11% for AWS
| Provider | Running significant workloads | Running some workloads | Experimenting | Plan to use |
|---|---|---|---|---|
| AWS | 53% | 26% | 6% | 4% |
| Microsoft Azure | 46% | 31% | 11% | 4% |
| Google Cloud Platform | 19% | 27% | 20% | 7% |
| Oracle Cloud Infrastructure | 9% | 18% | 16% | 9% |
| IBM Cloud | 6% | 11% | 14% | 10% |
| Alibaba Cloud | 4% | 9% | 8% | 3% |
Source: Flexera, via Statista. Worldwide, winter of 2024; 759 respondents; cloud decision makers. Respondents report usage depth per provider, so figures do not sum to 100% across providers.
Read the rows rather than the columns. AWS and Azure are top-heavy: most of the enterprises that touch them at all are running significant workloads. Google Cloud is bottom-heavy. Add up everyone who touches each platform and the ratios are stark:
- Google Cloud: 19% of 73 points of total engagement are significant workloads — 26%.
- Microsoft Azure: 46 of 92 — 50%.
- AWS: 53 of 89 — 60%.
For every enterprise running significant workloads on Google Cloud, roughly 2.8 more are running only some workloads, experimenting, or merely planning. On AWS that ratio is about 1 to 0.7. Google Cloud also has the highest experimentation rate of any major provider at 20%, nearly double Azure's 11% and more than triple AWS's 6%.
This is a conversion problem, not an awareness problem. Enterprises are willing to try Google Cloud in large numbers. What they do far less often is move production onto it. The 37% of Google Cloud's usage base still sitting at trial or planning stage, against 11% for AWS, is the clearest single number in this entire report.
That framing also explains the apparent contradiction between Google Cloud's 36% revenue growth and its 9% market share. The committed minority spends heavily — enough to compound revenue at a rate the market leaders cannot match — while the uncommitted majority contributes very little. If Google converts even a portion of that 47% sitting in "some workloads" and "experimenting" into production commitments, the revenue curve steepens again. If it does not, growth eventually converges on the spending of an installed base that stopped widening.
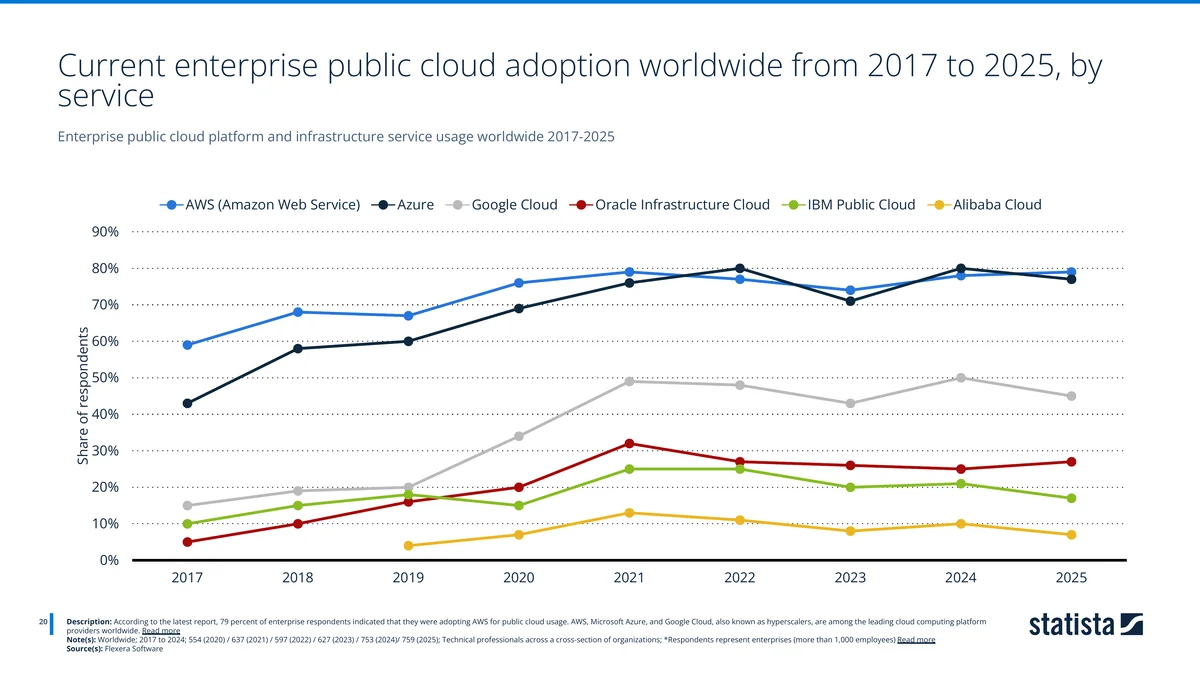
The longer adoption series supports the same reading. AWS reached 79% of enterprise respondents in 2025 with Azure tracking closely behind, while Google Cloud plateaued below both after a steep climb through 2020 and 2021. Adoption breadth stopped expanding; the depth problem shown above is what remains.
You can see how this plays out in what organisations actually run — our own cloud provider traffic share analysis measures the same three providers by share of internet bytes rather than by survey response, and the ordering is consistent.
What our own detection data adds: Google Cloud's base is the most US-concentrated
Survey panels and revenue filings both under-describe where a provider's customers actually are. Our detection data can speak to that directly, so we compared the geographic composition of the enterprise base we detect on Google Cloud against the one we detect on Microsoft Azure. Both profiles were rebuilt in August 2026 on current detection signals, and the figures below supersede an earlier version of this table.
| Rank | Google Cloud | Share of base | Microsoft Azure | Share of base |
|---|---|---|---|---|
| 1 | United States | 56.95% | United States | 36.94% |
| 2 | United Kingdom | 6.63% | United Kingdom | 13.50% |
| 3 | Brazil | 6.61% | Australia | 9.22% |
| 4 | Germany | 5.11% | Brazil | 8.35% |
| 5 | India | 4.04% | Canada | 5.71% |
| 6 | Canada | 3.82% | Netherlands | 4.99% |
| 7 | Japan | 3.61% | Germany | 3.92% |
| 8 | Australia | 3.16% | Sweden | 3.22% |
Source: TechnologyChecker.io detection data, August 2026. Shares are of each provider's own detected base across its fifteen largest markets (Google Cloud n=43,483; Microsoft Azure n=65,436 company-country records).
The United States accounts for 56.95% of Google Cloud's detected base against 36.94% of Azure's — the sharpest compositional difference between the two. Azure's footprint is markedly more internationally distributed: the United Kingdom is more than twice the share it holds on Google Cloud, Australia nearly three times, and the Netherlands and Sweden appear in Azure's top eight where neither reaches Google Cloud's.
Where Google Cloud does over-index outside the US is Asia. Japan takes 3.61% and India 4.04% of its base, and neither reaches Azure's top eight. One correction to an earlier version of this section: we previously reported Brazil as a Google Cloud strength at more than twice Azure's share. On current detection data that reverses, with Brazil at 6.61% for Google Cloud and 8.35% for Azure, so Brazil is better described as a strong market for both than as a Google Cloud differentiator.
Three caveats matter here, and they are the reason this table shows shares rather than counts. These are shares of each provider's own detected base, not market share — they say nothing about which provider is larger. The two products are identified through different technical signatures, so the honest comparison is between each provider's internal composition, not between their absolute totals. And Google Cloud's US share is partly lifted by a single large American customer whose agent network runs across thousands of separate domains; excluding that cluster still leaves US concentration close to 49%, well above Azure's, so the finding survives the control rather than depending on it.
Per-technology detail sits on the Google Cloud profile and the Microsoft Azure profile, with the PaaS category covering the wider vendor set and Amazon S3 the most-detected AWS storage primitive.
The market Google Cloud is growing into
Whatever happens to relative share, the underlying market is expanding fast enough to carry every serious vendor upward.
Public Cloud Spending Is Forecast to Reach $723 Billion in 2025
Worldwide end-user spending on public cloud services is expected to reach 723.42 billion U.S. dollars in 2025, up from 595.65 billion in 2024. The market has grown fivefold since 2017 and covers business process, platform, infrastructure, software, management, security and advertising services delivered by public cloud providers.
Source: Gartner · 2017-2025
| Year | Market size (billion U.S. dollars) |
|---|---|
| 2017 | $145B |
| 2018 | $197B |
| 2019 | $243B |
| 2020 | $314B |
| 2021 | $412.63B |
| 2022 | $478.32B |
| 2023 | $561.1B |
| 2024 | $595.65B |
| 2025 | $723.42B |
- Public cloud spending is forecast at $723.42 billion for 2025
- The market has grown roughly 5x since 2017
- 2025's forecast increase of $127.8 billion is the largest single-year jump on record
| Year | Market size (billion USD) |
|---|---|
| 2017 | $145 |
| 2018 | $197 |
| 2019 | $243 |
| 2020 | $314 |
| 2021 | $412.63 |
| 2022 | $478.32 |
| 2023 | $561.10 |
| 2024 | $595.65 |
| 2025 (forecast) | $723.42 |
Source: Gartner, via Statista. Worldwide end-user spending on public cloud services.
Worldwide end-user spending on public cloud services is forecast at $723.42 billion for 2025, roughly five times the 2017 figure. The 2025 increase of $127.8 billion is the largest single-year jump on record, and it is larger than the entire market was in 2016. The physical data centre build-out behind that spending is the constraint that decides how much of it any one vendor can actually capture.
Growth is not evenly spread across segments:
| Segment | 2023 growth | 2024 growth | 2025 growth |
|---|---|---|---|
| Cloud System Infrastructure Services (IaaS) | 19.1% | 21.3% | 24.8% |
| Cloud Application Infrastructure Services (PaaS) | 19.5% | 19.1% | 21.6% |
| Cloud Application Services (SaaS) | 18.1% | 18.1% | 19.2% |
| Cloud Desktop-as-a-Service (DaaS) | 11.4% | 7.7% | 11.1% |
| Total market | 17.3% | 19.2% | 21.5% |
Source: Gartner and Statista. Worldwide, 2024.
IaaS is both the largest growth rate and the accelerating one, forecast at 24.8% for 2025 against 21.3% in 2024. That is the segment where Google holds 9.0% share, which means the pool it competes for is growing faster than the pool where it is weakest.
PaaS Spending Grew 52x in a Decade to $209 Billion
Worldwide spending on platform as a service is forecast to reach 208.64 billion U.S. dollars in 2025, up from just 4 billion in 2015. PaaS is the fastest-growing of the three public cloud segments and has effectively caught infrastructure as a service, which is forecast at 211.86 billion for the same year.
Source: Gartner · 2015-2025
| Year | Spending (billion U.S. dollars) |
|---|---|
| 2015 | $4B |
| 2016 | $9B |
| 2017 | $12B |
| 2018 | $26B |
| 2019 | $38B |
| 2020 | $59B |
| 2021 | $89.9B |
| 2022 | $119.58B |
| 2023 | $142.93B |
| 2024 | $171.57B |
| 2025 | $208.64B |
- PaaS spending is forecast at $208.64 billion in 2025, up 52x from 2015
- PaaS is now effectively tied with IaaS, forecast at $211.86 billion
- The segment is forecast to grow 21.6% in 2025
The platform layer has been the decade's real growth story. PaaS spending grew from $4 billion in 2015 to a forecast $208.64 billion in 2025, a 52-fold increase that has brought it level with infrastructure as a service:
| Segment (billion USD) | 2015 | 2018 | 2021 | 2023 | 2025 (f) |
|---|---|---|---|---|---|
| SaaS | 31.4 | 85.7 | 146.33 | 206.0 | 299.07 |
| IaaS | 16 | 32 | 90.89 | 143.3 | 211.86 |
| PaaS | 4 | 26 | 89.9 | 142.93 | 208.64 |
Source: Gartner, via Statista. Worldwide, 2015 to 2024, with 2025 forecast.
PaaS actually overtook IaaS in both 2022 and 2024 before falling marginally behind again in the 2025 forecast. The two segments are now effectively tied, where a decade ago IaaS was four times larger. For Google Cloud this matters because its differentiated products — BigQuery, Vertex AI, Cloud Run — sit in the PaaS layer rather than in raw compute, which is the part of the market where AWS's scale advantage is hardest to overcome. It is also where the competition is most direct: AWS Lambda is the serverless primitive Cloud Run is measured against, one service inside the broader AWS footprint.
Multi-cloud is the default, and it works in Google's favour
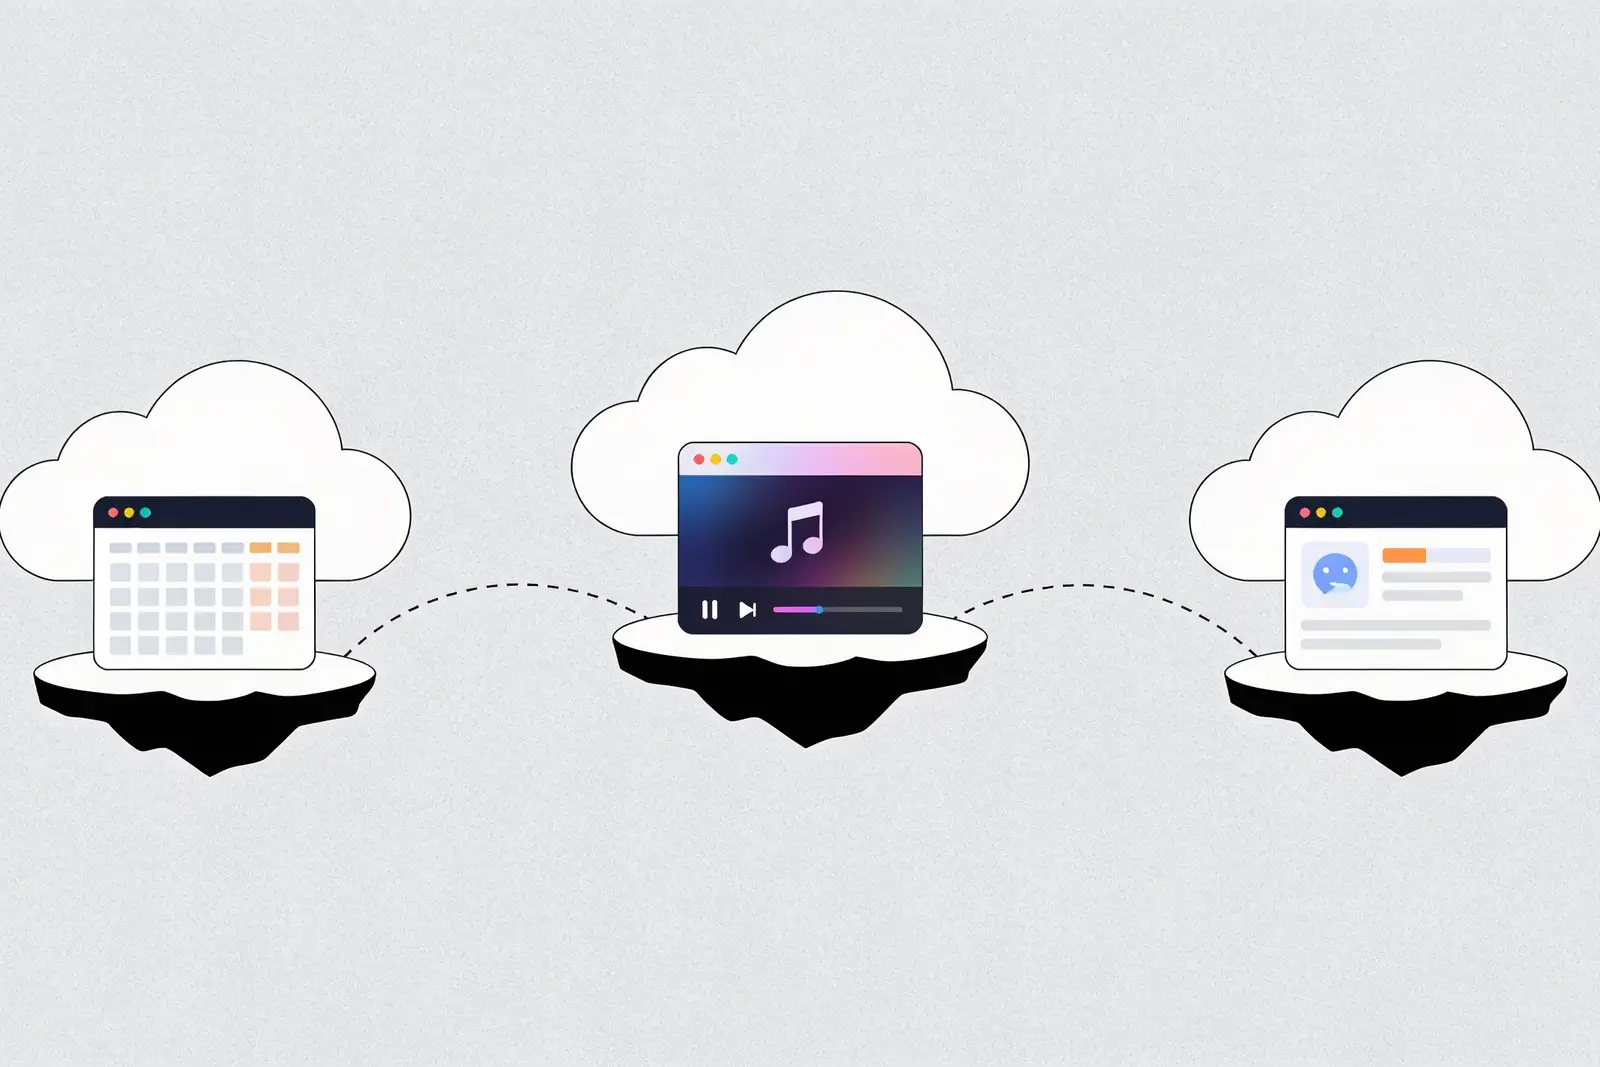
The commitment gap looks less damaging once you account for how enterprises actually buy cloud. Very few pick one provider.
| Multi-cloud architecture pattern | Share of respondents |
|---|---|
| Separate apps siloed in separate clouds | 59% |
| Disaster recovery / failover between clouds | 51% |
| Workload mobility, moving apps and containers between clouds | 43% |
| Data used between clouds | 36% |
| Individual apps span public and private clouds | 35% |
| Workload bursting | 30% |
| Intelligent workload placement | 24% |
Source: Flexera, via Statista. Worldwide, 2025; 753 respondents; technical professionals and executive leaders.
The dominant pattern by a wide margin is separate applications siloed in separate clouds, at 59%. That is precisely the shape of adoption that produces a large population of "running some workloads" responses. An enterprise can run its data warehouse on BigQuery and everything else on AWS, and it will report exactly what the Flexera data shows: some workloads on Google Cloud, significant workloads on AWS.
Supporting tooling has grown up around this:
| Multi-cloud tool category | All organizations | Large enterprises |
|---|---|---|
| Security tools | 55% | 59% |
| Cost optimization (FinOps) tools | 53% | 57% |
| Management tools | 47% | 53% |
| Governance tools | 46% | 50% |
Source: Flexera, via Statista. Worldwide, 2024; 759 respondents; cloud decision makers.
Large enterprises run ahead of the overall population on every tool category, which is consistent with them operating the most complex multi-cloud estates.
Private cloud and hybrid
Google's position in private and hybrid cloud is considerably weaker than in public cloud.
| Private cloud platform | Currently use | Experimenting | Plan to use |
|---|---|---|---|
| Microsoft Azure Stack | 38% | 20% | 8% |
| VMware vSphere/vCenter | 36% | 16% | 8% |
| Microsoft System Center | 32% | 15% | 12% |
| AWS Outposts | 29% | 19% | 8% |
| VMware vCloud Director | 20% | 20% | 8% |
| Google Anthos | 18% | 18% | 8% |
| OpenStack | 15% | 16% | 10% |
| Bare-metal cloud | 13% | 14% | 9% |
Source: Flexera, via Statista. Worldwide, 2024; 753 respondents; technical professionals.
Google Anthos sits sixth at 18% current usage, behind both Microsoft private cloud products and AWS Outposts. Given that hybrid deployments are often the on-ramp to a full public cloud migration for regulated industries, this is a structural disadvantage rather than a cosmetic one.
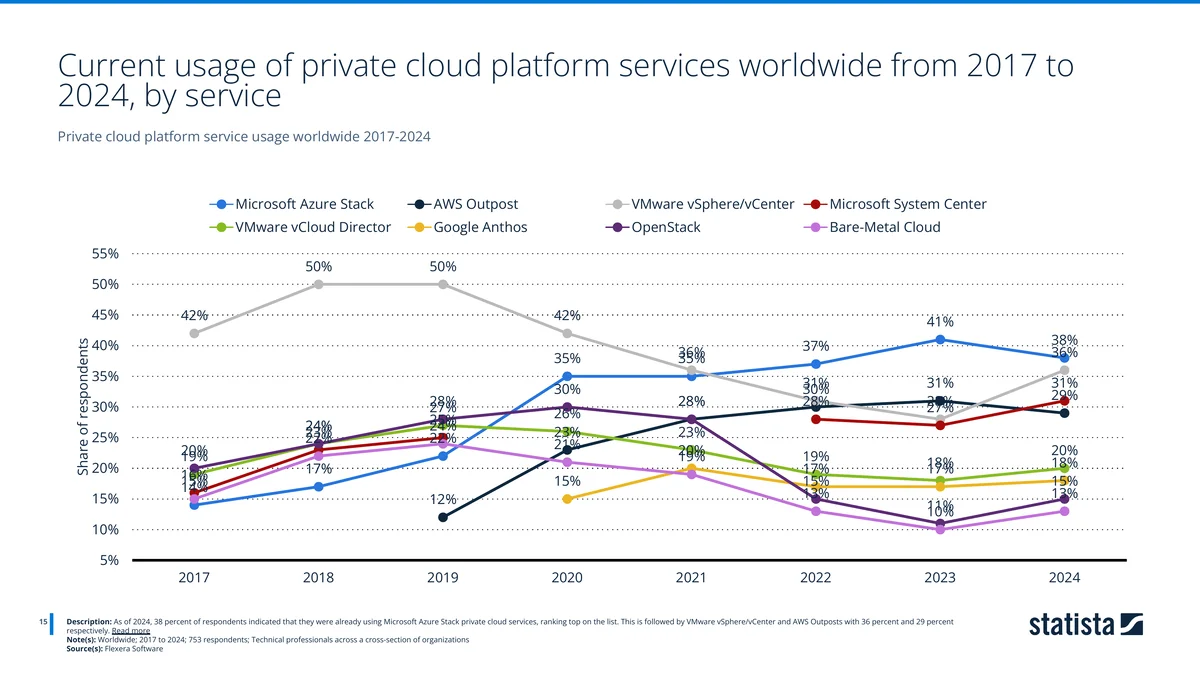
The longer series shows VMware vSphere/vCenter falling from a 50% peak in 2018 and 2019 to 36% in 2024, with Microsoft Azure Stack overtaking it. Google Anthos only enters the series in 2019 and has been broadly flat at 15% to 19% since.
What services enterprises actually consume
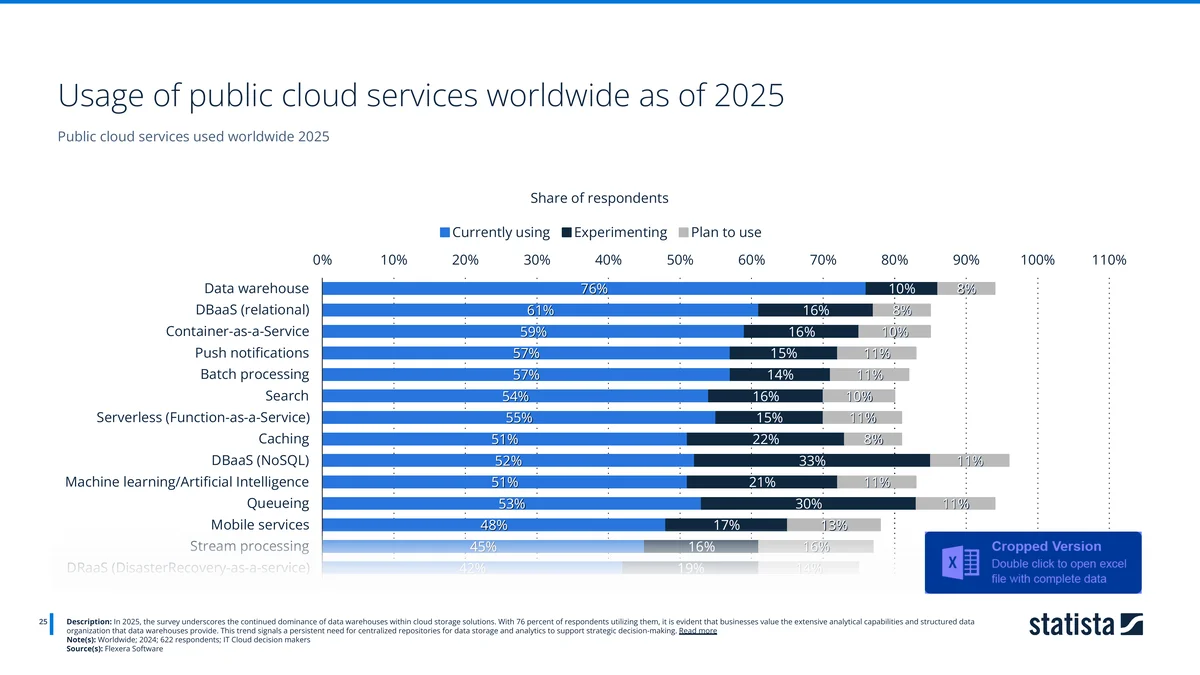
Data warehousing leads public cloud service consumption at 76% of respondents currently using it, well ahead of relational database-as-a-service at 61% and container-as-a-service at 59%. Machine learning and AI sits at 51% currently using with a further 21% experimenting.
That top line is the most favourable data point in this report for Google Cloud. BigQuery is widely regarded as Google's strongest enterprise product, and the single most-consumed cloud service category is the one where it competes best. Note that this chart is a cropped excerpt in the source dossier, with the final rows partially obscured, so the figures below stream processing should be treated as indicative.
Google Cloud Marketplace
The marketplace is a reasonable proxy for ecosystem depth, and its composition says something unexpected about Google Cloud's positioning.

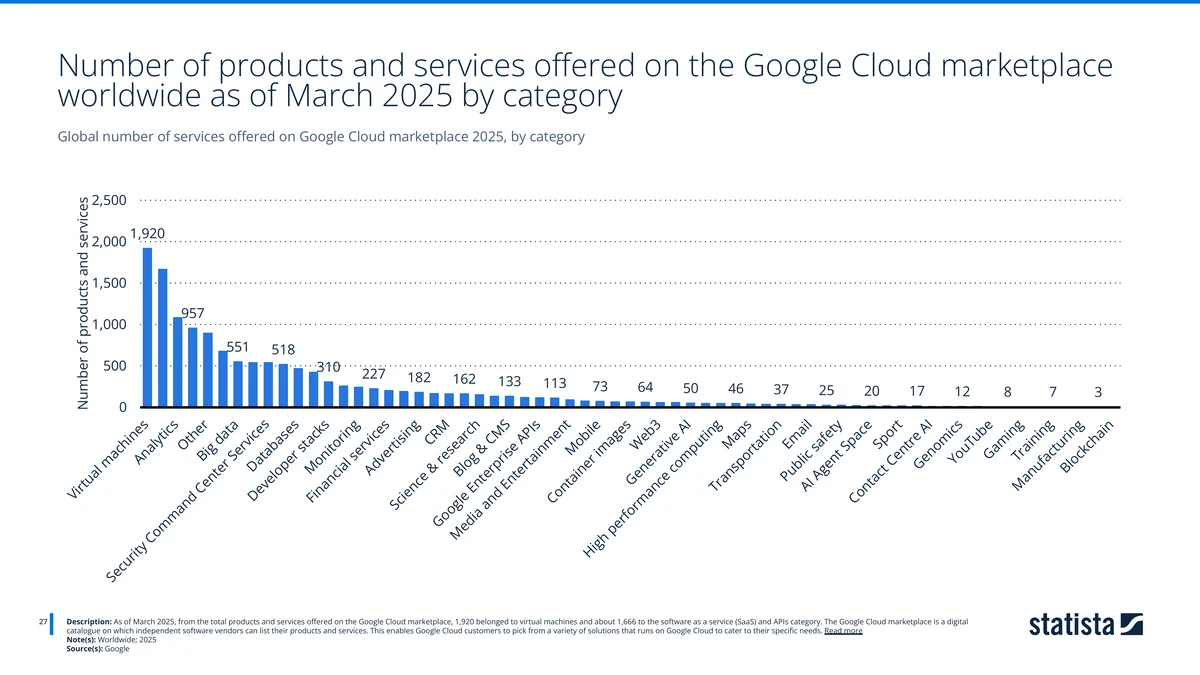
As of March 2025, virtual machines were the largest category at 1,920 products, with software as a service and APIs accounting for roughly 1,666. The long tail runs down through analytics, big data, security, databases and developer stacks to categories in single digits.
The notable absence is AI. Generative AI listings number 46, with AI Agent Space at 20 and Contact Centre AI at 12. For a company whose entire enterprise pitch is built on AI leadership, a marketplace still overwhelmingly composed of virtual machine images points to an ecosystem shaped by lift-and-shift migration rather than by AI-native workloads. Partner catalogues lag product strategy, but the gap here is wide — and it is widening against a backdrop where AI spending is growing faster than any other software category.
Breaking down the largest sub-categories:
| Developer tools by type | Count |
|---|---|
| Virtual machines | 1,051 |
| SaaS & APIs | 282 |
| Kubernetes apps | 35 |
| Container images | 22 |
| Google Cloud Platform | 16 |
| Data | 2 |
| Vertex AI | 1 |
| Professional Services | 1 |
| Total | 1,410 |
| Security solutions by type | Count |
|---|---|
| Virtual machines | 403 |
| SaaS & APIs | 357 |
| Kubernetes apps | 16 |
| Google Cloud Platform | 6 |
| Container images | 4 |
| Data | 3 |
| Total | 789 |
| Financial services solutions by type | Count |
|---|---|
| SaaS & APIs | 203 |
| Data | 71 |
| Virtual machines | 30 |
| Kubernetes apps | 9 |
| Container images | 4 |
| Total | 317 |
| Database solutions by type | Count |
|---|---|
| Virtual machines | 460 |
| SaaS & APIs | 192 |
| Kubernetes apps | 23 |
| Container images | 15 |
| Data | 12 |
| Google Cloud Platform | 9 |
Source: Google, via Statista. Worldwide, March 2025.
One data-quality note on the last table: the source dossier's own summary text for the database chart cites a total of 346 solutions with 149 virtual machines and 127 SaaS and APIs, which contradicts the values printed on the chart itself. We have reproduced the charted figures and are not quoting a total for that category.
Vertex AI appearing exactly once in a catalogue of 1,410 developer tools is the same signal as the 46 generative AI listings, from a different angle. The financial services breakdown is the healthiest of the four, being the only one led by SaaS and APIs rather than by virtual machine images, which suggests the regulated-industry partner motion is further along than the general developer one.
About the author
Emma Davies is a Data Analyst at TechnologyChecker with five years of experience turning technographic detection data into prospect intelligence. She holds a BSc in Data Science from Cardiff University, the Google Data Analytics Professional Certificate, and the Tableau Desktop Certified Associate qualification, and works daily on technology adoption patterns across millions of domains. Read more of her work at emmadavies.uk.
I want to be specific about what I did here, because "we analysed the data" is the kind of claim anyone can make.
I read all 33 pages of the source dossier rather than working from its summary, and that is what surfaced the three corrections in this report. Two of them I would have missed if I had trusted the prose: the segment-distribution caption cites 77.8% and 10.8%, which look entirely reasonable until you recompute them from the table on the previous page and find they are the 2023 column, not 2024. The third took reading a URL slug — a chart titled "total revenue 2025" whose own readMoreUrl ends in fiscal-quarter-global.
Before quoting a single figure I cross-checked the transcription against itself: the 24 quarterly bars for 2020 to 2025 sum to $58.70 billion against an annual chart printing $58,705 million, and 2024's four quarters to $43.23 billion against $43,229 million. When the 2026 numbers arrived from trade press rather than a filing, I ran the same test — $24.8B against Q2 2025's $13.62B gives exactly the +82% Alphabet reported — and only then published them.
The conversion-rate framing that runs through this report is mine, and it is arithmetic rather than a survey result: Flexera publishes workload depth per provider and never divides it, so I did. I have also left the most-cited number in this piece flagged as ageing, because the Flexera fieldwork behind 19% and 53% ran in winter 2024 and nobody has re-run it since Google Cloud's growth doubled. I would rather say that plainly than let a two-year-old survey carry a 2026 headline.
The country comparison is the one section drawn from our own detection data. I deliberately published it as share-of-base rather than raw counts: we detect Google Cloud on far more domains than Azure, but the two are identified through different technical signatures, so the totals are not comparable and only the internal composition is. Reporting the 12:1 gap as a finding would have been the easier and more flattering choice, and it would have been wrong.
Methodology
Scope
Worldwide, covering 2015 to Q2 2026. The report combines three bodies of evidence: company financials as reported by Alphabet, third-party market-sizing and survey data from named research firms, and TechnologyChecker.io's own technology detection data. Every figure carries the year or quarter it describes, because the series in this report end at different dates — a point that matters more than usual here, since the financial data runs to Q2 2026 while the workload-depth survey stops in winter 2024.
Source table
| Source | What it provides | Period covered |
|---|---|---|
| Alphabet | Google Cloud segment revenue (annual and quarterly), operating income, backlog, Alphabet segment breakdown | 2017 – Q2 2026 |
| Gartner | Public cloud market sizing, segment forecasts, worldwide IaaS vendor share | 2015 – 2025 |
| Flexera | Enterprise adoption, workload depth, private cloud usage, multi-cloud patterns (753–759 respondents) | 2017 – 2025 |
| Wikibon | Hyperscaler IaaS and PaaS market share | 2020 – 2024 |
| Synergy Research Group | Cloud infrastructure spend and vendor share | Q1 – Q2 2026 |
| Canalys | Quarterly cloud infrastructure services vendor share | Q4 2017 – Q4 2024 |
| Google Cloud Marketplace product counts | March 2025 | |
| TechnologyChecker.io | Detected enterprise base by country for Google Cloud and Microsoft Azure | August 2026 |
Figures for 2015–2025 were compiled from a Statista company dossier assembled in July 2026 that aggregates the named research firms above; attribution throughout is to those primary sources rather than to the aggregator. The Q1 and Q2 2026 financial and share figures were added in the August 2026 update from Alphabet's reported results and Synergy Research Group, corroborated across multiple trade publications.
How the charts were built
Where a source chart labelled every data point, we rebuilt it as an interactive chart. Where it labelled only some points, we reproduced the exact printed values in a markdown table instead, rather than reading intermediate values off an unlabelled axis. No value in this report was estimated from a chart's gridlines.
Transcription was cross-validated by reconciling independent series against one another: the 24 quarterly revenue bars for 2020–2025 sum to $58.70 billion against an annual chart reporting $58,705 million, and the 2024 quarters sum to $43.23 billion against $43,229 million. The 2026 figures reconcile the same way against the 2025 quarterly base — $24.8B against Q2 2025's $13.62B gives exactly the +82% Alphabet reported.
Limitations
- The workload-depth survey predates the AI surge. Flexera's fieldwork ran in winter 2024. The commitment-gap finding is the most important in this report and is also its oldest data. It has not been re-measured since Google Cloud's growth accelerated.
- Alphabet's segment is not like-for-like with AWS. Google Cloud as reported bundles Google Cloud Platform infrastructure with Google Workspace subscriptions. AWS reports infrastructure only. Segment revenue comparisons between them overstate GCP's infrastructure business.
- Market-share series disagree because they measure different universes. Gartner's IaaS-only share puts Google at 9.0% for 2024; Wikibon's four-hyperscaler-only share puts it at 9.8%; Synergy's whole-infrastructure share puts it at 13% for Q1 2026. These are not contradictions and should not be compared directly.
- One widely reproduced ranking is quarterly, not annual. The "top 10 cloud vendors by total revenue 2025" table reports a fiscal quarter and mixes measurement bases across vendors.
- The UBS revenue-concentration figure is an estimate, not a reported number, and is labelled as such where it appears.
- Our detection data measures composition, not size. Country shares describe each provider's own detected base. Because the two products are identified through different technical signatures, absolute counts are not comparable between them.
Corrections made to source material
Two errors in the source dossier were identified during this analysis and corrected rather than reproduced. Its caption for the Google segment-distribution chart cites 77.8% advertising and 10.8% cloud; both figures reconcile exactly to the 2023 column of the segment table on the previous page, so 2024 was recomputed from the labelled data to 76.0% and 12.4%. Its caption for the database-marketplace chart claims a total of 346 solutions against bar labels summing to 711; the charted values are reproduced and no total is quoted.
Frequently asked questions
What is Google Cloud's market share in 2026?
Google Cloud held 14% of global cloud infrastructure services spend in Q1 2026 and 15% in Q2 2026, according to Synergy Research Group, up from 10% in Q4 2024. In Q2 2026 AWS held 28% and Microsoft Azure 20%. On Gartner's narrower IaaS-only measure, Google's share was 9.0% for 2024. The figures differ because they measure different market definitions, not because either is wrong.
How much revenue does Google Cloud make?
Google Cloud generated $24.8 billion in Q2 2026, an annual run rate of roughly $99 billion. For full-year 2025 it reported $58.7 billion, up 35.8% on 2024's $43.2 billion. Alphabet's Google Cloud segment includes Google Workspace as well as Google Cloud Platform.
Is Google Cloud growing faster than AWS?
Yes, but by less than it appears. Google Cloud grew 82% year over year in Q2 2026 against 37% for AWS — AWS's own fastest rate since early 2022, not the ~19% it was posting a year earlier. In absolute dollars AWS remains far larger, and it added $21.17 billion of revenue across 2025 against Google Cloud's $15.48 billion, so faster percentage growth from a smaller base has narrowed the gap only gradually — AWS's share fell from 33% to 30% while Google's rose from 10% to 13%. Full detail in our AWS statistics report.
Why do fewer enterprises run significant workloads on Google Cloud?
Only 19% of cloud decision makers run significant workloads on Google Cloud against 53% on AWS, while 20% are still experimenting — the highest experimentation rate of any major provider. The pattern suggests strong consideration converting weakly into production commitments, rather than weak awareness. The most common multi-cloud architecture is separate applications siloed in separate clouds, which is exactly the shape that produces "some workloads" answers.
How many AI products are on the Google Cloud Marketplace?
As of March 2025 the marketplace listed 46 generative AI products, 20 in AI Agent Space and 12 for Contact Centre AI, against 1,920 virtual machine products. Vertex AI appeared once in a catalogue of 1,410 developer tools.
What to watch
Google Cloud's numbers point in two directions at once, and both are true. Revenue is compounding at 82% year over year on a $99 billion run rate, the segment has never had a down quarter in six years, share has moved from 10% to 13% of infrastructure spend, and Google is the only top-three vendor to have gained IaaS share in every year since 2017. Against that, it converts trial into production at roughly 26% where AWS manages 60%, its adoption breadth stopped widening around 2022, and its marketplace is still built around virtual machine images rather than the AI workloads its strategy is premised on.
The 2026 surge does not resolve that tension — it sharpens it. A $514 billion backlog against a $99 billion run rate, and a credible analyst estimate that a quarter of this year's revenue comes from two AI labs, both describe depth among a few customers rather than breadth across many. That is a fine business. It is a different business from the one the revenue headline implies, and it carries a concentration risk the headline hides.
The number that will settle it is still the significant-workload share. If Google Cloud's 19% starts moving toward Azure's 46%, the revenue curve has years of room left, because the same customers are already on the platform and merely under-committed. If that figure stays flat while experimentation stays at 20%, Google Cloud becomes what the data currently describes: the specialist second or third cloud that almost everyone tries, many keep for one or two workloads, and comparatively few standardise on — now with an enormous AI-infrastructure business bolted to the side of it.
Watch the ratio, not the revenue.

Data Analyst
5+ years of experience
Emma is a Data Analyst at TechnologyChecker, where she analyses technology adoption data to build better prospect lists and uncover actionable patterns for sales teams.
- BSc Data Science, Cardiff University
- Google Data Analytics Professional Certificate
- Tableau Desktop Certified Associate
Never miss our research