Google vs Microsoft Market Share Q3 2026: Which Is Bigger?
Google sent 89% of search referrals and Chrome carried 71% of web requests in Q3 2026. Microsoft 365 leads Google Workspace by 158,098 domains.
Published •Updated •Data through September 2026•36 min read

Google is bigger on the public web, Microsoft is bigger at work, and Q3 2026 widened the lead on each side. Google sent 89.04% of the search referrals Cloudflare Radar observed in Q3 2026 against Bing's 3.22%, and Chrome carried 70.80% of web requests against Edge's 6.44%. Microsoft 365 runs on 158,098 more domains than Google Workspace in our September 2026 crawl. The one layer that keeps changing hands, Windows against Android, now depends on whether you count bots.
Updated 1 October 2026 with Q3 2026 data (July to September 2026; September is provisional). The August 2026 first edition follows the Q3 sections, with notes where the quarter changes it, and its original lead is preserved in the update history.

That split is the whole finding. Google owns the layers a consumer touches: the search box, the browser window, the ad slot. Microsoft owns the layers an IT department buys: the mailbox, the cloud subscription, the desktop. Ask "who is bigger" and you get a useless answer. Ask "who is bigger at this layer" and every answer changes.
I'm a data analyst at TechnologyChecker, and I spend most of my week inside technographic detection data, working out which products are running on which domains right now. For this post we measured seven contested layers on two instruments we control: the Cloudflare Radar API (full-month August 2026 in the first edition, the whole of Q3 2026 and every month of 2026 in this one) and our own detection corpus of roughly 29.9 million live domains. The only figures from outside those two instruments are each company's annual revenue and net income, taken from their 10-K filings because so many readers arrive asking which company is bigger. Nothing here comes from a survey panel or an analyst firm.
Is Google bigger than Microsoft?
Google is bigger on the web and Microsoft is bigger at work. In Q3 2026 Google sent 89.04% of search referrals and Chrome carried 70.80% of web requests, according to Cloudflare Radar, while TechnologyChecker detects Microsoft 365 on 3,978,273 domains against Google Workspace's 3,820,175. As companies, Alphabet books more revenue and Microsoft keeps slightly more profit.
| Measure | Google (Alphabet) | Microsoft | Period | Source |
|---|---|---|---|---|
| Search referral share | 89.04% | 3.22% (Bing) | Q3 2026 | Cloudflare Radar |
| Browser share of web requests | 70.80% (Chrome) | 6.44% (Edge) | Q3 2026 | Cloudflare Radar |
| Domains running the business email suite | 3,820,175 (Workspace) | 3,978,273 (Microsoft 365) | September 2026 crawl | TechnologyChecker |
| Annual revenue | $402.8 billion | $331.8 billion | Alphabet: 2025; Microsoft: year to 30 June 2026 | Form 10-K filings |
| Annual net income | $132.2 billion | $133.7 billion | Alphabet: 2025; Microsoft: year to 30 June 2026 | Form 10-K filings |
The two fiscal years end six months apart, so the last two rows set Alphabet's calendar 2025 against Microsoft's year to June 2026. Alphabet's revenue lead is $71.0 billion. Microsoft's net income edge is $1.5 billion, and Alphabet's figure includes $29.8 billion of other income. On margin, Microsoft kept 40.3 cents of each revenue dollar and Alphabet 32.8 cents. Sources: Alphabet's Form 10-K for 2025 and Microsoft's Form 10-K for fiscal 2026.
I'd answer the question the way this page is built: pick the layer first. On the layers we measure, the answer flips depending on whether the buyer is a consumer or an IT department, and on the filings it flips between revenue and profit.
Q3 2026 analysis: Google widened the web lead, and the OS contest became a question of who you count
Quarter against quarter, Google gained on every consumer layer and Microsoft held its ground on the business ones. The table sets Q3 2026 against the quarter before and the same quarter a year earlier.
| Layer | Q3 2025 | Q2 2026 | Q3 2026 | Q3 vs Q2 |
|---|---|---|---|---|
Search referrals, Google (google.*) |
81.10% | 87.90% | 89.04% | +1.14 pts |
| Search referrals, Bing | 2.61% | 3.36% | 3.22% | -0.14 pts |
| Browser, Chrome | 68.82% | 70.22% | 70.80% | +0.58 pts |
| Browser, Edge | 5.95% | 6.07% | 6.44% | +0.37 pts |
| OS, Windows (all requests) | 33.09% | 34.60% | 35.11% | +0.51 pts |
| OS, Android + ChromeOS (all requests) | 36.09% | 35.69% | 34.15% | -1.54 pts |
| OS, Windows (human requests) | 32.01% | 32.93% | 33.32% | +0.39 pts |
| OS, Android + ChromeOS (human requests) | 36.36% | 37.00% | 36.36% | -0.64 pts |
| Crawler share, Google | 38.29% | 30.08% | 26.91% | -3.17 pts |
| Crawler share, Microsoft | 6.95% | 5.32% | 5.33% | +0.01 pts |
| Pages crawled per referral, Google | 4.83 | 5.05 | 4.88 | -0.17 |
| Pages crawled per referral, Microsoft | 41.08 | 33.25 | 37.46 | +4.21 |
Source: Cloudflare Radar, radar/bots/crawlers/summary/referer, http/summary/browser_family, http/summary/os, bots/summary/bot_operator and bots/crawlers/summary/crawl_refer_ratio, calendar quarters, pulled 2026-10-01. Q3 2026 is provisional.
I read Q3 as two different stories. On the consumer layers Google pulled further ahead: more referrals, more browser share, and a crawl-to-refer ratio that stayed under five pages per visit while Microsoft's rose to 37.46. On the contested OS layer, the headline now depends on the population, which the first edition didn't spell out.
In September I flagged two things to watch. I said the operating-system lead was likely to move, and it did, toward Windows on all requests. I also suspected the searches behind this page were about company size rather than platform share. Google's results for the query lead with a thread about Microsoft's market value, which is why this edition opens with the revenue and profit comparison.
Did Windows overtake Android? Only on one count
Counted across all requests, Windows led Android plus ChromeOS by 0.96 points in Q3 2026, after trailing by 3.00 points a year earlier. Counted across human requests only, Android plus ChromeOS led by 3.04 points. Bots mostly present as desktop clients (our bot traffic report tracks that split), so adding them to the denominator moves the lead toward Windows.
September complicates it. From the week of 7 September, Windows gained about four points and Android lost three to four points in both populations, while the human split between mobile and desktop stayed flat at 54% mobile. Windows is a desktop OS and Android a mobile one, so a real switch would have moved that split. It didn't. I don't read September as people changing platforms, and I won't call a winner on it until October's data shows whether the step holds.
2026 month by month: referrals, browsers and the OS gap
| Month (2026) | Google search referrals | Bing search referrals | Chrome, share of requests | Windows lead over Android + ChromeOS, all requests | Same lead, human requests |
|---|---|---|---|---|---|
| January | 81.69% | 2.73% | 69.88% | -4.30 pts | -6.72 pts |
| February | 84.79% | 3.13% | 70.04% | -2.80 pts | -5.06 pts |
| March | 87.66% | 3.55% | 70.08% | -1.59 pts | -3.97 pts |
| April | 87.22% | 3.54% | 70.36% | -0.50 pts | -3.13 pts |
| May | 87.93% | 3.36% | 69.82% | -1.37 pts | -4.36 pts |
| June | 88.51% | 3.24% | 70.55% | -0.55 pts | -3.71 pts |
| July | 88.08% | 3.20% | 70.68% | -1.28 pts | -5.17 pts |
| August (provisional) | 88.55% | 3.53% | 70.50% | +0.01 pts | -4.18 pts |
| September (provisional) | 90.51% | 2.98% | 71.13% | +4.35 pts | +0.70 pts |
| January to September | +8.82 pts | +0.25 pts | +1.25 pts | +8.65 pts | +7.42 pts |
Source: Cloudflare Radar, calendar months, pulled 2026-10-01. Half of the year's move toward Windows on all requests (4.34 of 8.65 points) happened in September alone.
google.* folds Gemini in with Search. Most of Google's rise from January to March is Cloudflare reclassifying TikTok link-outs (TikTok fell from 10.47% to 3.43% of referrals), not people switching search engines.By industry: who runs Microsoft 365, and who runs Google Workspace
Domain counts say Microsoft 365 is ahead. Industry says who each suite's customers are. We matched the live domains running each suite to company records and set each industry's share against its share of every matched domain we crawl.
| Industry | Share of all matched domains | Microsoft 365 (× base rate) | Google Workspace (× base rate) |
|---|---|---|---|
| Construction | 4.18% | 5.99% (1.43×) | 2.90% (0.69×) |
| Financial Services | 1.87% | 2.81% (1.50×) | under 2.11% (under 1.13×) |
| Real Estate | 2.89% | 3.34% (1.16×) | 2.88% (1.00×) |
| IT Services and IT Consulting | 3.70% | 4.48% (1.21×) | 3.66% (0.99×) |
| Software Development | 2.58% | 2.08% (0.81×) | 3.55% (1.38×) |
| Advertising Services | 2.91% | 1.85% (0.64×) | 4.55% (1.56×) |
| Technology, Information and Internet | 2.13% | under 1.74% (under 0.82×) | 2.90% (1.36×) |
| Non-profit Organizations | 1.47% | under 1.74% (under 1.19×) | 2.12% (1.45×) |
Industry figures cover the domains we could match to a company record: 2,672,970 for Microsoft 365 and 2,358,769 for Google Workspace, out of 13,077,501 matched domains across the whole crawl (1 October 2026). They're shares of matched domains, not counts of companies or seats. "Under" marks an industry outside that suite's top ten.
Counts are not a like-for-like series over time: the set of domains we crawl turns over every month, with dead sites dropping out and newly discovered ones added, and our detection signals widen over time.
I read this as two different buyer profiles rather than one market split down the middle. Microsoft 365 over-indexes in financial services (1.50×) and construction (1.43×). Google Workspace over-indexes in advertising (1.56×), non-profits (1.45×) and software development (1.38×). The domain race between the two suites is really two markets counted together, which is why a 4% gap in total domains says little about any single industry.
Google vs Microsoft market share in 2026: the seven-layer scoreboard (August 2026)
This scoreboard is the August 2026 first edition. The Q3 2026 quarter view is above.
Seven layers put a Google product directly against a Microsoft product on the same instrument. Google wins four of them, Microsoft wins three, and two of Microsoft's three are close enough that they only surface if you actually measure them. Here is the full scoreboard, with the measurement basis stated for every row.
| Layer | Microsoft | Winner | Measured as | |
|---|---|---|---|---|
| Search referrals | google.* 88.55% |
bing.com 3.53% |
Google, 25.1x | Share of referrals, Aug 2026 |
| Browser | Chrome 70.50% | Edge 6.78% | Google, 10.4x | Share of HTTP requests, Aug 2026 |
| Web crawling | 26.58% | 5.09% | Google, 5.2x | Share of bot requests, Aug 2026 |
| Advertising network | AdSense 677,940 | Microsoft Advertising 344,173 | Google, 1.97x | Domains detected, 2026-08-31 / 2026-09-04 |
| Operating system | Android + ChromeOS 34.62% | Windows 34.63% | Microsoft, 0.013 points | Share of HTTP requests, Aug 2026 |
| Business email | Workspace 3,631,520 | Microsoft 365 3,748,862 | Microsoft, 117,342 domains | Domains detected, 2026-08-10 |
| Cloud platform (PaaS) | Google Cloud 102,535 | Azure 175,651 | Microsoft, 1.71x | Domains detected, 2026-08-25 / 2026-08-24 |
Read the right-hand column before you read anything else. Three different denominators are stacked in that table and they do not blend. Percentage of referrals, percentage of HTTP requests, and count of domains answer three different questions, and averaging them would produce a number that means nothing.
Two layers where there is no contest at all
Two more layers belong on the record but not in the scoreboard, because Microsoft either fields nothing or fields something from a different category.
Tag management is a walkover. TechnologyChecker detected Google Tag Manager on 10,584,793 domains as of 2026-08-04, which is 98.51% of the tag management category. Microsoft ships no competing tag manager. That 98.51% is the single most lopsided figure we hold on either company.
Analytics is product versus product, not category versus category. We detected Google Analytics on 10,942,935 domains (2026-09-04) and Microsoft Clarity on 862,512 (2026-08-27), a 12.7x gap. Those two sit in different categories (web analytics and heatmaps/session recording), so this is a comparison of installed footprints, and it is not a share of one market. Clarity leads its own category outright.
Who wins search referrals: Google 88.55% vs Bing 3.53%
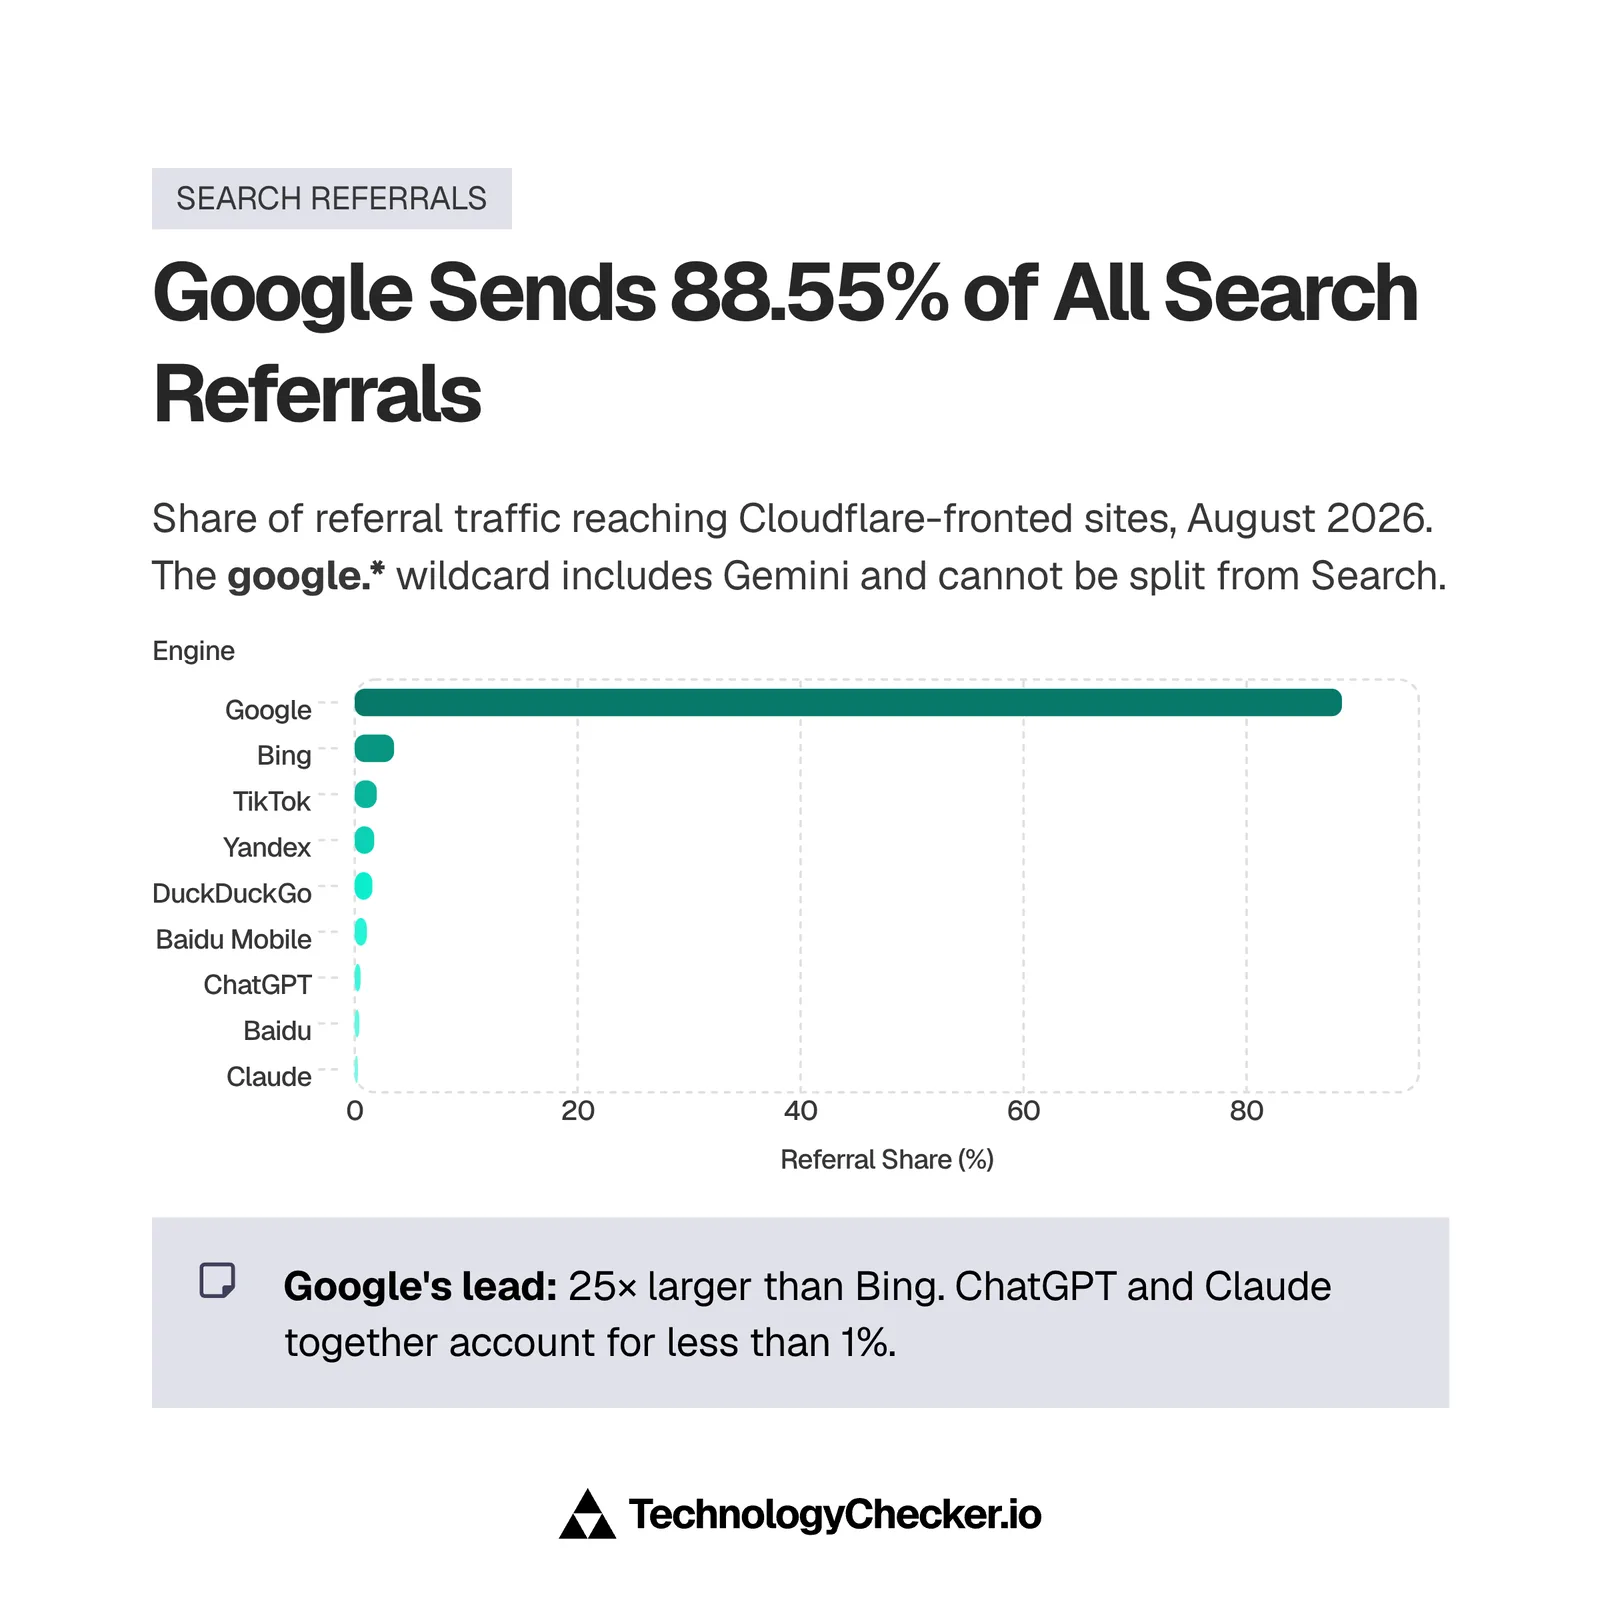
Google sent 88.55% of the search referrals Cloudflare Radar observed in August 2026. Bing sent 3.53%. That's a 25.1x gap, and it is the least surprising row on the scoreboard. If you want the full monthly series, the vertical splits, and where AI assistants sit, our search engine market share report is the deeper source and gets updated every month. This post treats search as one row of seven.
Two limits on that number, both of which matter more than the number itself.
First, google.* is a wildcard. It folds Gemini referrals in with Search, and Radar gives no way to split them, so the 88.55% is Google-the-referrer rather than Google-Search-the-product.
Second, we cannot cut this by country. Radar's referrer endpoint silently ignores a location= filter: Germany, Russia and an unfiltered global pull return byte-identical numbers. Any per-country search share you see quoted from this endpoint is not real.
For contrast, Digital Applied puts Bing's structural ceiling at 5-6% globally "without a Windows-level distribution event." Our referral read of 3.53% sits below even that ceiling. Microsoft owns the desktop and still cannot convert it into search referrals.
Chrome vs Edge: the browser layer is a 10-to-1 blowout
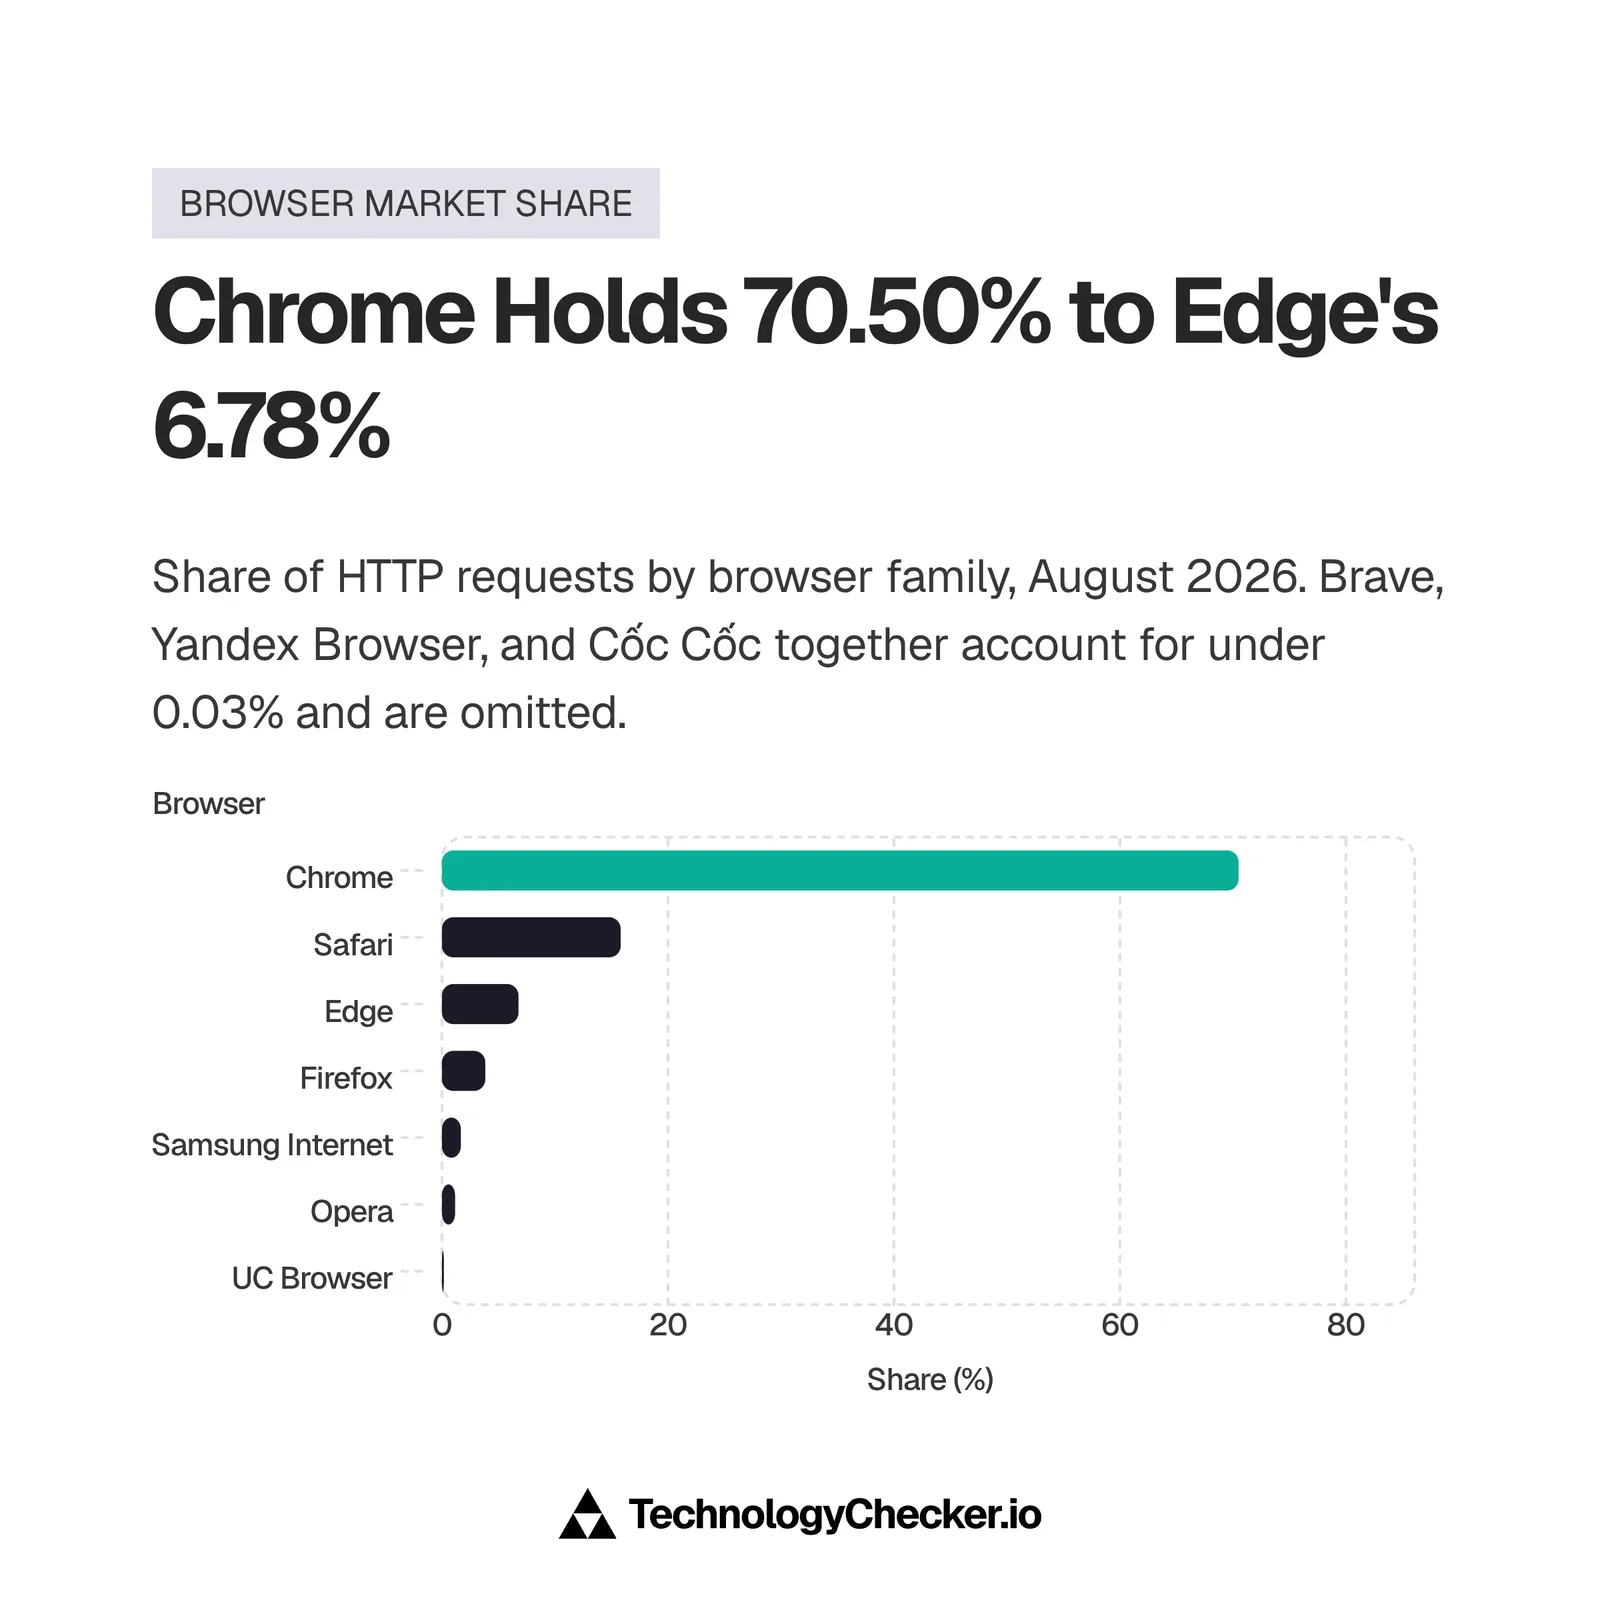
Chrome took 70.50% of HTTP requests Cloudflare observed in August 2026 against Edge's 6.78%, a 10.4x gap and the second-widest margin on the scoreboard.
The Safari number is the one I'd point at if you want to sanity-check everything else on this page.
| Browser | TechnologyChecker read (Cloudflare Radar, Aug 2026) | StatCounter | Difference |
|---|---|---|---|
| Chrome | 70.50% | 69.39% | 1.11 points |
| Safari | 15.82% | 15.83% | 0.01 points |
| Edge | 6.78% | 5.36% | 1.42 points |
Chrome and Edge diverge by around a point each, which is what you'd expect when one instrument weights by page views on panel sites and the other weights by requests to Cloudflare-fronted origins. The agreement on Safari says the underlying populations are close. Our standalone Chrome market share breakdown carries the longer series.
Windows vs Android: the one layer Google lost by 0.01 points
The number one operating system flipped this year, and the margin is almost nothing. In August 2025, Android held 35.02% of HTTP requests against Windows at 33.21%, an Android lead of 1.81 points. In August 2026, Windows holds 34.63% and Android holds 34.14%. Add ChromeOS at 0.48% and Google's platform total reaches 34.62%, which still loses to Windows by 0.013 percentage points.
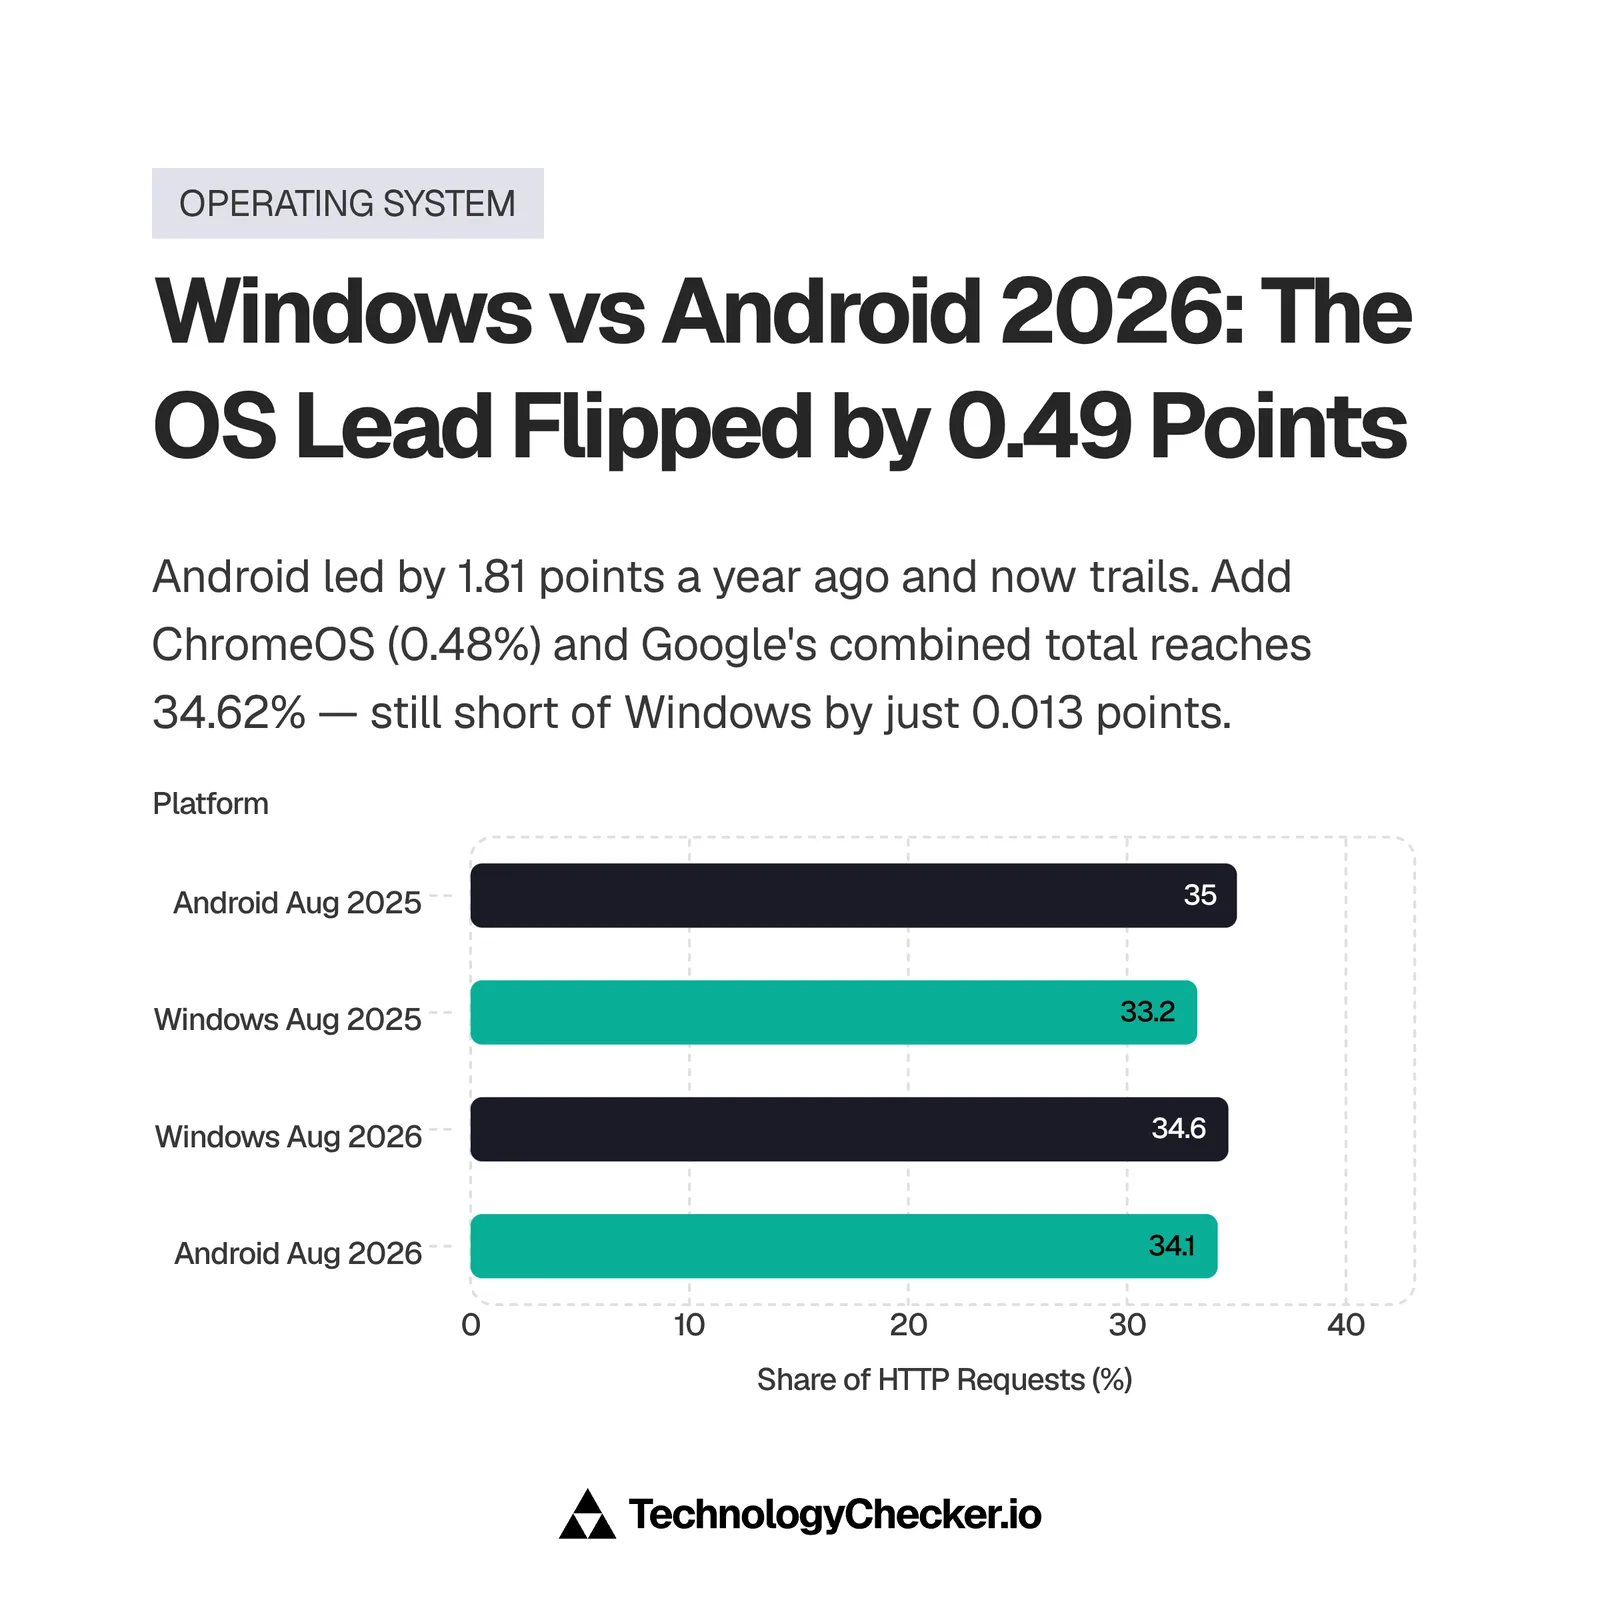
That is a dead heat, not a rout. A tenth of a point of monthly drift would put Android back on top, and the ordering has already flipped once in twelve months.
⚠️ superseded by the Q3 2026 update above; preserved as originally published. Across Q3 2026 Windows led Android plus ChromeOS by 0.96 points on all requests but trailed by 3.04 points on human requests. A September step that left the human device mix flat makes the latest month unreliable for calling a winner.
| Operating system | Aug 2025 | Aug 2026 | Change |
|---|---|---|---|
| Windows | 33.21% | 34.63% | +1.42 pts |
| Android | 35.02% | 34.14% | -0.88 pts |
| iOS | 19.77% | 17.14% | -2.63 pts |
| macOS | 9.01% | 10.57% | +1.56 pts |
| Linux | 2.36% | 2.96% | +0.60 pts |
| ChromeOS | 0.61% | 0.48% | -0.13 pts |
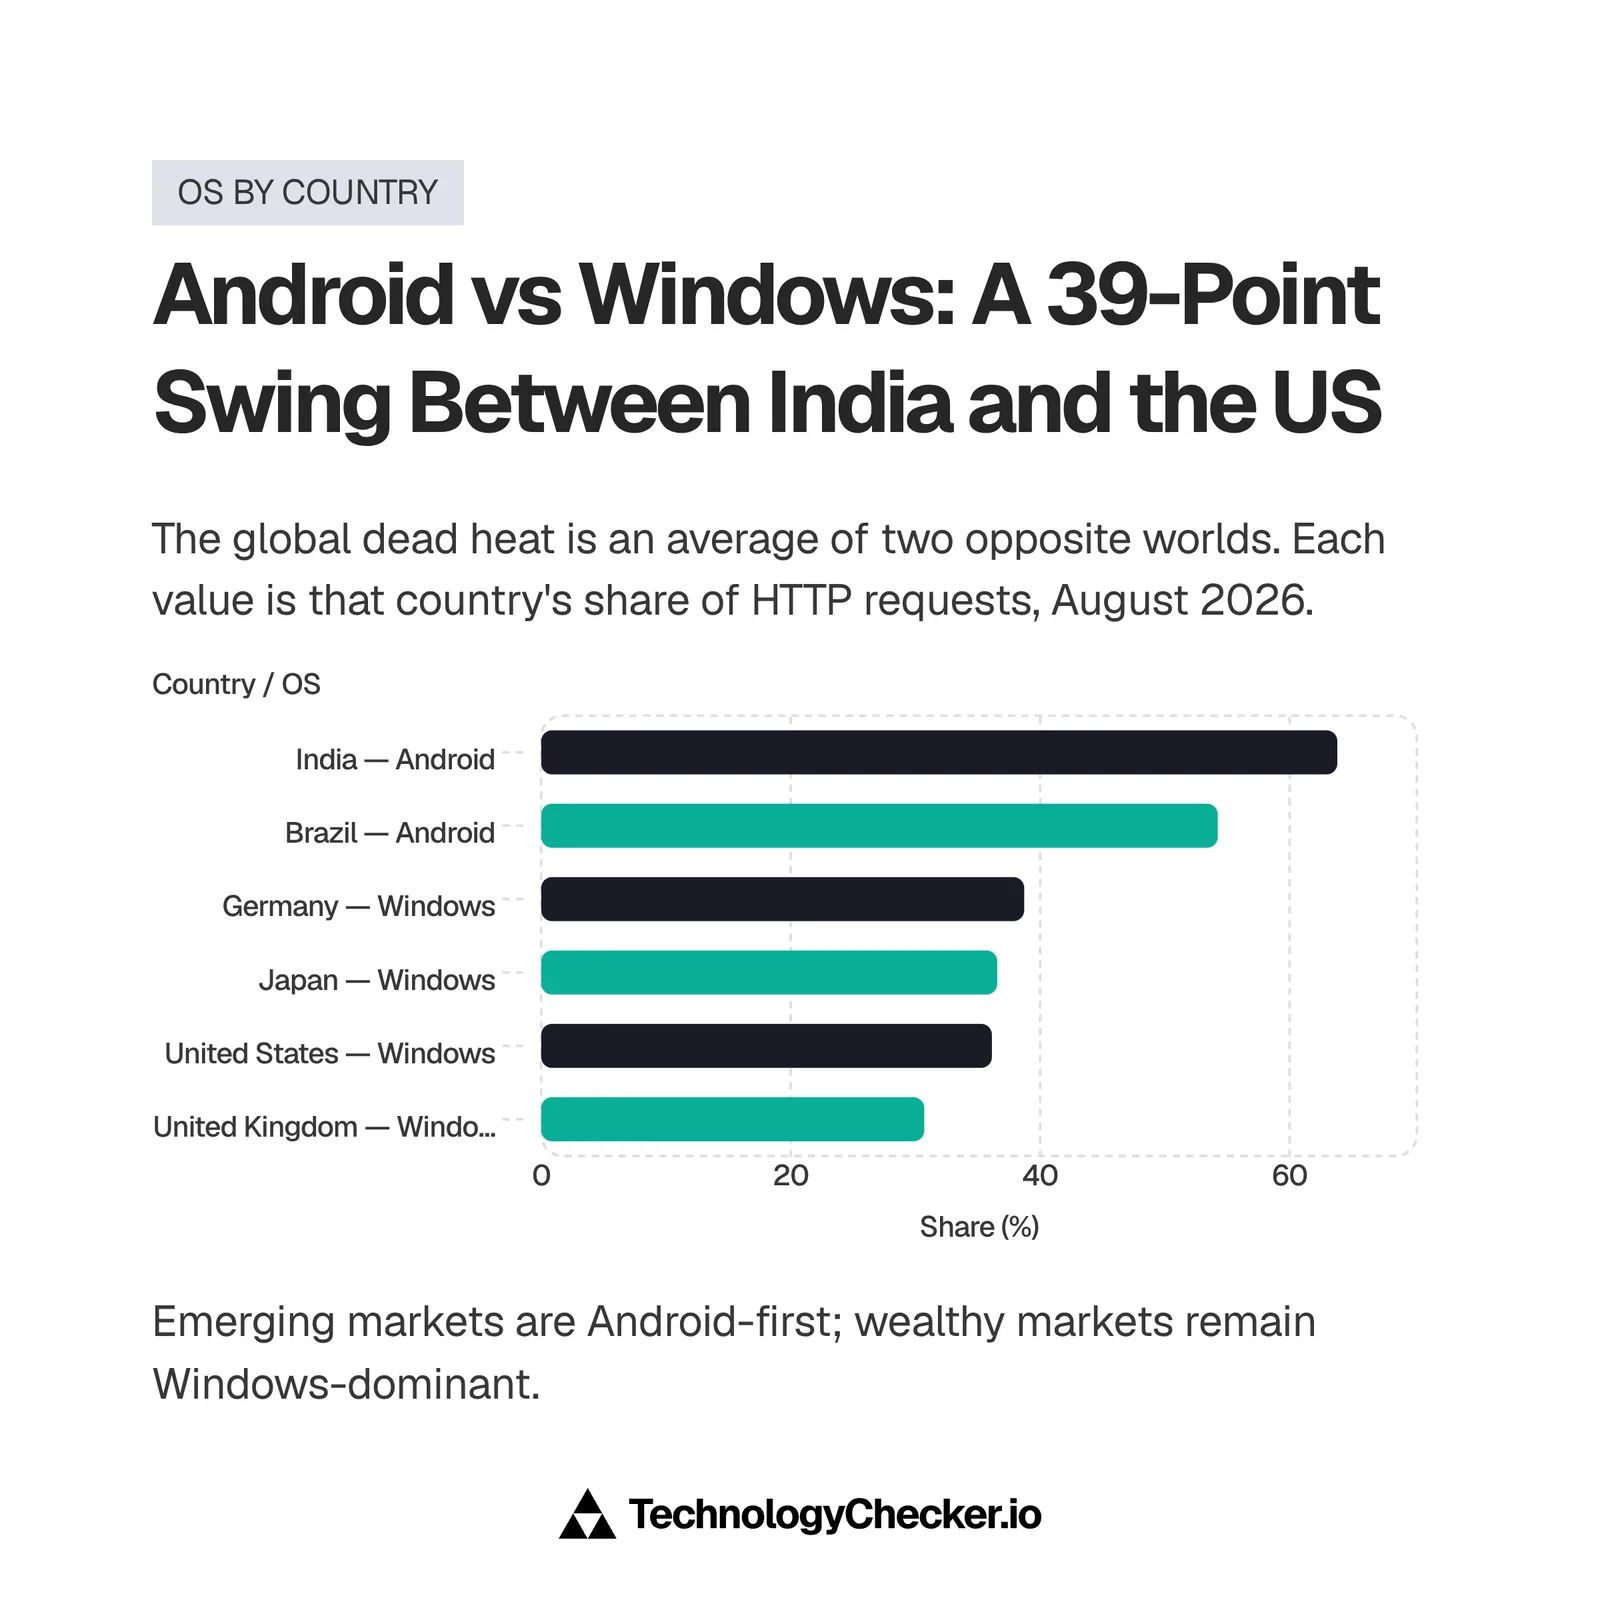
Unlike the search endpoint, this one does accept a country filter, and the global tie hides six completely different national markets.
| Country | Windows | Android | iOS | macOS |
|---|---|---|---|---|
| India | 23.91% | 63.82% | 6.15% | 4.18% |
| Brazil | 27.65% | 54.24% | 12.43% | 4.02% |
| Germany | 38.72% | 26.77% | 18.90% | 11.05% |
| Japan | 36.56% | 24.87% | 28.71% | 8.03% |
| United States | 36.13% | 18.51% | 22.52% | 16.26% |
| United Kingdom | 30.71% | 24.35% | 27.76% | 13.12% |
Android beats Windows by 39.91 points in India and loses to it by 17.62 points in the United States. The global dead heat is an artifact of averaging those two worlds together. One caveat worth stating plainly: this is share of HTTP requests, not devices shipped and not installed base. A desktop that browses all day counts more than a phone that sits in a pocket.
Microsoft 365 vs Google Workspace: who actually owns business email?
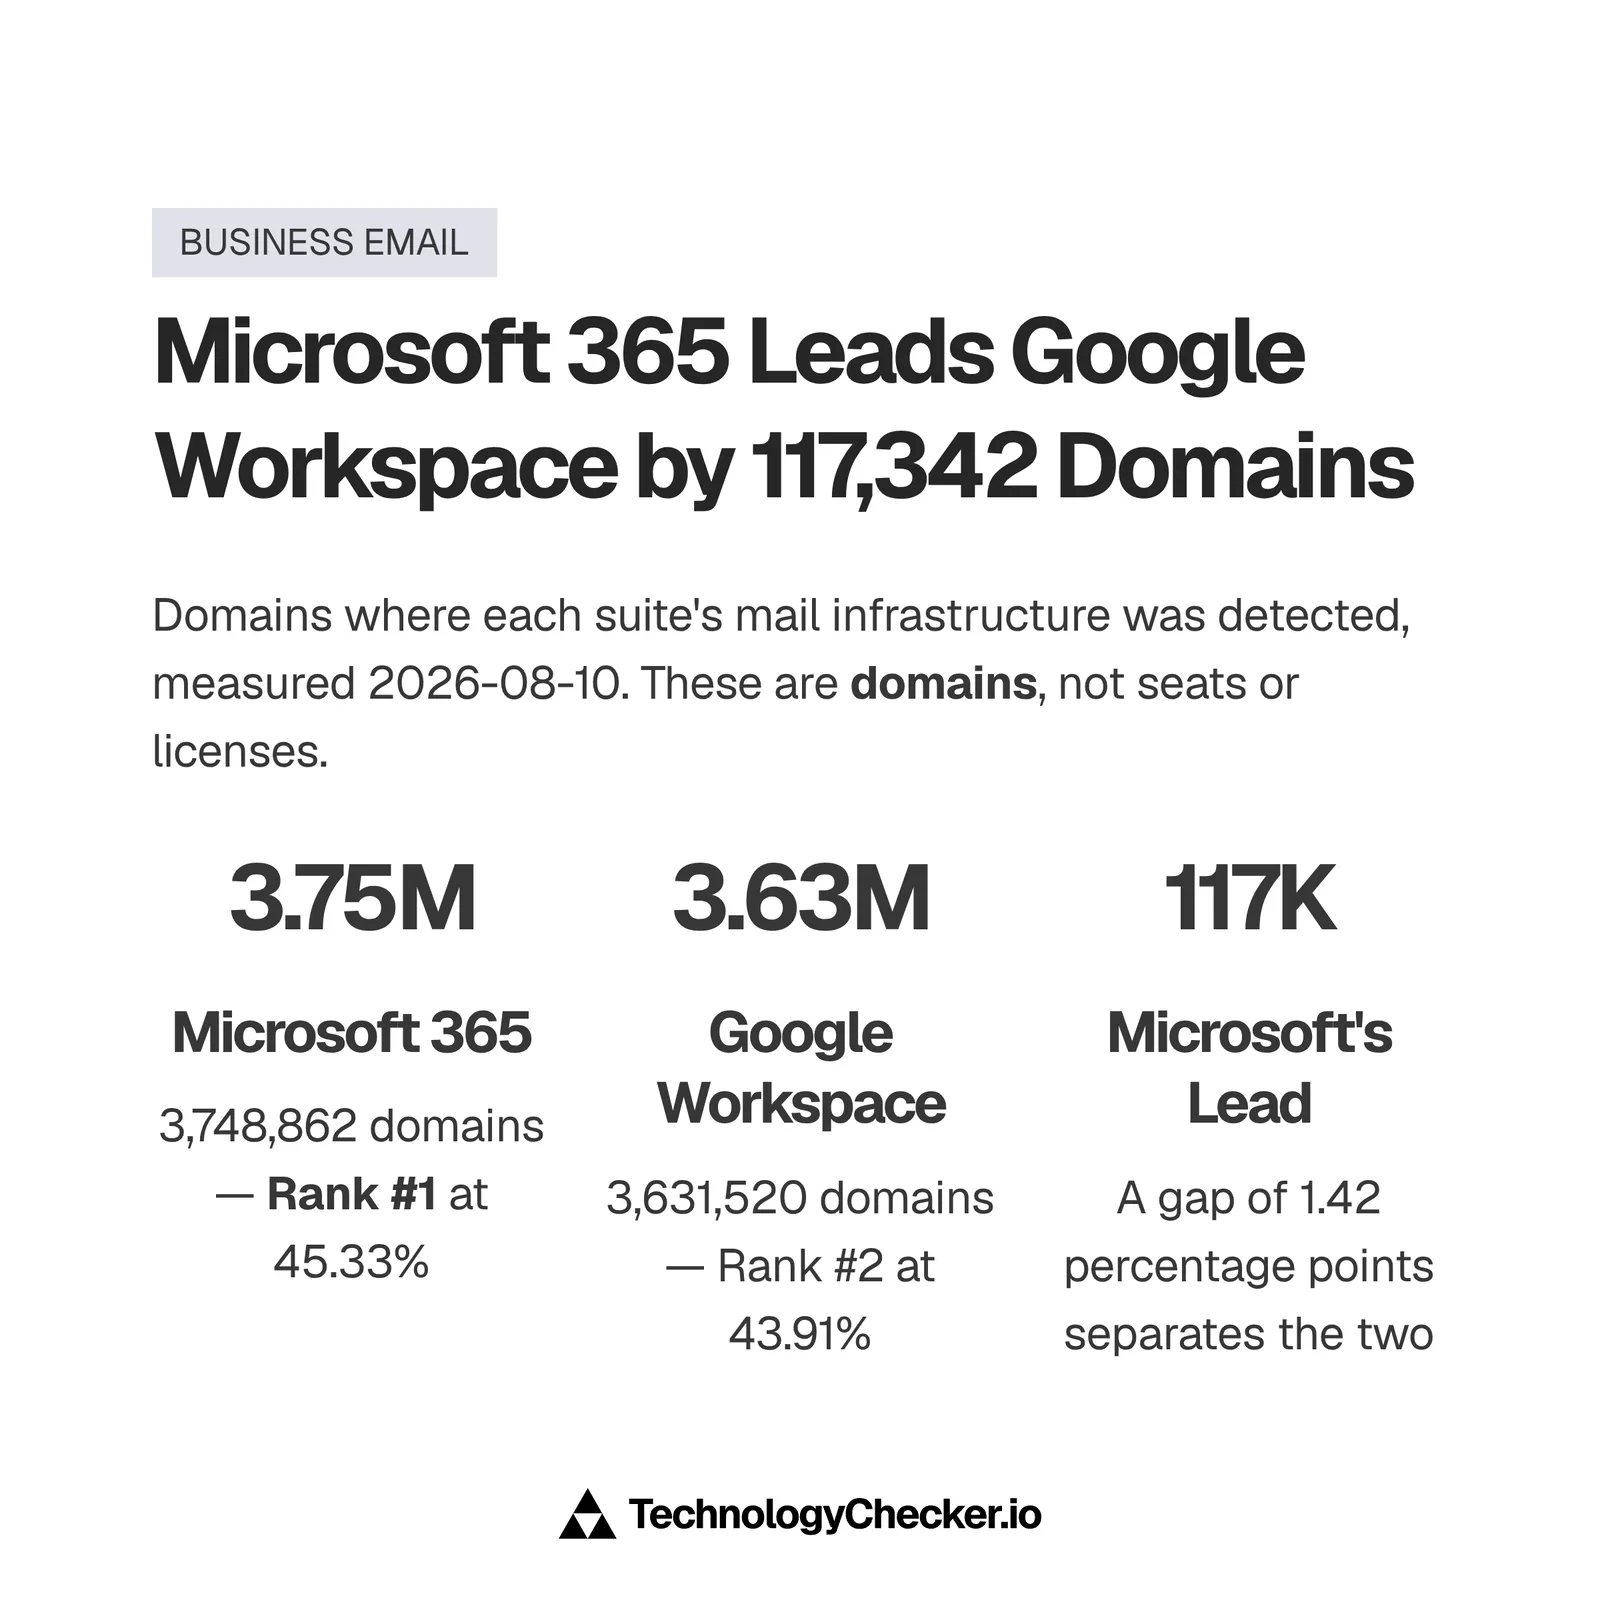
Microsoft 365 leads Google Workspace by 117,342 domains. In our 2026-08-10 rollup we detected Microsoft 365 on 3,748,862 domains and Google Workspace on 3,631,520, which puts Microsoft first in the webmail category at 45.33% and Google second at 43.91%, a gap of 1.42 percentage points. Workspace's 3,631,520 domains map to 2,649,059 distinct companies, so the count is domains, never seats, accounts or customers.
⚠️ superseded by the Q3 2026 update above; preserved as originally published. In our September 2026 crawl Microsoft 365 runs on 3,978,273 domains and Google Workspace on 3,820,175, a lead of 158,098.
This is the section worth reading twice, because the published answers to this exact question do not agree with each other, and one of them does not agree with itself.
| Source | Claim | Who leads? |
|---|---|---|
| Cledara | Microsoft 365 4.53% of SaaS adoption vs Workspace 3.71% | Microsoft |
| Medha Cloud | Workspace 50.34% vs Microsoft 365 45.46% "by domains" | |
| Medha Cloud, same page | Microsoft 365 ~58% of the enterprise segment | Microsoft |
| Onix | Workspace 50.34% vs Microsoft 365 45.46% | |
| Brownstone Research | Workspace ~44% vs Microsoft ~30% | |
| Brownstone Research, same page | "Microsoft has maintained 80%+ market share" | Microsoft |
| TechnologyChecker, 2026-08-10 | Microsoft 365 3,748,862 domains (45.33%) vs Workspace 3,631,520 (43.91%) | Microsoft |
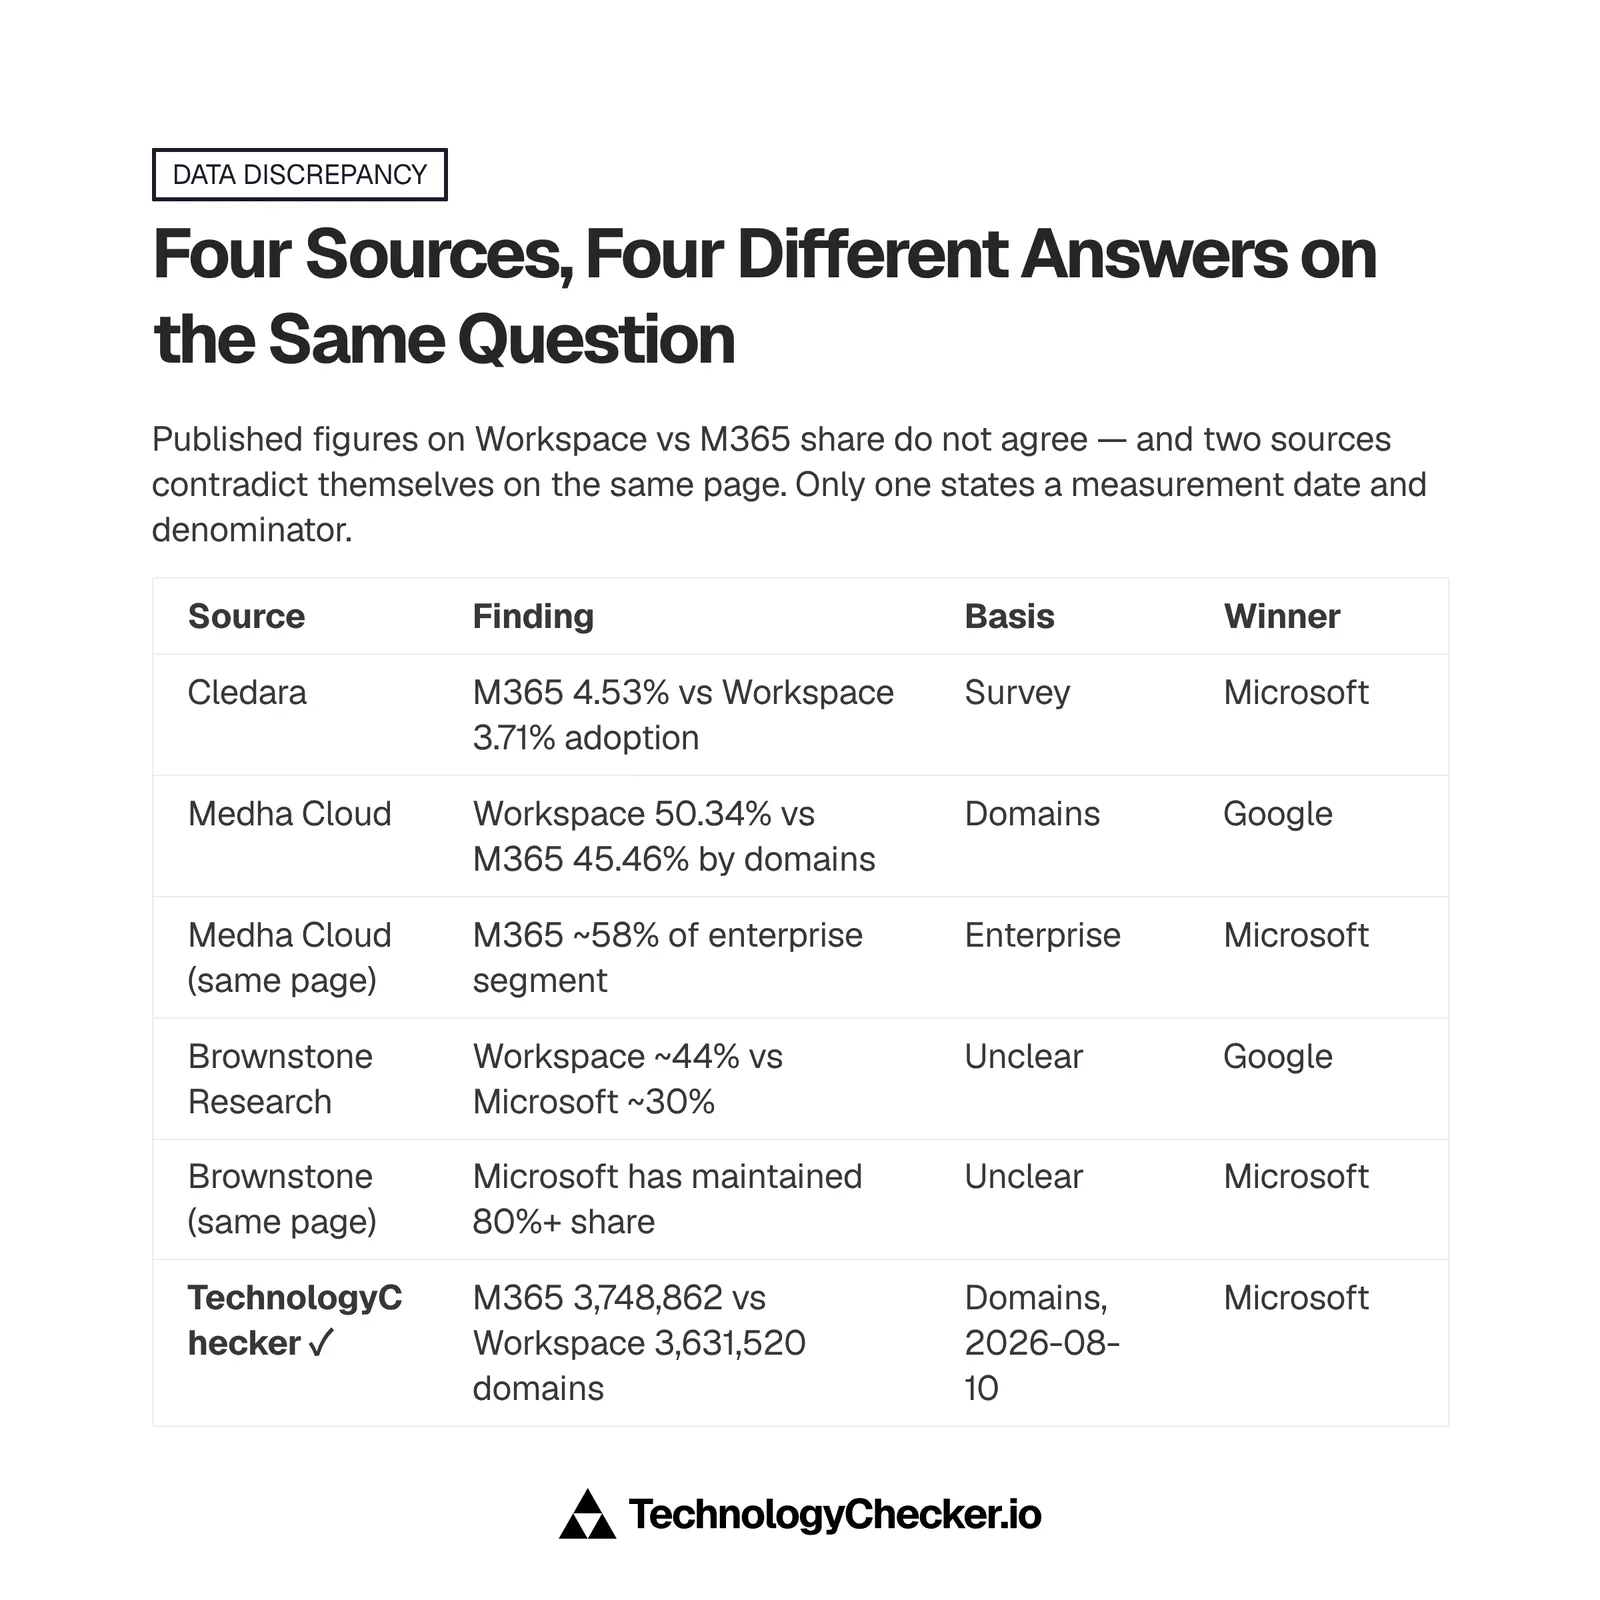
Medha Cloud and Onix both say "by domains" and both put Google ahead by roughly five points. We measure domains for a living and get the opposite ordering. Here's why a detection count and an adoption survey can disagree that hard.
A detection count asks one question: on this domain, right now, do the DNS and header signals resolve to this vendor's mail infrastructure? Every domain counts once and counts equally, so a one-page company site weighs the same as a 40,000-seat enterprise. A self-reported adoption survey asks a different question of a different population (usually SaaS spend, procurement records, or a customer panel) where a large buyer can carry far more weight than a small one. Neither instrument is wrong. They're counting different things, and only one of them tells you what's actually resolving on the public internet today. The same MX test also sees mailboxes that were never a suite decision: the 147,558 domains behind our list of companies that use Titan Email mostly got it bundled with a hosting plan, and 41.87% of them also run on Hostinger (September 2026 crawl). Bundling shows up in the suite race too: on the 444,956 sites in our list of GoDaddy Website Builder customers that aren't placeholder pages, Microsoft 365, which GoDaddy resells with its domains, handles email for 42.5% against 9.22% for Google Workspace (September 2026 crawl).
The reconciliation sits in one more figure from Medha Cloud: 75% of Fortune 500 companies run Microsoft 365 and 42% run Google Workspace. Those add to 117%, because plenty of large organisations run both. Productivity-suite shares don't sum cleanly, which is exactly why four sources can each pick a defensible-looking denominator and land somewhere different.
Our own gap is small and I'd treat it as such. A 1.42-point lead in the webmail category is a real lead, but it isn't the 80% Brownstone gestures at, and it isn't the five-point Google lead Onix publishes. Microsoft is ahead on live domains, narrowly, as of 2026-08-10. Split by customer base, the gap widens in both directions: on the 1,775 websites of companies that use BambooHR, employers that link to or embed their own careers page and mostly have 11 to 200 staff, Microsoft 365 leads Google Workspace 38.7% to 31.38%, while on the 15,557 live sites hosted on Kajabi, where 88.76% of matched companies have 1 to 10 people, Google Workspace leads 36.59% to 15.79% (September 2026 crawl). Tour and activity operators lean the same way, by less: on the 12,011 websites of companies that use FareHarbor, where 95.69% of matched companies have 50 or fewer staff, Google Workspace leads Microsoft 365 24.82% to 16.83%. Small hotels lean the same way: on the 4,258 websites of Cloudbeds customers, where 93.85% of matched companies have 50 or fewer staff, Google Workspace leads Microsoft 365 28.04% to 15.45% (September 2026 crawl). Small providers also take domains from both suites: since March 2026, 226 domains moved their mail from Google Workspace to Fastmail and 96 from Microsoft 365, against 23 and 31 going the other way, per our September 2026 crawl. Proton Mail gains more from Google: 709 domains moved their mail from Google Workspace to Proton since we began tracking in March 2026, against 92 going the other way.
Azure vs Google Cloud: Microsoft leads by 1.7x on live domains
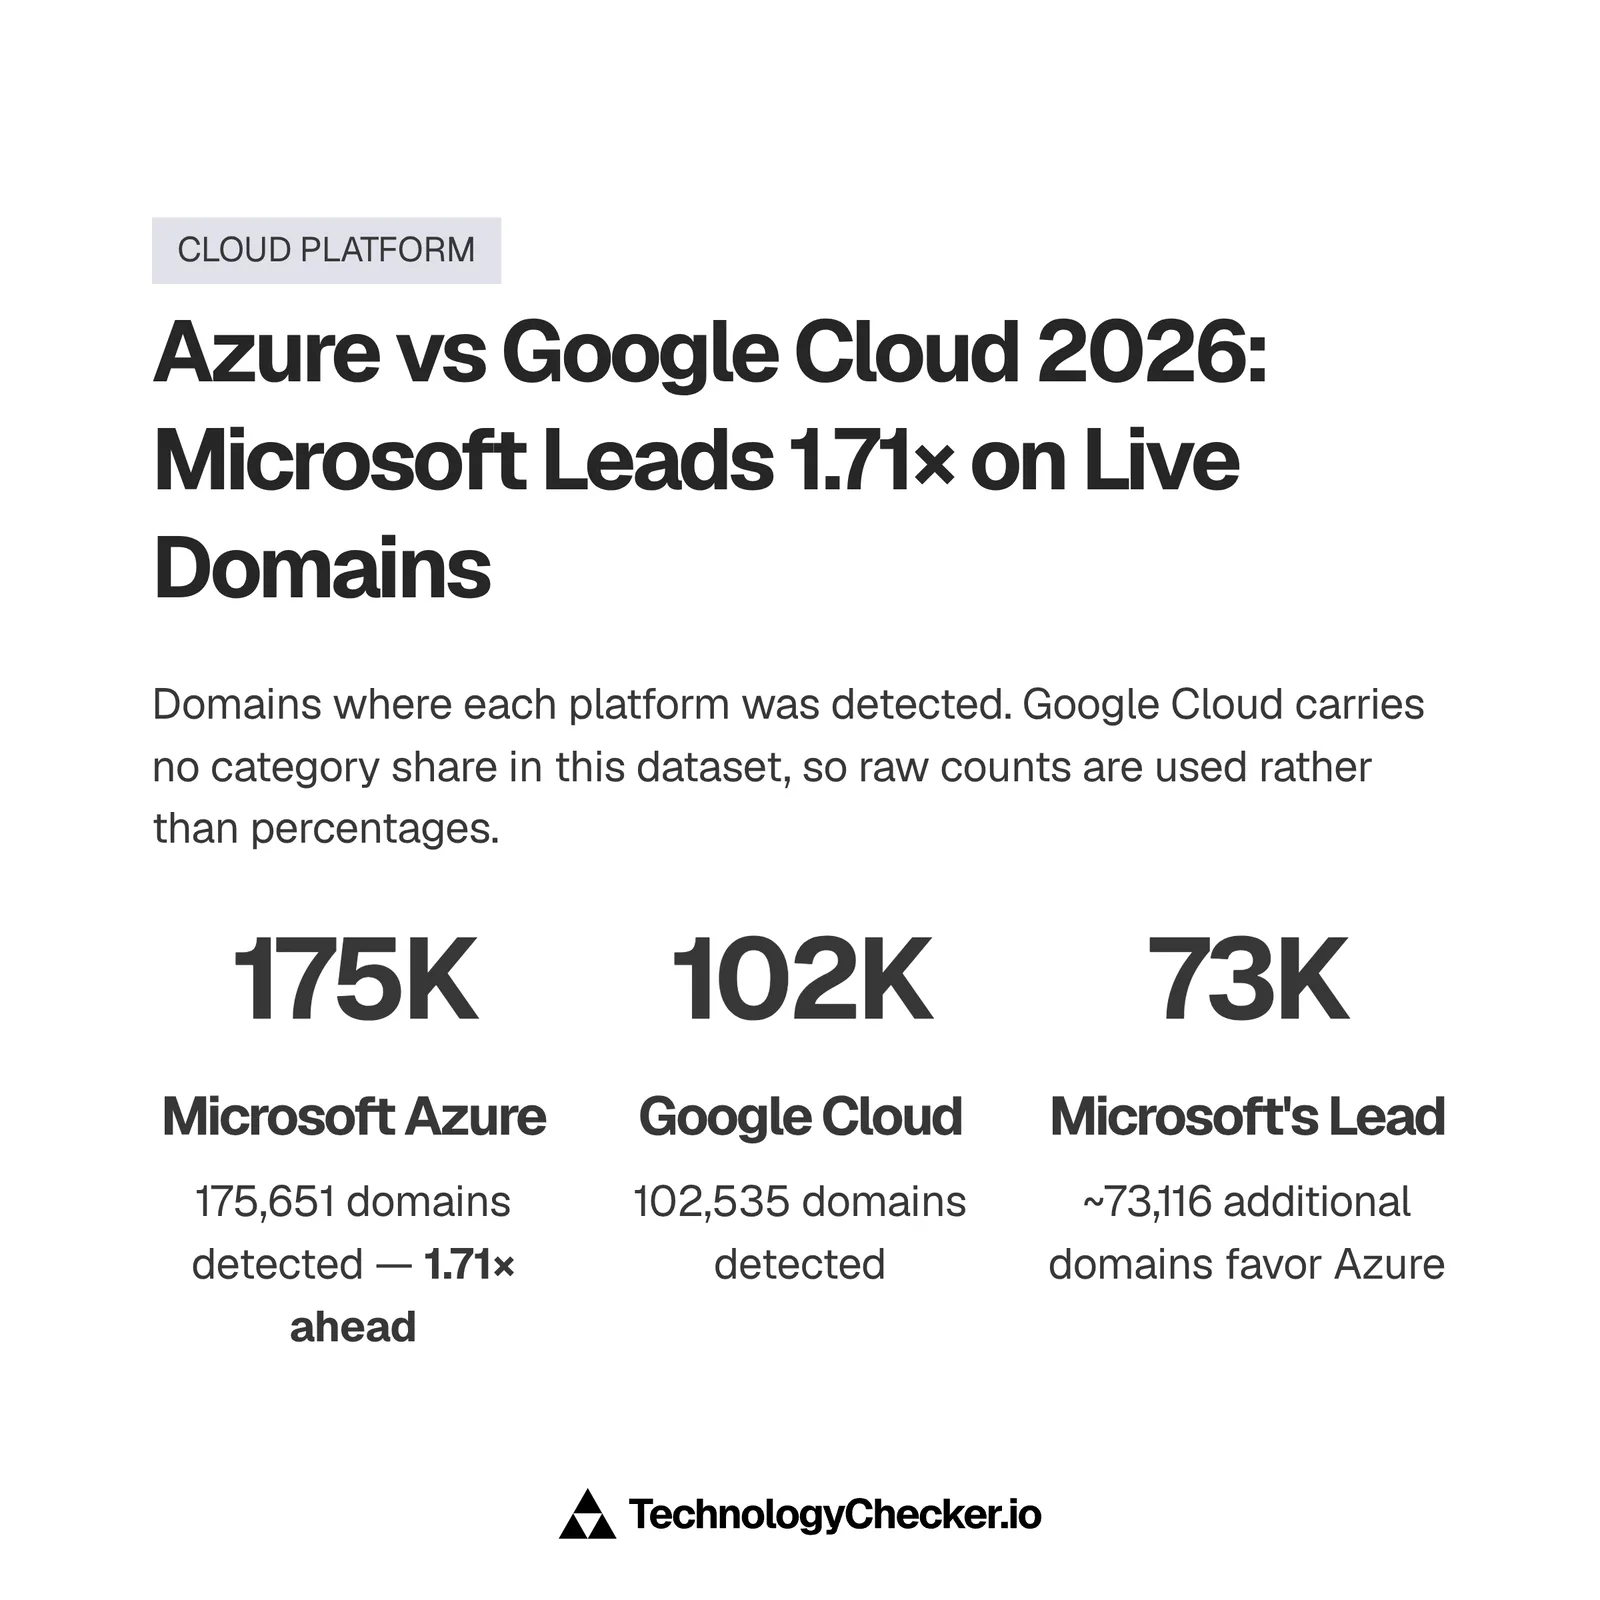
Microsoft Azure runs on 1.71x as many domains as Google Cloud. We detected Microsoft Azure on 175,651 domains (analysed 2026-08-24) and Google Cloud on 102,535 (analysed 2026-08-25). Azure holds 7.5% of the PaaS category and ranks fourth in it; AWS-scale infrastructure and self-hosted stacks take the rest.
I won't quote a category share for Google Cloud, and the reason is worth stating rather than hiding. Its share and category rank are null in our data, and deriving a share by summing every domain count under the PaaS category would double-count domains that run two platforms at once. A wrong denominator is worse than no denominator, so the raw counts are all you get here.
The spend view and the domain view agreeing on the ordering is the useful part. CRN has Google Cloud climbing from 13% of infrastructure spend in Q2 2025 to 15% in Q2 2026, so Google is closing the revenue gap faster than it is closing the footprint gap. Our own Google Cloud statistics report carries the deeper read, including the Flexera finding that only 19% of cloud decision makers run significant workloads on Google Cloud against 46% for Azure.
One number I'll flag but won't over-read: we've stopped detecting Google Cloud on 9,860 domains where we previously saw it, against 3,873 for Azure. That gap looks dramatic and I don't treat it as migration. A dropped detection can mean a rule change, a CDN in front of the origin, or a dead site, and separating those from a genuine platform switch takes a corridor analysis we haven't run on this pair.
Who crawls the web: Google's crawler share fell 10 points in a year
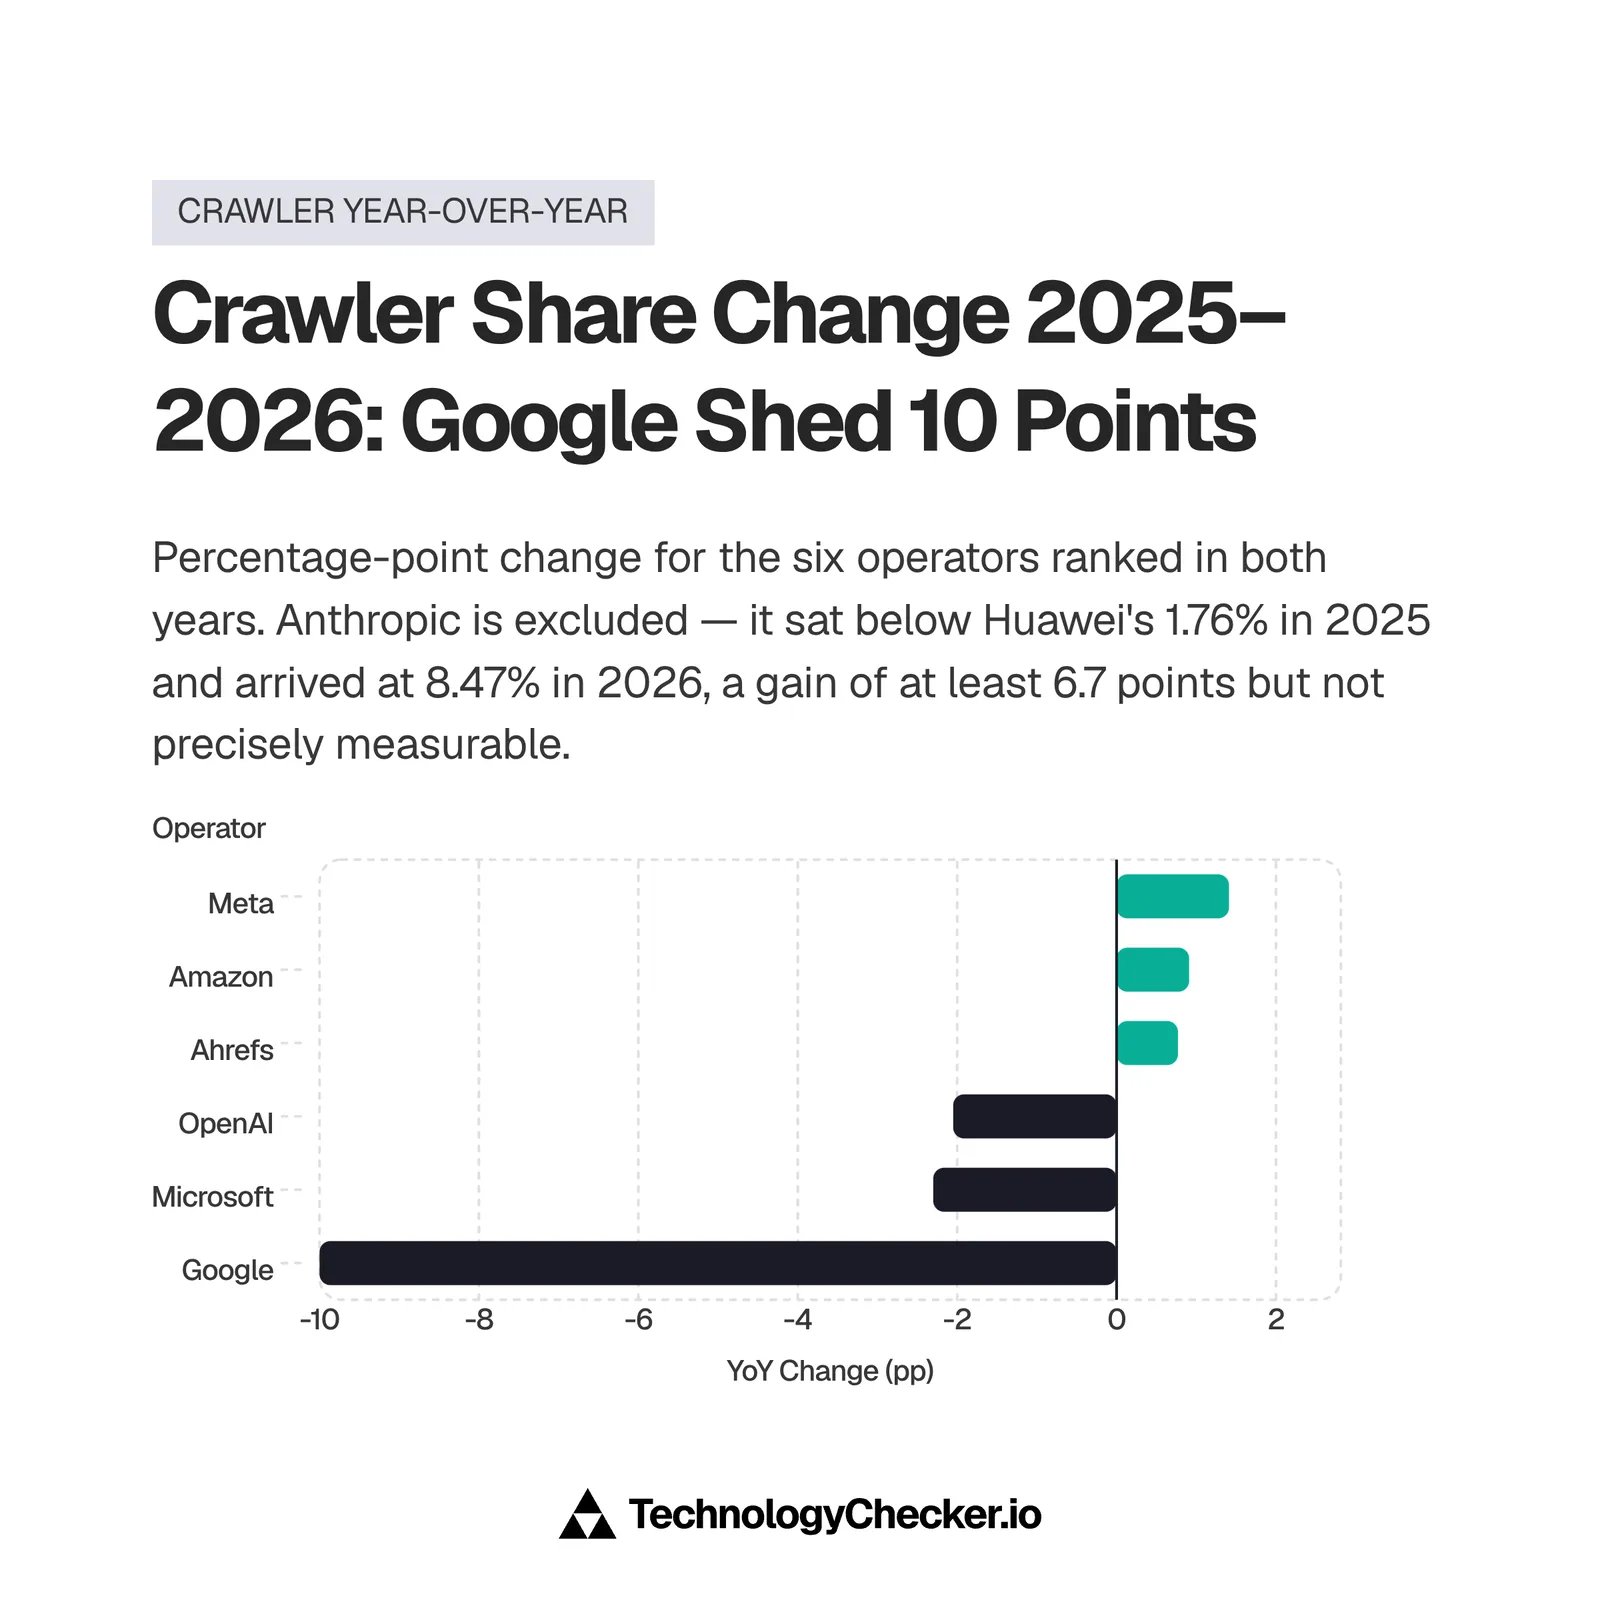
Google's share of bot traffic fell 10.00 points in twelve months, from 36.58% to 26.58%. Microsoft fell too, from 7.39% to 5.09%. The layer both companies used to split with each other is now being taken by AI labs, and Anthropic arrived at number three from outside the top ten entirely.
⚠️ superseded by the Q3 2026 update above; preserved as originally published. Across Q3 2026 Google's share of bot requests was 26.91% and Microsoft's 5.33%, against 38.29% and 6.95% in Q3 2025.
| Operator | Aug 2025 | Aug 2026 | Change |
|---|---|---|---|
| 36.58% | 26.58% | -10.00 pts | |
| Meta | 17.24% | 18.65% | +1.41 pts |
| Anthropic | not in top 10 | 8.47% | new entry |
| OpenAI | 7.78% | 5.73% | -2.05 pts |
| Microsoft | 7.39% | 5.09% | -2.30 pts |
| Amazon | 3.89% | 4.80% | +0.91 pts |
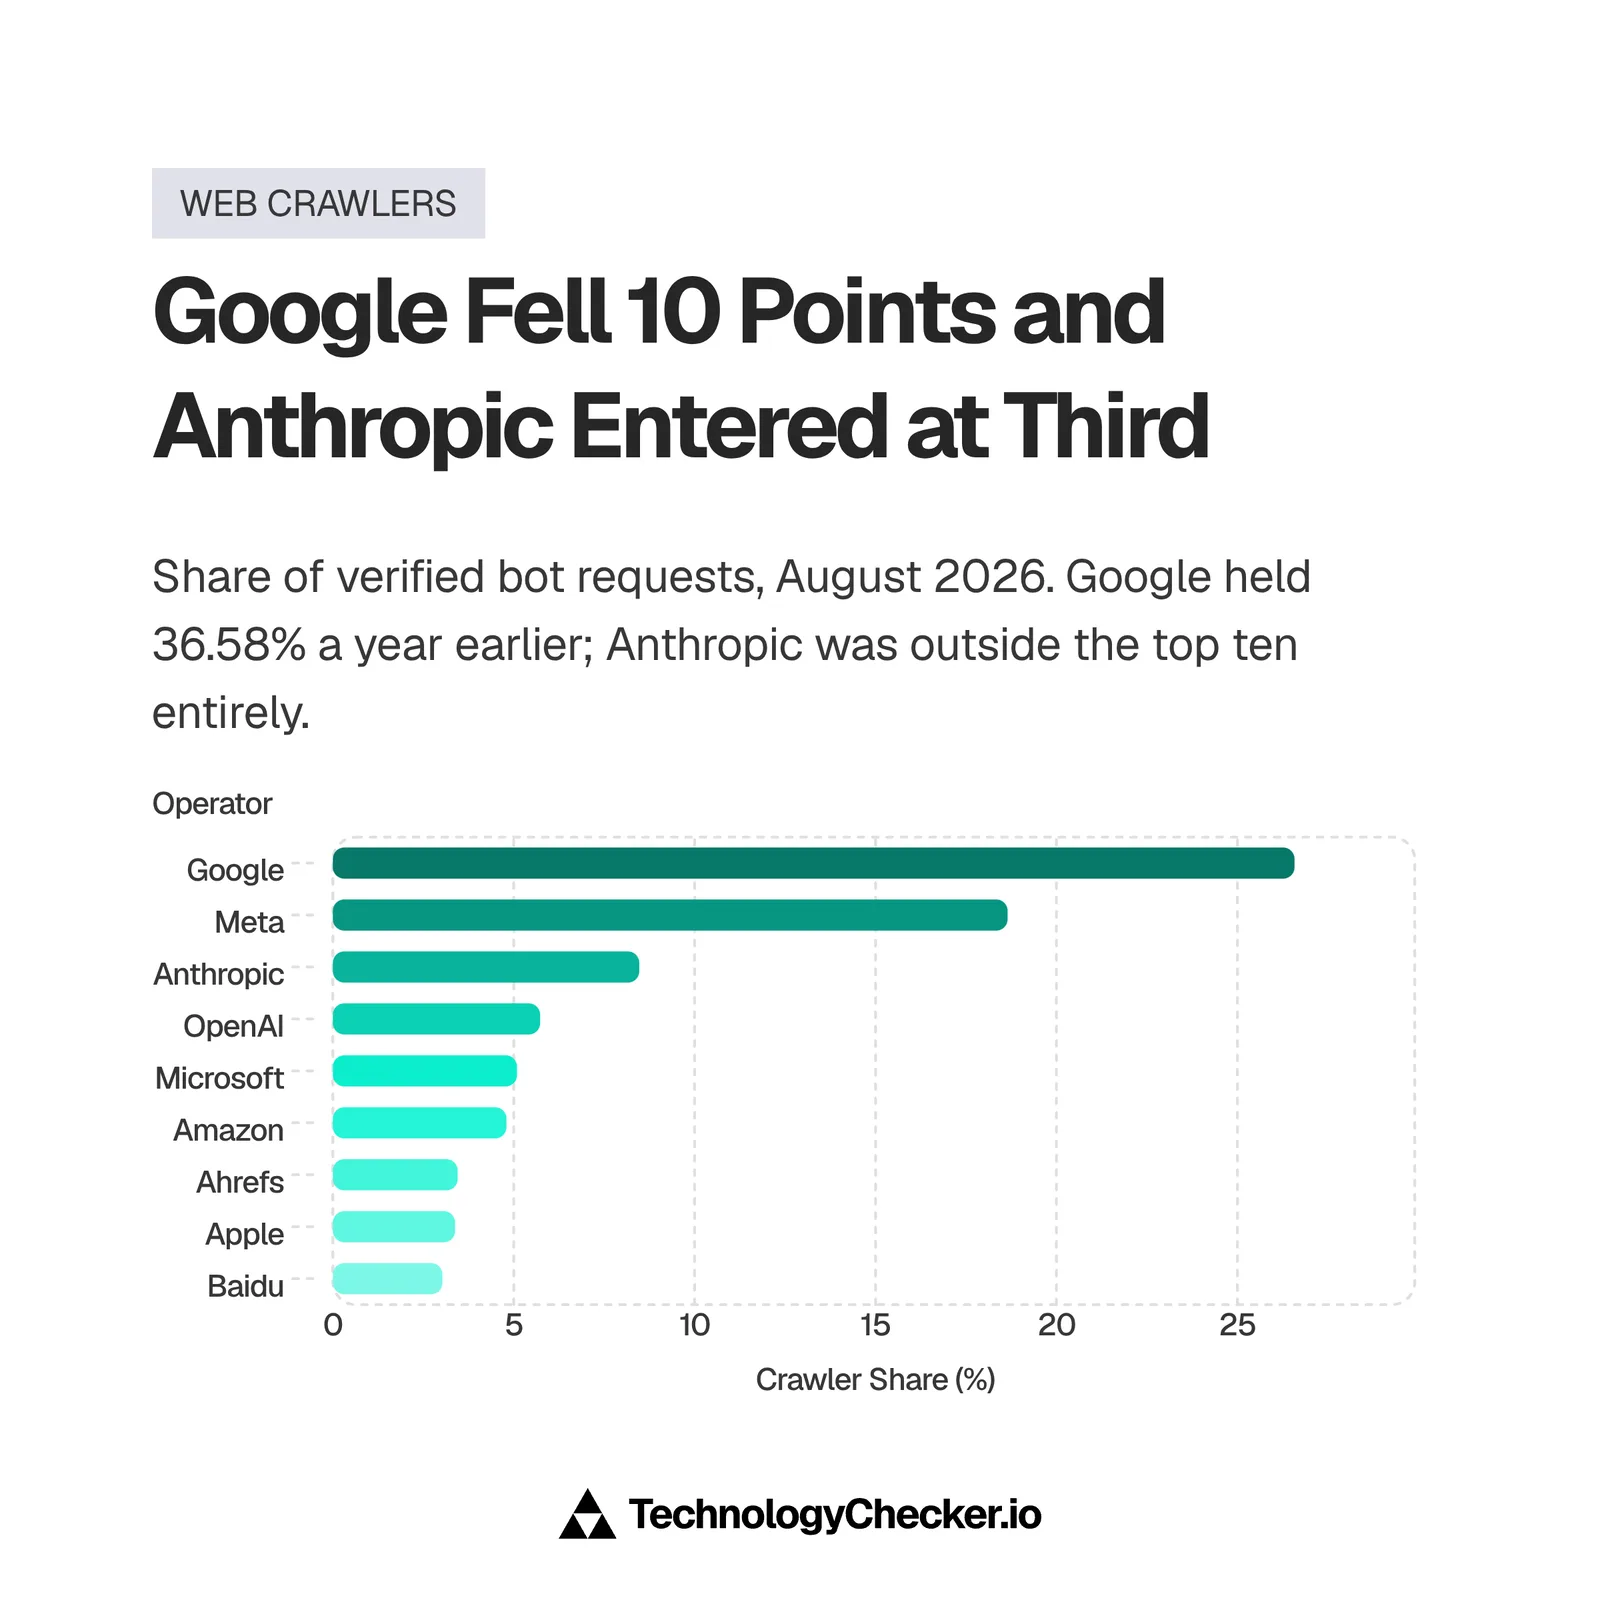
Google still crawls 5.2x as much as Microsoft, so the ordering between the two hasn't changed. What changed is that the pair went from 43.97% of all crawling to 31.67% in a single year. Meta now crawls 3.7x as much as Microsoft, and Anthropic went from unranked to third.
If you're deciding which bots to allow through, the crawler mix matters more than the search share does, and our AI crawler statistics report breaks the AI operators out by user agent and stated purpose.
Which company takes more than it gives back? The crawl-to-refer ratio
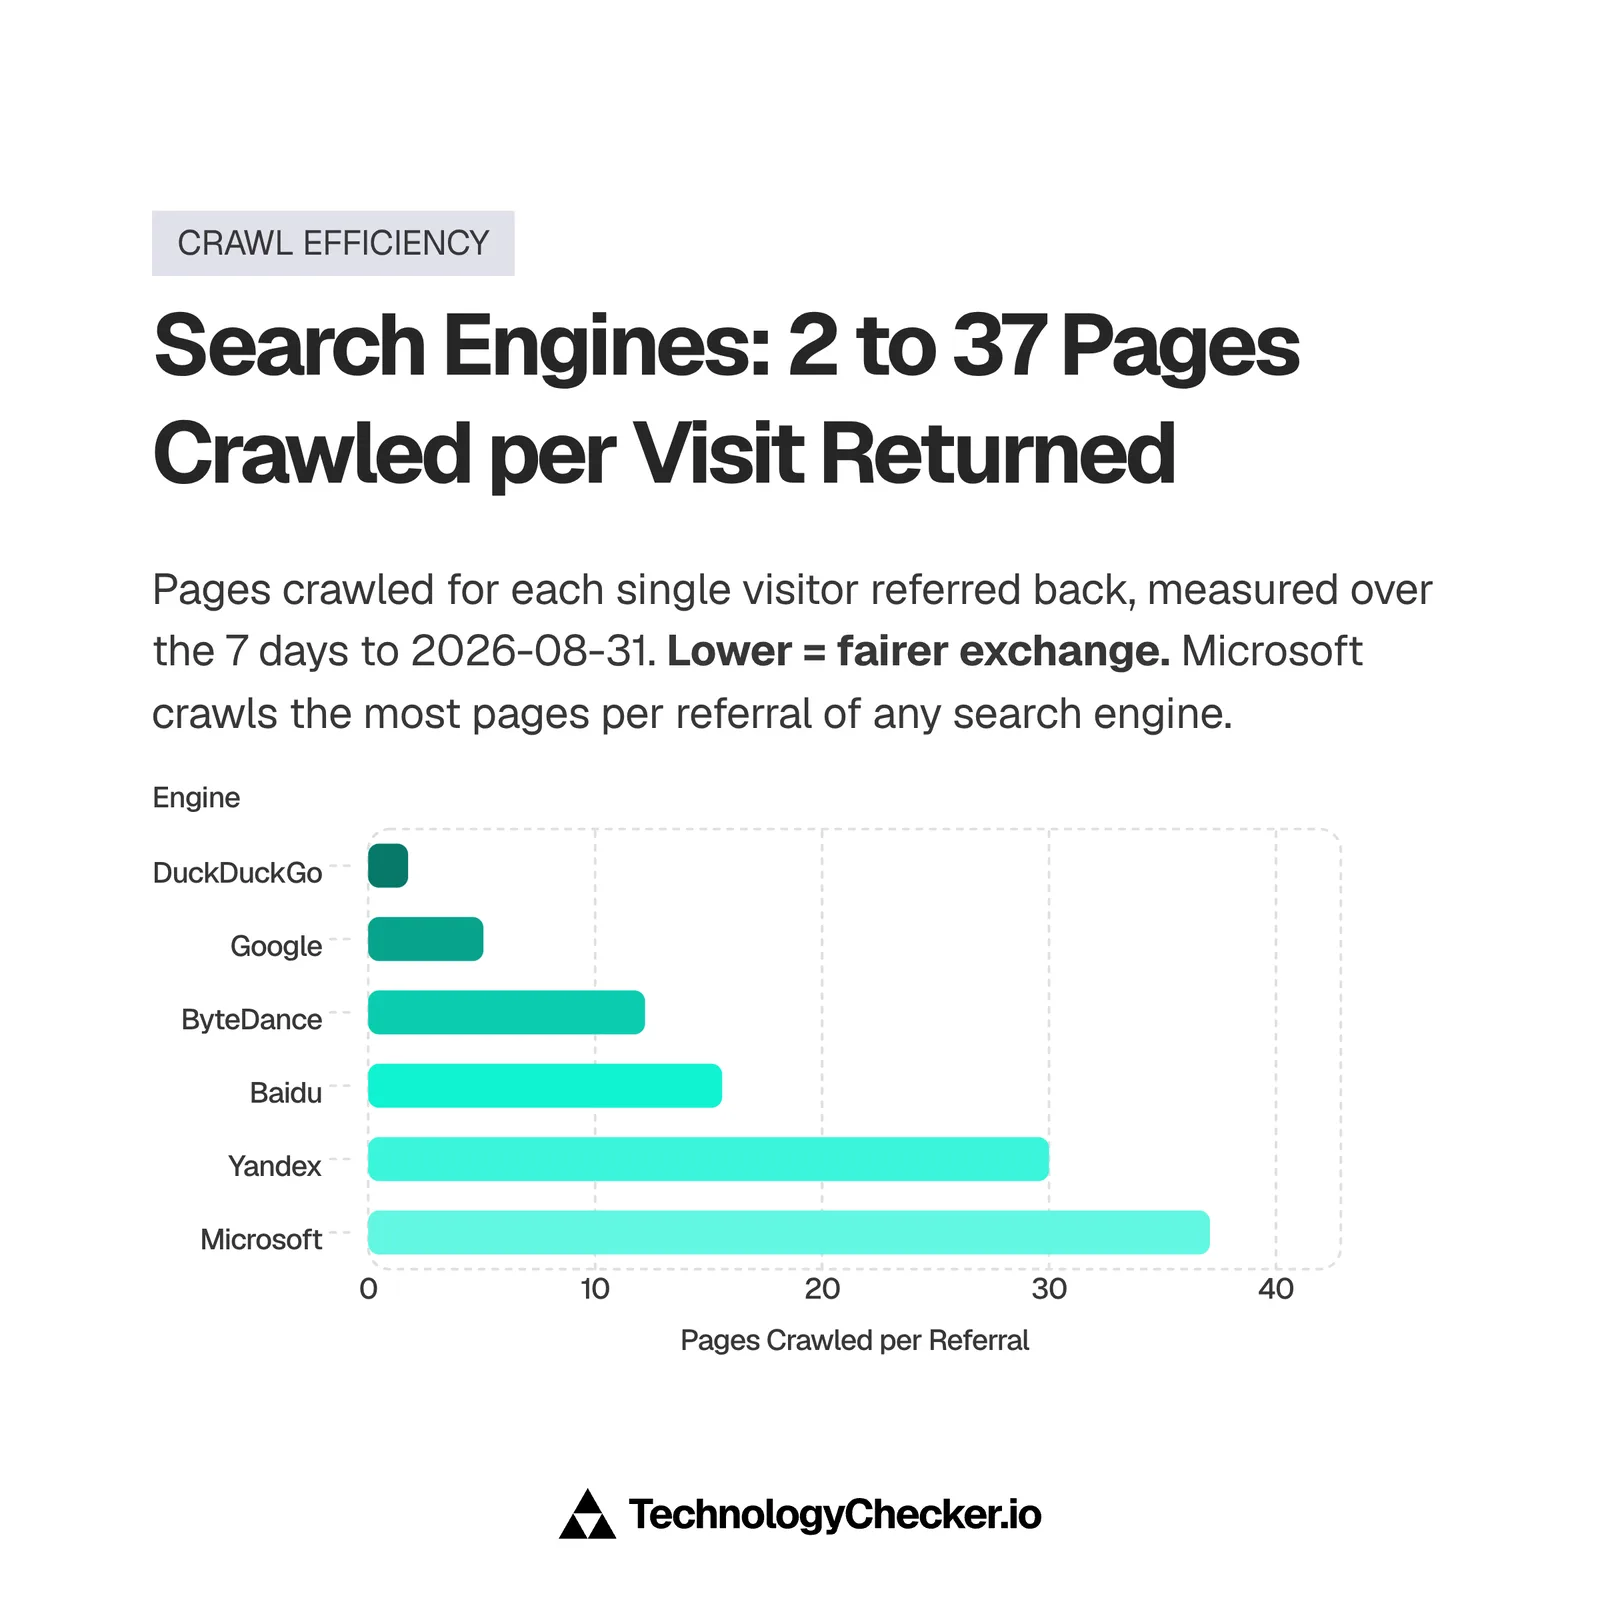
Google crawls 5.08 pages for every visit it refers back. Microsoft crawls 37.09. The crawl-to-refer ratio is pages crawled per single visit sent, so lower is better for the site being crawled. Google runs the lowest ratio of any operator at its scale, and the second-lowest on the whole list behind DuckDuckGo. Microsoft takes 7.3x more per visit returned.

| Operator | Pages crawled per 1 visit referred |
|---|---|
| DuckDuckGo | 1.76 : 1 |
| 5.08 : 1 | |
| ByteDance | 12.20 : 1 |
| Baidu | 15.60 : 1 |
| Yandex | 30.00 : 1 |
| Microsoft | 37.09 : 1 |
| OpenAI | 530.29 : 1 |
| Perplexity | 570.44 : 1 |
| Anthropic | 757.18 : 1 |
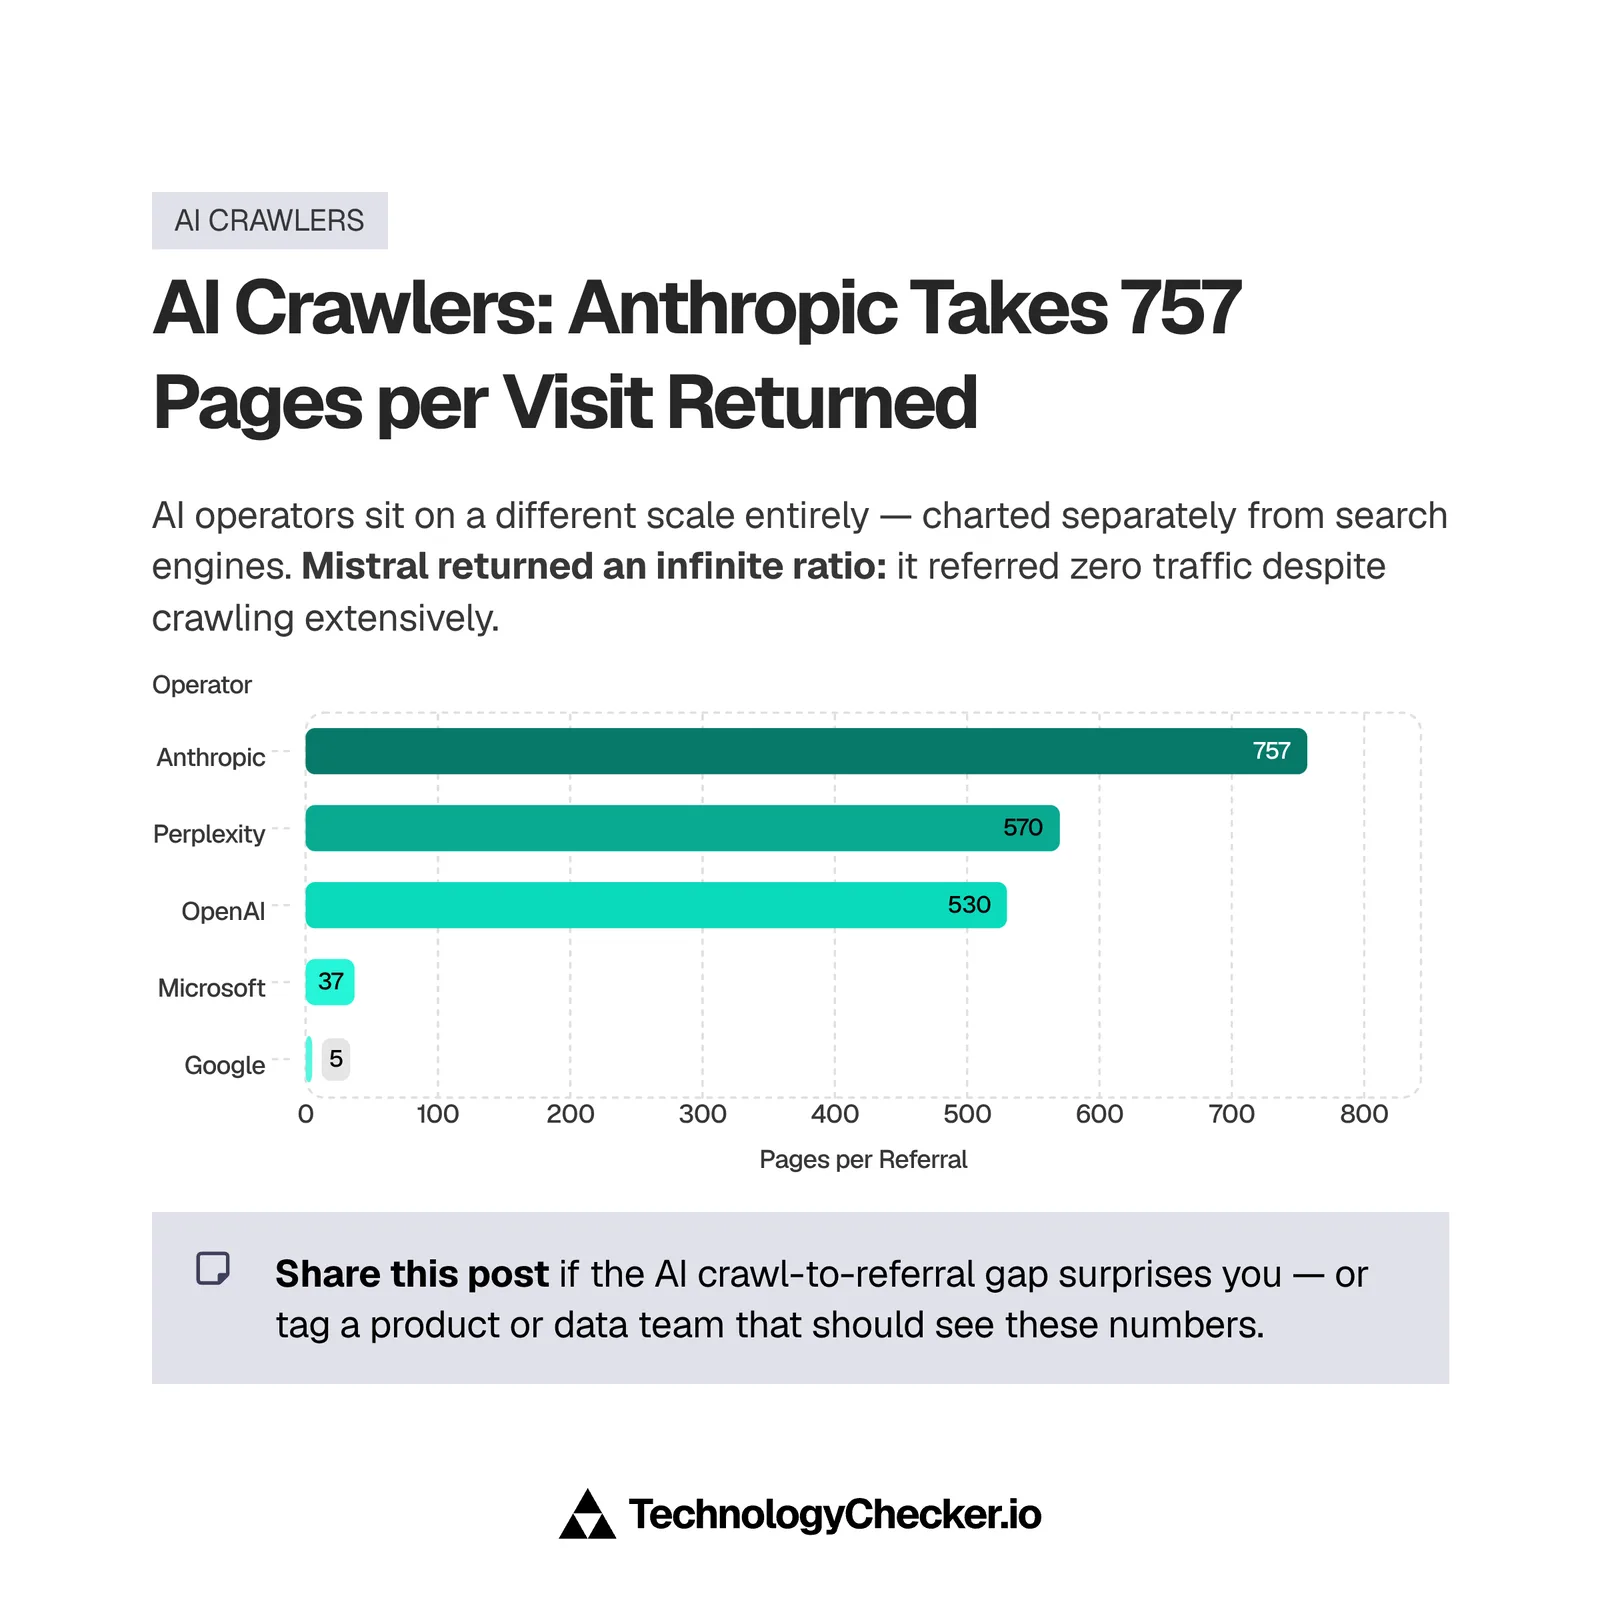
These are ratios, not percentages, and they run on a shorter window than the rest of this post: 24 to 31 August 2026, because longer windows error out on that endpoint.
⚠️ Cloudflare has since revised this window, and the endpoint now accepts a full quarter. Re-pulled on 1 October 2026, 24 to 31 August reads Google 5.04 and Microsoft 36.91 (OpenAI 479.97, Perplexity 573.52, Anthropic 719.28). Across Q3 2026: Google 4.88, Microsoft 37.46. The table above is preserved as originally published.
The ranking layer confirms the same asymmetry. In Cloudflare's top domains list for 2026-09-01, google.com ranks first, googleapis.com second, gstatic.com fourth and googlevideo.com tenth, with microsoft.com at sixth. Google occupies four of the top ten slots; Microsoft occupies one.
What this means if you are choosing a stack
Pick by layer, not by brand. Nothing in this data supports "standardise on one vendor" as a strategy, because the two companies are not close to each other on most layers and the layers where they are close are the ones with the highest switching cost.

- Reaching consumers? Google is the distribution channel and it isn't close. 88.55% of referrals, 70.50% of browser requests, 98.51% of tag management. Budget your web presence around Chrome behaviour, not around Edge.
- Building for a specific country? Check the platform mix first. Android carries 63.82% of Indian requests and 18.51% of American ones. A mobile-first Android assumption is correct in India and wrong in the United States.
- Choosing a productivity suite? The measured gap is 1.42 points. Treat it as a tie and decide on identity, compliance and what your users already know, because footprint gives you no signal at this margin.
- Choosing a cloud platform? Azure leads on live domains 1.71x and on spend share by roughly seven points. Google Cloud is gaining spend share faster. Both statements are true and they answer different questions.
- Deciding which bots to allow? Google returns a visit every 5.08 pages, Microsoft every 37.09. That's the number to weigh, not the search share.
The honest summary: Google owns the surface a customer sees, Microsoft owns the seat an employee sits in, and the only place they genuinely collide is the desktop, where the lead changed hands this year by 0.013 points.
⚠️ The operating-system lead now depends on the population: Windows ahead on all requests in Q3 2026, Android plus ChromeOS ahead on human requests. See the Q3 2026 update above.
Frequently asked questions
Is Microsoft bigger than Google?
It depends on the layer, and on whether you mean the company. On the web layers Google is far bigger: 89.04% of search referrals and 70.80% of browser requests in Q3 2026, against Microsoft's 3.22% and 6.44%. At work Microsoft is ahead, with Microsoft 365 on 3,978,273 domains against Google Workspace's 3,820,175 (September 2026 crawl). As companies, Alphabet reported more revenue ($402.8 billion for 2025) and Microsoft slightly more net income ($133.7 billion for its year to June 2026).
Which is more popular, Google or Microsoft?
Google, on consumer-facing measures. In Q3 2026 Google sent 89.04% of search referrals and Chrome carried 70.80% of browser requests, against Bing's 3.22% and Edge's 6.44%. Microsoft is more widely deployed inside businesses: TechnologyChecker detects Microsoft 365 on 3,978,273 domains against Google Workspace's 3,820,175 in the September 2026 crawl.
Which is more profitable, Google or Microsoft?
Microsoft, on margin. Microsoft reported $133.7 billion of net income on $331.8 billion of revenue for the year to 30 June 2026, a 40.3% net margin. Alphabet reported $132.2 billion on $402.8 billion for calendar 2025, a 32.8% margin, and its net income includes $29.8 billion of other income. The two fiscal years end six months apart.
What is Google Workspace vs Microsoft 365 market share in 2026?
Microsoft 365 leads on domains. In our September 2026 crawl TechnologyChecker detects Microsoft 365 on 3,978,273 domains and Google Workspace on 3,820,175, a gap of 158,098. In the August 2026 first edition the webmail category split 45.33% to 43.91%. These are counts of domains where the service resolves, not seat counts or revenue.
What is Google's market share worldwide in 2026?
It varies by layer and there is no single worldwide figure. In Q3 2026 Google took 89.04% of search referrals, 70.80% of browser requests and 26.91% of crawler traffic. On operating systems, Android plus ChromeOS carried 34.15% of all requests and 36.36% of human requests. Our monthly search engine market share report tracks the referral figure in detail.
Who is winning cloud market share in 2026, Google Cloud or Microsoft Azure?
Azure, on both instruments we can check. We detected Azure on 175,651 domains (2026-08-24) against Google Cloud's 102,535 (2026-08-25), a 1.71x lead. On infrastructure spend, published estimates put Azure near 21% and Google Cloud near 14%. Google Cloud is growing its spend share faster, moving from 13% to 15% between Q2 2025 and Q2 2026.
Should enterprises choose Google Workspace or Microsoft 365?
Footprint won't decide it for you. The two are about 4% apart on detected domains (3,978,273 against 3,820,175 in September 2026), which is inside the range where either choice is mainstream and well-supported. Decide on identity provider, compliance requirements, and existing user familiarity. Note that 75% of Fortune 500 companies run Microsoft 365 and 42% run Google Workspace, so running both is common rather than unusual.
Does Microsoft still dominate Google in enterprise productivity?
Microsoft leads on domains but does NOT dominate: in our September 2026 crawl Microsoft 365 runs on 3,978,273 domains against Google Workspace's 3,820,175, about 4% more. Published claims of an 80%+ Microsoft share and of a five-point Google lead both circulate, and they cannot both be right. Every productivity-suite figure needs its denominator and its date attached before you can use it.
Is Windows now the most-used operating system?
Only if you count bots. Across all HTTP requests in Q3 2026, Windows took 35.11% against 34.15% for Android plus ChromeOS. Across human requests, Android plus ChromeOS led 36.36% to 33.32%. September's jump toward Windows left the split between mobile and desktop human traffic unchanged, so we treat it as a classification shift until October's data confirms it. These are shares of requests, not devices sold.
Why do your numbers differ from StatCounter?
Different instruments measuring different populations. StatCounter counts tracker pixels across a partner panel of sites. Cloudflare Radar counts HTTP requests reaching Cloudflare-proxied origins. On browsers the two agree closely: our August 2026 Safari read of 15.82% sits 0.01 points from StatCounter's 15.83%. On search they diverge more, because a referral header on a proxied origin and a panel page view are not the same measurement.
What is the Google vs Microsoft market share prediction for 2026?
We don't publish predictions, and I'd be sceptical of anyone who does at these margins. What we can say is what moved. Google's crawler share in Q3 2026 was 11.38 points below a year earlier, the Windows-versus-Android lead flipped on all requests while Android kept it among human visitors, and Anthropic held third place among crawler operators. Two of those three would have failed a 2025 forecast.
Who actually owns the web in 2026, Google or Microsoft?
Google owns the public web, Microsoft owns the corporate one. Google touches almost every consumer path onto a website: 89.04% of referrals and 70.80% of browser requests in Q3 2026, 98.51% of tag management installs (August 2026), and four of Cloudflare's top ten global domains on every September 2026 sample date. Microsoft touches the infrastructure behind the business: more mail domains, more cloud domains, and the leading desktop operating system.
What changed in this report
Added Q3 2026 quarter figures with Q2 2026 and Q3 2025 for comparison, a 2026 month-by-month table, a live operating-system chart, an industry breakdown of Microsoft 365 and Google Workspace domains, and a direct answer to "is Google bigger than Microsoft", including each company's revenue and net income from its Form 10-K. The operating-system layer is now shown on two populations, all requests and human requests, because they name different leaders. Cloudflare revised the 24 to 31 August crawl-to-refer window after the first edition; the original figures stay, with a note. Graded both calls from the first edition: the operating-system lead did move, and the searches behind this page did turn out to be about company size. September 2026 is provisional.
Initial publication. Seven contested layers measured against Cloudflare Radar for the full month of August 2026, with August 2025 as a control, plus TechnologyChecker detection data analysed between 2026-08-04 and 2026-09-04.
Lead as originally published:
Google vs Microsoft market share in 2026 splits by layer, not by a single winner. Google takes 88.55% of search referrals against Bing's 3.53% and leads the browser 10-to-1. Microsoft leads three layers: business email by 117,342 domains, cloud platforms by 1.71x, and the operating system layer by 0.013 points.
Two figures to watch on the next refresh. The operating-system lead sits at 0.013 percentage points and changed hands once already this year, so it is likely to move. The google vs microsoft market share search demand behind this page is unvalidated: the keyword returns no SERP snapshot in Ahrefs, so the intent may skew toward company valuation rather than platform share.
Methodology and source data
Every figure in this post comes from one of two instruments, both pulled on 7 September 2026 for the first edition and on 1 October 2026 for the Q3 2026 update. The one exception is the revenue and net income comparison in the "Is Google bigger than Microsoft?" section, taken from each company's annual Form 10-K. We did not read earnings calls or reports from Canalys, IDC or Gartner.
Cloudflare Radar REST API. Full calendar month 2026-08-01 to 2026-08-31, with 2025-08-01 to 2025-08-31 as the year-over-year control. Endpoints used, per layer:
- Search referrals:
bots/crawlers/summary/referer, PERCENTAGE normalization. Thevertical=filter works on this endpoint;location=is silently ignored, so no per-country search share is quoted anywhere on this page. - Browsers:
http/summary/browser_family, PERCENTAGE normalization. This is the official grouping. The deprecatedhttp/top/browserendpoint splits Chrome across three user-agent families and would understate it. - Operating systems:
http/summary/os, PERCENTAGE normalization, global and withlocation=set to US, IN, DE, BR, GB and JP. This endpoint does honour the country filter. - Crawling:
bots/summary/bot_operator, PERCENTAGE normalization. - Crawl-to-refer:
bots/crawlers/summary/crawl_refer_ratio, RATIO normalization, 2026-08-24 to 2026-08-31. Longer windows errored on this endpoint when the first edition was written, so that is the only seven-day window on the page and it is never compared against a monthly figure. The Q3 2026 update uses the full quarter, which the endpoint now accepts. - Q3 2026 update: the same endpoints for calendar quarters (Q3 2025, Q2 2026, Q3 2026) and calendar months of 2026, pulled 2026-10-01.
http/summary/oswas pulled twice, for all requests and withbotClass=LIKELY_HUMAN, and its weekly series (http/timeseries_groups/os) was checked againsthttp/timeseries_groups/device_typefor September. The domain ranking was checked on four September dates (8, 15, 22 and 29 September). - Domain ranking:
ranking/top, dated 2026-09-01.
Radar's sample covers Cloudflare's global network and tilts toward the sites Cloudflare fronts. It measures requests and referrals, not installed devices or licensed seats. The google.* referrer is a wildcard that folds Gemini in with Search and cannot be split. The August 2026 versus August 2025 referral comparison spans a February 2026 Cloudflare-side reclassification of TikTok link-outs, which is why this post quotes the level rather than the change.
TechnologyChecker detection corpus. Roughly 29.9 million live domains, crawled continuously. customerCount is a monthly rollup of the domains on which we detected a technology — not customers, not accounts, not seats. Each figure carries its own analysis date and they differ, so no single date applies to the whole set:
| Figure | Domains | Analysed |
|---|---|---|
| Google Tag Manager | 10,584,793 | 2026-08-04 |
| Google Workspace | 3,631,520 | 2026-08-10 |
| Microsoft 365 | 3,748,862 | 2026-08-10 |
| Microsoft Azure | 175,651 | 2026-08-24 |
| Google Cloud | 102,535 | 2026-08-25 |
| Microsoft Clarity | 862,512 | 2026-08-27 |
| Google AdSense | 677,940 | 2026-08-31 |
| Google Analytics | 10,942,935 | 2026-09-04 |
| Microsoft Advertising | 344,173 | 2026-09-04 |
The Q3 2026 update adds September 2026 crawl figures: Microsoft 365 3,978,273, Google Workspace 3,820,175, Google Analytics 11,453,947, Microsoft Clarity 923,836 and Microsoft Advertising 361,034 domains. Google Cloud, Azure, AdSense and Google Tag Manager keep their August figures, because no September value on the same basis was available for the pairs they sit in. Industry shares come from live domains at the 1 October 2026 crawl matched to company records.
Three constraints we held to. Google Cloud's category share and rank are null in our data, so only its raw domain count appears here; deriving a share by summing domain counts across a category double-counts domains running more than one platform. Google Analytics and GA4 are the same product family and are never added together. There is no Microsoft 365 technology profile on this site, so its 3,748,862 figure is quoted from the competitor block of the Google Workspace profile and carries no link.
External figures are attributed and linked at first mention: StatCounter for browser share, Cledara, Medha Cloud, Onix and Brownstone Research for productivity-suite claims, INDmoney and CRN for cloud spend, Digital Applied for Bing's ceiling, and Alphabet's and Microsoft's Form 10-K filings for revenue and net income. Where those sources contradict each other, the contradiction is shown rather than resolved. Cloudflare's own Radar API documentation covers the endpoints and normalization modes listed above.

Data Analyst
5+ years of experience
Emma is a Data Analyst at TechnologyChecker, where she analyses technology adoption data to build better prospect lists and uncover actionable patterns for sales teams.
- BSc Data Science, Cardiff University
- Google Data Analytics Professional Certificate
- Tableau Desktop Certified Associate
Never miss our research