Vercel Statistics: Market Share & Competition Report 2026
Vercel holds 19.58% of PaaS detections in our November 2026 crawl and passed a $500M revenue run rate. Market share, valuation, IPO and Netlify data.
Published •45 min read

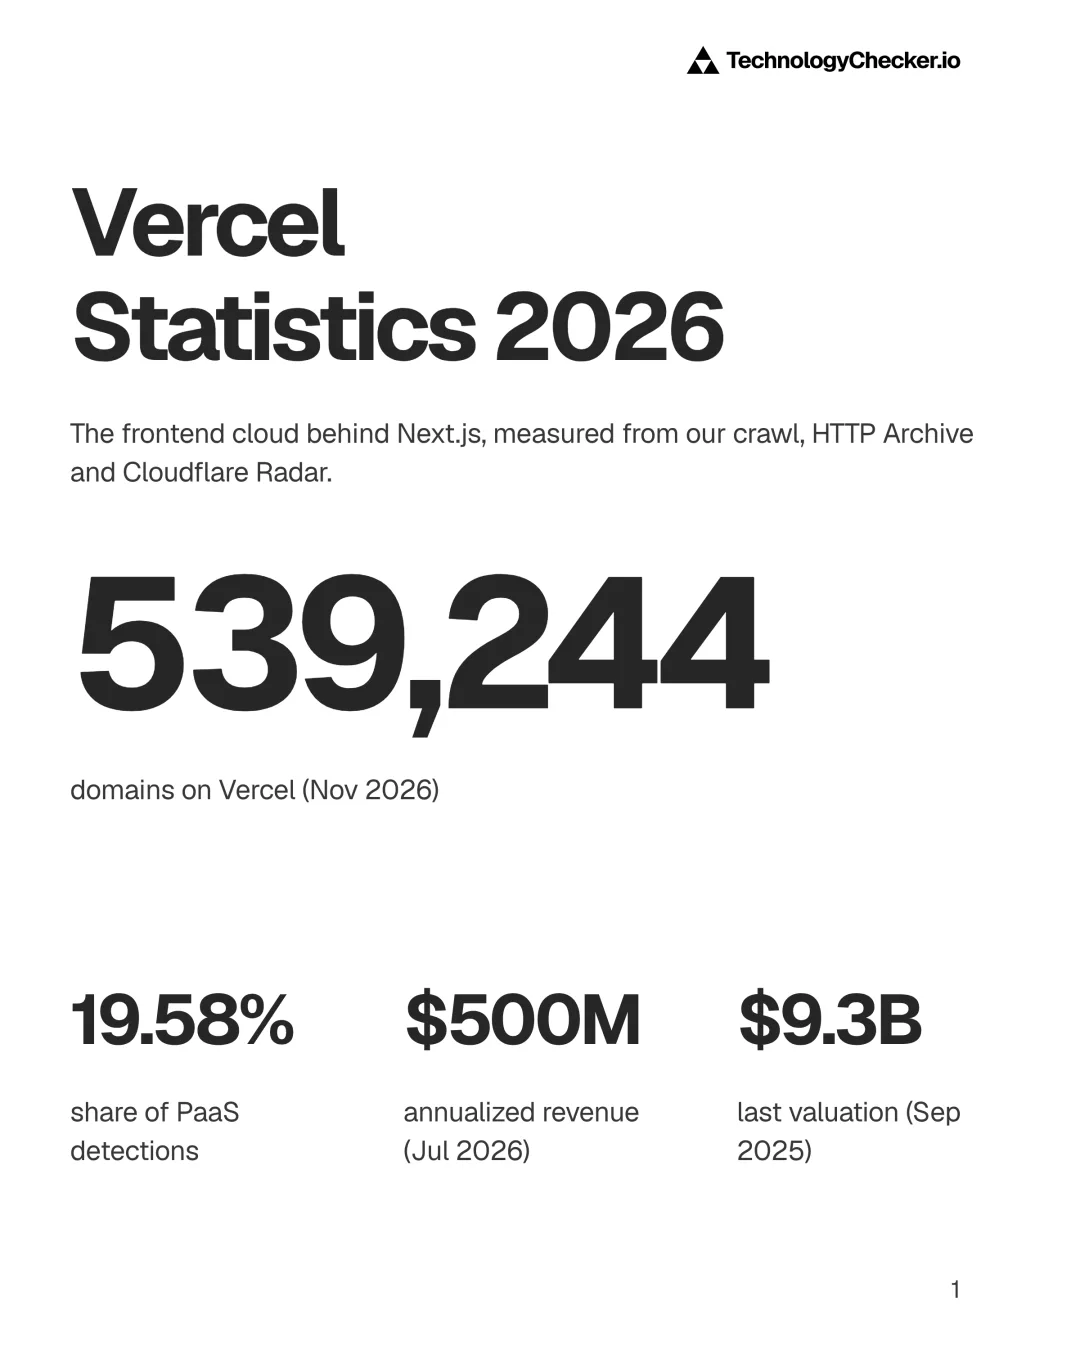
Vercel statistics for 2026, in short: TechnologyChecker.io detects Vercel on 539,244 domains in its November 2026 crawl, 19.58% of all PaaS detections and second only to AWS. The company crossed $500 million in annualized revenue in early July 2026, was last valued at $9.3 billion, and is still privately held.
Report scope: this Vercel statistics report is worldwide and runs from January 2022 to November 2026. The sources are HTTP Archive's monthly crawl (Vercel, Netlify, Next.js and Firebase origins, plus Core Web Vitals from the Chrome UX Report), Cloudflare Radar (ASN lookups, the Cloud Observatory and domain rankings), Vercel's own announcements and press coverage of its revenue and funding, the Stack Overflow and State of JavaScript surveys, npm and GitHub, and TechnologyChecker.io's own detection data: monthly PaaS crawls from June to November 2026 and the enriched Vercel technology profile built on the August 2026 crawl. Methodology, limitations and the full source table are at the end.
Key findings
- TechnologyChecker.io detects Vercel on 539,244 domains in November 2026, 19.58% of PaaS detections, second of 44 platforms behind AWS (TechnologyChecker.io).
- Vercel's share of the PaaS category rose from 16.70% in June 2026 to 19.58% in November, while AWS fell from 40.21% to 37.05% (TechnologyChecker.io).
- HTTP Archive counted 161,276 Vercel origins in September 2026, up 90% from January, against 53% growth across all of 2025, while the crawl itself shrank (HTTP Archive).
- In eight months of 2026 Vercel added 76,265 origins to HTTP Archive's count, almost as many as the 77,058 it added in the four years from January 2022 to January 2026 (HTTP Archive, our arithmetic).
- Vercel crossed $500 million in annualized run-rate revenue in early July 2026, up from $200 million in May 2025 and $100 million in early 2024 (Vercel; The Information).
- Run-rate revenue grew 2.5x from May 2025 to July 2026 while Vercel's HTTP Archive origins grew 2.22x, so Vercel's revenue tracks its visible web footprint (Vercel; HTTP Archive).
- Vercel was valued at $9.3 billion post-money at its September 2025 Series F and has raised $863 million of primary capital; it is private and has no public stock (Vercel; TechCrunch).
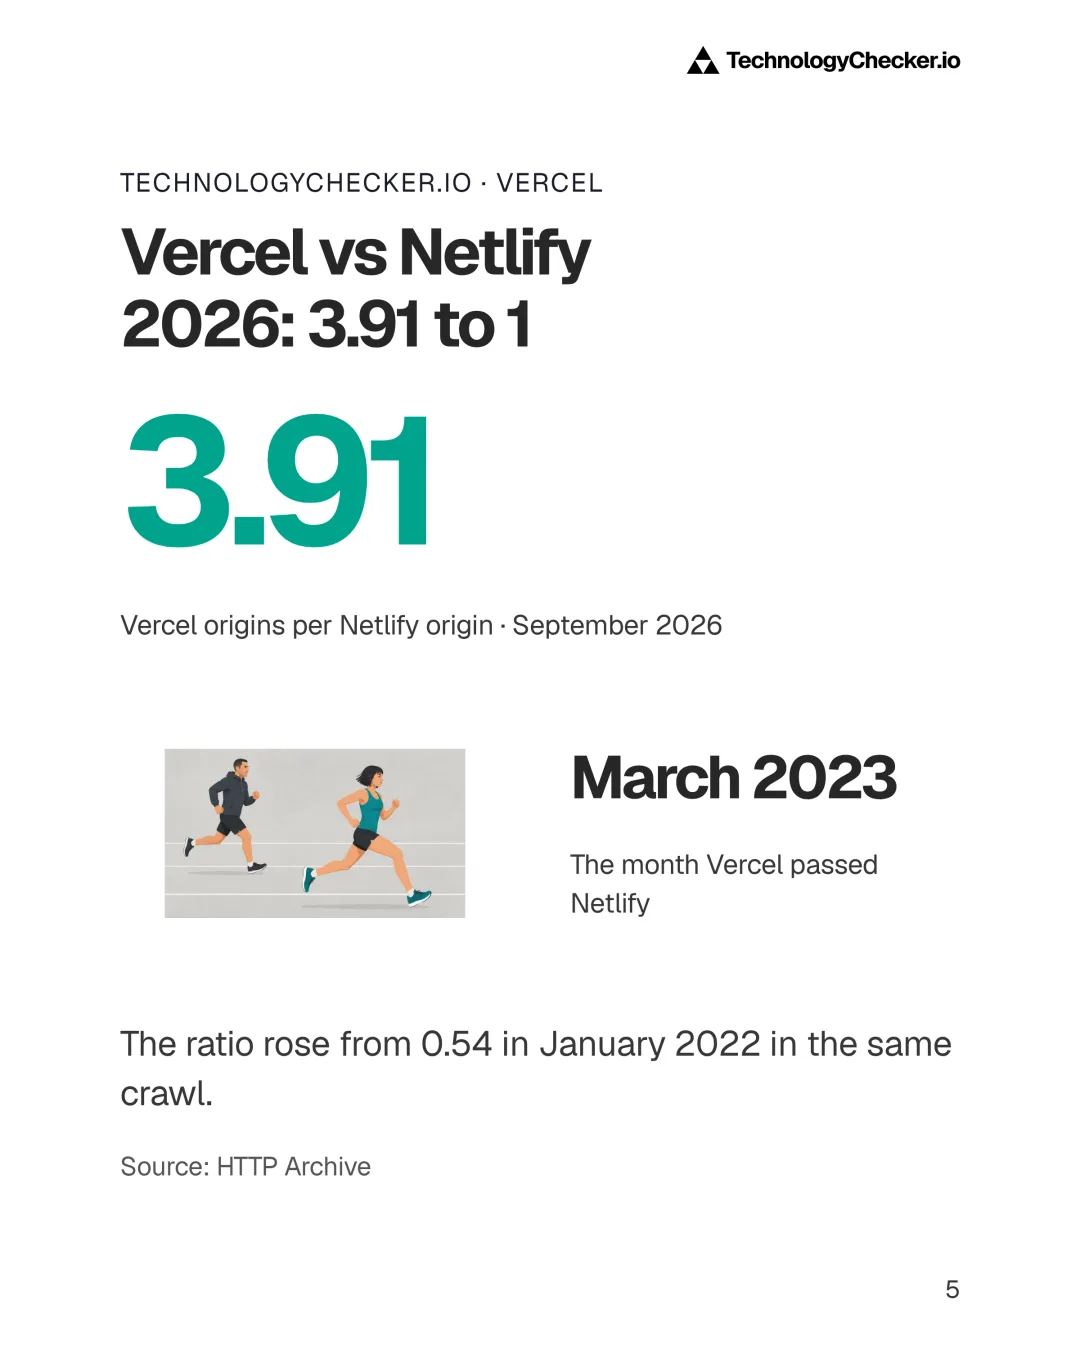
- Vercel went from 0.54 origins per Netlify origin in January 2022 to 3.91 in September 2026, passing Netlify in March 2023 and Firebase in February 2026 (HTTP Archive).
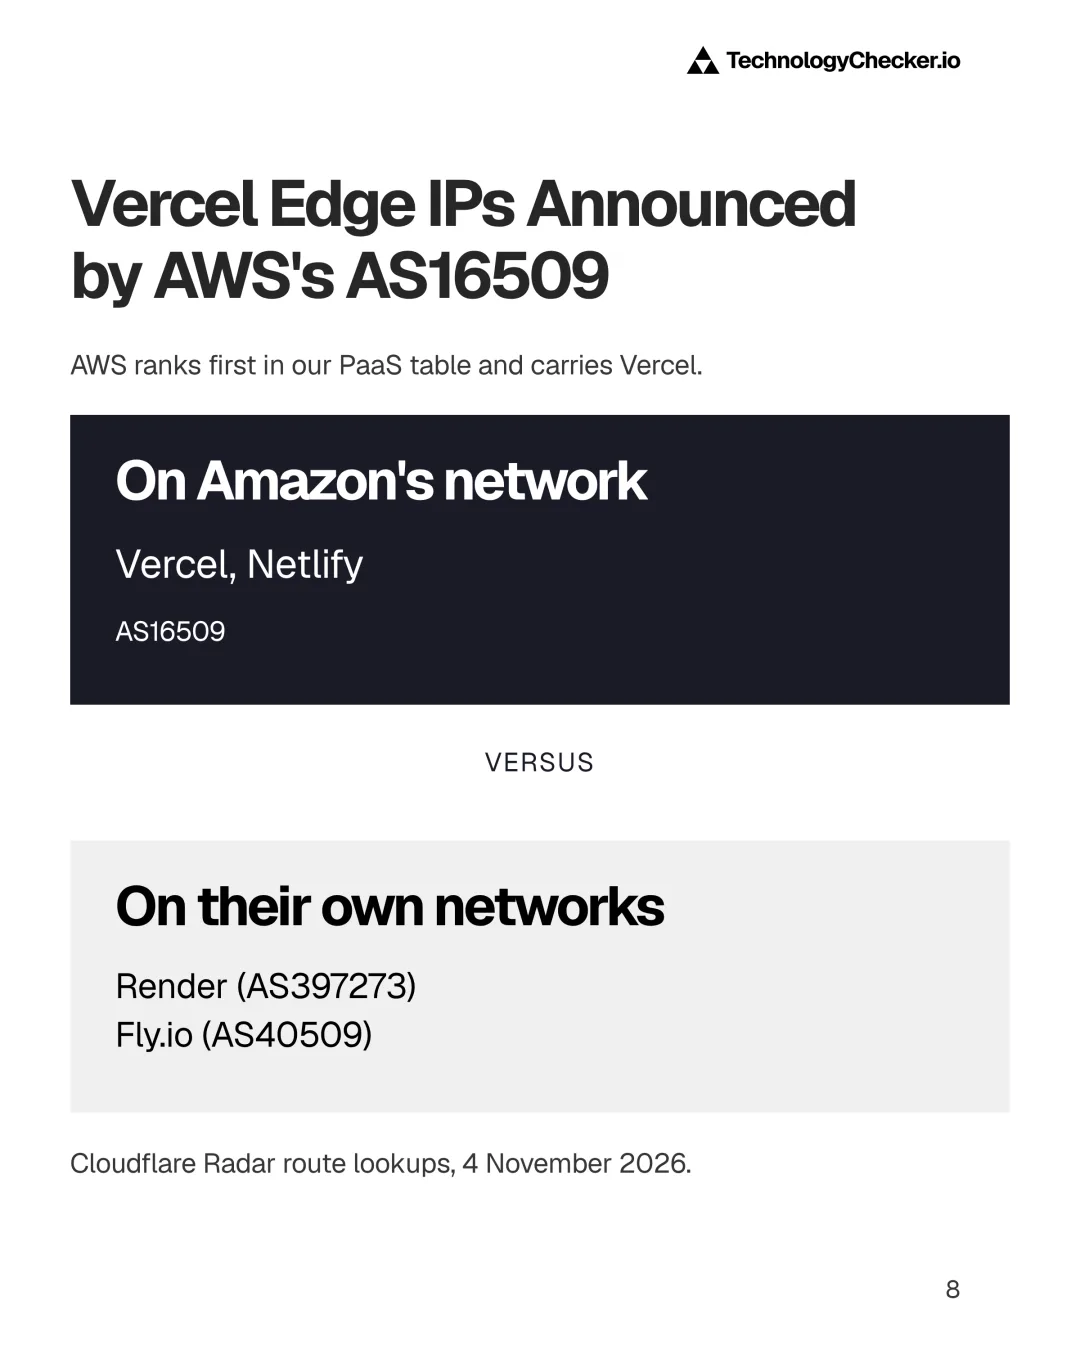
- Every Vercel edge address we looked up is announced by AS16509, Amazon's network, and so are Netlify's; Render and Fly.io announce their own (Cloudflare Radar, 4 November 2026).
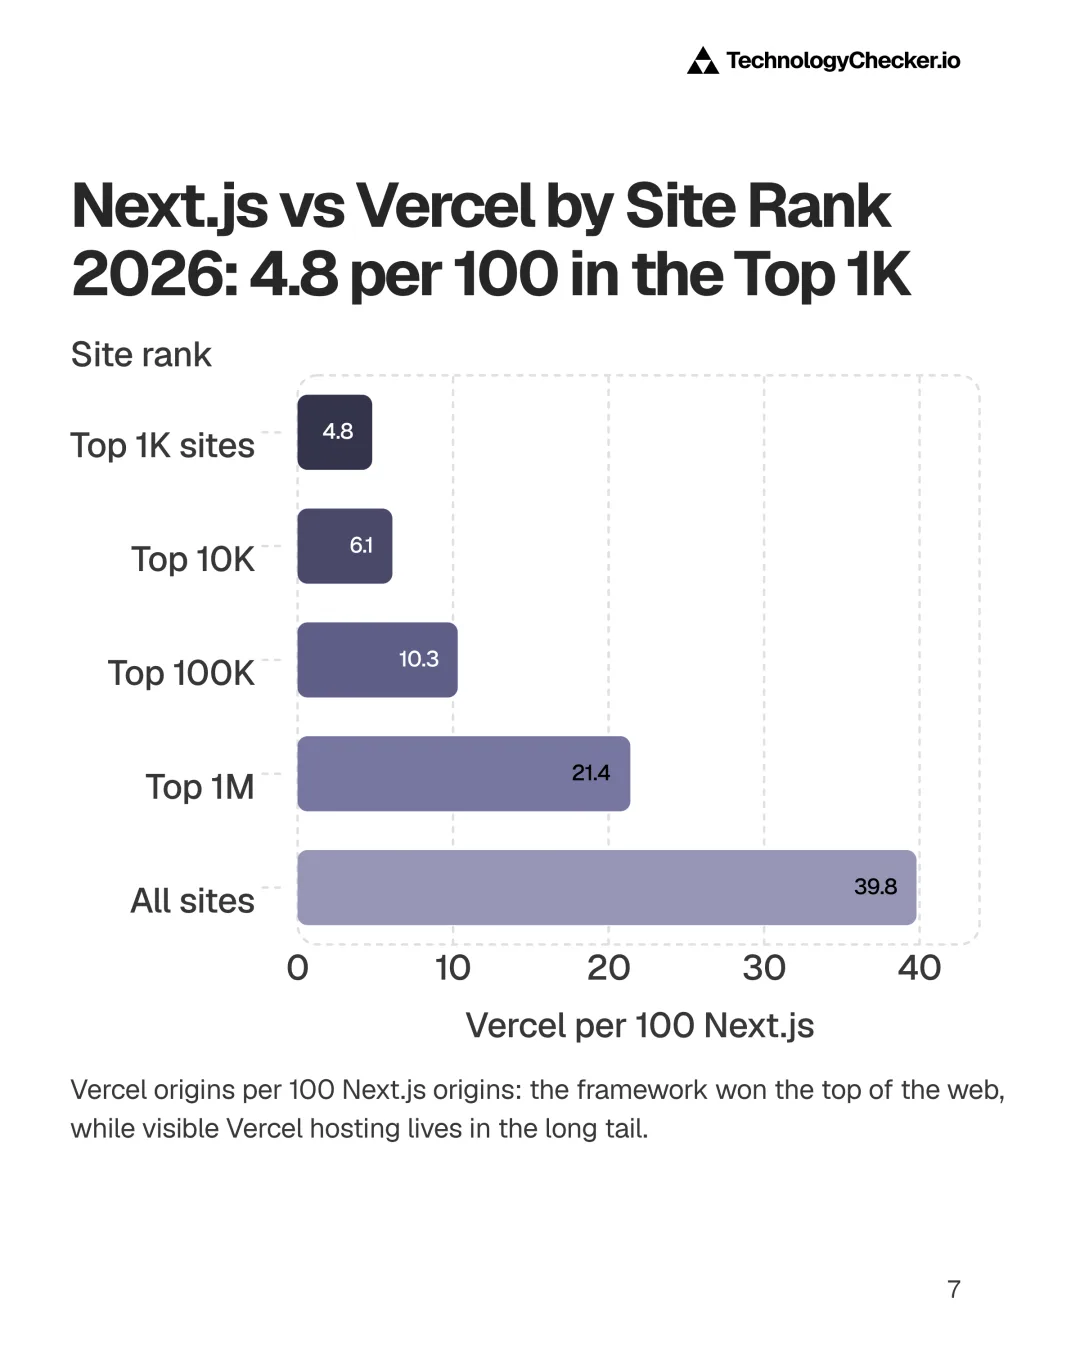
- Among the top 1,000 sites there are 4.8 Vercel origins per 100 Next.js origins, against 39.8 across all sites (HTTP Archive, September 2026).
- 67.77% of Vercel domains run Next.js and 72.95% run Tailwind CSS, against 14.05% and 36.70% on Netlify (TechnologyChecker.io).
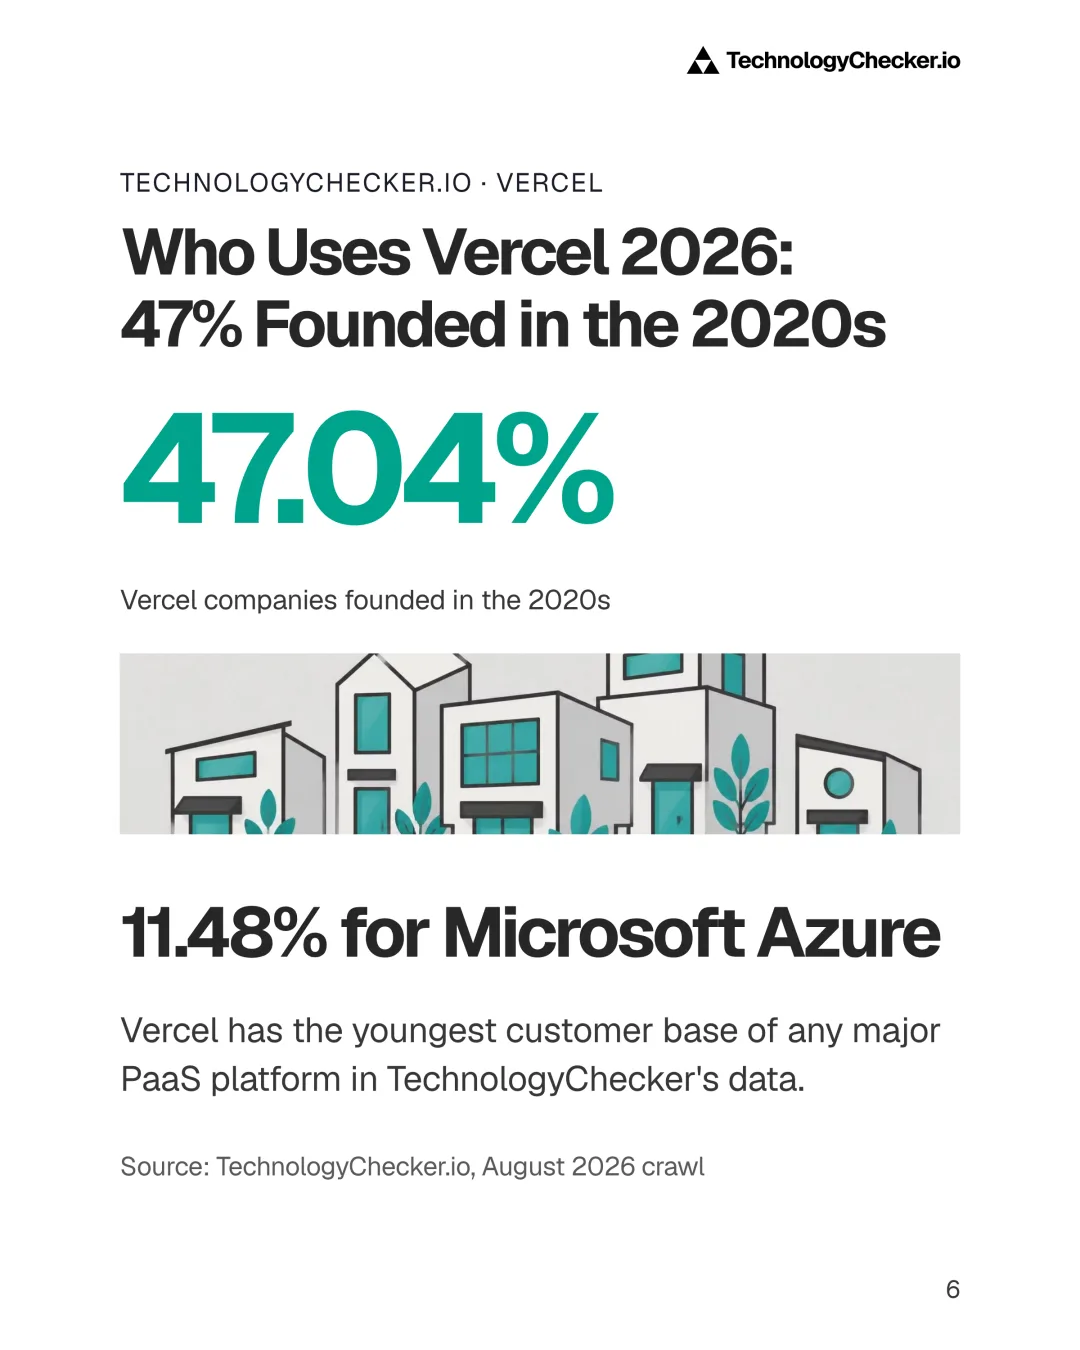
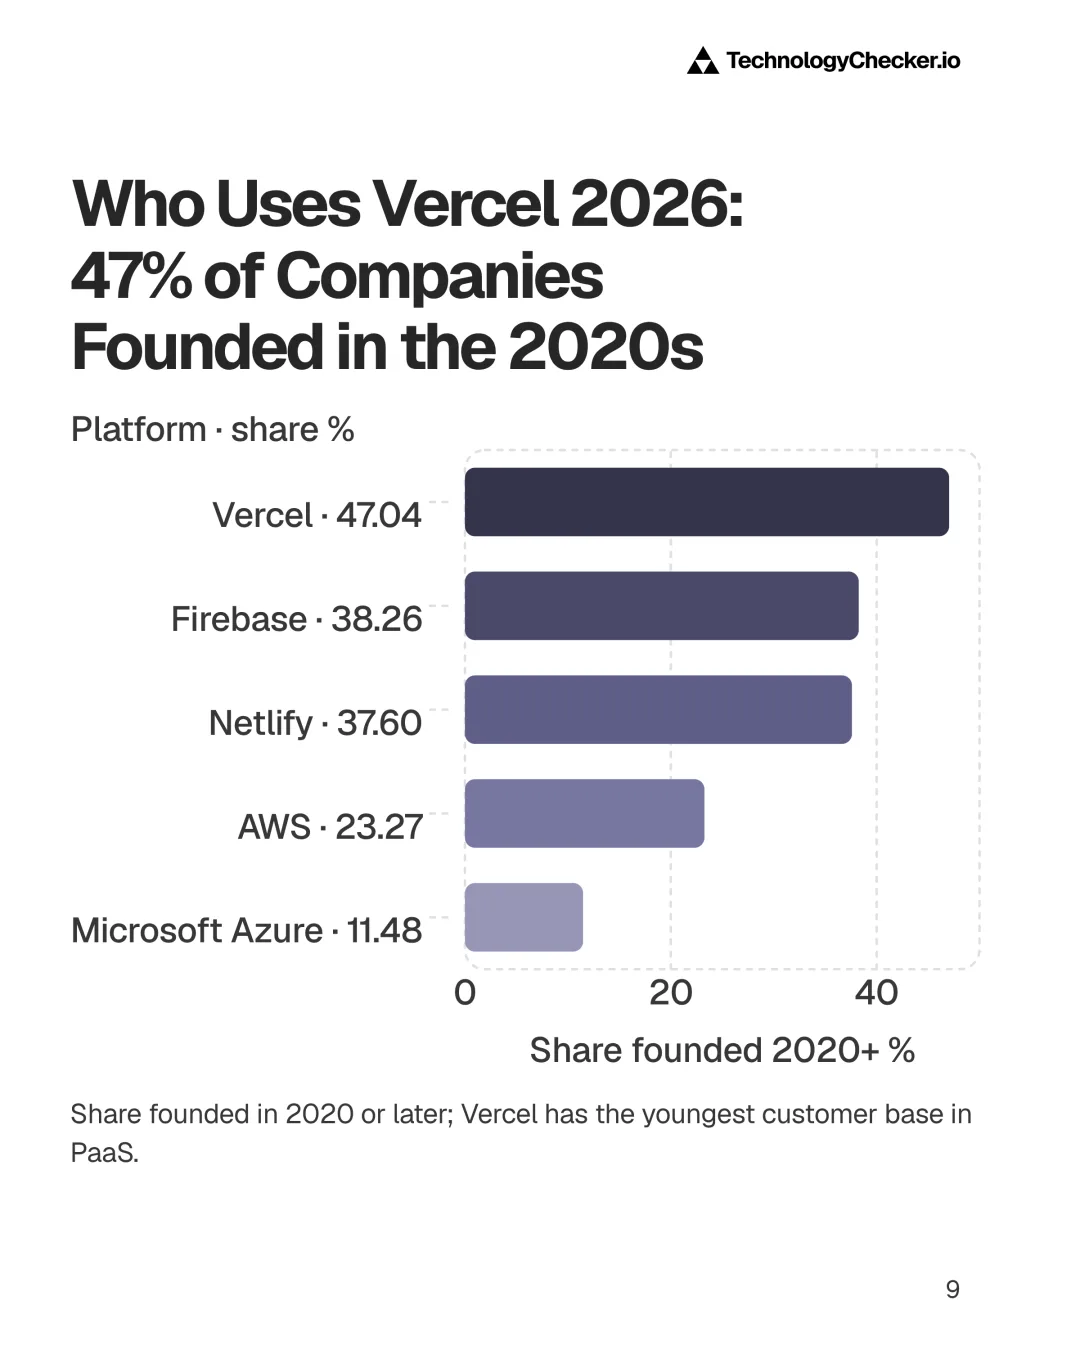
- 47.04% of companies on Vercel were founded in the 2020s, the youngest base of any major platform we track (TechnologyChecker.io).
- 43.4% of Vercel origins pass Core Web Vitals on mobile, up from 37.2% a year earlier and ahead of Next.js sites overall at 35.7% (HTTP Archive, Chrome UX Report).
The six headline numbers as cards, each with its source on the card:
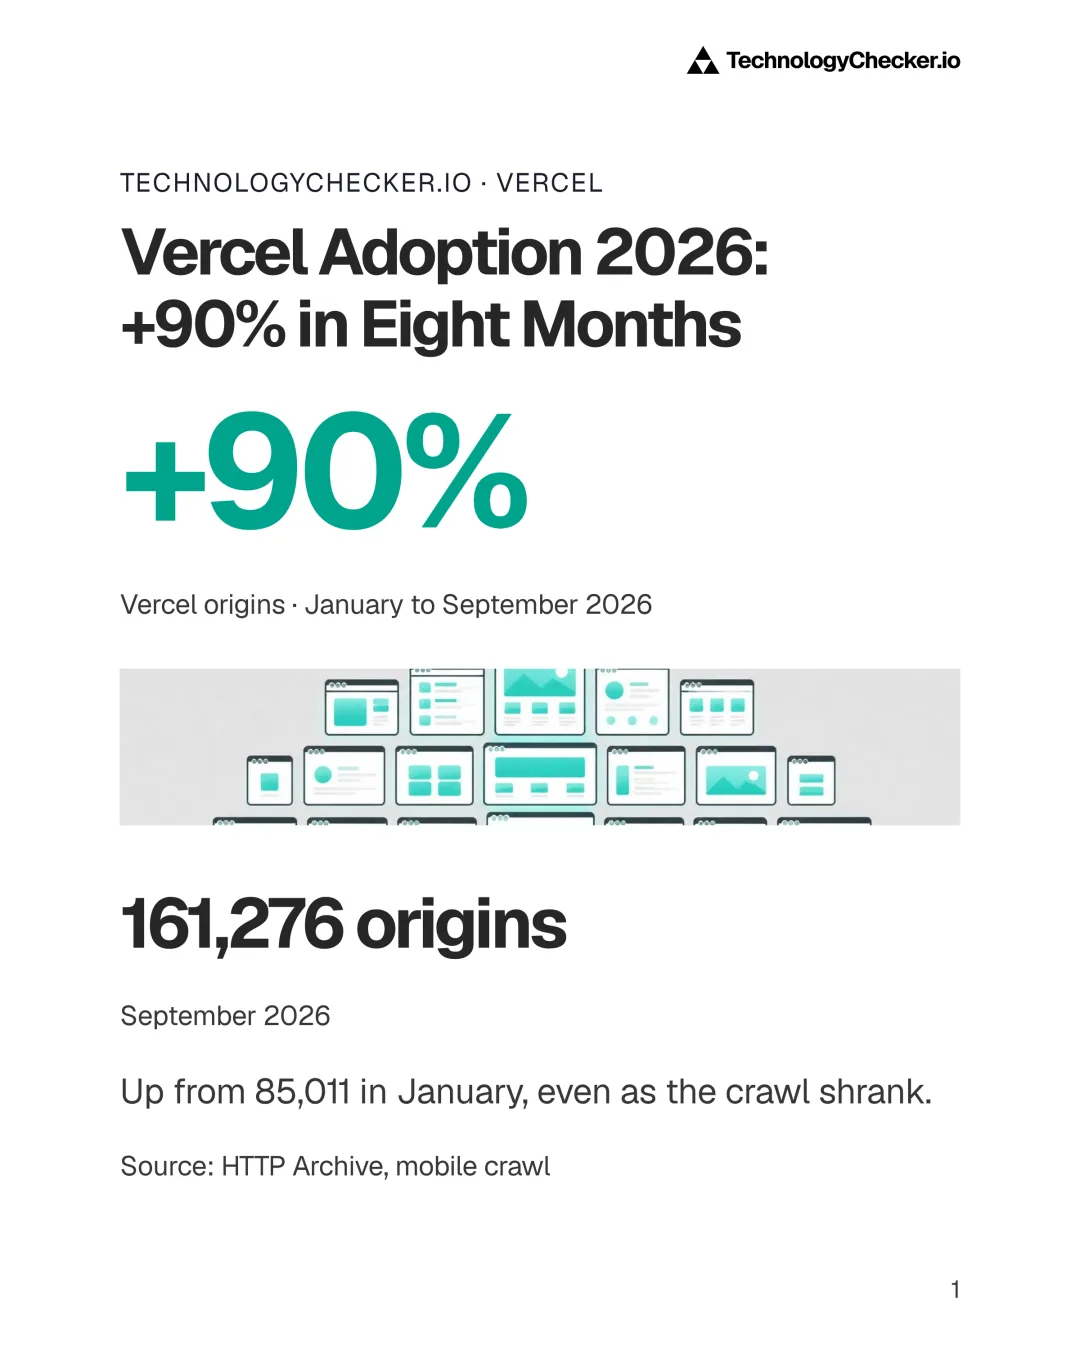
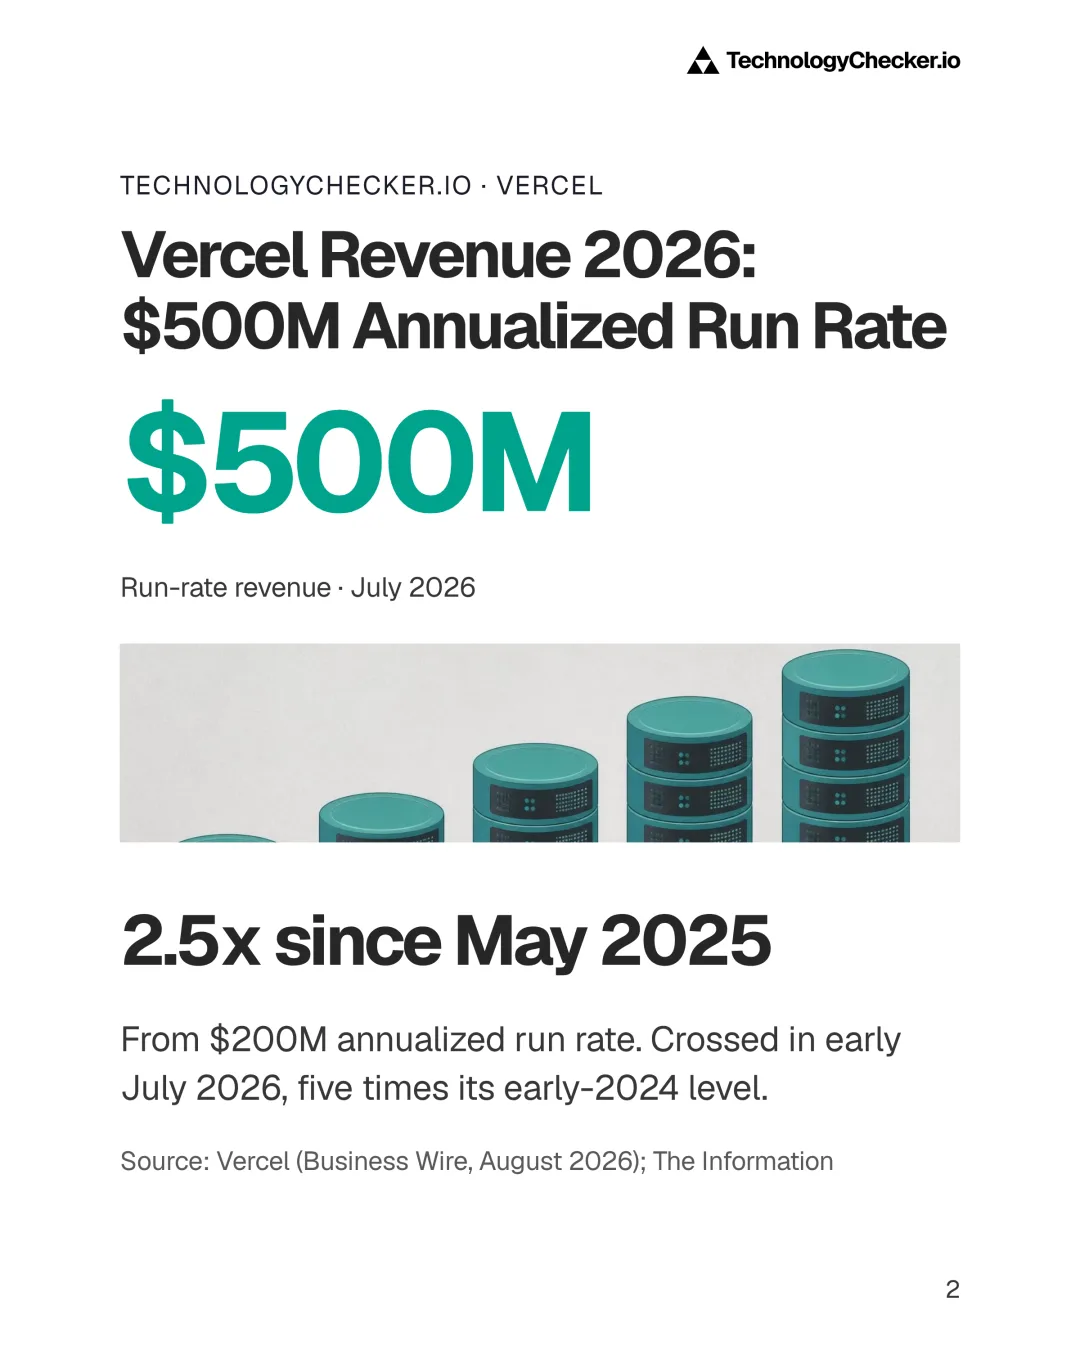
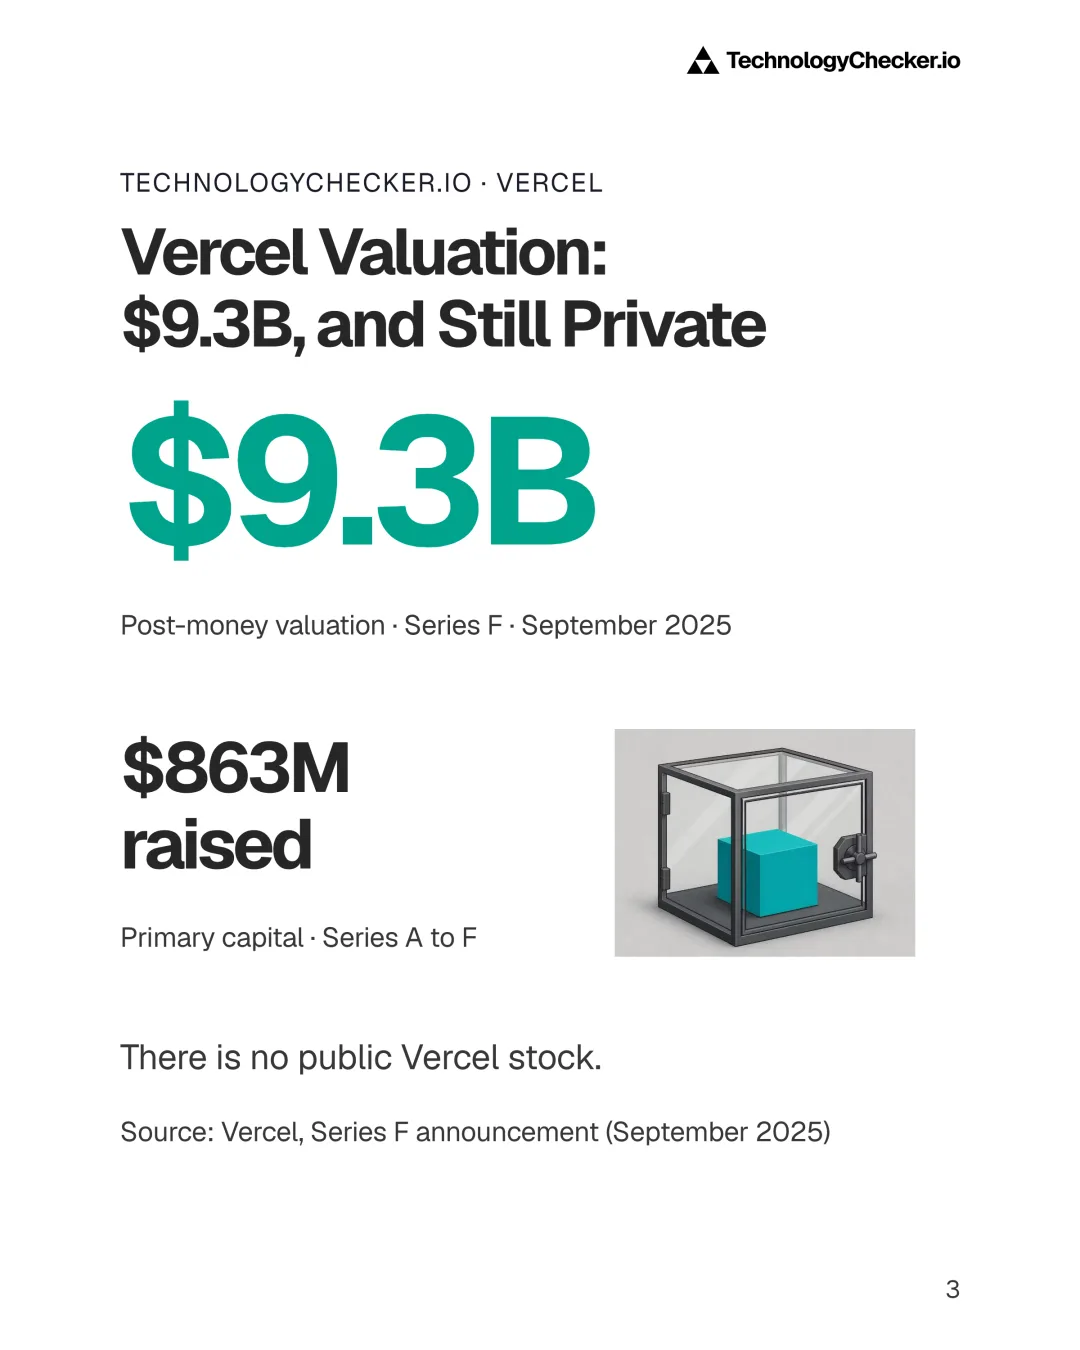
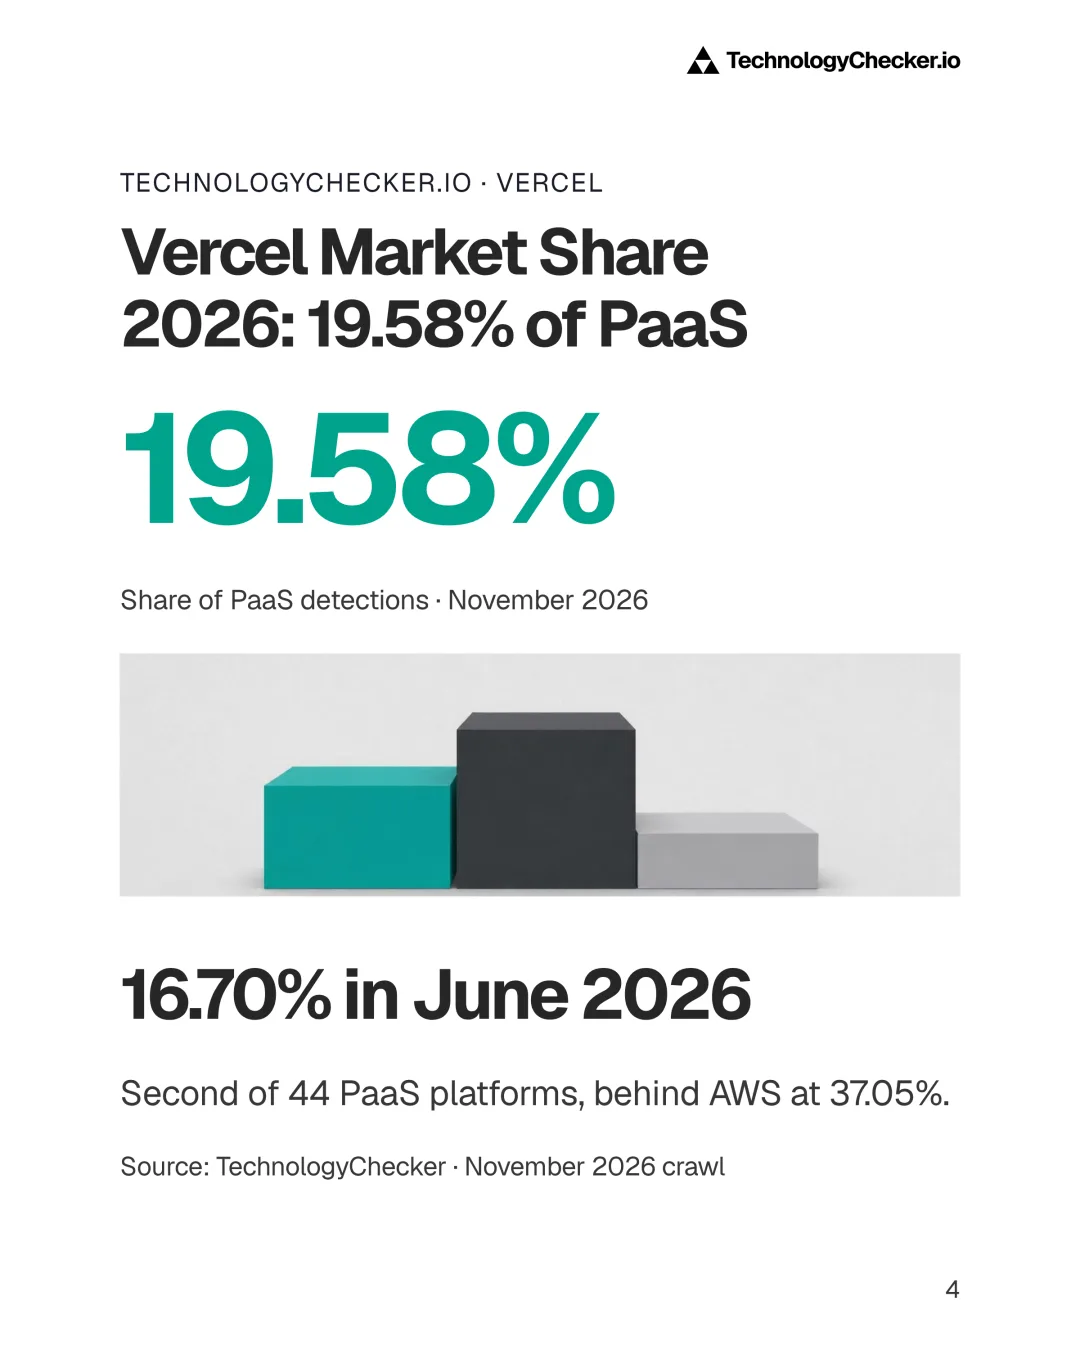
The 2026 update: Vercel's adoption curve bent upward
Vercel's adoption accelerated in 2026, and two instruments that share no data agree on it. HTTP Archive counted 161,276 Vercel origins in September 2026, up 90% from January, and Vercel's share of the PaaS category in our own crawl rose from 16.70% in June to 19.58% in November.
HTTP Archive is the independent half of that pair. It crawls the home pages of roughly 8.7 to 9.9 million origins a month on mobile and records the hosting provider behind each one, so it gives a long public series on Vercel adoption that owes nothing to us. It found Vercel on 7,953 origins in January 2022, where our series starts.
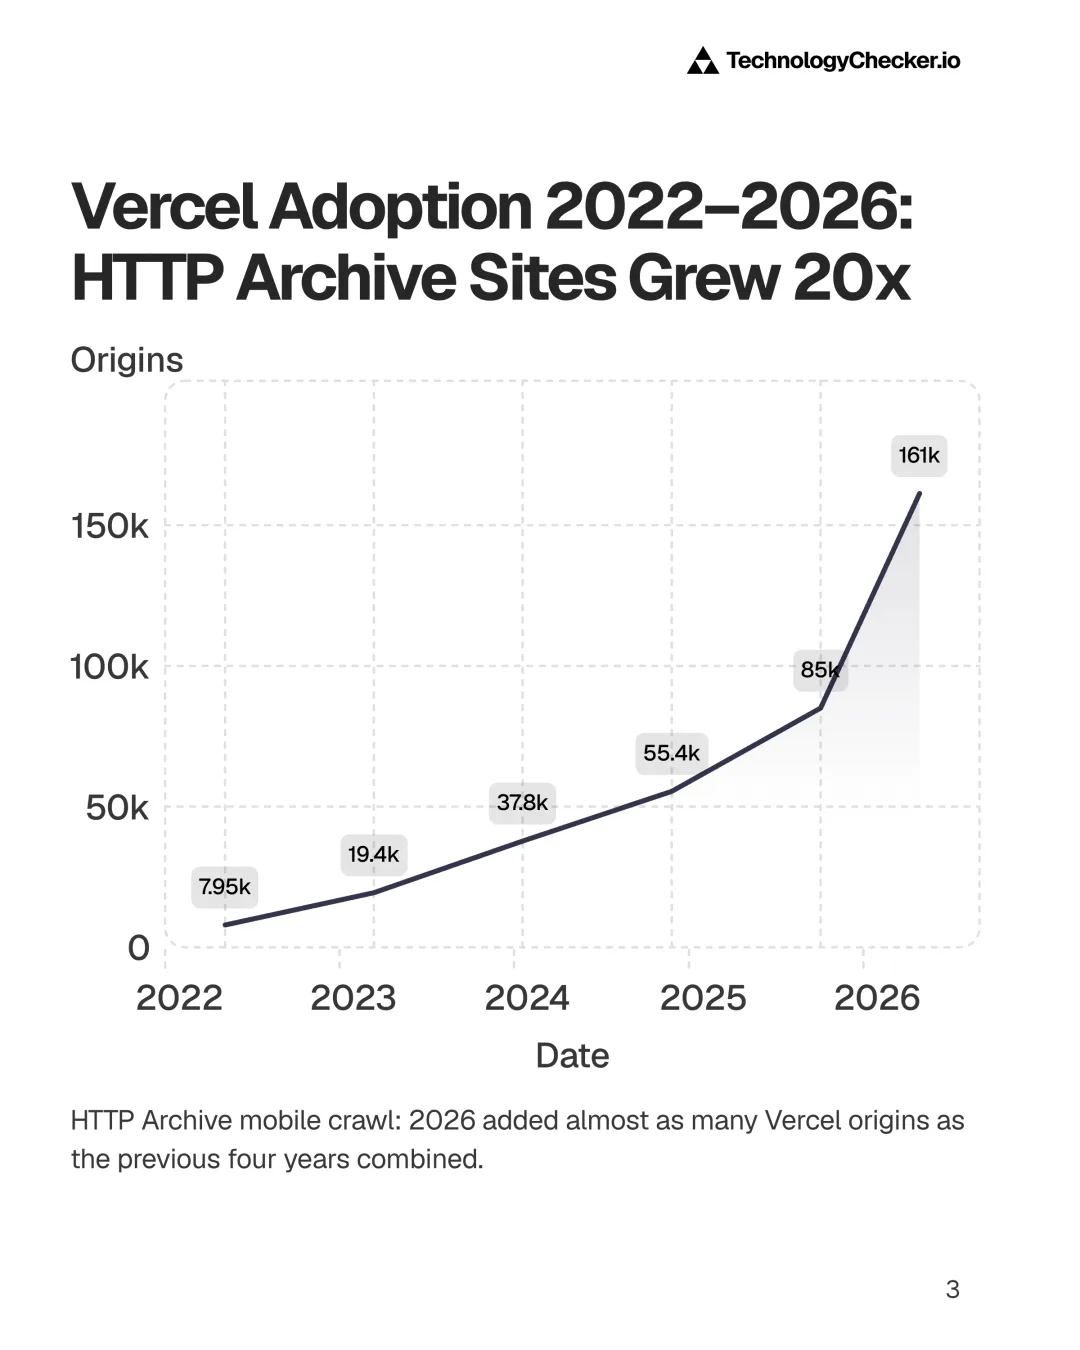
Vercel Sites in the HTTP Archive Grew 20x Since 2022
The HTTP Archive detected Vercel on 7,953 origins in January 2022 and 161,276 in September 2026, while the crawl itself stayed between roughly 8.7 and 9.9 million origins after 2022. Growth accelerated in 2026: 85,011 in January became 161,276 in September, a 90% rise in eight months, against 53% across the whole of 2025.
Source: HTTP Archive · Jan 2022 - Sep 2026
| Month | Vercel origins (mobile crawl) |
|---|---|
| Jan 2022 | 7953 |
| Apr 2022 | 8722 |
| Jul 2022 | 10779 |
| Oct 2022 | 16271 |
| Jan 2023 | 19417 |
| Apr 2023 | 23478 |
| Jul 2023 | 29168 |
| Oct 2023 | 33433 |
| Jan 2024 | 37767 |
| Apr 2024 | 42581 |
| Jul 2024 | 46207 |
| Oct 2024 | 51553 |
| Jan 2025 | 55440 |
| Apr 2025 | 58730 |
| Jul 2025 | 66674 |
| Oct 2025 | 76203 |
| Jan 2026 | 85011 |
| Apr 2026 | 102625 |
| Jul 2026 | 133935 |
| Sep 2026 | 161276 |
- 7,953 origins in January 2022, 161,276 in September 2026
- Share of the crawl rose from 0.13% to 1.85% while the crawl size barely moved
- 2026 is the steepest stretch: +90% from January to September
- Vercel passed Firebase in February 2026 on this measure
| Month | Vercel origins | Change since previous row |
|---|---|---|
| January 2022 | 7,953 | — |
| January 2023 | 19,417 | +144.1% |
| January 2024 | 37,767 | +94.5% |
| January 2025 | 55,440 | +46.8% |
| January 2026 | 85,011 | +53.3% |
| September 2026 | 161,276 | +89.7% (eight months) |
Source: HTTP Archive, mobile crawl, all rank tiers. Vercel's share of the crawl rose from 0.13% in January 2022 to 1.85% in September 2026. Growth rates are our arithmetic on HTTP Archive's counts.
Read the right-hand column from the top. Growth slowed for three straight years, from +144.1% to +46.8%, which is what a maturing product usually looks like. Then the curve turned: +53.3% across 2025, and +89.7% in only the first eight months of 2026. Year over year the jump is steeper still, from 74,003 origins in September 2025 to 161,276, a rise of 118%.
The crawl didn't grow to produce that. HTTP Archive measured 9,086k origins in October 2025 and 8,739k in September 2026, so the denominator shrank while Vercel's count nearly doubled.
Our crawl shows the same turn. TechnologyChecker.io measures every PaaS platform inside one monthly crawl, so Vercel's share of that month's detections is the number I trust for the trend.
Vercel's Share of the PaaS Category Rose to 19.58%
TechnologyChecker.io detected Vercel on 283,959 domains in June 2026 (16.70% of the PaaS category) and 539,244 in November 2026 (19.58%). Over the same months AWS fell from 40.21% to 37.05%. Both shares are computed inside one crawl each month, so they are not inflated by the crawl itself growing.
Source: technologychecker.io/category/paas · Jun 2026 - Nov 2026
| Month | Share of PaaS detections (%) |
|---|---|
| Jun 2026 | 16.7% |
| Jul 2026 | 16.09% |
| Aug 2026 | 16.64% |
| Sep 2026 | 18.38% |
| Oct 2026 | 18.81% |
| Nov 2026 | 19.58% |
- 16.70% in June 2026, 19.58% in November 2026
- AWS fell from 40.21% to 37.05% over the same months
- 539,244 active Vercel domains in the November crawl
| Month (2026) | Vercel share of PaaS | Vercel active domains | AWS share of PaaS | Vercel domains per Netlify domain | Vercel domains per 100 Next.js domains |
|---|---|---|---|---|---|
| June | 16.70% | 283,959 | 40.21% | 2.31 | 52.2 |
| July | 16.09% | 352,171 | 39.71% | 2.47 | 52.5 |
| August | 16.64% | 389,653 | 39.98% | 2.52 | 53.2 |
| September | 18.38% | 479,716 | 38.32% | 2.58 | 56.0 |
| October | 18.81% | 507,196 | 37.66% | 2.61 | 56.1 |
| November | 19.58% | 539,244 | 37.05% | 2.67 | 57.0 |
Source: TechnologyChecker.io crawl, June to November 2026. Shares are of all active domains across the 44 technologies in our PaaS category; a domain running two platforms counts once for each. Ratios are our arithmetic on the same monthly counts.
Vercel gained 2.88 points of share over those five months while Amazon Web Services gave up 3.16 points and Firebase 1.37. The rise wasn't a straight line. July dipped to 16.09% before September jumped to 18.38%, so I read June to August as flat and the real move as an autumn one.
Is the jump real, or is our crawler growing?
Both, and they need separating. Our raw Vercel count went from 283,959 domains in June to 539,244 in November, and most of that rise is our coverage expanding, so this report never quotes it as growth. Shares and ratios are computed inside one crawl, where coverage growth lifts every platform at once.
Three ratios move in the same direction. Vercel domains per Netlify domain went from 2.31 to 2.67 in our crawl. Vercel domains per 100 Next.js domains went from 52.2 to 57.0, against 945,958 Next.js domains in November. And HTTP Archive, which has no connection to our crawler, shows Vercel origins per 100 Next.js origins rising from 22.6 in January 2022 to 39.8 in September 2026.
HTTP Archive also caught a milestone. Vercel passed Firebase in HTTP Archive in February 2026, at 91,627 origins against 88,753, three years after it passed Netlify. By September Firebase stood at 92,856 and Vercel at 161,276.
Why 2026? My hypothesis is coding agents
This is my reading, not a measured result: the bend arrives in the same months that coding agents started deploying to Vercel at scale. Vercel's own figures put agents at a majority of its deployments by mid-2026:
- On 17 June 2026, Vercel said fewer than 3% of deployments were agent-triggered six months earlier, and that agents now accounted for more than half. AI Gateway tokens grew from about 2 trillion to about 20 trillion a month over the same stretch.
- In April 2026, CEO Guillermo Rauch told TechCrunch that 30% of the apps running on Vercel came from agents.
- In July 2026, Vercel was seeing 6 million deployments a day, half of them agent-triggered, with more than 1 trillion AI Gateway tokens a day.
- At Ship 2026 on 15 October, Vercel said its developer count had grown 3x and their agent-triggered deployments 28x over twelve months. It gave no absolute count.
The second piece of evidence is Netlify. Its HTTP Archive count sat around 26,000 to 28,000 origins through 2024 and 2025, then rose 48% between January and September 2026, from 27,862 to 41,235. Something lifted both frontend clouds in the same months, and a Vercel-specific cause such as a pricing change or a Next.js release wouldn't do that.
What I can't show is the mechanism. Neither HTTP Archive nor our crawl records who or what created a deployment, so the link between agents and new origins is a coincidence of timing until someone measures it directly. Cloudflare Radar's generative-AI services ranking for 3 November 2026 puts Cursor at #11, Replit at #22 and lovable.dev at #25 out of 40, with v0 absent. Radar can't say where those tools' sites are hosted, so I won't extrapolate.
How much revenue does Vercel make?
Vercel crossed $500 million in annualized run-rate revenue in early July 2026, according to a company release published on 6 August 2026. Vercel is private and publishes no financial statements, so its revenue history is four reported milestones rather than a filing.
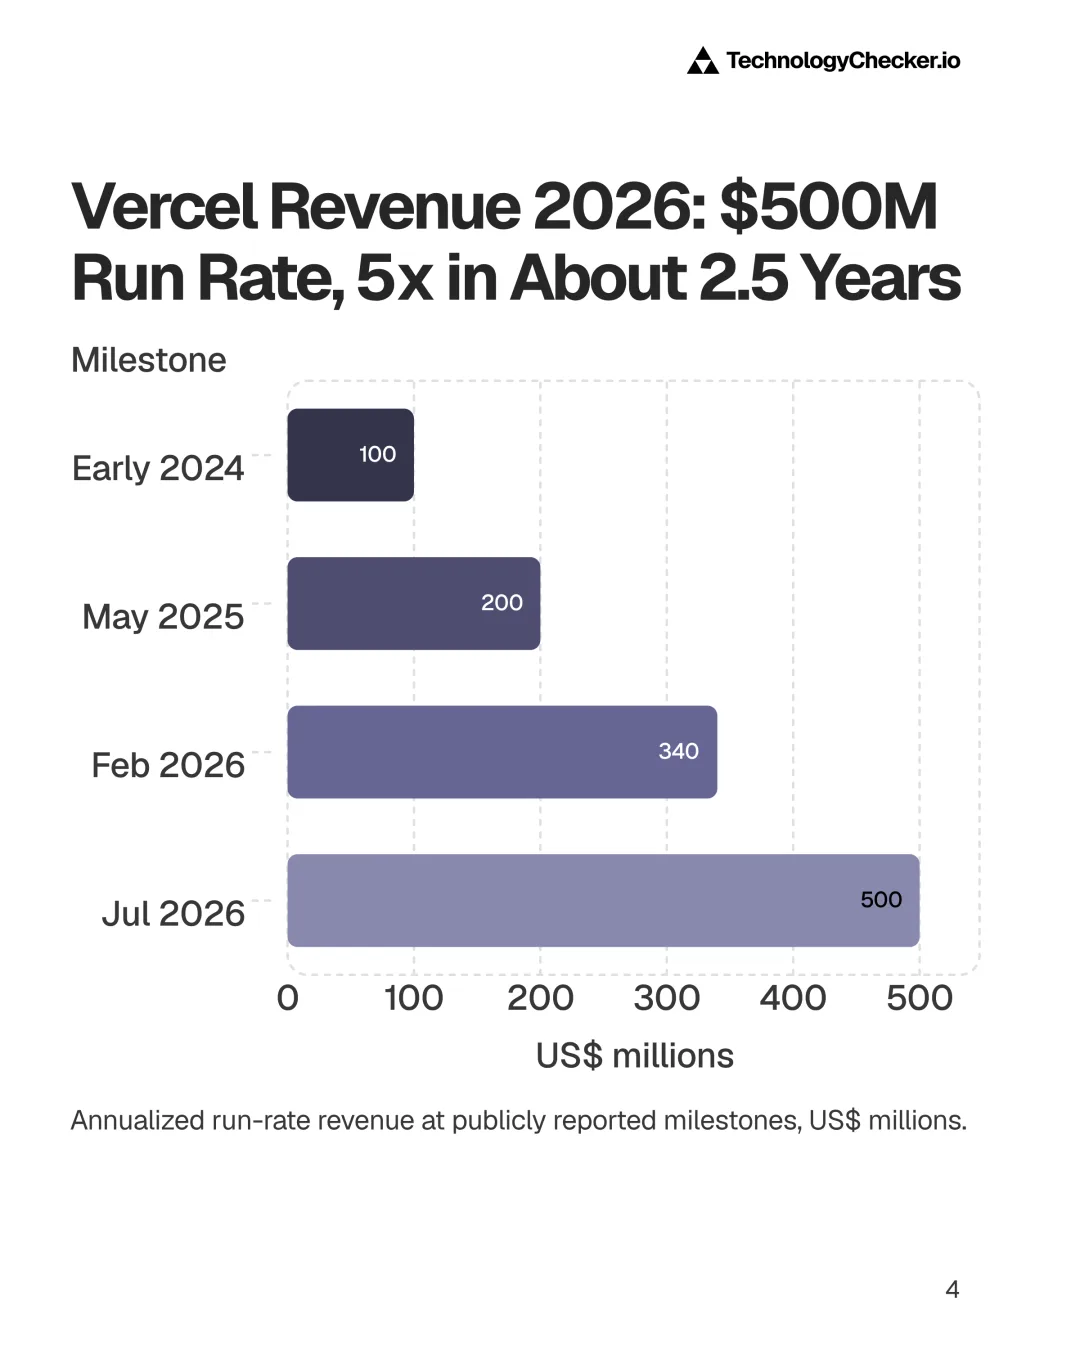
Vercel Went From $100M to $500M in Annualized Revenue in About 2.5 Years
Vercel said it had passed $100 million in annualized revenue when it raised its Series E in May 2024, about 15 months before reaching $200 million in May 2025. Run-rate revenue was $340 million at the end of February 2026, and Vercel said it crossed $500 million in early July 2026.
Source: Vercel; The Information; Forbes via TechCrunch · Early 2024 - Jul 2026
| Milestone | Annualized revenue (US$ millions) |
|---|---|
| Early 2024 | $100M |
| May 2025 | $200M |
| Feb 2026 | $340M |
| Jul 2026 | $500M |
- $100M in early 2024, $500M by early July 2026
- The first doubling took about 15 months; the next 2.5x took about 14
- Vercel reported 82% year-over-year top-line growth at its September 2025 Series F
| Milestone | Annualized revenue | Reported by | Time since previous milestone |
|---|---|---|---|
| Early 2024 | $100M+ | Vercel, at its May 2024 Series E | — |
| May 2025 | $200M ARR | The Information, listed on Vercel's press page | About 15 months |
| End of February 2026 | $340M run rate | Forbes, as reported by TechCrunch | About 9 months |
| Early July 2026 | $500M run rate | Vercel | About 4 months |
Sources: Vercel's Series E release (May 2024); Vercel's press page summarising The Information (June 2025); TechCrunch citing Forbes (April 2026); Vercel via Business Wire (August 2026). Run-rate figures, not audited annual revenue.
The first doubling, from $100 million to $200 million, took about 15 months. The next 2.5x took about 14. When it closed its Series F in September 2025, Vercel reported 82% top-line growth year over year and said its user base had doubled in a year.
Two things the milestones don't tell you. Vercel hasn't published profit or loss and I found no verified figure, so "is Vercel profitable?" has no sourced answer today. And run-rate revenue is a recent month or quarter projected over a year, so a strong month flatters it.
Revenue tracks Vercel's web footprint, unlike Google Cloud's
Vercel's run-rate revenue rose 2.5x between May 2025 and July 2026, and its HTTP Archive origins rose 2.22x over the same months, from 60,285 to 133,935. The money and the visible web footprint moved almost together.
| Window | Run-rate revenue | HTTP Archive Vercel origins |
|---|---|---|
| Early 2024 to May 2025 | 2.0x ($100M to $200M) | 1.52x (39,750 in February 2024 to 60,285 in May 2025) |
| May 2025 to July 2026 | 2.5x ($200M to $500M) | 2.22x (60,285 to 133,935) |
Sources: Vercel, The Information (revenue); HTTP Archive (origins). Multiples are our arithmetic.
My reading: in 2024 and early 2025 revenue outran the footprint, so Vercel was earning more per site, which fits enterprise contracts and usage billing growing faster than the site count. From mid-2025 the footprint caught up. Treat it as a rough comparison, because run-rate is a financial figure and origins are a crawl count, and neither measures the other cleanly.
Google Cloud is the opposite case. In our Google Cloud statistics report, Google Cloud's share of the web traffic Cloudflare routes to the big clouds stayed flat for 22 months while its quarterly revenue doubled, because most of the new money came from compute that generates no web requests. Vercel's revenue does show up on the public web. For Vercel, a crawl is a usable gauge of the business; for Google Cloud it isn't.
Vercel valuation, funding and IPO status
Vercel was valued at $9.3 billion post-money when it raised a $300 million Series F on 30 September 2025, co-led by Accel and GIC, as Vercel's own Series F post confirms. A secondary tender of about $300 million for employees, former employees and early investors ran alongside it and closed in November 2025.
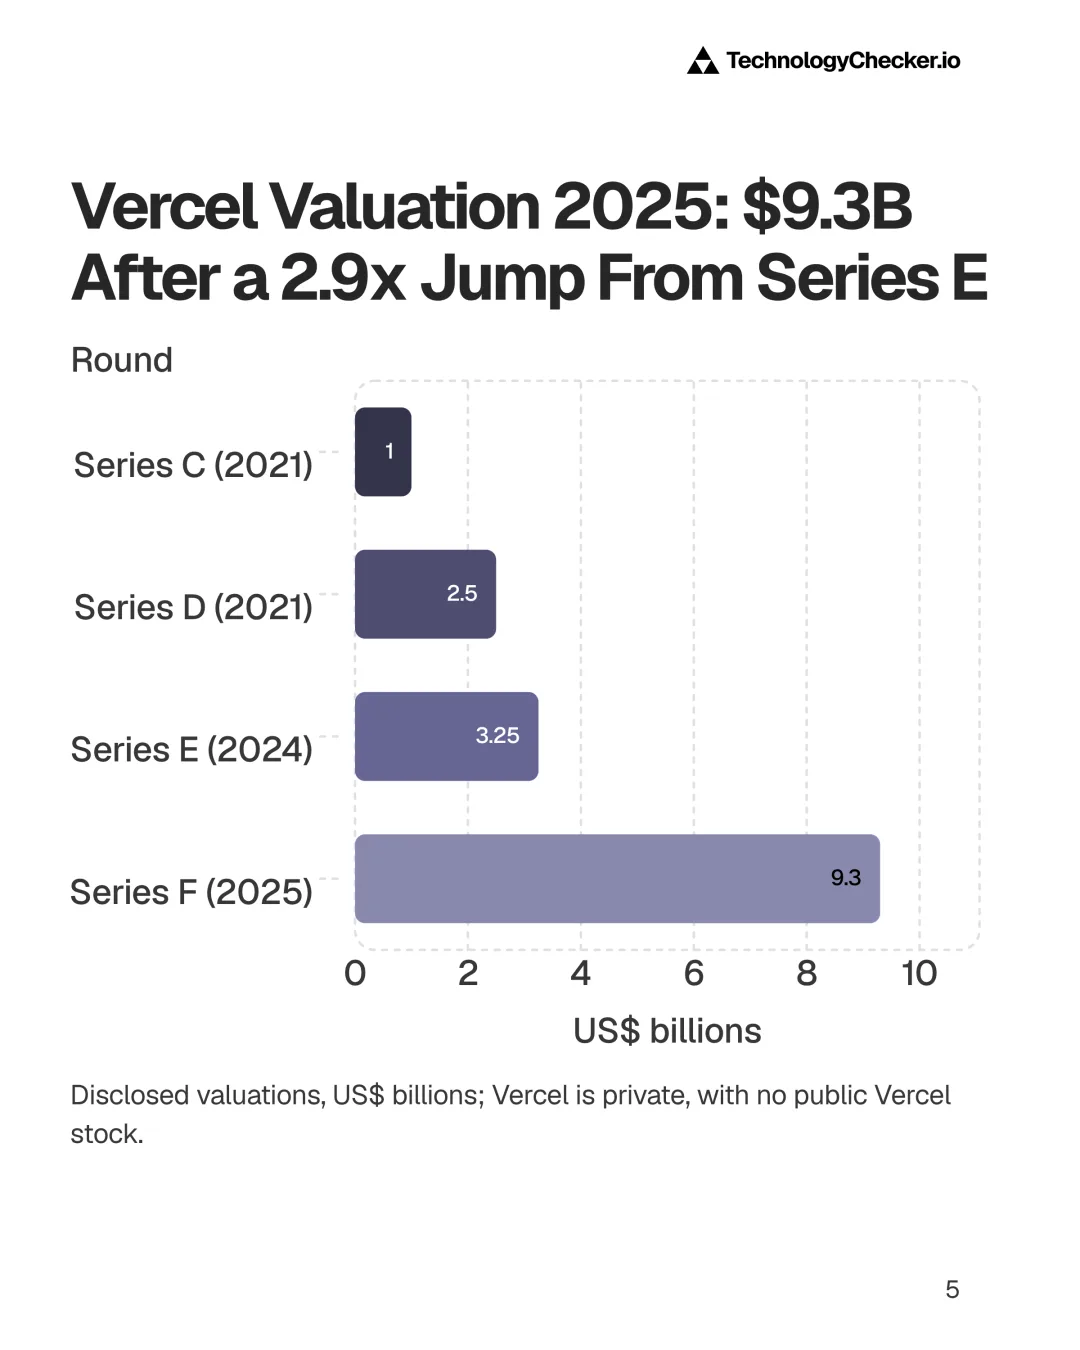
Vercel's Valuation Nearly Tripled Between Its Last Two Rounds
Vercel was valued above $1 billion at its June 2021 Series C and above $2.5 billion at its November 2021 Series D. The May 2024 Series E set a $3.25 billion valuation and the September 2025 Series F a $9.3 billion post-money valuation, with $300 million raised in each of the last round and an equal-sized secondary tender.
Source: Vercel; Business Wire · Jun 2021 - Sep 2025
| Funding round | Valuation (US$ billions) |
|---|---|
| Series C (Jun 2021) | $1B |
| Series D (Nov 2021) | $2.5B |
| Series E (May 2024) | $3.25B |
| Series F (Sep 2025) | $9.3B |
- $9.3B post-money at the September 2025 Series F, co-led by Accel and GIC
- 2.9x step-up from the $3.25B Series E 16 months earlier
- $863M of primary capital raised across Series A to F
| Round | Date | Raised | Valuation | Lead investor(s) |
|---|---|---|---|---|
| Series A | April 2020 | $21M | Not disclosed | Accel, CRV |
| Series B | December 2020 | $40M | Not disclosed | GV |
| Series C | June 2021 | $102M | Above $1B | Bedrock Capital |
| Series D | November 2021 | $150M | Above $2.5B | GGV Capital |
| Series E | May 2024 | $250M | $3.25B | Accel |
| Series F | September 2025 | $300M | $9.3B post-money | Accel, GIC |
| Total primary capital | $863M |
Sources: Vercel's round announcements and Business Wire releases. The $863M total is our sum of the six primary rounds and excludes the ~$300M secondary tender.
The step from Series E to Series F was 2.86x in 16 months, the largest between any two of Vercel's disclosed valuations. TechCrunch reported in April 2026 that $9.3 billion was still Vercel's last valuation, and I found no priced round since. That leaves the valuation behind the revenue. It was set when run-rate revenue sat somewhere between May 2025's $200 million and February 2026's $340 million, and it hasn't been re-priced since the $500 million milestone.
Against the companies it competes with, Vercel's last mark sits well clear:
| Company | Round or disclosure | Valuation | Other disclosed scale |
|---|---|---|---|
| Vercel | $300M Series F, September 2025 | $9.3B | $500M run-rate revenue (July 2026) |
| Netlify | $105M Series D, November 2021 | $2B | 10M+ developers and teams (March 2026) |
| Render | $100M Series C extension, February 2026 | $1.5B | 4.5M+ developers |
| Railway | $100M Series B, January 2026 | Not disclosed | 2M+ users |
| Fly.io | $25M Series D, July 2026 | Not disclosed | 37,000+ customers |
| Cloudflare (listed) | Q2 2026 results | Public company | $696.1M quarterly revenue, +36%; 10M+ developers (October 2026) |
Sources: company releases and filings as linked, each dated in the table.
Vercel's last valuation is more than four times Netlify's 2021 mark and six times Render's 2026 one. Developer headcounts can't be compared the same way, because Vercel publishes growth multiples rather than an absolute number.
Is Vercel a public company? Can you buy Vercel stock?
No. There's no public Vercel stock: the company is private and has no exchange listing. Asked about an IPO in April 2026, Rauch gave TechCrunch no date: "There's no perfect timeline or quarter I can give. The company's ready and getting more ready for it every day."
The board looks like it's being built for that step. In its August 2026 release Vercel added Amit Agarwal, former president of Datadog, and named its independent directors as including Mitchell Hashimoto, Susan St. Ledger and Steffan Tomlinson, Stripe's CFO. A year earlier it hired former Stripe chief business officer Jeanne Grosser as COO. My reading is that this is the governance a company assembles before it lists. Readiness isn't a filing, though, and I found no announced IPO date as of 4 November 2026.
Vercel market share: where does it sit among hosting platforms?
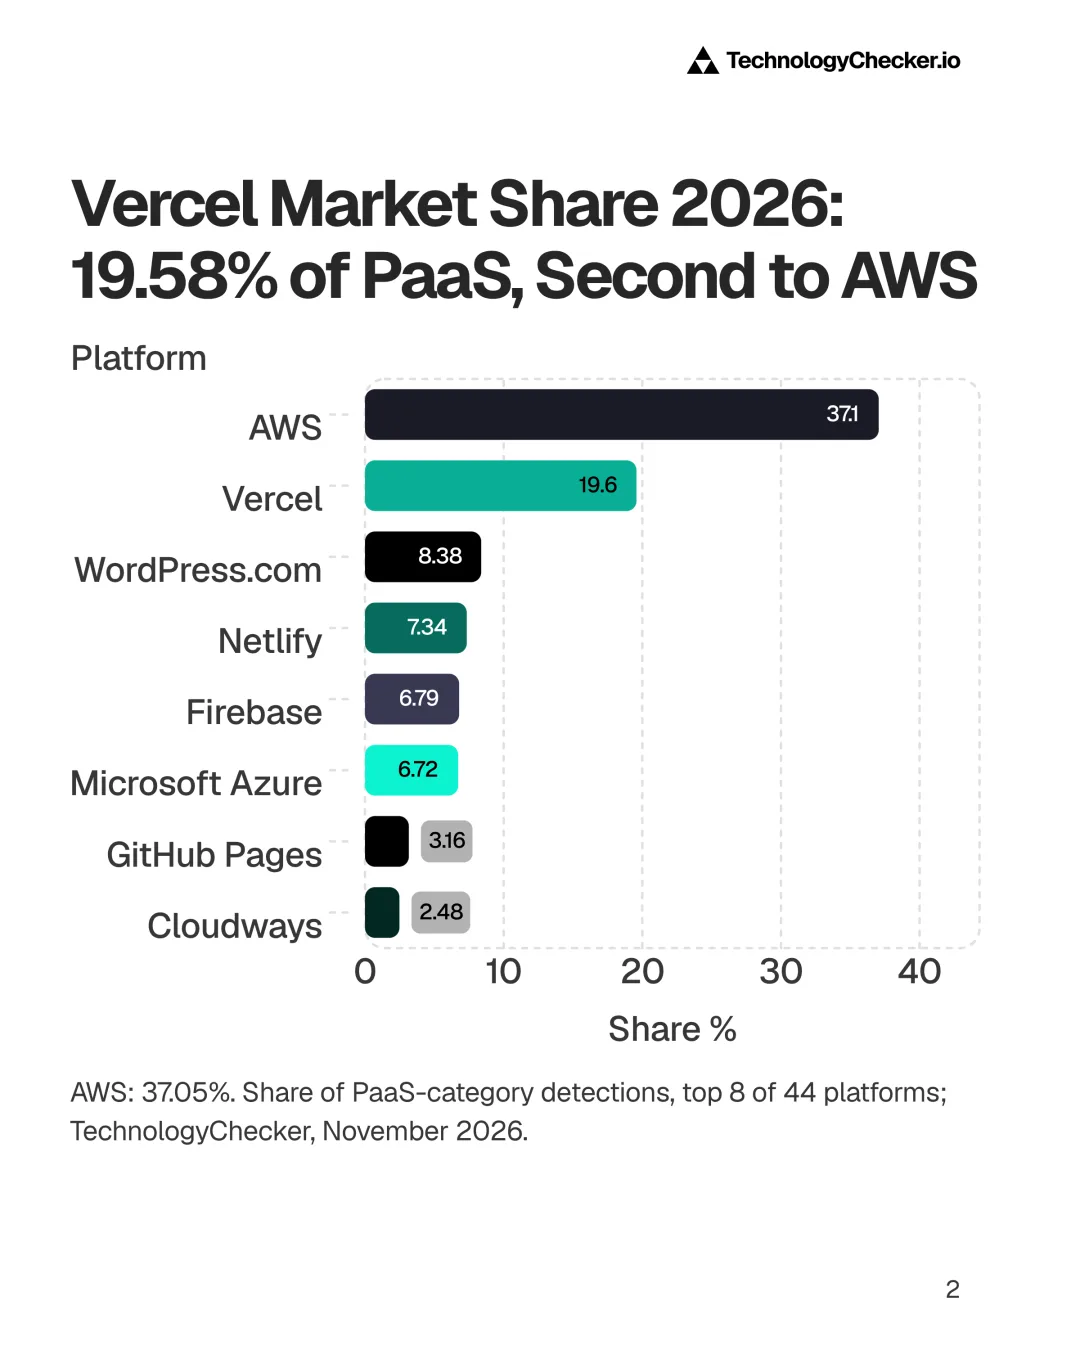
Vercel holds 19.58% of PaaS detections in TechnologyChecker.io's November 2026 crawl, second of 44 platforms behind AWS on 37.05%. That's more than twice the next platform, WordPress.com, at 8.38%.
| Rank | Platform | Active domains, November 2026 | Share, November 2026 | Share, June 2026 |
|---|---|---|---|---|
| 1 | AWS | 1,020,533 | 37.05% | 40.21% |
| 2 | Vercel | 539,244 | 19.58% | 16.70% |
| 3 | WordPress.com | 230,908 | 8.38% | 6.55% |
| 4 | Netlify | 202,135 | 7.34% | 7.24% |
| 5 | Firebase | 187,017 | 6.79% | 8.16% |
| 6 | Microsoft Azure | 185,145 | 6.72% | — |
| 7 | GitHub Pages | 87,146 | 3.16% | 3.44% |
| 8 | Cloudways | 68,413 | 2.48% | 3.39% |
| — | Render | 10,823 | 0.39% | 0.36% |
| — | Fly.io | 10,520 | 0.38% | 0.42% |
Source: TechnologyChecker.io, November 2026 crawl; shares of 2,754,296 PaaS detections. Render and Fly.io shares are our arithmetic. Azure's June share is left out: its count rose 78% from June to July 2026, far faster than any other platform, which points to a detection change rather than adoption. The Vercel profile page still shows the August 2026 figure of 389,653 domains until its next rebuild.
Vercel's 539,244 domains are more than Netlify and Firebase combined (389,152), and a little over half of AWS's count. Two cautions apply. This table ranks live detections, not revenue, so it answers where sites are deployed rather than who books the largest cloud contracts. And a domain can carry two platforms: 7.06% of Vercel domains also show AWS signals.
Why "97.86% market share" figures mislead
The top result for "Vercel market share" is a 6sense page giving Vercel 97.86% of "Backend-as-a-Service". Vercel doesn't hold 97.86% of any market a hosting buyer would recognise; that figure divides Vercel by a category built for a different kind of product. Backend-as-a-service means databases, authentication and APIs for app developers, while Vercel is a frontend cloud. The page compares Vercel with Azure App Service, Hasura and Backand rather than with Netlify or AWS.
A market share is a ratio, and its denominator decides the answer. Put a large product into a category whose other members are small or misfiled and it'll score close to 100% whatever its real position. Counted against the hosts that compete for the same deployments, the same product scores 19.58%.
What do developer surveys say?
Developer surveys put Vercel at about one in ten Stack Overflow respondents and more than four in ten on State of JavaScript, and neither shows anything like the 2026 surge in sites.
| Survey | Vercel | Netlify | AWS | Cloudflare |
|---|---|---|---|---|
| Stack Overflow 2024, all respondents | 11.9% | 7% | 48% | 15.1% |
| Stack Overflow 2025, all respondents | 10.6% | 5.9% | 43.3% | 20.1% |
| State of JavaScript 2024 (11,056 answered) | 40.1% (4,430) | 28.3% (3,131) | 44.4% (4,906) | 20.8% (2,299) |
| State of JavaScript 2025 (10,704 answered) | 43.9% (4,703) | 29.7% (3,180) | 47.6% (5,099) | 28.4% (3,041) |
Sources: Stack Overflow Developer Survey; State of JavaScript (Devographics), hosting question. State of JavaScript percentages are our arithmetic from respondent counts.
Stack Overflow changed the question in 2025, merging cloud platforms with containers, package managers and build tools under "Cloud development", so the move from 11.9% to 10.6% isn't a like-for-like decline. Among professional developers Vercel scored 10.8% in 2025 and 11.3% in 2024. It does better with people learning to code, at 19.5% in 2024 and 17.8% in 2025, and its 2025 "admired" score was 44.4%.
State of JavaScript skews toward engaged JavaScript developers, and it has Vercel second only to AWS for hosting JavaScript apps, up from 40.1% to 43.9%. On the edge and serverless runtime question, Vercel Functions drew 1,608 of 9,593 respondents, behind AWS Lambda (2,532) and Cloudflare Workers (1,702).
The surveys and the crawls disagree on speed. Survey shares moved a few points; site counts nearly doubled. Surveys count people and crawls count sites, so both can be true if each developer now ships more sites. That's what you'd expect if agents and AI app builders are producing more deployments per person, which is the same hypothesis as above, reached from the other direction.
Vercel vs Netlify: how did the race turn?
Vercel passed Netlify in HTTP Archive in March 2023, at 22,612 origins against 22,171, and by September 2026 had 3.91 origins for every Netlify origin, up from 0.54 in January 2022. In our November 2026 crawl the ratio is 2.67.
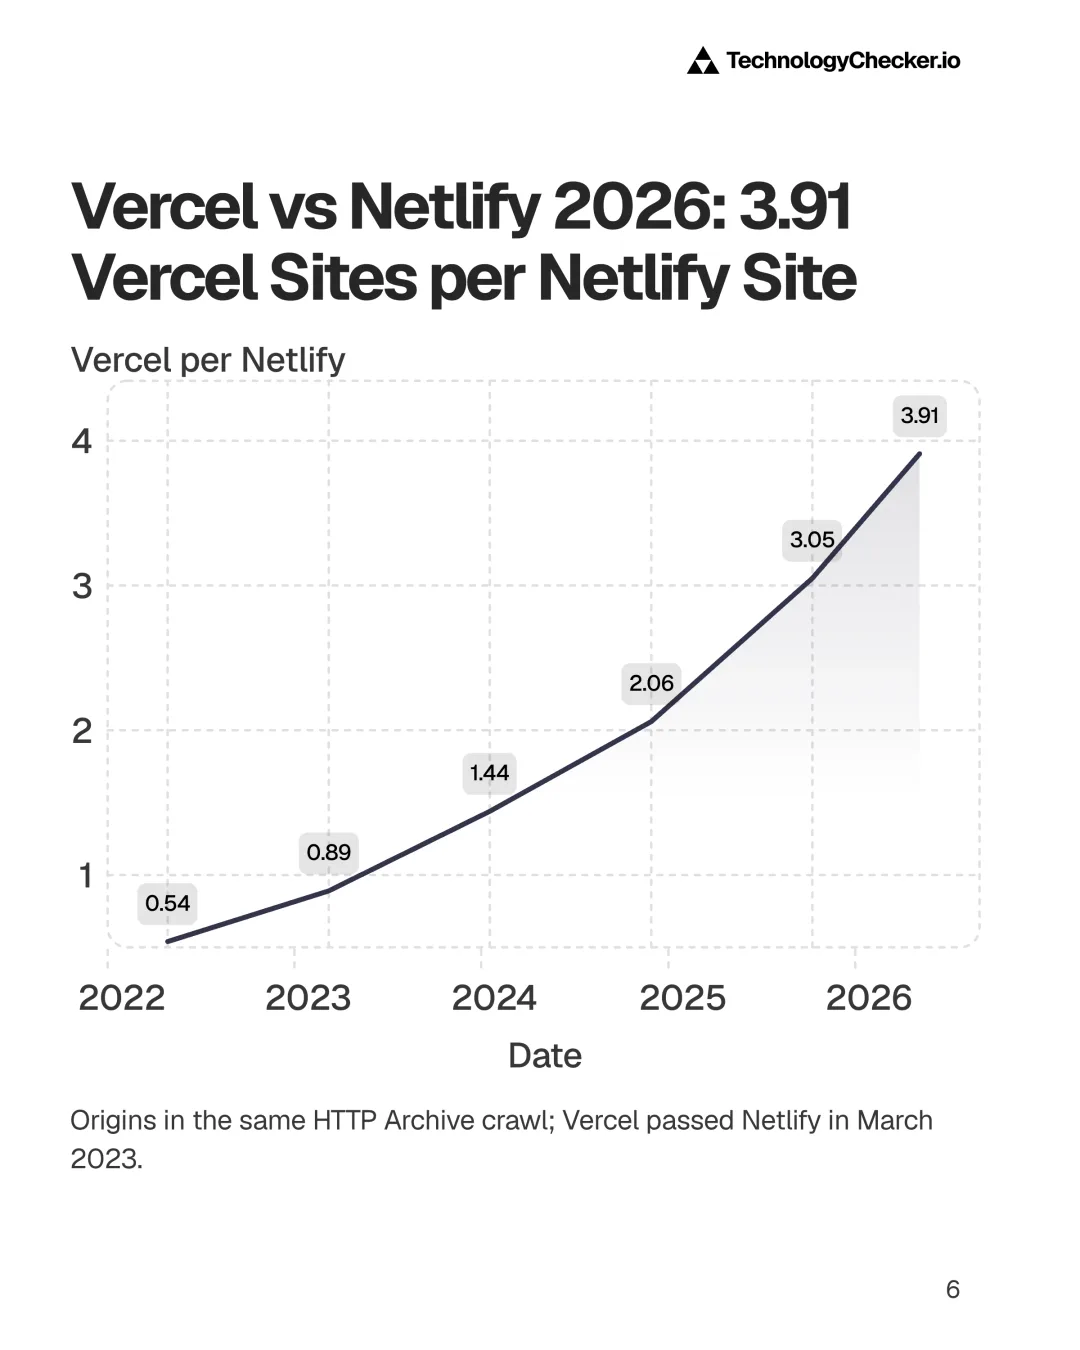
Vercel Went From Half of Netlify to Nearly Four Times It
In January 2022 the HTTP Archive found 14,607 Netlify origins and 7,953 Vercel origins, a ratio of 0.54. Vercel passed Netlify in March 2023, and by September 2026 the count was 161,276 against 41,235, a ratio of 3.91.
Source: HTTP Archive · Jan 2022 - Sep 2026
| Month | Vercel origins per Netlify origin |
|---|---|
| Jan 2022 | 0.54x |
| Apr 2022 | 0.58x |
| Jul 2022 | 0.64x |
| Oct 2022 | 0.77x |
| Jan 2023 | 0.89x |
| Apr 2023 | 1.07x |
| Jul 2023 | 1.24x |
| Oct 2023 | 1.34x |
| Jan 2024 | 1.44x |
| Apr 2024 | 1.59x |
| Jul 2024 | 1.72x |
| Oct 2024 | 1.87x |
| Jan 2025 | 2.06x |
| Apr 2025 | 2.44x |
| Jul 2025 | 2.63x |
| Oct 2025 | 2.83x |
| Jan 2026 | 3.05x |
| Apr 2026 | 3.35x |
| Jul 2026 | 3.67x |
| Sep 2026 | 3.91x |
- 0.54 Vercel origins per Netlify origin in January 2022
- Crossed 1.0 in March 2023 (22,612 against 22,171)
- 3.91 by September 2026
- Netlify still grew: its origins rose 48% in 2026 to September, so this is a race, not a collapse
| Month | Vercel origins | Netlify origins | Vercel per Netlify origin |
|---|---|---|---|
| January 2022 | 7,953 | 14,607 | 0.54 |
| January 2023 | 19,417 | 21,788 | 0.89 |
| January 2024 | 37,767 | 26,249 | 1.44 |
| January 2025 | 55,440 | 26,888 | 2.06 |
| January 2026 | 85,011 | 27,862 | 3.05 |
| September 2026 | 161,276 | 41,235 | 3.91 |
Source: HTTP Archive, mobile crawl, all rank tiers. Ratios are of two counts from the same crawl and month, so crawl-size changes cancel out.
Netlify didn't shrink. It held at 26,000 to 28,000 origins for two years while Vercel kept climbing, which is how the ratio passed 2.0 by January 2025. In 2026 both grew, Netlify by 48% and Vercel by 90% over the same eight months. The race turned because Vercel grew faster, not because Netlify's sites left.
Which way are sites moving between platforms?
Vercel gained more domains than it lost on every corridor we measured, at 4,961 gained against 1,373 lost across five platforms, a ratio of 3.61 to 1.
| Corridor | Domains gained by Vercel | Domains lost by Vercel | Gained per domain lost |
|---|---|---|---|
| AWS | 2,100 | 634 | 3.31 |
| Netlify | 1,019 | 315 | 3.23 |
| Firebase | 882 | 232 | 3.80 |
| Supabase | 656 | 92 | 7.13 |
| GitHub Pages | 304 | 100 | 3.04 |
| Total | 4,961 | 1,373 | 3.61 |
Source: TechnologyChecker.io, Vercel profile, movements observed from about May to August 2026. Totals and ratios are our arithmetic.
The Netlify corridor checks out from the other side. Netlify's own profile, built separately, records 1,032 domains moving to Vercel and 318 arriving from it, within 13 domains of Vercel's 1,019 and 315. Our Vercel vs Netlify comparison uses a later 90-day window to 23 September 2026 and finds 1,537 domains moving from Netlify to Vercel against 407 the other way, 3.8 to 1, with 2,527 domains carrying both.
Read these as observed movements, not a lifetime ledger. The window is short and a domain can run two platforms at once, so some pairs are a stack changing shape rather than a contract ending; Supabase is a backend rather than a host, which makes its 7.13 ratio the clearest example. Churn the other way exists too: we track 10,607 domains that previously ran Vercel, a base about 3% the size of the 389,653 live in August.
How do Vercel and Netlify prices compare?
Both list their team plan at $20 a month. The difference is what $20 buys.
| Plan | Vercel | Netlify |
|---|---|---|
| Free | Hobby, $0 | Free, $0 (300 credits a month) |
| Entry paid | — | Personal, $9 a month (1,000 credits) |
| Team | Pro, $20 a month per developer seat, with $20 of usage credit | Pro, $20 a month with unlimited members (3,000 credits) |
| Enterprise | Custom, 99.99% SLA | Custom |
Sources: Vercel pricing and Netlify pricing, read 4 November 2026.
Vercel charges per developer seat and Netlify per team, so a five-developer team pays $100 a month at Vercel's list price before usage against Netlify's $20. Price isn't what separates their customer bases, though.
What about Cloudflare?
Cloudflare doesn't appear in the top eight of our PaaS table, yet its Pages hostname outranks both rivals on DNS popularity. In Cloudflare Radar's domain buckets, pages.dev sits in the top 500, ahead of vercel.app and netlify.app:
| Hostname | Radar popularity bucket |
|---|---|
| pages.dev (Cloudflare Pages) | Top 500 |
| vercel.app | Top 2,000 |
| netlify.app | Top 2,000 |
| vercel.com, netlify.com | Top 5,000 |
| nextjs.org, render.com, fly.io | Top 20,000 |
| v0.dev, v0.app | Top 50,000 |
Source: Cloudflare Radar domain ranking, read 4 November 2026.
Vercel's and Netlify's hostnames share a bucket even though their origin counts differ 3.91 to 1, so the buckets are too coarse to rank those two. Tooling tells the Cloudflare story more directly: in the week to 3 November 2026, npm recorded 39.8 million downloads of Cloudflare's wrangler CLI, 5.68 million of the vercel CLI and 0.49 million of netlify-cli. Vercel's CLI out-downloads Netlify's more than ten to one.
Vercel runs on its biggest competitor's network

Every Vercel edge address I looked up on 4 November 2026 is announced by AS16509, Amazon's network (AMAZON-02). AWS, the largest platform in our PaaS table, is Vercel's biggest competitor by domain count and also the network that carries its traffic.
I ran the lookups through Cloudflare Radar's ASN data, then repeated them for Netlify, Render and Fly.io.
| Address or hostname | What it is | Announced by |
|---|---|---|
| 76.76.21.21 | Vercel's documented apex IP for custom domains | AS16509, Amazon |
| cname.vercel-dns.com (66.33.60.67, 76.76.21.98) | Vercel's CNAME target | AS16509, Amazon |
| vercel.com, nextjs.org, v0.app (64.239.109.x, 64.239.123.x) | Vercel's own sites | AS16509, Amazon |
| netlify.app (35.157.26.135) | Netlify deployment hostname | AS16509, Amazon |
| apex-loadbalancer.netlify.com (75.2.60.5) | Netlify apex load balancer | AS16509, Amazon |
| Render | Hosting platform | AS397273, Render's own network |
| Fly.io | Hosting platform | AS40509, Fly.io's own network |
Source: Cloudflare Radar ASN lookups, run 4 November 2026. "Announced by" means the network that originates the route in BGP. It doesn't establish who holds the address block or what contract sits behind it.
That changes how the churn table reads. We saw 2,100 domains move from AWS to Vercel against 634 the other way between about May and August 2026. Where those sites were served from AWS before the move, they're still served from Amazon's network after it. The customer changed vendor; the packets didn't change networks. For AWS that's a lost customer relationship, but for any measure of cloud share built on network data it isn't a loss at all.
The same effect shows up in Cloudflare's numbers. In the Cloud Observatory, Amazon received 50.58% of the requests Cloudflare sent to the four hyperscaler clouds in the 28 days to 4 November 2026, against 27.50% for Google, 20.29% for Microsoft and 1.63% for Oracle. As far as Vercel's and Netlify's origin traffic crosses Cloudflare, it's counted on Amazon's side of that split. Our cloud provider traffic share study has the full series, and our AWS statistics report covers Amazon's own growth.
Our PaaS table can separate the two only because our fingerprints read response headers such as x-vercel-id and DNS delegation to vercel-dns.com, not the owner of the IP address. A classifier that worked from address ownership alone would file every Vercel site under Amazon, and Vercel's 19.58% would disappear into AWS's 37.05%. I don't trust a hosting share that doesn't say how it tells the two apart.
Render and Fly.io chose differently. Both announce their own networks, and both are far smaller by domain count, at 10,823 and 10,520. As an AWS Solutions Architect Professional I'd read an AS16509 origin for exactly what it is, a statement about which network announces the route. It says nothing about what Vercel pays Amazon, and I'm not going to guess.
Next.js is Vercel's moat, except at the top of the web

Across all sites HTTP Archive measured in September 2026, there were 39.8 Vercel origins for every 100 Next.js origins. Among the top 1,000 sites there were 4.8. Next.js gets more common the more popular a site is, while visible Vercel hosting gets rarer.
The Bigger the Site, the Less Its Next.js Runs Visibly on Vercel
Across all sites the HTTP Archive measured, there were 161,276 Vercel origins for every 404,724 Next.js origins (39.8%). Among the top 1,000 sites it was 4 Vercel origins against 83 Next.js origins (4.8%). Next.js is adopted more often the more popular the site is; visible Vercel hosting is adopted less often.
Source: HTTP Archive · September 2026
| Site popularity tier | Vercel origins per 100 Next.js origins |
|---|---|
| Top 1K | 4.8% |
| Top 10K | 6.1% |
| Top 100K | 10.3% |
| Top 1M | 21.4% |
| All sites | 39.8% |
- 39.8% across all sites, 21.4% in the top 1 million, 4.8% in the top 1,000
- Next.js reaches 11% of top-1,000 origins but only 4.6% of all origins
- The framework won the top of the web faster than the hosting did
| Popularity tier (Chrome UX Report rank) | Next.js origins | Vercel origins | Vercel per 100 Next.js | Next.js share of tier | Vercel share of tier |
|---|---|---|---|---|---|
| Top 1K | 83 | 4 | 4.8 | 11.0% | 0.53% |
| Top 10K | 800 | 49 | 6.1 | 10.9% | 0.67% |
| Top 100K | 5,890 | 608 | 10.3 | 8.1% | 0.84% |
| Top 1M | 39,774 | 8,501 | 21.4 | 5.3% | 1.14% |
| All sites | 404,724 | 161,276 | 39.8 | 4.6% | 1.85% |
Source: HTTP Archive, mobile crawl, September 2026, split by Chrome UX Report popularity rank. Not every Vercel origin runs Next.js.
The two curves run in opposite directions. Next.js reaches 11.0% of top-1,000 origins and 4.6% of all origins; visible Vercel reaches 0.53% of the top 1,000 and 1.85% of everything. The framework won the top of the web faster than the hosting did, and Vercel's strength sits in the long tail.
Now the caveat. Large sites often put Akamai, Cloudflare or another CDN in front of their origin, and that layer replaces the response headers both HTTP Archive and our crawl read. A Vercel deployment behind someone else's CDN is invisible to both instruments, so the top tiers undercount Vercel and part of this gap is invisible Vercel rather than absent Vercel. The top-1,000 tier is also a small sample of 83 Next.js origins.
Our own enterprise check points the same way. We re-tested the 70 largest companies on our Vercel list at the exact hostname where we'd detected them; 62 confirmed, and most of the 8 failures sat behind Cloudflare. I can't size the masking effect, so I won't claim the whole gap is real. I'm confident of the direction, which holds across all five tiers, and I'd discount the size.
The stack that defines a Vercel site
72.95% of Vercel domains run Tailwind CSS and 67.77% run Next.js, the highest co-occurrence figures I've seen on any infrastructure profile at TechnologyChecker.
| Technology on the same domain | Share of Vercel domains | Reading |
|---|---|---|
| Tailwind CSS | 72.95% | The default styling layer |
| Next.js | 67.77% | The framework Vercel maintains |
| Google Analytics | 38.83% | General web baseline |
| Radix UI | 27.82% | Headless React components |
| shadcn/ui | 21.2% | Component kit built on Radix and Tailwind |
| Vercel Analytics | 19.01% | Vercel's own analytics product |
| AWS signals | 7.06% | Two platforms on one domain |
| Bootstrap | 4.15% | Control: present on 5.7M domains across our corpus |
| Firebase | 2.3% | Serverless backend alongside Vercel |
| Supabase | 1.92% | Serverless backend alongside Vercel |
Source: TechnologyChecker.io, Vercel profile, August 2026 crawl.
Bootstrap is the control that makes the table mean something. It appears on 5.7 million domains across our corpus, yet only on 4.15% of Vercel domains. A platform that was merely popular would inherit the web's usual mix of CSS frameworks, and Vercel doesn't. The pull also runs the other way: our list of websites built with Turbopack, the bundler Vercel builds into Next.js, counts 345,255 domains, and Vercel serves 49.91% of the live ones.
npm downloads now count machines, not sites
Next.js was downloaded 90,474,671 times in the week to 3 November 2026, according to the npm registry, against 14,973,074 in the same week of 2025 and 7,492,087 in 2024. That's a 6.0x rise in a year. Live Next.js origins in HTTP Archive rose 1.63x over a similar year, from 249,049 in September 2025 to 404,724 in September 2026.
The two numbers no longer measure the same thing. Downloads now come from CI pipelines, agents and sandboxes installing the package every time they build, so they track build volume rather than sites. Full-year Next.js downloads went from 340.1 million in 2024 to 620.6 million in 2025, and the AI SDK package ai went from 16.0 million to 119.2 million; in the latest week it reached 43,656,329, 10.4x a year earlier.
The counts themselves are reliable. The registry returns 3,209,817 downloads of ai for 23 to 29 September 2025, exactly the figure Vercel published in its Series F post. On GitHub, vercel/next.js has 143,306 stars and 33,546 forks, and vercel/ai has 27,740 stars, as of 4 November 2026. @vercel/analytics drew 10.87 million downloads in the latest week.
Who uses Vercel? Small, young companies that build for the web
89.73% of enriched Vercel domains belong to companies with fewer than 50 staff, and 47.04% of those companies were founded in the 2020s. That's the youngest base of any major platform in our PaaS category.
Almost Half of Vercel Companies Were Founded in the 2020s
47.04% of the companies TechnologyChecker.io matched to Vercel domains were founded in the 2020s, against 37.6% for Netlify, 23.27% for AWS and 11.48% for Microsoft Azure. Vercel has the youngest customer base of any major platform in the PaaS category.
Source: technologychecker.io/technology/vercel · August 2026
| Platform | Companies founded 2020 or later (%) |
|---|---|
| Vercel | 47.04% |
| Firebase | 38.26% |
| Netlify | 37.6% |
| AWS | 23.27% |
| Microsoft Azure | 11.48% |
- Vercel 47.04%, Netlify 37.6%, AWS 23.27%, Azure 11.48%
- Vercel and Azure sell to different generations of company
- A Vercel detection is a strong signal that the account is young
| Platform | Under 50 staff | Over 1,000 staff | Founded in the 2020s | Next.js on same domain | Tailwind on same domain |
|---|---|---|---|---|---|
| Vercel | 89.73% | 0.89% | 47.04% | 67.77% | 72.95% |
| Netlify | 91.32% | 0.79% | 37.60% | 14.05% | 36.70% |
| Firebase | 85.57% | 1.77% | 38.26% | — | — |
| AWS | 80.41% | 2.56% | 23.27% | — | — |
| Microsoft Azure | 64.46% | 7.50% | 11.48% | — | — |
| GitHub Pages | 94.58% | 0.45% | 39.87% | 4.33% | — |
Source: TechnologyChecker.io, August 2026 crawl. Each platform is measured on its own enriched base; for Vercel that's 256,810 companies analysed. Founding year and size come from matched LinkedIn company profiles.
Vercel leads Firebase, the next-youngest base, by almost nine points on 2020s founding. Size tells a different story: GitHub Pages and Netlify both have a larger share of sub-50 companies than Vercel does. Azure sits at the other end of both columns, with 7.50% of its base above 1,000 staff and 11.48% founded this decade. These platforms sell to different generations of company.
| Company size (employees) | Share of Vercel companies |
|---|---|
| 1–10 | 67.69% |
| 11–50 | 22.04% |
| 51–200 | 6.6% |
| 201–500 | 2.07% |
| 501–1,000 | 0.71% |
| 1,001–5,000 | 0.59% |
| 5,001–10,000 | 0.11% |
| 10,001+ | 0.19% |
| Founding decade | Share of Vercel companies |
|---|---|
| 2020s | 47.04% |
| 2010s | 34.81% |
| 2000s | 9.31% |
| 1990s | 3.97% |
| 1980s or earlier | 4.87% |
Source: TechnologyChecker.io, Vercel profile, August 2026. "1980s or earlier" is the remainder of the founding-decade distribution.
Where are Vercel's customers?
The United States holds 29.53% of enriched Vercel domains, well below its 41.76% share of the AWS list, and India is second at 9.45%, roughly double its share on AWS. Brazil follows at 6.16%.
| Rank | Country | Enriched Vercel domains |
|---|---|---|
| 1 | United States | 66,135 |
| 2 | India | 21,165 |
| 3 | United Kingdom | 14,986 |
| 4 | Brazil | 13,805 |
| 5 | Canada | 8,361 |
| 6 | Australia | 8,018 |
| 7 | Germany | 7,701 |
| 8 | France | 7,098 |
| 9 | Netherlands | 5,418 |
| 10 | Spain | 3,938 |
Source: TechnologyChecker.io, Vercel profile, August 2026.
Cloudflare Radar gives a second geography: where DNS lookups for Vercel's deployment hostname come from. That's a different question from where the companies are.
| Country | Share of *.vercel.app lookups | Share of *.netlify.app lookups |
|---|---|---|
| United States | 28.59% | 30.56% |
| Netherlands | 13.18% | 13.06% |
| Singapore | 11.97% | 16.36% |
| Indonesia | 11.74% | — |
| Germany | 7.08% | 6.01% |
| Brazil | 3.33% | 4.09% |
| Poland | 2.19% | — |
| India | 1.33% | — |
| France | 1.32% | — |
| Finland | 1.23% | — |
Source: Cloudflare Radar, queries to the 1.1.1.1 resolver, 28 days to 4 November 2026. Dashes mark countries outside netlify.app's top five.
Treat this table lightly. The Netherlands, Singapore and Germany host large data centres, so much of their share is automated traffic, and 1.1.1.1's market share is low in India. Even so, the contrast is real: India is our second-largest market by enriched Vercel domains and supplies 1.33% of vercel.app lookups, while Indonesia supplies 11.74% and doesn't reach our top ten. Where Vercel sites are built and where vercel.app lookups come from are different maps.
Industries, and why a domain is not an account
Software Development leads at 10.15% of enriched Vercel companies, followed by Technology, Information and Internet at 7.61% and IT Services at 7.27%.
| Industry | Share of Vercel companies |
|---|---|
| Software Development | 10.15% |
| Technology, Information and Internet | 7.61% |
| IT Services and IT Consulting | 7.27% |
| Business Consulting and Services | 3.32% |
| Advertising Services | 3.23% |
| Financial Services | 3.04% |
| Real Estate | 2.45% |
| Marketing Services | 2.21% |
| Advertising, Marketing and Design Services combined | 6.89% |
Source: TechnologyChecker.io, Vercel profile, August 2026.
The agency rows matter more than their size suggests: Advertising, Marketing and Design Services together make up 6.89% of the list, and those companies deploy client work under their own Vercel team. One agency account can sit behind many of the domains we count, so 539,244 domains is not 539,244 customers, and the number of paying Vercel accounts is smaller than the domain count implies.
Notable companies running Vercel
Large companies do appear on the list: Northrop Grumman, Philips (its hearing solutions property), Sodexo, ASML, AECOM and WTW each served a live Vercel header on their own hostname when we re-checked them. We tested the 70 largest companies by headcount and 62 confirmed.
They're marketing, careers and campaign properties rather than core transactional systems. A Vercel detection on a large company tells you who builds its public web presence, which is usually a different budget and a different buyer from its main cloud contract.
Do Vercel sites pass Core Web Vitals?
43.4% of Vercel origins passed all Core Web Vitals on mobile in September 2026, up from 37.2% a year earlier, according to Chrome UX Report data published through HTTP Archive. That's ahead of Netlify and of Next.js sites in general, and behind the average across all origins.
43% of Vercel Origins Pass Core Web Vitals on Mobile
43.4% of Vercel origins passed all three Core Web Vitals on mobile in September 2026, up from 37.2% a year earlier. That beats Netlify (41.7%), Next.js sites in general (35.7%) and Firebase (29.2%), but trails the 52.8% average across every origin measured.
Source: HTTP Archive · September 2026
| Population | Origins passing Core Web Vitals, mobile (%) |
|---|---|
| All origins | 52.8% |
| Vercel | 43.4% |
| Netlify | 41.7% |
| Next.js | 35.7% |
| Firebase | 29.2% |
- Vercel 43.4%, up from 37.2% in September 2025
- Ahead of Next.js overall (35.7%): hosting choice is visible in the field data
- Still below the 52.8% web average, because app-heavy React sites are harder to make fast
| Population | Pass rate, September 2025 | Pass rate, September 2026 |
|---|---|---|
| All origins | — | 52.8% |
| Vercel | 37.2% | 43.4% |
| Netlify | 41.5% | 41.7% |
| Next.js | 28.1% | 35.7% |
| Firebase | 23.4% | 29.2% |
Source: Chrome UX Report via HTTP Archive, mobile. "Pass" means good LCP, CLS and INP at the 75th percentile.
Vercel-hosted origins beat Next.js sites overall by 7.7 points, and Vercel gained 6.2 points in a year while Netlify gained 0.2. That describes the populations; it doesn't prove Vercel makes sites faster. Two-thirds of Vercel domains run Next.js, and app-heavy React sites are harder to make fast than static pages, which is my best explanation for the gap to the 52.8% average. The useful reading for a buyer is narrower: Next.js sites on Vercel pass more often than Next.js sites in general.
Platform scale, acquisitions and security record
Vercel handled 115.8 billion requests over the 2025 Black Friday to Cyber Monday weekend, up 33.6% year over year, according to Vercel's BFCM 2025 report. Deployment volume grew faster than traffic.
| Measure | BFCM 2024 | BFCM 2025 |
|---|---|---|
| Requests | 86.7B | 115.8B |
| Peak requests per second | 1.94M (included DDoS traffic) | 518K |
| Deployments | 2.45M | 6.12M |
Sources: Vercel's BFCM 2024 recap and BFCM 2025 report. The two peaks aren't comparable.
Requests grew by a third and deployments 2.49x. By July 2026 Vercel reported 6 million deployments a day, roughly what it handled across the whole four-day BFCM 2025 window. That fits the agent hypothesis from the 2026 section.
Vercel's other scale figures:
- Network: 126 points of presence in 94 cities across 51 countries, and 19 compute-capable regions, per Vercel's regions documentation (updated August 2026).
- v0: more than 3.5 million unique users by September 2025 and more than 4 million by February 2026, according to Vercel's v0 relaunch post. Vercel's press page credited v0 in June 2025 with more than 100 million generated applications.
- AI SDK: more than 16 million weekly downloads at the AI SDK 7 launch in June 2026, consistent with npm's 15,964,225 for 18 to 24 June.
What has Vercel acquired?
We confirmed nine Vercel acquisitions and acqui-hires on primary sources, seven of them since May 2024.
| Date | Company | What it brought |
|---|---|---|
| December 2021 | Turborepo | Monorepo build system |
| October 2022 | Splitbee | Web analytics |
| May 2024 | ModelFusion (team) | AI SDK engineering |
| November 2024 | Grep | Code search across 500,000+ public repositories |
| January 2025 | Tremor | React dashboard components |
| July 2025 | NuxtLabs | The team behind Nuxt and Nitro |
| December 2025 | Gel Data (team) | Python platform work |
| July 2026 | Better Auth | TypeScript authentication library |
| July 2026 | Stakpak | Open-source DevOps agent |
Sources: Vercel's acquisition announcements; Gel Data's and Stakpak's own announcements.
The direction is outward from hosting into the rest of a project: builds, analytics, UI components, authentication, Python, and a second JavaScript framework in Nuxt. Each one widens the part of a codebase that's native to Vercel before a single deployment happens.
What is Vercel's security record?
Three incidents define Vercel's record since early 2025.
- CVE-2025-29927 (March 2025). A Next.js middleware authorization bypass rated CVSS 9.1 in GitHub's advisory, patched in Next.js 14.2.25 and 15.2.3. Vercel's postmortem says it received the report on 27 February 2025, that triage was delayed, that Vercel-hosted apps were not affected, and that Netlify and Cloudflare Workers never were.
- React2Shell (December 2025). CVE-2025-55182, rated CVSS 10.0, was published on 3 December 2025. Vercel says its firewall blocked more than 6 million exploit attempts and that it paid more than $1 million to 116 researchers for firewall bypasses.
- April 2026 security incident. Unauthorized access to internal systems began with the compromise of Context.ai, a third-party AI tool used by a Vercel employee, and exposed non-sensitive environment variables of a limited subset of customers. Vercel's security bulletin marks the incident closed on 16 October 2026.
The first two were framework flaws where the host decided how much they mattered; the third was a supply-chain compromise of a tool used inside Vercel. For a buyer, those are different risks and deserve separate questions in a security review.
What does a Vercel detection mean for sales teams?
A Vercel detection says more about a company's stack and stage than its size. The profile data turns that into signals:
- Next.js plus Tailwind on a domain we don't see on Vercel is the strongest migration signal in this dataset, because the stack is already built for Vercel.
- Supabase or Firebase alongside Vercel (1.92% and 2.3% of Vercel domains) marks a team running a serverless backend with no traditional cloud contract, a different buyer from an AWS account.
- Vercel Analytics on the domain (19.01%) marks a team that instruments its deployments.
- An agency in the list is a channel, not one account. Sell once and you may reach many domains.
- India at 9.45% is roughly double its share of the AWS list, so territory plans built from AWS data will under-resource it.
- An enterprise row is almost always a marketing or careers property. Pitch the web team, not central IT.
TechnologyChecker's paid plans turn these detections into company lists filtered by the same signals.
Vercel statistics to save and share
The nine cards below carry the report's headline numbers, each dated and sourced, so they can travel on their own. Every figure matches the tables above; the sources are listed in the methodology.
About the author
David Thomson is the CTO of TechnologyChecker, responsible for the crawling infrastructure and the detection systems that check 29.9M live business domains per sweep. Before joining, he spent five years at Google on the Search team, working on large-scale crawling and indexing systems. He holds an MEng in Computer Science from the University of Edinburgh and the AWS Solutions Architect Professional certification, and he built TechnologyChecker's fingerprinting engine, which identifies technologies from HTTP headers, JavaScript libraries, DNS records and HTML patterns.
Here's what I did for this report. I queried our crawl month by month from June to November 2026 and computed Vercel's share inside each month's PaaS detections. I pulled HTTP Archive's Vercel, Netlify, Next.js and Firebase series from January 2022, then split the September 2026 crawl by Chrome UX Report rank tier. And on 4 November 2026 I ran Cloudflare Radar ASN lookups on Vercel's documented edge addresses, on the addresses serving vercel.com, nextjs.org and v0.app, and on Netlify's, Render's and Fly.io's for comparison.
The count underneath all of it comes from a hand-check I trust. In August 2026 we drew 100 Vercel domains at random and checked each one by reading live headers and resolving the start-of-authority record. 85 carried a first-party Vercel signal: 84% through headers, 10% through Vercel DNS, 9% through both. The other 15 were inconclusive rather than wrong: five Cloudflare bot blocks, two unreachable, eight that had moved to Wix, Framer, IIS and similar. The largest shared vercel.app host we found sits on just 766 domains, under 0.2% of the total.
I published shares and ratios rather than raw counts on purpose. Our raw Vercel count nearly doubled between June and November, and almost all of that was our crawler reaching more of the web. Reporting it as Vercel's growth would have been the most flattering number in this piece and it would have been wrong. Ratios computed inside one crawl cancel that, which is why the Vercel-to-Netlify and Vercel-to-Next.js lines are the trend I'd defend.
The top-tier gap is the judgement call I'd most like readers to weigh. I wrote the header fingerprints, so I know exactly what a CDN in front of Vercel does: it replaces x-vercel-id and x-vercel-cache with its own headers, and a company that runs its own DNS won't show the vercel-dns.com delegation either. Some of the missing Vercel at the top of the web is real and some is invisible to every crawler, including ours.
I also left numbers out. A $600 million ARR figure for October 2026 circulates widely, as do 400,000 paying customers and 130% net dollar retention, and I couldn't trace any of them to a primary source. A Radar DNS series failed a basic test too; the methodology explains both.
Methodology
Scope
Worldwide, January 2022 to November 2026. The report combines four kinds of evidence: TechnologyChecker.io's own detection data, HTTP Archive's independent crawl, Cloudflare Radar network measurements, and company and press disclosures about Vercel and its competitors. Every figure carries the month or period it describes, because the series end at different dates: our crawl runs to November 2026, HTTP Archive to September 2026, revenue to July 2026 and the surveys to 2025.
Source table
| Source | What it provides | Period covered |
|---|---|---|
| TechnologyChecker.io | PaaS shares, domain counts, churn corridors, company breakdowns, stack co-occurrence, the 100-domain hand-check | June to November 2026 (profile: August 2026) |
| HTTP Archive | Vercel, Netlify, Next.js and Firebase origins; Chrome UX Report rank tiers; Core Web Vitals pass rates | January 2022 to September 2026 |
| Cloudflare Radar | ASN lookups, Cloud Observatory origin request shares, domain popularity buckets, DNS query origin, generative-AI service ranking | Read 3 to 4 November 2026 |
| Vercel and Business Wire | Funding, revenue milestones, agent figures, BFCM, network, acquisitions, security | April 2020 to October 2026 |
| TechCrunch, The Information, Forbes | Run-rate revenue at February 2026 and May 2025, last valuation, IPO comments, deployments per day | May 2025 to July 2026 |
| Stack Overflow, State of JavaScript | Developer usage of hosting platforms | 2024 and 2025 surveys |
| npm registry, GitHub API | Package downloads, repository stars and forks | 2024 to 3 November 2026 |
| Competitor releases and filings | Netlify, Render, Railway, Fly.io, Cloudflare funding and scale | November 2021 to October 2026 |
How the charts were built
There are eight charts. The four HTTP Archive charts read the mobile crawl through HTTP Archive's technology report API; the rank-tier chart splits September 2026 by Chrome UX Report rank, and the Vercel-to-Netlify chart divides two counts from the same month so crawl-size changes cancel. The PaaS share chart divides Vercel's active domains by all active domains across the 44 technologies in our PaaS category inside each monthly crawl. The founding-decade chart uses each platform's own enriched base from the August 2026 crawl.
The revenue chart plots only reported milestones, and the valuation chart shows only rounds that disclosed a valuation, with Series C and D at their announced floors of $1 billion and $2.5 billion. Every chart's key values are repeated in a table directly beneath it.
Limitations
- Domains are not accounts. We count domains. One agency or company can sit behind many of them, so domain counts overstate the number of paying Vercel customers.
- Every count is a floor. A CDN in front of an origin hides the headers we read, and we only crawl hostnames we know about. Both effects undercount Vercel, worst at the enterprise end.
- Our monthly series is six months long, and coverage grew during it. We publish shares and ratios for the trend, never the raw rise.
- Churn windows are short. The corridors cover about May to August 2026 (90 days to 23 September 2026 on the compare page), and a domain running two platforms can appear in a corridor without anyone cancelling anything.
- HTTP Archive crawls home pages on mobile. It misses deeper pages, and its top-1,000 tier holds only 83 Next.js origins.
- Run-rate revenue and origin counts are different kinds of number. The revenue-to-footprint comparison is directional, not a model.
- Radar sees only what crosses Cloudflare. DNS query origin depends on 1.1.1.1's share by country, and data-centre hubs inflate the Netherlands, Singapore and Germany. ASN lookups describe routes, not contracts, and were run on specific addresses on one date.
- Surveys are self-selected. Stack Overflow changed its cloud question in 2025, and State of JavaScript skews toward engaged JavaScript developers.
- npm counts automated installs. Downloads measure build activity, not people or sites.
What we checked and did not publish
- A Radar DNS-volume trend. Cloudflare Radar's DNS timeseries endpoint returned identical series for
vercel.app,netlify.appandpages.devwhen filtered by domain, which means the domain filter wasn't applied. We dropped the series rather than publish a trend that measures the whole resolver. - Unverified Vercel figures. A $600 million ARR figure for October 2026, a reported $8 to $9 billion offer, 400,000 paying customers, about 485,000 customers, 130% net dollar retention, headcount and profitability all circulate. None traced to a primary source we could read, so none appear above. The only revenue figures used are the four milestones in the revenue table.
- A Forbes growth percentage. Secondary summaries attribute a year-over-year GAAP revenue growth rate to Forbes, but the Forbes original returned an error and we couldn't read the wording on a primary page.
Frequently asked questions
What is Vercel's market share in 2026?
Vercel holds 19.58% of PaaS detections in TechnologyChecker.io's November 2026 crawl, second of 44 platforms behind AWS at 37.05%, up from 16.70% in June 2026. The 97.86% figure on some data pages is a share of "Backend-as-a-Service", a category that doesn't include Vercel's real competitors, so it isn't comparable.
How many websites use Vercel?
TechnologyChecker.io detects Vercel on 539,244 active domains in its November 2026 crawl, and HTTP Archive counted 161,276 Vercel origins in its September 2026 mobile crawl of home pages. Both are floors, because sites behind another CDN hide Vercel's headers. Domains are not accounts: agencies alone are 6.89% of the enriched list.
How much revenue does Vercel make, and what is its ARR?
Vercel crossed $500 million in annualized run-rate revenue in early July 2026, up from $340 million at the end of February 2026, $200 million in May 2025 and $100 million in early 2024. Vercel is private and publishes no profit figures.
What is Vercel's valuation?
Vercel's last disclosed valuation is $9.3 billion post-money, set by its $300 million Series F on 30 September 2025, co-led by Accel and GIC. Vercel has raised $863 million of primary capital across six rounds, and TechCrunch reported no newer priced round as of April 2026.
Is Vercel a public company, and when is the Vercel IPO?
No, Vercel is privately held, so there's no public Vercel stock and no ticker. CEO Guillermo Rauch said in April 2026 that the company is "ready and getting more ready" for an IPO but gave no timeline. Per-share prices on secondary-market sites are private trades, not a company valuation.
Is Vercel bigger than Netlify?
Yes, by every live-site measure we have. HTTP Archive counted 3.91 Vercel origins per Netlify origin in September 2026, up from 0.54 in January 2022, and TechnologyChecker.io's November 2026 crawl puts the ratio at 2.67. Netlify is still growing, up 48% in HTTP Archive between January and September 2026. It's a race, not a collapse.
Does Vercel run on AWS?
Vercel's edge addresses, including its documented apex IP 76.76.21.21, are announced by AS16509, Amazon's network, according to Cloudflare Radar lookups we ran on 4 November 2026. Netlify's are too, while Render and Fly.io announce their own networks. The lookup shows which network announces the route; it doesn't show Vercel's contract with Amazon.
Who owns Next.js?
Vercel maintains Next.js. The company was founded in 2015 as ZEIT by Guillermo Rauch and renamed Vercel in April 2020. The vercel/next.js repository had 143,306 GitHub stars on 4 November 2026, and 67.77% of the domains we detect on Vercel also run Next.js.
What size companies use Vercel?
Mostly small ones. 89.73% of enriched Vercel domains belong to companies with fewer than 50 staff, 0.89% to companies above 1,000, and 47.04% of the companies were founded in the 2020s. Large companies such as Northrop Grumman, ASML and Sodexo do use Vercel, usually for marketing and careers sites.
How many developers use Vercel?
Vercel doesn't publish an absolute developer count. At Ship 2026 it said its developer base had grown 3x in twelve months. Surveys give proxies: 10.6% of Stack Overflow's 2025 respondents used Vercel, and 4,703 of 10,704 State of JavaScript 2025 respondents (43.9%) used it to host JavaScript apps. More than 4 million people had used v0 by February 2026.
What to watch
Vercel statistics for 2026 all point the same way: HTTP Archive origins up 90% in eight months, our PaaS share up from 16.70% to 19.58%, and run-rate revenue at $500 million, moving with the visible footprint. The open questions are how long that lasts and what's driving it.
- HTTP Archive's monthly crawls through early 2027. If Vercel keeps 2026's pace, the Vercel-to-Netlify ratio passes 4.0 within the next few crawls; it was 3.91 in September 2026. If Netlify matches Vercel's pace instead, the ratio stalls, and that would say the 2026 lift belongs to frontend clouds in general.
- Our December 2026 crawl. Vercel's PaaS share was 19.58% in November. A reading above 20% would confirm the autumn move; a fall back below September's 18.38% would mean the autumn rise was a crawl effect we haven't identified.
- The next revenue disclosure against HTTP Archive's count. If run-rate revenue grows much faster than origins, Vercel is shifting toward money a crawl can't see, AI Gateway among it.
- A priced round or an IPO filing. The $9.3 billion mark from September 2025 predates the $500 million milestone, so any new price will show how the market values the 2026 curve.
- A Radar lookup on 76.76.21.21. If Vercel ever announces its edge from its own network, the AS16509 finding changes, and so does which side of network-based cloud shares Vercel's traffic lands on.
- The September 2027 Core Web Vitals reading. Vercel was at 43.4% against 52.8% for all origins.
The agent hypothesis is the one I'd most like to see tested. Vercel says more than half of its deployments are agent-triggered. If that's what bent the curve, the long tail of small, young Vercel sites will keep growing faster than the top of the web, and the Vercel-per-Next.js line in the rank-tier table is where it'll show first.

CTO
15+ years of experience
David is the CTO of TechnologyChecker, responsible for the engineering and architecture behind the platform's crawling infrastructure.
- MEng Computer Science, University of Edinburgh
- AWS Solutions Architect Professional
- Contributor, Open Source Crawling Frameworks
Never miss our research