TikTok Statistics Q3 2026: Users, Downloads, Revenue & Trends
TikTok statistics Q3 2026: 189M monthly users in the EU (up from 178M), 200M+ in the US, 7.53B downloads, and 402,515 business sites running its pixel.
Published •Updated •Data through September 2026•36 min read
TikTok generated $14.35 billion in revenue in 2023 and its brand was valued at $153.5 billion in 2026, the second most valuable "unicorn" on the planet. One conservative user model puts it at roughly 1.37 billion users in 2025, and ByteDance's flagship app has now crossed 7.53 billion all-time downloads. This report pulls together the latest figures from the primary trackers — Business of Apps, Brand Finance, AppMagic, DataReportal, eMarketer, Metricool and more — and translates each one into what actually matters for users, creators, and the marketers deciding whether TikTok earns a line in the 2026 budget.
I came at these numbers the way I brief my own team. Most TikTok stat roundups quote one big user figure and move on. But "how many people use TikTok" has at least three defensible answers in the current data alone — a conservative user model (~1.37B), an MAU forecast (~2B by 2026), and advertiser reach figures that run country by country. At TechnologyChecker we crawl close to 30 million live websites to detect the technologies they run, and TikTok is a clean example of why the answer depends entirely on what you count. It is overwhelmingly app-first, so its website footprint is a fraction of what its user numbers imply. I'll show you every angle and flag which one to cite for which question.
Updated October 1, 2026 with Q3 2026 data: TikTok's own user disclosures for the US and the EU, Cloudflare Radar rankings re-pulled for every month of 2026, and our September 2026 detection crawl. The first edition (July 22, 2026) is summarised in the update history.
Key findings — TikTok, 2026:
- NEW Q3 2026: TikTok reached 189 million people in the EU every month in January to June 2026, up from 178 million in the second half of 2025. In the US, TikTok said in January 2026 that more than 200 million Americans and 7.5 million businesses use it. -- TikTok DSA transparency reports; TikTok USDS Joint Venture announcement
- NEW Q3 2026: TechnologyChecker detects the TikTok Pixel on 402,515 live business websites in the September 2026 crawl, 3.0% more than in August. Retail apparel brands run it at 7.7 times their share of the web. -- TechnologyChecker (September 2026 crawl)
- $14.35 billion in global revenue in 2023, up 52.6% year over year, with Q4 2023 alone topping $4.1 billion. -- Business of Apps / TikTok
- ~1.37 billion users modeled for 2025 — but that is a conservative user model, not the same as monthly active users, which are forecast near 2 billion by 2026. -- Activate / user-base model
- $153.54 billion brand value in 2026, up more than 8x since 2021 and second only among global unicorns, on a ~$490 billion market cap. -- Brand Finance
- 7.53 billion all-time downloads for TikTok, ahead of every other ByteDance app; the company owns 118 apps across 74 countries. -- AppMagic
- By live web traffic, TikTok is the #10 internet service worldwide, yet
tiktok.comis only the #86 website — the sharpest single measure of how app-first it is. -- Cloudflare Radar (July 2026)- 211,605 live websites embed TikTok on their own pages, 6.6x the Instagram-embed footprint, and 86% of the companies we can size have fewer than 50 employees. -- TechnologyChecker detection crawl (March 2026)
- 3.7% average engagement per post in 2025 — about 7.7x Instagram's 0.48% and 25x Facebook's 0.15%. -- Socialinsider
- Indonesia has the largest audience (180.11 million), ahead of the United States (153.12 million) and Brazil (130.84 million). -- DataReportal / We Are Social
- Saudi Arabia's advertising reach hits 164% of the adult population — a sign of multi-account use and one of nine markets above 100%. -- DataReportal / Manochi
- Charli D'Amelio earned an estimated $23.5 million, the highest-paid TikTok creator, while Khabane Lame is the most-followed at 160.4 million. -- Forbes / Social Blade
- ByteDance is the world's #4 digital advertising company at $60.54 billion, behind only Alphabet, Meta, and Amazon. -- eMarketer
- Only 32% of marketers use TikTok, well behind Facebook (86%) and Instagram (82%) — and 44% have no plans to add it for video. -- Social Media Examiner
- 146.3 million fake accounts were removed in a single quarter (Q4 2025), plus 23.9 million suspected under-13 accounts. -- TikTok
- U.S. ban support softened: strong support for a banning law fell from 37% (2023) to 33% (2024). -- CivicScience
In a decade running B2B growth campaigns, TikTok is the platform executives most often misjudge in both directions. They either assume it's an unstoppable youth juggernaut, or they write it off as a fad their buyers don't use. The 2026 data says something more useful than either: TikTok is a monetization and reach machine with the best per-post engagement in the industry, but its marketer adoption, its organic reach, and its U.S. regulatory footing are all more fragile than the headline user count suggests. Let's work through it.
Is TikTok growing or declining?
TikTok is still growing on its own disclosures: it reached 189 million people in the EU every month in January to June 2026, up from 178 million in July to December 2025, and said in January 2026 that more than 200 million Americans use it. On Cloudflare's traffic ranking it has slipped from #7 (Q3 2025) to #10 for most of 2026, a relative fall as Amazon, WhatsApp and YouTube moved past it.
| Signal | Earlier reading | Latest reading | Direction |
|---|---|---|---|
| EU monthly users (TikTok DSA report) | 178M (Jul–Dec 2025) | 189M (Jan–Jun 2026) | Up 6.2% |
| US users (TikTok) | 170M (24 Apr 2024 statement) | 200M+ (23 Jan 2026) | Up |
| Cloudflare internet-service rank | #7 (Q3 2025 sample dates) | #10 (Q3 2026, 10 of 16 sample dates) | Down 3 places |
| Business websites running the TikTok Pixel (our crawl) | 378,413 (July 2026) | 402,515 (September 2026) | Up 6.4% over two months |
Sources: TikTok newsroom, seventh DSA transparency report (31 Aug 2026) and sixth report (29 Apr 2026); TikTok USDS Joint Venture announcement (23 Jan 2026); TikTok statement on the enactment of the ban law (24 Apr 2024, "170 million Americans"); Cloudflare Radar, radar/ranking/internet_services/top (radar.cloudflare.com), sample dates listed below, pulled 2026-10-01; TechnologyChecker detection crawl.
Q3 2026 analysis: what changed from July to September
Three things moved this quarter. TikTok published a higher EU audience, its US ownership question is settled, and its position in Cloudflare's traffic ranking held at #10 until a late-September jump we don't yet trust.
| Measure | Q3 2025 | Q2 2026 | Q3 2026 |
|---|---|---|---|
| Cloudflare internet-service rank (1.1.1.1 DNS traffic) | #6–7 (#7 on 4 of 5 sample dates) | #10–11 (#10 on 5 of 6 sample dates) | #10 on 10 of 16 sample dates; #11 on 22 Sep; #7 on 25–29 Sep; #6 on 30 Sep (provisional) |
tiktok.com global web rank (weekly) |
not available (history starts 27 Apr 2026) | median #91.5 (range #77–97, 10 weeks) | median #89 (range #76 on 3 Aug to outside the top 100 on 28 Sep, 13 weeks) |
| EU monthly users, latest TikTok disclosure | n/a | 178M (Jul–Dec 2025) | 189M (Jan–Jun 2026) |
| Business websites running the TikTok Pixel | n/a | n/a | 402,515 (September crawl) |
Source: Cloudflare Radar, radar/ranking/internet_services/top?date=… (Q3 2025: 15 Jul, 31 Jul, 15 Aug, 31 Aug, 15 Sep; Q2 2026: 15 Apr, 30 Apr, 15 May, 31 May, 15 Jun, 30 Jun; Q3 2026: 8, 15, 22, 31 Jul, 8, 15, 22, 31 Aug, 8, 15, 22, 25, 27, 28, 29, 30 Sep) and radar/ranking/timeseries_groups?domains=tiktok.com (weekly, 27 Apr to 28 Sep 2026), pulled 2026-10-01. TikTok newsroom DSA reports. TechnologyChecker September 2026 crawl.
The late-September readings need a caution. Between 22 and 30 September TikTok jumped from #11 to #6 while Instagram fell from #6 to #8–9, and tiktok.com dropped out of the global top 100 websites on 28 September. Several unrelated services moved in the same days, and Cloudflare's bot-versus-human split shifted in the same window (see our bot traffic report). One week of simultaneous moves is a measurement event until October shows otherwise, so the quarter row above leans on the settled dates.
TikTok in 2026, month by month
| Month | Internet-service rank (month-end) | tiktok.com web rank (last weekly sample) |
TikTok Pixel, live domains (our crawl) |
|---|---|---|---|
| Sep 2025 | #7 | not available | n/a |
| Jan 2026 | #10 | not available | n/a |
| Feb 2026 | #11 | not available | n/a |
| Mar 2026 | #11 | not available | n/a |
| Apr 2026 | #10 | #77 (27 Apr) | n/a |
| May 2026 | #10 | #87 (25 May) | n/a |
| Jun 2026 | #10 | #93 (29 Jun) | n/a |
| Jul 2026 | #10 | #81 (27 Jul) | 378,413 |
| Aug 2026 | #10 | #85 (31 Aug) | 390,736 |
| Sep 2026 (provisional) | #6 | outside the top 100 (28 Sep; #98 on 21 Sep) | 402,515 |
Source: Cloudflare Radar, radar/ranking/internet_services/top?date=<month-end> and radar/ranking/timeseries_groups?domains=tiktok.com (radar.cloudflare.com), pulled 2026-10-01; Radar's domain-rank history for tiktok.com starts on 27 April 2026. TikTok Pixel counts: TechnologyChecker monthly crawl snapshots. Counts are not a like-for-like series over time: the set of domains we crawl turns over every month, with dead sites dropping out and newly discovered ones added, and our detection signals widen over time.
ChatGPT / OpenAI passed TikTok in February and March 2026 (#10 vs #11), then fell back behind it from April. The month-end table is the series to quote; the September row will be re-checked once October settles.
How many people use TikTok in 2026?
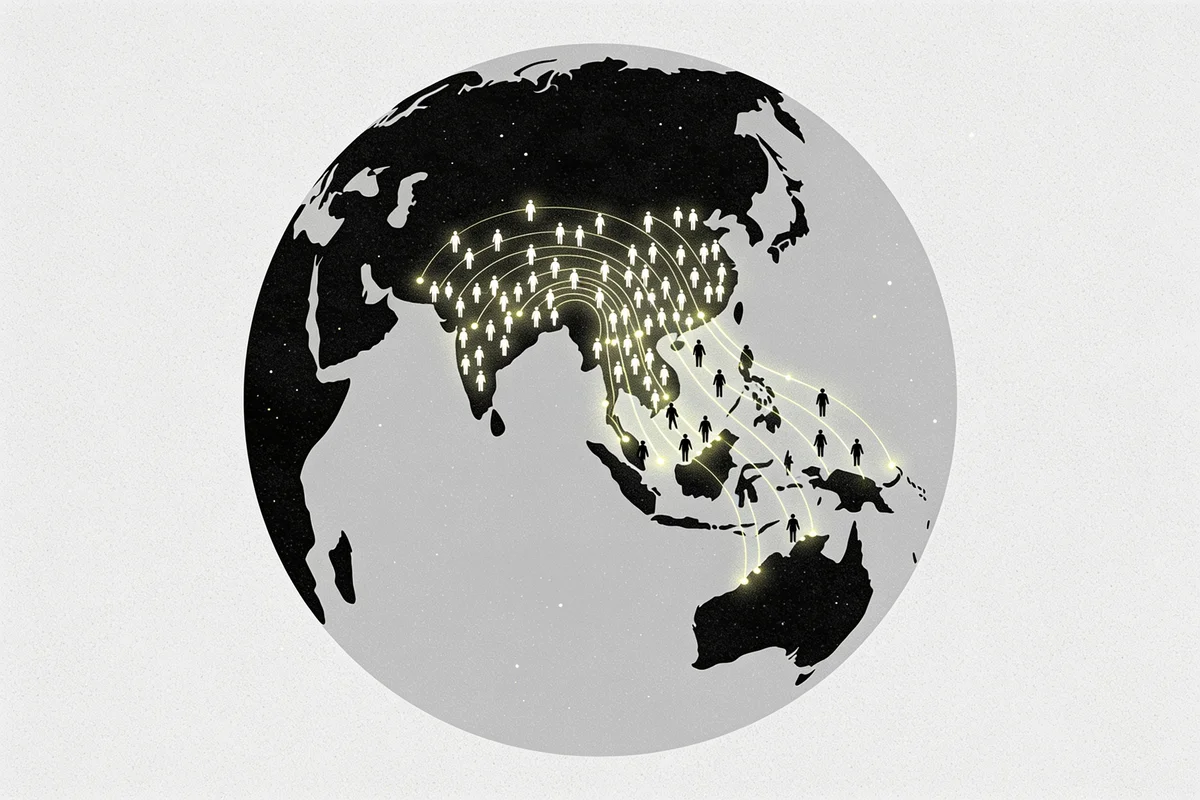
The conservative user model puts TikTok at approximately 1.37 billion users in 2025. That is a model-based figure — and it is deliberately not the same thing as the monthly-active-user (MAU) counts you see quoted elsewhere.
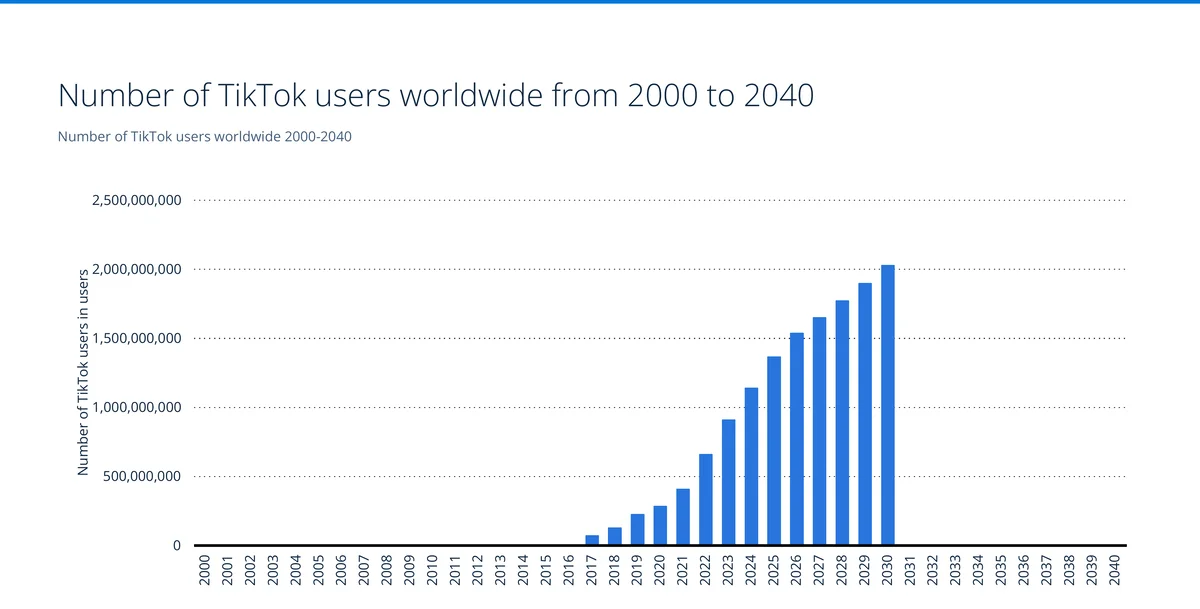
Here's the nuance that trips people up. This chart is a user model, and its forecast beyond 2025 is uneven rather than a clean line up and to the right. A separate MAU projection tells a rosier story: Activate estimated TikTok at 1.5 billion monthly active users in 2022 and forecast 2 billion MAU by the end of 2026, level with where YouTube sits and ahead of Instagram.
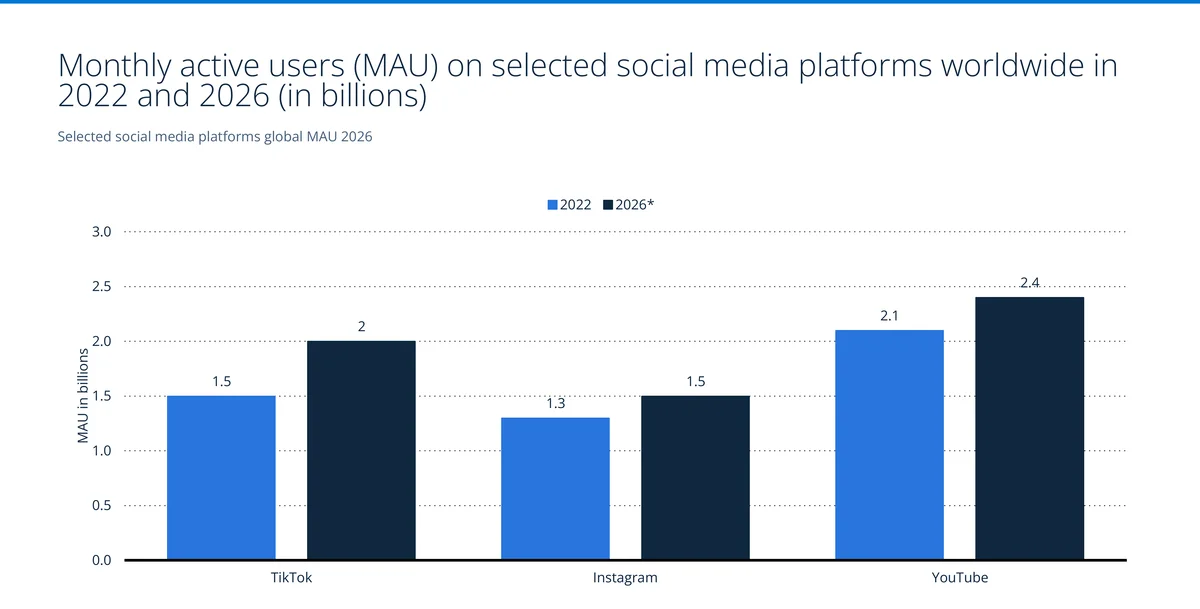
Set the two side by side and you get the honest picture: TikTok is somewhere between a modeled ~1.37 billion and a forecast ~2 billion depending on whether you count registered-active or monthly-active users. When you see TikTok user counts swing by half a billion across articles, this methodology gap is why — not because one source is wrong.
Which countries have the most TikTok users?
The single most useful demographic cut for a marketer is where the audience actually lives, and it is not where most Western media assumes. Indonesia is TikTok's largest market at 180.11 million users, ahead of the United States (153.12 million) and Brazil (130.84 million).
Countries With the Most TikTok Users 2025: Indonesia Leads at 180M
As of October 2025, Indonesia had the largest TikTok advertising audience at 180.11 million users, ahead of the United States (153.12 million) and Brazil (130.84 million). TikTok's center of gravity is South and Southeast Asia plus Latin America rather than North America.
Source: DataReportal, We Are Social · 2025
| Country | TikTok users (millions) |
|---|---|
| Indonesia | 180.11M |
| United States | 153.12M |
| Brazil | 130.84M |
| Mexico | 98.96M |
| Pakistan | 79.93M |
| Vietnam | 76.06M |
| Russia | 66.7M |
| Philippines | 64M |
| Thailand | 56.63M |
| Bangladesh | 56.22M |
| Egypt | 48.78M |
| Nigeria | 47.82M |
- Indonesia leads at 180.11M, ahead of the US at 153.12M
- Six countries each exceed 60 million users
- TikTok's largest markets skew toward Asia and Latin America
The long tail matters as much as the top three. Pakistan (79.93M), Vietnam (76.06M), the Philippines (64M), Bangladesh (56.22M), Egypt (48.78M), and Nigeria (47.82M) all clear 45 million. TikTok's center of gravity is South and Southeast Asia plus Latin America, not North America. If your buyers are there, TikTok is closer to the open internet than a niche channel.
| Rank | Country | TikTok users (millions) |
|---|---|---|
| 1 | Indonesia | 180.11 |
| 2 | United States | 153.12 |
| 3 | Brazil | 130.84 |
| 4 | Mexico | 98.96 |
| 5 | Pakistan | 79.93 |
| 6 | Vietnam | 76.06 |
| 7 | Russia | 66.70 |
| 8 | Philippines | 64.00 |
| 9 | Thailand | 56.63 |
| 10 | Bangladesh | 56.22 |
Source: DataReportal, Meltwater, We Are Social — October 2025, addressable ad audience aged 18+, excludes Douyin.
Where TikTok reach is highest: penetration by country
Raw user counts favor big populations. Penetration, reach as a share of the adult population, shows where TikTok is culturally dominant. And in ten markets, its advertising reach exceeds 100% of the adult population, led by Saudi Arabia at a striking 164%.
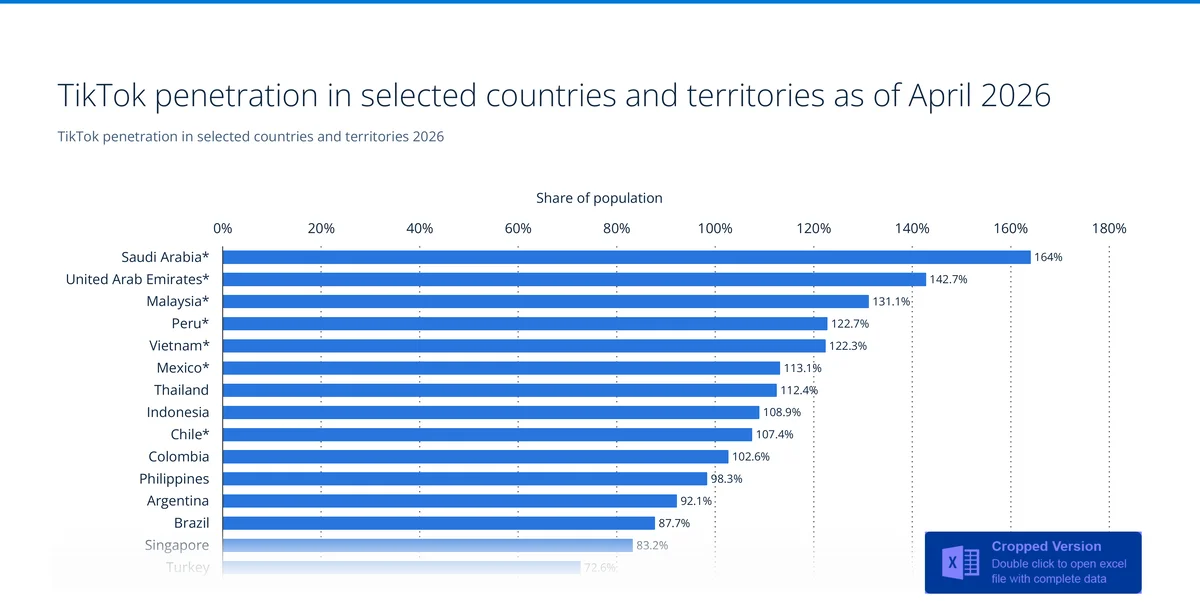
A figure above 100% does not mean everyone is on TikTok twice. It reflects multiple accounts per person and the gap between an advertiser's addressable reach and official adult-population estimates. Saudi Arabia (164%), the UAE (142.7%), and Malaysia (131.1%) top the list, with several Latin American and Southeast Asian markets (Peru, Vietnam, Mexico, Thailand, Indonesia) all above 108%. The practical read: in these countries TikTok is a mass-reach channel on par with television, not a supplementary one.
TikTok's real web footprint: what Cloudflare Radar traffic shows

There's a way to size TikTok that no survey in this report can touch: actual internet traffic. I pulled the numbers below live from Cloudflare Radar on July 22, 2026, and they expose the single most misunderstood thing about TikTok's scale — the answer flips depending on whether you measure the app or the website.
Measured as an internet service (all the DNS traffic every domain TikTok operates generates across Cloudflare's 1.1.1.1 resolver), TikTok ranks #10 in the world, sitting between Amazon (#9) and Bing (#11), and ahead of Netflix (#12) and ChatGPT/OpenAI (#13).
tiktok.com is only #86. That ~76-place gap is the app-first economy in a single number.| Rank | Internet service (by 1.1.1.1 DNS traffic) |
|---|---|
| 1 | |
| 2 | |
| 3 | Apple |
| 4 | Microsoft |
| 5 | |
| 6 | Amazon Web Services |
| 7 | |
| 8 | YouTube |
| 9 | Amazon |
| 10 | TikTok |
| 11 | Bing |
| 12 | Netflix |
| 13 | ChatGPT / OpenAI |
Source: Cloudflare Radar — ranking/internet_services/top (radar.cloudflare.com), pulled July 22, 2026.
Now flip to the website view — how often people actually open a platform in a browser rather than its app. Here tiktok.com ranks only #86 globally, while its peers cluster near the very top of the web:
| Platform website | Cloudflare Radar global domain rank |
|---|---|
| facebook.com | #7 |
| instagram.com | #13 |
| youtube.com | #14 |
| whatsapp.com | #56 |
| snapchat.com | #62 |
| tiktok.com | #86 |
Source: Cloudflare Radar — ranking/domain/{domain} (radar.cloudflare.com), pulled July 22, 2026.
TikTok rivals Instagram and YouTube on monthly active users (by the MAU forecast earlier it passes both), yet its website ranks roughly 70 places lower than instagram.com (#13) and youtube.com (#14). The reason is the entire app-first story in one line: people almost never visit tiktok.com in a browser. They live inside the app, which talks to TikTok's own API and CDN endpoints — traffic the service ranking captures but the website ranking never sees. TikTok is even more app-locked than Instagram, whose website still pulls genuine browser traffic. In the United States specifically, tiktok.com doesn't even crack the top 100 domains, because the American web is more crowded at the top and TikTok's pull there is almost entirely in-app.
The live chart below tracks tiktok.com's global web-domain rank straight from Radar, so it stays current after this post is published:
Over recent months that rank has bounced between the high-70s and high-90s, landing around #86 in mid-July 2026 — a fast-moving figure, so date-stamp it whenever you quote it.
⚠️ Q3 2026 update: the weekly rank reached its 2026 high of #76 on 3 August, drifted back to #98 by 21 September, and fell outside the top 100 on 28 September (provisional; several services moved in the same week). TikTok's internet-service rank held at #10 through mid-September. See the Q3 2026 analysis.
tiktok.com to your own site, the #86 web rank is the reality check. I've watched teams budget TikTok like a search-and-referral channel and get burned; it keeps users inside the app by design. Treat it as a reach-and-engagement channel, not a traffic-referral one. — Elif Arslan, CMOWhich businesses actually put TikTok on their website?
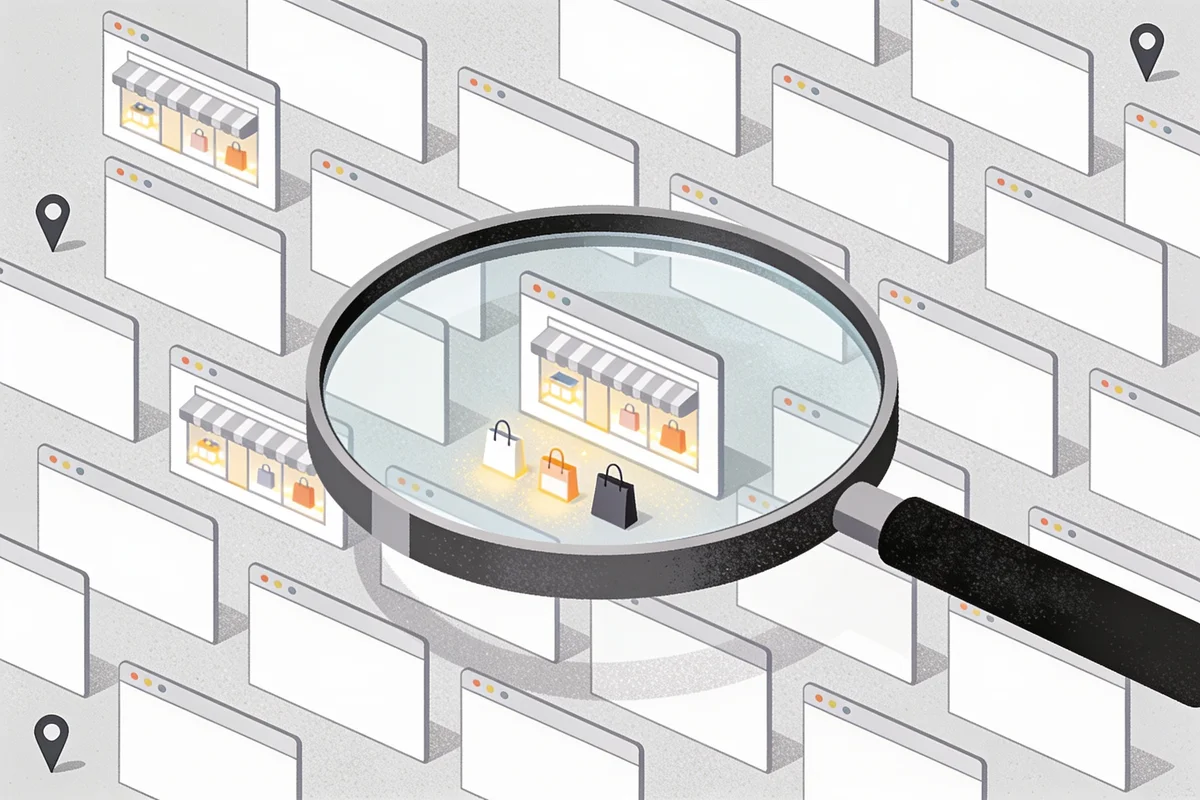
TikTok's traffic story is app-first, but that's only half the picture. The other half is what businesses do on the open web, and here TikTok's footprint is bigger than most stat roundups would guess. This is the part I can measure directly rather than pull from a third-party tracker. At TechnologyChecker we crawl close to 30 million live websites to detect the technologies each one runs, and TikTok shows up two ways: as an embed (a business dropping a TikTok video or its profile link onto its own pages) and as the TikTok Pixel (the conversion-tracking tag advertisers install). In our March 2026 crawl, 211,605 live domains carry a TikTok embed — plus a further 437,618 that had one previously and dropped it, which tells you how often embedded clips and campaign links rotate on and off product pages.
Put that next to the same detection for Instagram and it's a genuine surprise: businesses embed TikTok on 6.6x as many sites as Instagram (31,886), even though Instagram has the larger, more mature user base and far higher marketer adoption (82% versus TikTok's 32%). The likeliest reason: TikTok embeds work as social proof. A shop drops a viral "as seen on TikTok" clip onto a product page, whereas Instagram's presence is usually a single profile link in the footer.
What we detect, in plain terms: the TikTok embed is a video or profile link a business places on its own website, not the billion-plus people scrolling inside the app. It's a much smaller, but far more actionable, signal: it tells you which companies treat TikTok as a channel worth wiring into their storefront.
September 2026 crawl: who runs the TikTok Pixel now
The March figures in this section (240,694 pixel sites, 211,605 embeds) come from our March 2026 crawl and are kept as published. They are not a like-for-like series with September: the set of domains we crawl turns over every month, with dead sites dropping out and newly discovered ones added, and our detection signals widen over time. In the September crawl our current link detection counts 6,825 sites linking to a TikTok account, a narrower definition than the March embed count, so the two cannot be compared.
Which industries over-index on the TikTok Pixel, against the share of the whole web each industry holds:
| Industry | Share of TikTok Pixel sites | Over-index vs all websites |
|---|---|---|
| Retail apparel & fashion | 6.03% | 7.7× |
| Retail | 12.31% | 3.1× |
| Manufacturing | 2.29% | 2.8× |
| Food & beverage services | 2.42% | 2.8× |
| Wellness & fitness services | 3.09% | 1.9× |
| Advertising services | 2.46% | 0.8× |
Source: TechnologyChecker website observations enriched with company information, September 2026 crawl; 120,693 TikTok Pixel sites matched to a company industry. Over-index = the industry's share of TikTok Pixel sites divided by its share of the 13.1M live sites we can match to an industry. We excluded about 7,900 insurance sites that run one shared enterprise platform stack (more than 9 in 10 of them also carry Amazon Webstore, ServiceNow, Adobe Analytics and mParticle), because one deployment would otherwise show up as an "insurance" preference.
The September read matches what the March embed data said from a different angle: TikTok's advertisers are consumer brands, and fashion above all. Advertising agencies, which you might expect to over-index on a platform pixel, sit slightly below their share of the web.
The typical TikTok-embedding company is small and sells to consumers
We matched 61,041 of those active domains to LinkedIn firmographic data. The size distribution is lopsided in exactly the direction TikTok's brand would predict: 70% of the companies have just 1-10 employees, 86% have fewer than 50, and under 3% employ more than 1,000. A TikTok embed on a company's site is a near-reliable tell for a small, marketing-active business, not an enterprise.
TikTok Website Footprint by Company Size 2026: 86% Under 50 Staff
Of the businesses that place a TikTok embed on their own website, 70% have 1-10 employees and 86% have fewer than 50. Fewer than 3% employ more than 1,000 people. Based on 58,763 domains from TechnologyChecker's March 2026 crawl that we could match to LinkedIn firmographic data. TikTok's website footprint clusters heavily around small, consumer-facing businesses rather than large enterprises.
Source: TechnologyChecker · 2026
| Employees (LinkedIn band) | Companies with a live TikTok embed |
|---|---|
| 1-10 | 41236 |
| 11-50 | 9410 |
| 51-200 | 4431 |
| 201-500 | 1415 |
| 501-1,000 | 721 |
| 1,001-5,000 | 886 |
| 5,001-10,000 | 170 |
| 10,001+ | 601 |
- 70% of companies embedding TikTok have just 1-10 employees
- 86% have fewer than 50 employees; under 3% have more than 1,000
- A TikTok embed is a strong signal for a small, consumer-facing business, not an enterprise
The industry mix says the same thing from another angle. Consumer retail dominates: adding up retail, apparel and fashion, luxury goods, and health-and-personal-care storefronts, more than a quarter of TikTok-embedding companies are in retail, and once you fold in beauty manufacturing, wellness, and food-and-beverage, the consumer-goods cluster is over a third of the matched set. This is the "TikTok made me buy it" economy showing up in first-party detection data.
| Industry (LinkedIn) | Companies with a TikTok embed | Share of matched |
|---|---|---|
| Retail | 7,561 | 14.4% |
| Retail apparel & fashion | 4,196 | 8.0% |
| Wellness & fitness services | 1,620 | 3.1% |
| Personal care product manufacturing | 1,577 | 3.0% |
| Manufacturing | 1,494 | 2.9% |
| Food & beverage services | 1,340 | 2.6% |
| Advertising services | 1,270 | 2.4% |
| Technology, information & internet | 1,259 | 2.4% |
| Retail luxury goods & jewelry | 988 | 1.9% |
| Retail health & personal care | 949 | 1.8% |
Source: TechnologyChecker, March 2026 crawl; 52,330 LinkedIn-matched domains with a live TikTok embed and a known industry.
The United States leads business adoption, but Brazil punches above its weight
By country, the business footprint concentrates where the web economy is dense, not where TikTok has the most users. The United States alone accounts for 37% of TikTok-embedding companies (21,742 sites), followed by the United Kingdom and then Brazil. That last one matters: Brazil is TikTok's third-largest consumer market and it lands third here too, the only country whose business adoption tracks its raw user base this closely. India, TikTok's onetime giant, is absent for a different reason entirely: TikTok has been banned there since 2020.
| Country | Companies with a TikTok embed | Share of matched |
|---|---|---|
| United States | 21,742 | 36.9% |
| United Kingdom | 5,510 | 9.3% |
| Brazil | 4,636 | 7.9% |
| Australia | 2,979 | 5.1% |
| Canada | 2,603 | 4.4% |
| France | 1,692 | 2.9% |
| Germany | 1,647 | 2.8% |
| Spain | 1,526 | 2.6% |
| Netherlands | 1,318 | 2.2% |
| Italy | 1,310 | 2.2% |
Source: TechnologyChecker, March 2026 crawl; 58,967 LinkedIn-matched domains with a live TikTok embed and a known country.
Link versus tracker: TikTok is used differently than Meta
Here's the cut I find most revealing, because it separates how businesses use a platform. A social embed is an outbound link: "come find us on TikTok." A conversion pixel is a measurement layer: "track what TikTok sends us." For most of the web, those two numbers are wildly different. When I ran the same detection for Instagram, the Facebook Pixel showed up on 2.07 million sites, roughly 65 times the Instagram embed footprint. Companies wire Meta's tracking into their sites far more than they link their Instagram.
TikTok breaks that pattern. Its conversion pixel is on 240,694 live sites and its embed on 211,605, only about 1.14x apart. TikTok is used as a destination to send people to almost as often as a conversion channel to measure, whereas Meta is overwhelmingly a measurement layer. Small Shopify brands still put Meta first: on the 19,160 store domains of companies that use Stamped, a review app, the TikTok Pixel runs on 19.12% against the Facebook Pixel's 69.07% (September 2026 crawl).
| TikTok signal on company websites | What we detect | Live sites (March 2026) |
|---|---|---|
| TikTok Conversion Pixel | Ad / conversion-tracking tag | 240,694 |
| TikTok embed | Video or profile link on the page | 211,605 |
| Instagram embed (for reference) | Profile / account link | 31,886 |
TikTok user demographics: age and gender
TikTok's audience is younger and slightly more male than the platform's early "Gen Z girls dancing" reputation. The 25-34 bracket is the single largest group, at 41.6% of the audience combined (23% male, 18.6% female), and it now outweighs the 18-24 cohort.
TikTok Age & Gender Demographics 2026: 25-34 Is the Core
As of April 2026, the 25-34 age group is TikTok's single largest cohort at 41.6 percent of the audience combined (23% male, 18.6% female), now outweighing the 18-24 bracket. Every age band skews slightly male, and users aged 25 and older make up the majority of the addressable audience.
Source: DataReportal, We Are Social · 2026
| Age group | Share of TikTok users |
|---|---|
| 18-24 | 11.4% |
| 25-34 | 18.6% |
| 35-44 | 8% |
| 45-54 | 4.7% |
| 55+ | 4.6% |
- 25-34 is the largest group at 41.6% combined
- Every age band skews slightly male
- Users 25 and older are the majority of the audience
That maturity is the demographic story most brand decks miss. Add the 35-44 group (16.8% combined) and users 25 and older make up the majority of TikTok's addressable audience. The under-25 crowd is real and loud, but it is no longer where most of the reach lives. On gender, the addressable ad audience skews male in every bracket, and a separate October 2025 read puts the global split at 54.5% male to 45% female.
TikTok revenue, valuation, and brand value
TikTok's revenue curve is one of the steepest in consumer tech. The platform grew from $63 million in 2017 to $14.35 billion in 2023, a 228x jump in six years, with the pandemic years acting as the accelerant.
TikTok Revenue 2017-2023: From $63 Million to $14.35 Billion
TikTok's global revenue grew from $63 million in 2017 to $14.35 billion in 2023, a 228x increase in six years. The 2023 figure was up 52.6 percent year over year, and quarterly revenue crossed the $4 billion threshold in the fourth quarter of 2023.
Source: Business of Apps · 2017-2023
| Year | TikTok revenue (USD billions) |
|---|---|
| 2017 | $0.06B |
| 2018 | $0.15B |
| 2019 | $0.35B |
| 2020 | $2.64B |
| 2021 | $4.7B |
| 2022 | $9.4B |
| 2023 | $14.35B |
- 228x revenue growth in just six years
- Up 52.6% year over year into 2023
- Q4 2023 alone topped $4.1 billion in revenue
The 2023 figure alone was up 52.6% on the prior year, and quarterly revenue crossed the $4 billion threshold in Q4 2023, a 43.5% jump on Q4 2022. Two engines drive it: advertising and in-app purchases. On the consumer side, TikTok's mobile in-app purchase (IAP) revenue (the virtual gifts, coins, and tips users buy) reached roughly $1.3 billion in a single quarter by the end of 2025.
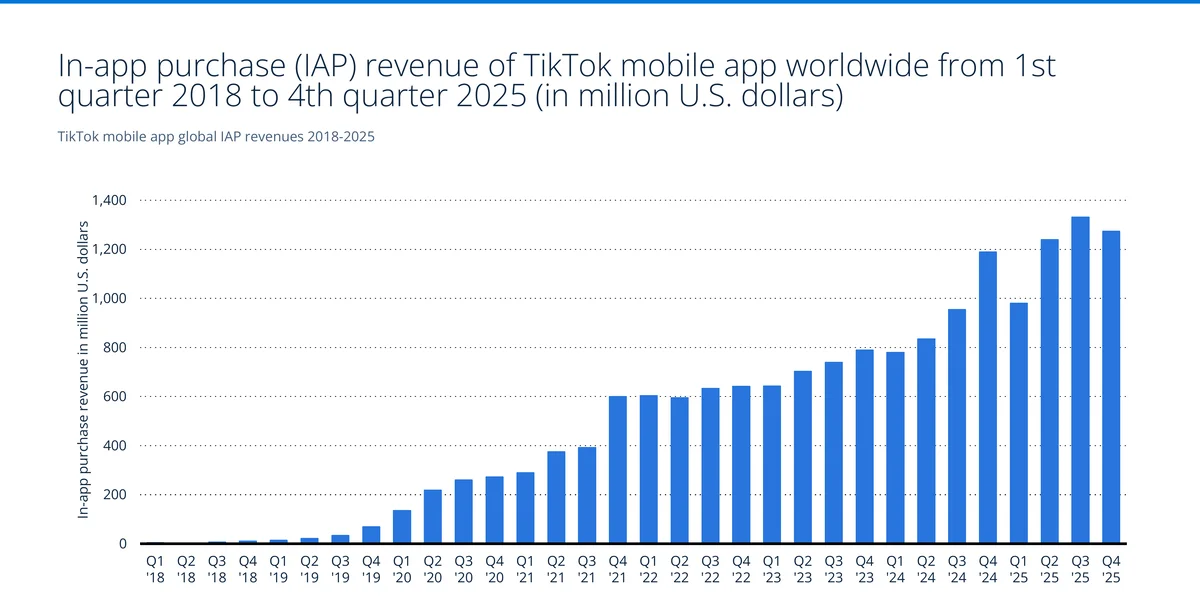
That IAP line climbs from near zero in 2018 to a steady four-figure-million run rate by 2024-2025, and it is net of Apple and Google platform fees. The gifting economy that funds live creators is now a billion-dollar-a-quarter business on its own, separate from ads.
All of that feeds a valuation that has gone vertical. TikTok/Douyin's brand value reached $153.54 billion in 2026, more than eight times its 2021 level, making it the second most valuable unicorn worldwide on a reported ~$490 billion market cap.
TikTok/Douyin Brand Value 2021-2026: $18.75B to $153.54B
TikTok/Douyin's brand value rose from $18.75 billion in 2021 to $153.54 billion in 2026, an eightfold increase in five years. ByteDance's short-video app surpassed Instagram and WhatsApp as the most downloaded mobile app and ranked as the second most valuable unicorn worldwide as of late 2025, with a market cap near $490 billion.
Source: Brand Finance · 2021-2026
| Year | Brand value (USD billions) |
|---|---|
| 2021 | $18.75B |
| 2022 | $58.98B |
| 2023 | $65.7B |
| 2024 | $84.2B |
| 2025 | $105.79B |
| 2026 | $153.54B |
- $153.54 billion brand value in 2026, an 8x rise since 2021
- Crossed $100B for the first time in 2025 ($105.79B)
- Second most valuable unicorn worldwide as of late 2025
TikTok download statistics
Downloads are where TikTok's global scale is clearest. The app has amassed 7.53 billion all-time downloads since its 2016 release, and quarterly installs have stayed remarkably durable years after the initial explosion.
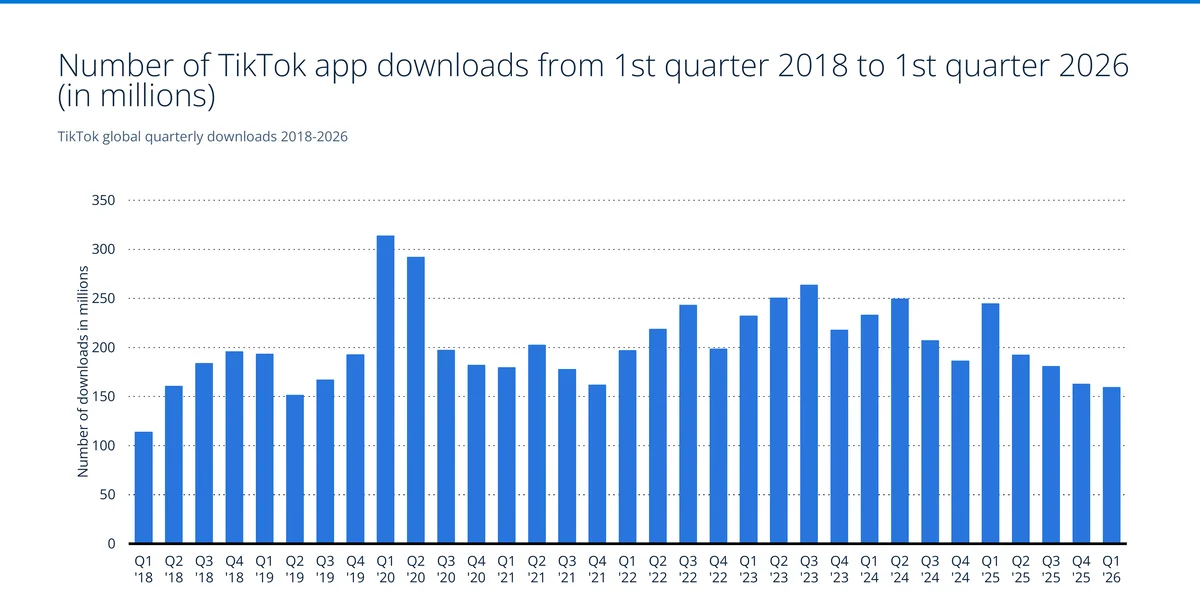
Quarterly downloads peaked at 313.53 million in Q1 2020 (up 62.3% year over year, the pandemic surge) and have since settled into a healthy 150-260 million per quarter, landing around 159.2 million in Q1 2026. A five-year-old app still pulling 150 million-plus new installs a quarter is not a platform in decline.
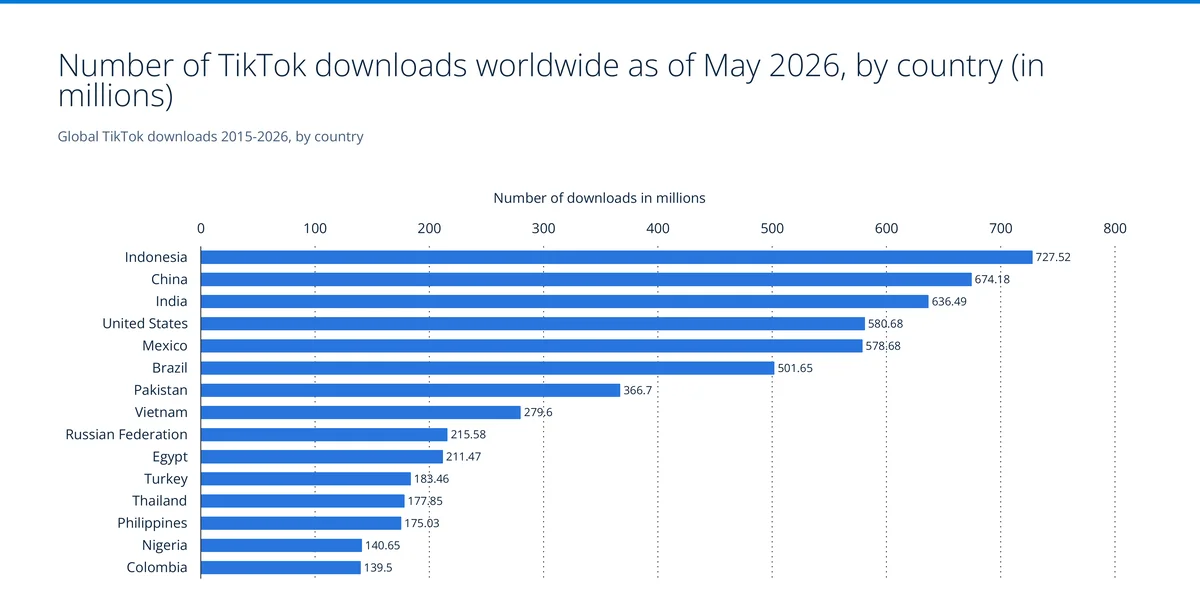
By country, the all-time download leaderboard again puts Indonesia on top, at 727.52 million downloads, with China (674.18M) and India (636.49M) close behind — a reminder that TikTok's history includes a massive India base before its 2020 ban there.
TikTok inside the ByteDance app portfolio
TikTok is the flagship, but ByteDance is a portfolio company, and the download data shows how far ahead TikTok sits. TikTok's 7.53 billion downloads are more than 2.6x its nearest sibling, CapCut (2.85 billion) — ByteDance's video editor, which quietly became one of the most-installed apps in the world.
ByteDance App Downloads 2026: TikTok Tops 7.53 Billion
As of July 2026, TikTok had amassed 7.53 billion all-time downloads, more than 2.6 times its nearest sibling, the video editor CapCut, at 2.85 billion. No other ByteDance app clears 500 million. ByteDance operates 118 apps across 74 countries.
Source: AppMagic · 2026
| App | All-time downloads (billions) |
|---|---|
| TikTok | 7.53B |
| CapCut | 2.85B |
| Cici | 0.46B |
| TickTock | 0.44B |
| Helo | 0.39B |
| Huoshan Video | 0.39B |
| Hypic | 0.31B |
| Toutiao | 0.26B |
| Ulike | 0.24B |
| Tomato Novel | 0.19B |
- TikTok's 7.53B downloads are 2.6x CapCut's 2.85B
- No other ByteDance app clears 500 million
- ByteDance operates 118 apps across 74 countries
Below CapCut, no single ByteDance app clears 500 million — Cici (458.98M), the confusingly named TickTock clone (444.8M), and Helo (388.44M) lead a long tail. ByteDance operates 118 apps across 74 countries, but the business is overwhelmingly a TikTok-and-CapCut story.
On monetization by platform, TikTok's iOS in-app spending is dominated by China and the United States. In Q1 2026, China generated $295.87 million in iOS revenue and the U.S. $207.71 million, together dwarfing every other market:
| Market | iOS revenue (Q1 2026) | Google Play revenue (Q1 2026) |
|---|---|---|
| United States | $207.71M | $161.85M |
| China | $295.87M | — |
| Japan | $52.86M | $24.83M |
| Germany | $7.22M | $35.44M |
| United Kingdom | $15.55M | $11.95M |
| Saudi Arabia | $6.82M | $22.24M |
Source: AppMagic — Q1 2026. China dominates iOS; the U.S. leads Google Play at $161.85M.
TikTok engagement benchmarks: the B2B case
This is the section I point skeptical clients to first. Whatever you think of TikTok's audience, its per-post engagement is in a different league. In 2025, the average TikTok post earned a 3.7% engagement rate — roughly 7.7 times Instagram's 0.48% and about 25 times Facebook's 0.15%.
Social Media Engagement Rates 2025: TikTok Dominates at 3.7%
In 2025, TikTok held the highest average engagement rate (ER) based on number of followers: 3.7 percent. Instagram's ER stood at 0.48 percent, whereas Facebook's and X's reached 0.15 and 0.12 percent respectively. TikTok's engagement rate is nearly 8x Instagram's and roughly 25x Facebook's.
Source: Socialinsider · 2025
| Platform | Engagement rate per follower |
|---|---|
| TikTok | 3.7% |
| 0.48% | |
| 0.15% | |
| X (Twitter) | 0.12% |
- TikTok's 3.7% engagement rate is roughly 8x Instagram's 0.48%
- Facebook (0.15%) and X (0.12%) sit far behind on per-follower engagement
- High engagement does not equal high marketer ROI - TikTok ranks last for ROI
TikTok's rate has been volatile: 4.53% in 2021, dipping to 2.5% in 2024, then rebounding to 3.7% in 2025, but it has never once been close to matched by another network over the five-year window. For an organic-reach-starved marketer, that gap is the entire argument.
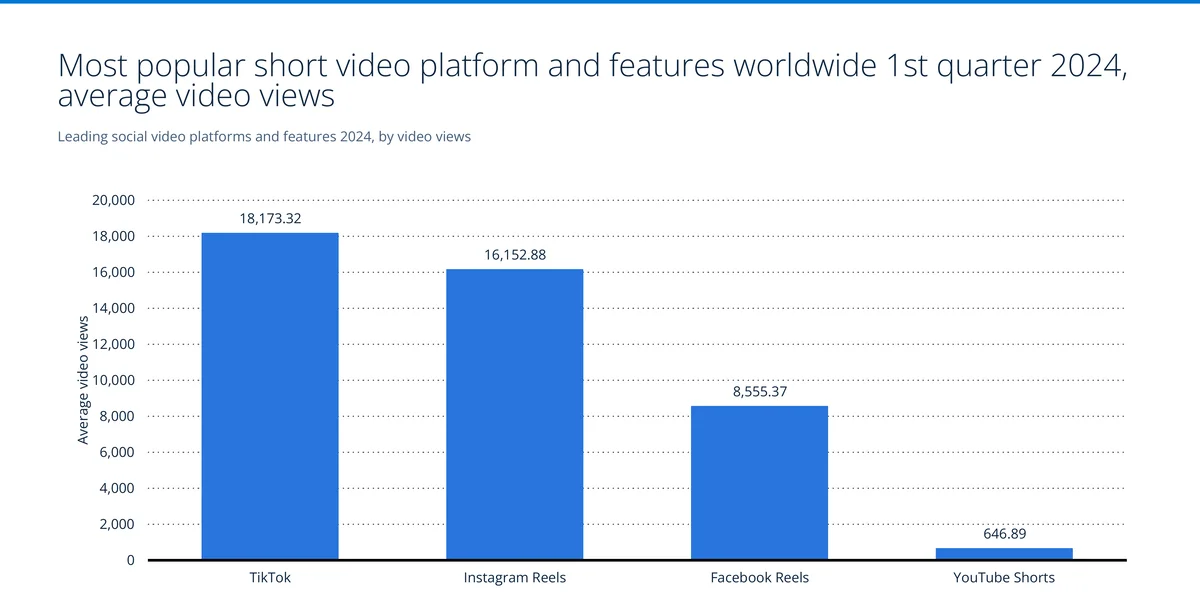
The same advantage shows up in raw reach. In Q1 2024, the average TikTok video pulled 18,173 views, ahead of Instagram Reels (16,153) and dramatically ahead of YouTube Shorts (647).
Format matters enormously inside TikTok, too. Video posts crush image and carousel posts on every metric — an average TikTok video gets 32,895 views to a carousel's 5,890:
| Metric (2026 avg) | Video | Image / Carousel |
|---|---|---|
| Views | 32,895 | 5,890 |
| Reach | 25,654 | 4,391 |
| Likes | 1,097.6 | 137.4 |
| Comments | 16.96 | 3.54 |
| Shares | 92.87 | 13.54 |
| Posts per week | 2.54 | 0.99 |
Source: Metricool — 2026, based on ~92,000 accounts and over 2.31 million posts.
Organic reach is getting harder for everyone
The most important trend for creators and brands is that TikTok's organic reach fell across every account size in 2026. Bigger accounts got hit hardest — reach dropped about 37% for "big" accounts and 36% for "medium" ones, versus a 19% decline for the smallest.
| Account size | Reach change (2026) | Videos posted per week (2024 → 2025) |
|---|---|---|
| Tiny (≤2K followers) | -19% | 2.08 → 2.49 |
| Small | -30% | 3.13 → 3.66 |
| Medium | -36% | 4.34 → 5.28 |
| Big | -37% | 7.34 → 10.07 |
| Huge (>1M followers) | -34% | 18.25 → 29.79 |
Source: Metricool — reach decline 2026; posting frequency 2024-2025.
The two columns together tell the real 2026 creator story: reach is falling and everyone is posting more to compensate. The biggest accounts nearly doubled their posting cadence to 29.79 videos a week. It's a treadmill, and it's speeding up.
TikTok creators and the influencer economy

TikTok's creator economy is now measured in nine figures of followers and eight figures of dollars. Khabane Lame leads with 160.4 million followers, just ahead of Charli D'Amelio (155.8M), with MrBeast third at 124.6 million.
Most-Followed TikTok Creators 2026: Khaby Lame Leads at 160.4M
As of March 2026, Italy-based comedian Khabane (Khaby) Lame was the most-followed creator on TikTok with 160.4 million followers, narrowly ahead of Charli D'Amelio (155.8 million). MrBeast ranked third among individual creators with 124.6 million, showing how the platform's biggest names now rival the audiences of major broadcasters.
Source: Social Blade · 2026
| Creator | Followers (millions) |
|---|---|
| Khaby Lame | 160.4M |
| Charli D'Amelio | 155.8M |
| MrBeast | 124.6M |
| TikTok | 92.8M |
| Bella Poarch | 92.7M |
| Addison Rae | 88.3M |
| Zach King | 84.3M |
| Willie Salim | 83.9M |
| Kimberly Loaiza | 83.7M |
| The Rock | 79.8M |
- Khaby Lame leads TikTok with 160.4 million followers
- Charli D'Amelio is a close second at 155.8 million
- MrBeast tops individual creators behind them with 124.6 million
Follower counts are vanity; earnings are the business. On that measure, Charli D'Amelio was the highest-paid TikTok creator at an estimated $23.5 million (April 2024-April 2025), with Khaby Lame second at $20 million.
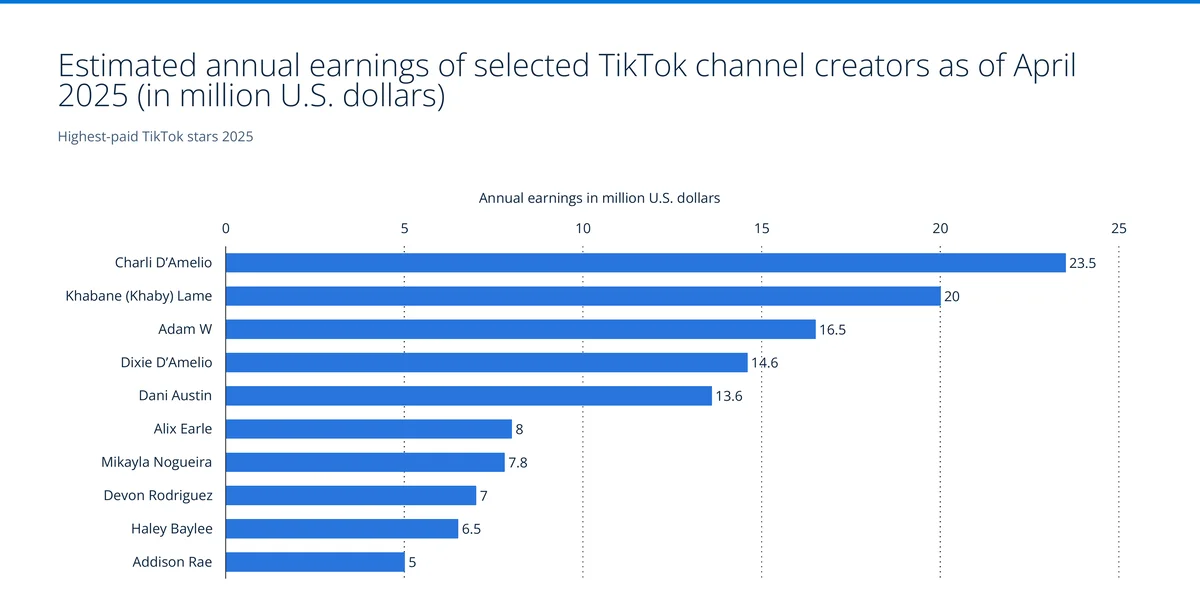
The earnings drop off steeply after the top five (Adam W at $16.5M, Dixie D'Amelio $14.6M, Dani Austin $13.6M), then fall to $5-8 million for names like Alix Earle and Addison Rae. It's a power-law economy: a handful of creators capture the eight-figure deals, and the middle earns far less than the follower counts suggest.
TikTok for marketers and advertisers

Here is the counterintuitive part, and the reason I tell clients not to confuse consumer scale with marketer adoption. Despite TikTok's engagement dominance, only 32% of marketers use it — placing it fifth, far behind Facebook (86%), Instagram (82%), LinkedIn (72%), and YouTube (58%).
Social Platforms Marketers Use 2026: TikTok 5th at 32%
As of January 2026, only 32 percent of marketers used TikTok, ranking it fifth and far behind Facebook (86%), Instagram (82%), LinkedIn (72%) and YouTube (58%). TikTok's marketer adoption lags well behind its consumer scale and best-in-class engagement.
Source: Social Media Examiner · 2026
| Platform | Share of marketers |
|---|---|
| 86% | |
| 82% | |
| 72% | |
| YouTube | 58% |
| TikTok | 32% |
| X/Twitter | 23% |
| Threads | 13% |
- Only 32% of marketers use TikTok, ranking it 5th
- Facebook leads at 86%, Instagram 82%
- TikTok trails despite the highest per-post engagement in the industry
That adoption gap is TikTok's biggest B2B weakness and its biggest opportunity, depending on where you sit. Forward intent is lukewarm, too: only 38% of marketers plan to increase organic TikTok use and 42% have no plans to use it at all; for video, 42% plan to increase while 44% have no plans. Compare that to YouTube, where 62% plan to grow organic use. The marketers who commit to TikTok still face far less competition for attention than they do on Meta's platforms.
When brands do run TikTok ads, they mostly buy reach. Reach was the top campaign objective at 34.1% of campaigns, ahead of video views (19.9%) and web conversions (13.4%):
| TikTok ad objective (Q1 2025) | Share of campaigns |
|---|---|
| Reach | 34.1% |
| Video views | 19.9% |
| Web conversions | 13.4% |
| Traffic | 12.5% |
| Sales lead generation | 10.4% |
| App promotion | 9.7% |
Source: Metricool — Q1 2025, based on 9 billion impressions across 503,281 campaigns.
The tilt toward reach and video views over conversions tells you how most brands still treat TikTok: as an awareness channel, not a performance one. The effectiveness data suggests that may be a mistake — an April 2023 study found 97% of TikTok campaigns drove incremental TV tune-ins, with an average 159% lift and viewers spending 86 extra minutes with advertised content after exposure.
Zoom out to the parent company and TikTok's ad business is already elite. ByteDance is the world's #4 digital advertising company at $60.54 billion in 2025, trailing only Alphabet ($209.15B), Meta ($183.8B), and Amazon ($69.3B).
Top Digital Ad Companies 2025: ByteDance 4th at $60.54 Billion
In 2025, ByteDance was the world's fourth-largest digital advertising company at $60.54 billion, behind only Alphabet ($209.15B), Meta ($183.8B) and Amazon ($69.3B). TikTok's parent already runs an ad business rivaling mid-size tech giants.
Source: eMarketer · 2025
| Company | Digital ad revenue (USD billions) |
|---|---|
| Alphabet | $209.15B |
| Meta | $183.8B |
| Amazon | $69.3B |
| ByteDance | $60.54B |
| Alibaba | $42.23B |
| Pinduoduo | $30.1B |
| Microsoft | $17.23B |
| Tencent | $17.06B |
| Kuaishou | $11.95B |
| Apple | $11.73B |
- ByteDance ranks 4th at $60.54B, behind only Alphabet, Meta and Amazon
- Alphabet leads at $209.15B
- ByteDance's ad revenue alone rivals mid-size tech giants
On influencer partnerships, U.S. marketers largely held their nerve through the ban scare: in September 2024, 66% said the potential ban had not caused them to pause or stop working with TikTok influencers, versus 34% who had.
Content moderation and platform safety
Scale brings a moderation firehose, and TikTok's enforcement numbers are enormous. In Q4 2025, the platform removed roughly 146.3 million fake accounts plus 23.9 million accounts suspected of belonging to under-13 users in a single quarter.
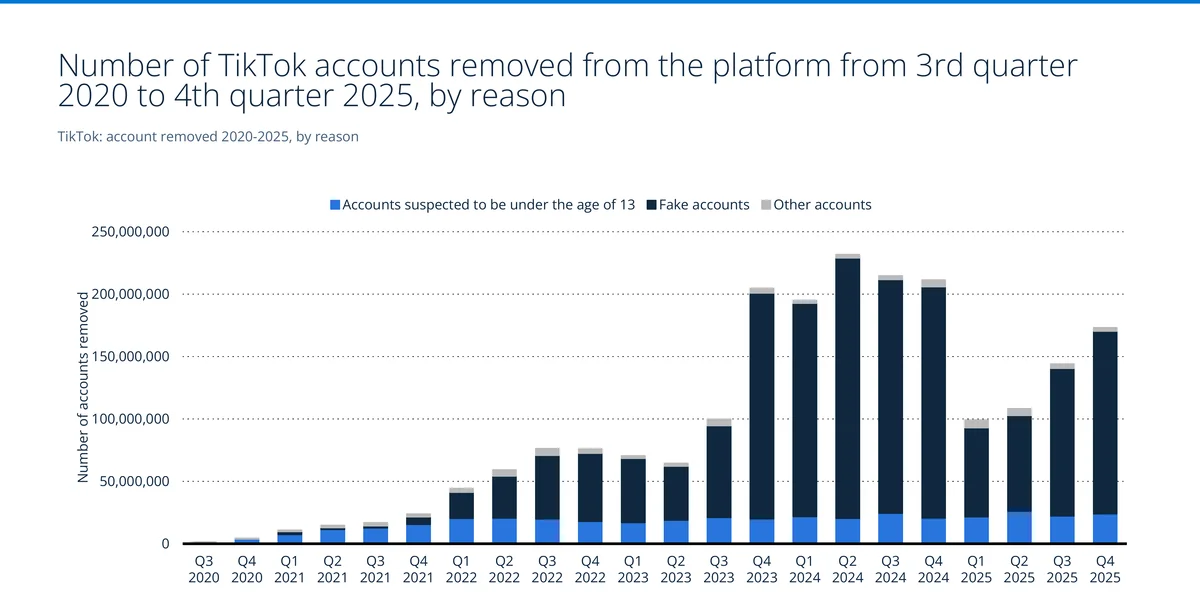
Fake accounts dominate the removals, with under-13 suspensions a consistent secondary band. Quarterly account removals peaked at 232 million in Q2 2024 and have run in the 100-150 million range through 2025. The platform also suspended around 12.3 million live-streaming sessions in Q3 2024, restored about 2.63 million in Q3 2025, and pulled roughly 7.94 million ads for account actions in its most recent quarter. These are the numbers a brand-safety team should have on hand before greenlighting a campaign.
Spotlight: the U.S. TikTok ban

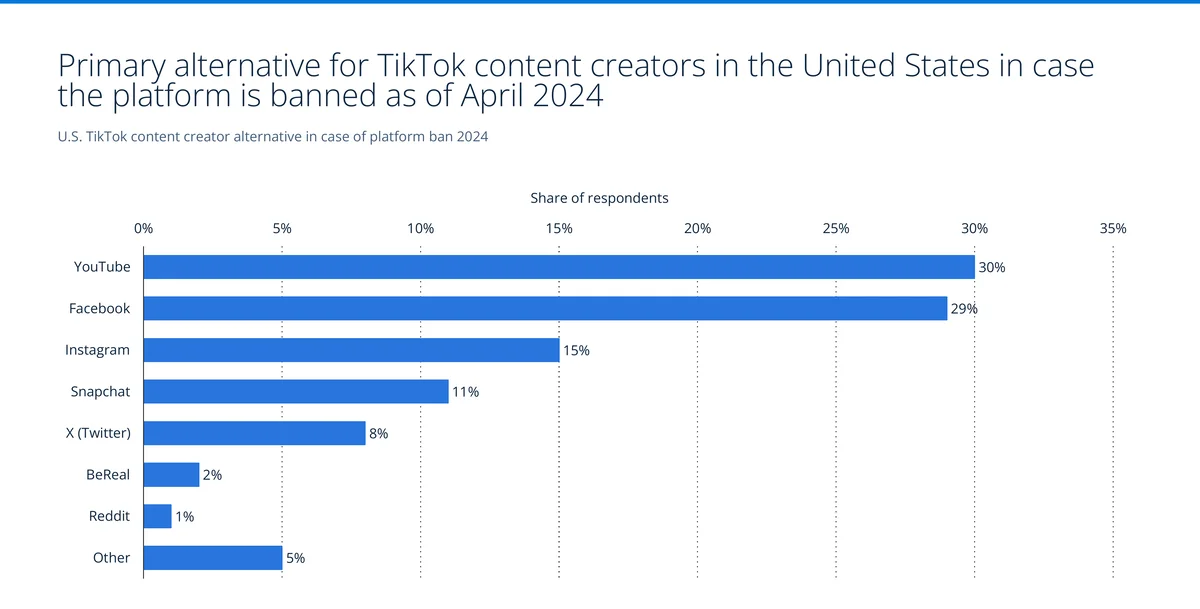
No TikTok statistics report is complete without the regulatory overhang. After the 2024 divest-or-ban law, the question for every U.S. creator and marketer became: what's the backup plan? The answer is fragmented — YouTube (30%) and Facebook (29%) are the top fallbacks for U.S. creators, with no clear winner.
Among influencers specifically, the picture tilts toward Meta: 33% named Facebook Reels as the next major short-form platform if TikTok is sold or banned, with Instagram Reels a near-tie at 32% and YouTube Shorts a distant 14%. Public opinion, meanwhile, is not a slam dunk. Ban support splits sharply by party — 48% of Republicans strongly support a ban versus 39% of Democrats and 30% of Independents.
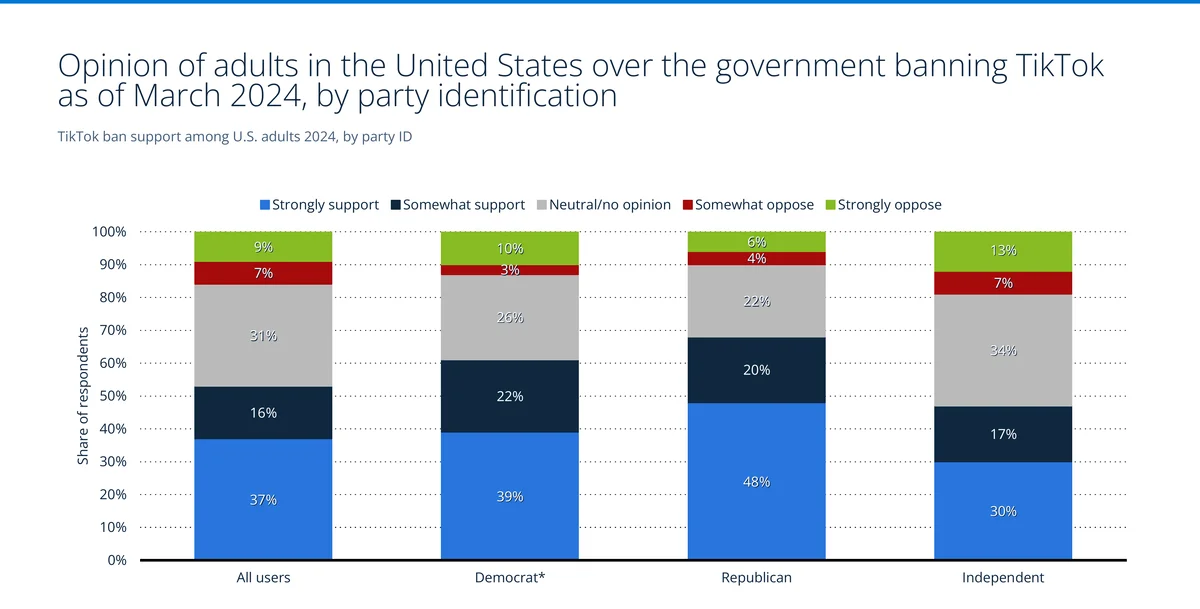
And support is softening over time, not hardening. Strong support for new banning legislation fell from 37% in 2023 to 33% in 2024, while the neutral/no-opinion share rose from 31% to 35%. The political will to ban TikTok looks less certain in the data than the headlines imply — which is part of why the platform is still operating and still worth planning around.
Methodology and data sources
Every figure here is credited to the original provider that produced it, and the sources vary by metric: Business of Apps and TikTok (revenue), Brand Finance (brand value), AppMagic and AppTweak (downloads and IAP revenue), DataReportal, We Are Social, Meltwater, and Manochi (users, reach, demographics), Socialinsider and Metricool (engagement, video, creator benchmarks), Activate (the MAU forecast) alongside the Statista Market Insights user-base model, Social Media Examiner (marketer surveys), and eMarketer, Forbes, Social Blade, Influential, Samba TV, CivicScience, First Insight, and Linqia (advertising, creators, and the U.S. ban).
Two honesty notes worth carrying into any deck. First, several of these are ad-audience and modeled figures rather than official platform disclosures (TikTok reports far less than Meta does), so date-stamp everything and name the measurement type. Second, TikTok is app-first. At TechnologyChecker we detect the technologies running on close to 30 million live websites, and TikTok's browser footprint is a small fraction of its app usage: in our March 2026 crawl (detections dated through 2026-03-28) we find a TikTok embed on 211,605 live domains and the TikTok Conversion Pixel on 240,694, versus a modeled user base above a billion. The firmographic breakdowns in the detection section above join those detected domains to LinkedIn company data (61,041 matched for the embed), so size, industry, and country shares describe only the LinkedIn-matched subset, not every detected site. That app-first gap is the same effect quantified in the Cloudflare Radar section, where tiktok.com ranks just #86 among websites even as TikTok ranks #10 as an internet service — a pattern we also documented in our Instagram user statistics analysis. The web-traffic figures here come from Cloudflare Radar's live rankings, pulled July 22, 2026; because they shift daily, treat any rank as a dated snapshot. If your question is "how many people use TikTok," count MAU. If it's "how many sites integrate TikTok," that's a different, much smaller number.
What the 2026 numbers actually mean
Put the charts together and TikTok in 2026 is a study in contrasts. It has the best per-post engagement of any major network (3.7%, roughly 7.7x Instagram), a $60 billion ad business, a $153 billion brand, and 7.5 billion downloads — yet only a third of marketers use it, its organic reach is falling across every account tier, and its largest single market operates under a live ban law with softening but real public support. ⚠️ Superseded: the US ban question was settled by the TikTok USDS Joint Venture on 23 January 2026 (see the Myth vs Reality note in the ban section). Preserved as originally published.
For a growth team, that combination is the opportunity. The audience scale and engagement are not in question; the competition for attention on TikTok is simply thinner than on Meta because so many brands are still on the sidelines. The risk is equally clear-eyed: build on TikTok, but keep a documented fallback, treat the U.S. footprint as contingent (less so since the January 2026 joint venture; the fallback advice still holds for any single-platform bet), and design for a 25-to-34 core rather than the teen stereotype. The platforms that win the next two years of short video will be the ones that read these numbers as a map, not a hype cycle.
For adjacent benchmarks, see our AI in marketing statistics and web traffic statistics reports, which cover the broader channels TikTok now competes with for every marketing dollar.
Frequently asked questions
How many people use TikTok in 2026?
TikTok does not publish one global monthly-user figure. Its own disclosures are regional: 189 million people in the EU every month (January to June 2026, Digital Services Act report) and more than 200 million Americans (January 2026). In December 2024 it called itself a "billion-strong global community". Third-party models put the total between about 1.37 billion users and a forecast 2 billion monthly actives.
How many people have downloaded TikTok?
TikTok has about 7.53 billion all-time downloads (AppMagic), more than any other ByteDance app. Quarterly installs peaked at 313.53 million in Q1 2020 and were around 159.2 million in Q1 2026. Indonesia leads all-time downloads with 727.52 million.
How many businesses use TikTok on their website?
TechnologyChecker detects the TikTok Pixel, TikTok's conversion-tracking tag, on 402,515 live business websites in the September 2026 crawl, up 3.0% from August. Retail apparel and fashion brands run it at 7.7 times their share of the web. A further 6,825 sites link to a TikTok account.
Who owns TikTok in the US now?
Since 23 January 2026, TikTok's US business has been run by the TikTok USDS Joint Venture. Oracle, Silver Lake and MGX hold 15% each, a group of other investors holds most of the rest, and ByteDance keeps 19.9%. The joint venture was set up to meet the US divest-or-ban law.
Update history
Added a Q3 2026 analysis, a 2026 month-by-month table of Cloudflare Radar rankings, an answer to "Is TikTok growing or declining?" built on TikTok's own US and EU user disclosures, a September 2026 TikTok Pixel count with an industry over-index table, and an FAQ. Corrected the U.S. ban framing: the TikTok USDS Joint Venture settled the divest-or-ban law on 23 January 2026. Late-September ranking moves are marked provisional.
First edition: third-party user, revenue, download, engagement and creator benchmarks; Cloudflare Radar internet-service and domain rankings pulled 22 July 2026; TechnologyChecker March 2026 detection crawl for TikTok embeds and the TikTok Pixel.

CMO & Co-founder
10+ years of experience
Elif is the CMO and co-founder of TechnologyChecker.
- MBA, London Business School
- Google Analytics Certified Professional
- HubSpot Inbound Marketing Certified
Never miss our research