Instagram User Statistics 2026: We Analyzed Demographics, Growth & Country Rankings
Instagram has ~3 billion users in 2026. We analyzed the demographics, country-by-country web rankings (Q1 vs Q2), and the 31,886 sites that use it.
Published •Updated •28 min read
Instagram has roughly 3 billion monthly active users as of 2026, making it one of four Meta platforms past the billion-user mark. Its audience skews young (63% are under 35) and global (India alone has 480 million users). This guide breaks down Instagram user statistics by count, country, age, gender, growth, and engagement.
I came at these numbers from two directions. There are the public ones, from Meta, DataReportal, NapoleonCat, and the other researchers who actually track Instagram. Then there's our own: at TechnologyChecker we crawl close to 30 million live websites to detect the technologies they run, Instagram included, and I cross-referenced the headline figures against live Cloudflare Radar traffic. The interesting part isn't any single number. It's that "how many people use Instagram" has at least three defensible answers depending on what you count, and most articles quietly pick one. I'll show you all three.
Key findings:
- ~3 billion monthly active users as of 2026. Instagram crossed the milestone in 2025. -- Meta / DataReportal
- #14 most-visited website in the world, and the #2 social network by web traffic, behind only Facebook. -- Cloudflare Radar (June 2026)
- A top-7 website in Brazil (#6), India (#7) and Indonesia (#6) by web traffic, but only about #17 in the United States, and it rose in 6 of 10 major markets in H1 2026. -- Cloudflare Radar (Q1-Q2 2026)
- Over the full year to Q2 2026, instagram.com held or gained web rank in all ten major markets we track and fell in none, with its clear multi-place gains concentrated in markets that started outside the top ten (France #17 to #10, the UK #15 to #10) rather than the emerging markets where it was already top-seven. -- Cloudflare Radar (Q2 2025 vs Q2 2026)
- 480.55 million users in India, the largest national audience, 2.6x the United States (181.75M). It's a fast-moving ad-reach figure (up from ~414M in January 2025), so date-stamp it. -- Statista / NapoleonCat (Oct 2025)
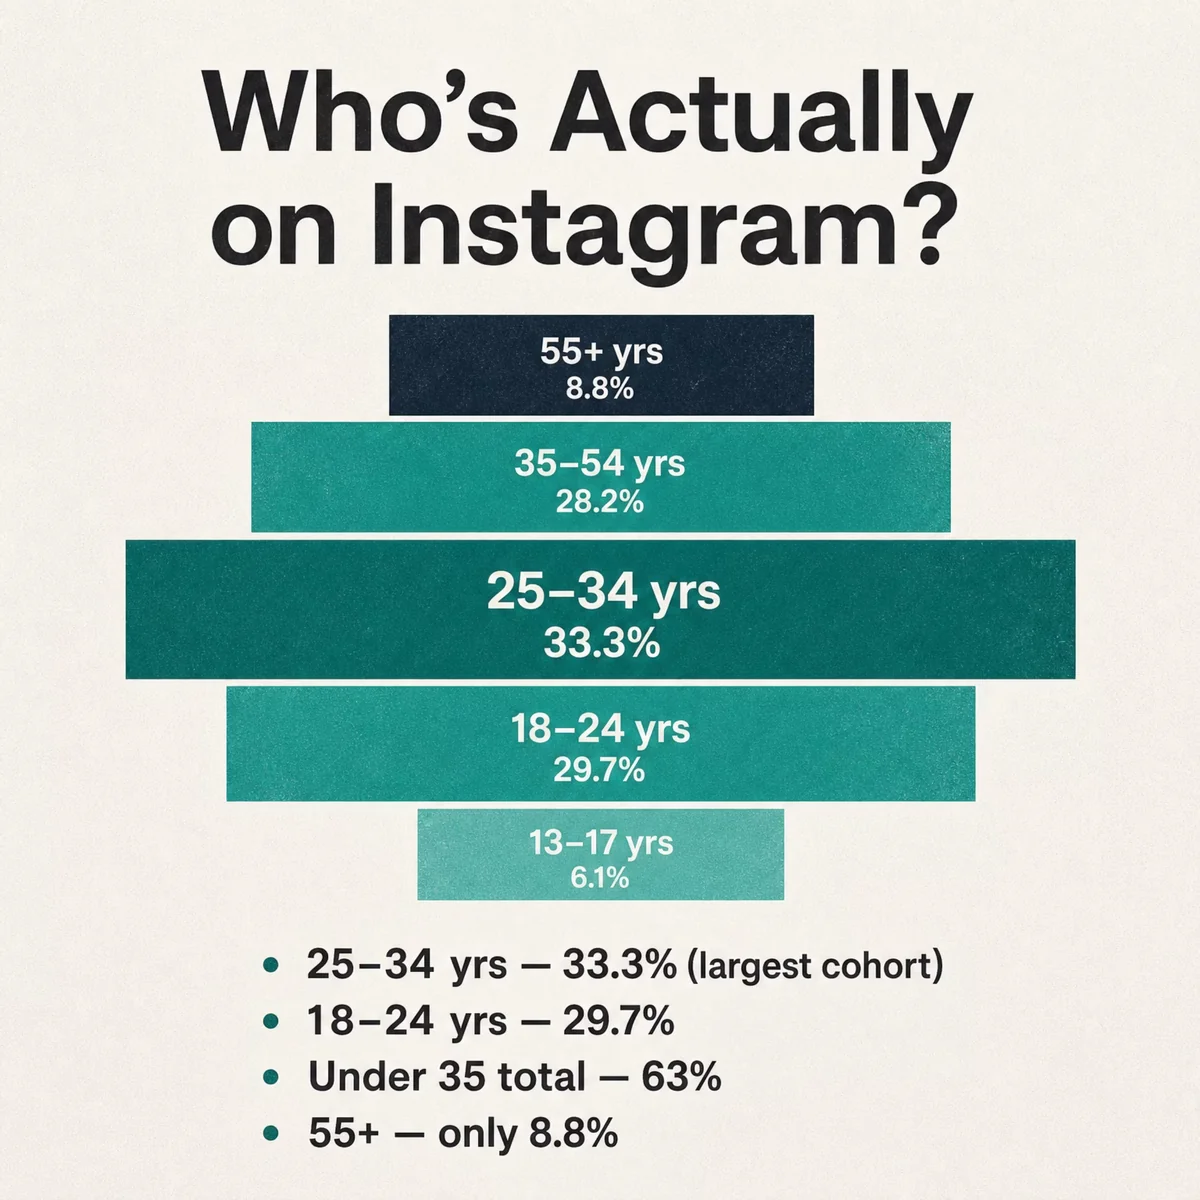
- 63% of users are under 35; the 25-34 group is the largest at 33.3%. -- DataReportal / Meltwater
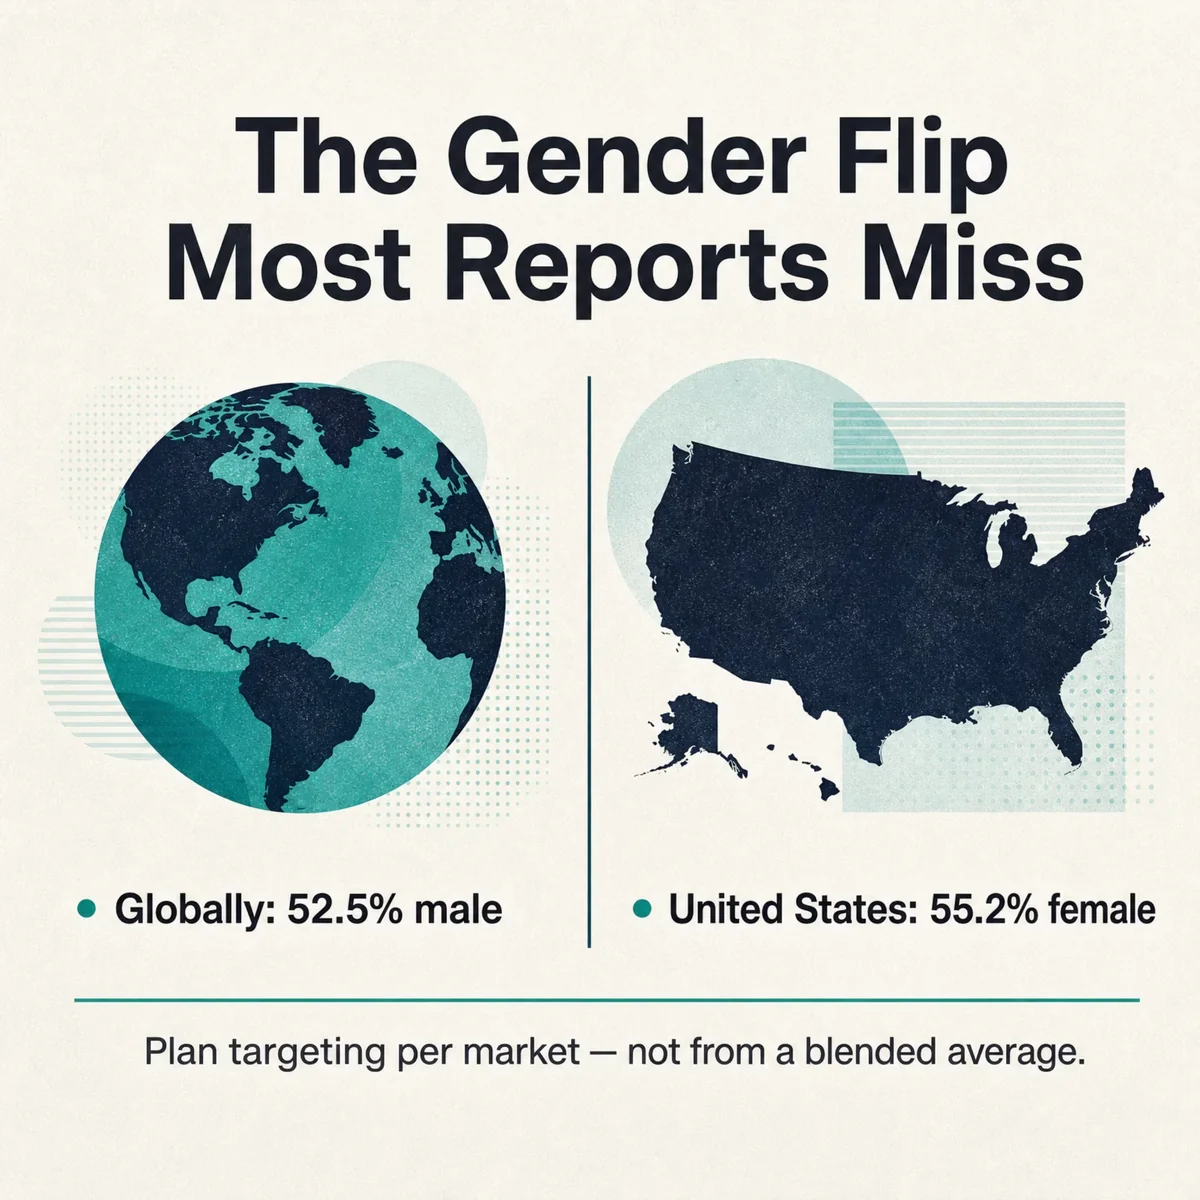
- Instagram skews male globally (52.5%) but female in the U.S. (55.2%), a reversal most reports miss. -- DataReportal / NapoleonCat
- Turkey has the highest reach: 90.4% of its population is on Instagram. -- DataReportal
- 82% of marketers use Instagram, second only to Facebook (86%) and ahead of LinkedIn (72%). -- Social Media Examiner
- It took Instagram 11.2 years to reach 2 billion monthly active users. -- Meta Platforms
- 31,886 websites use Instagram on their own pages, per our own detection, and 85% of them are companies with under 50 employees. -- TechnologyChecker
- Instagram's 2025 ad revenue is estimated at $71-83.6 billion, but Meta never discloses it, so analysts disagree by more than $12 billion. -- Business of Apps / industry estimates
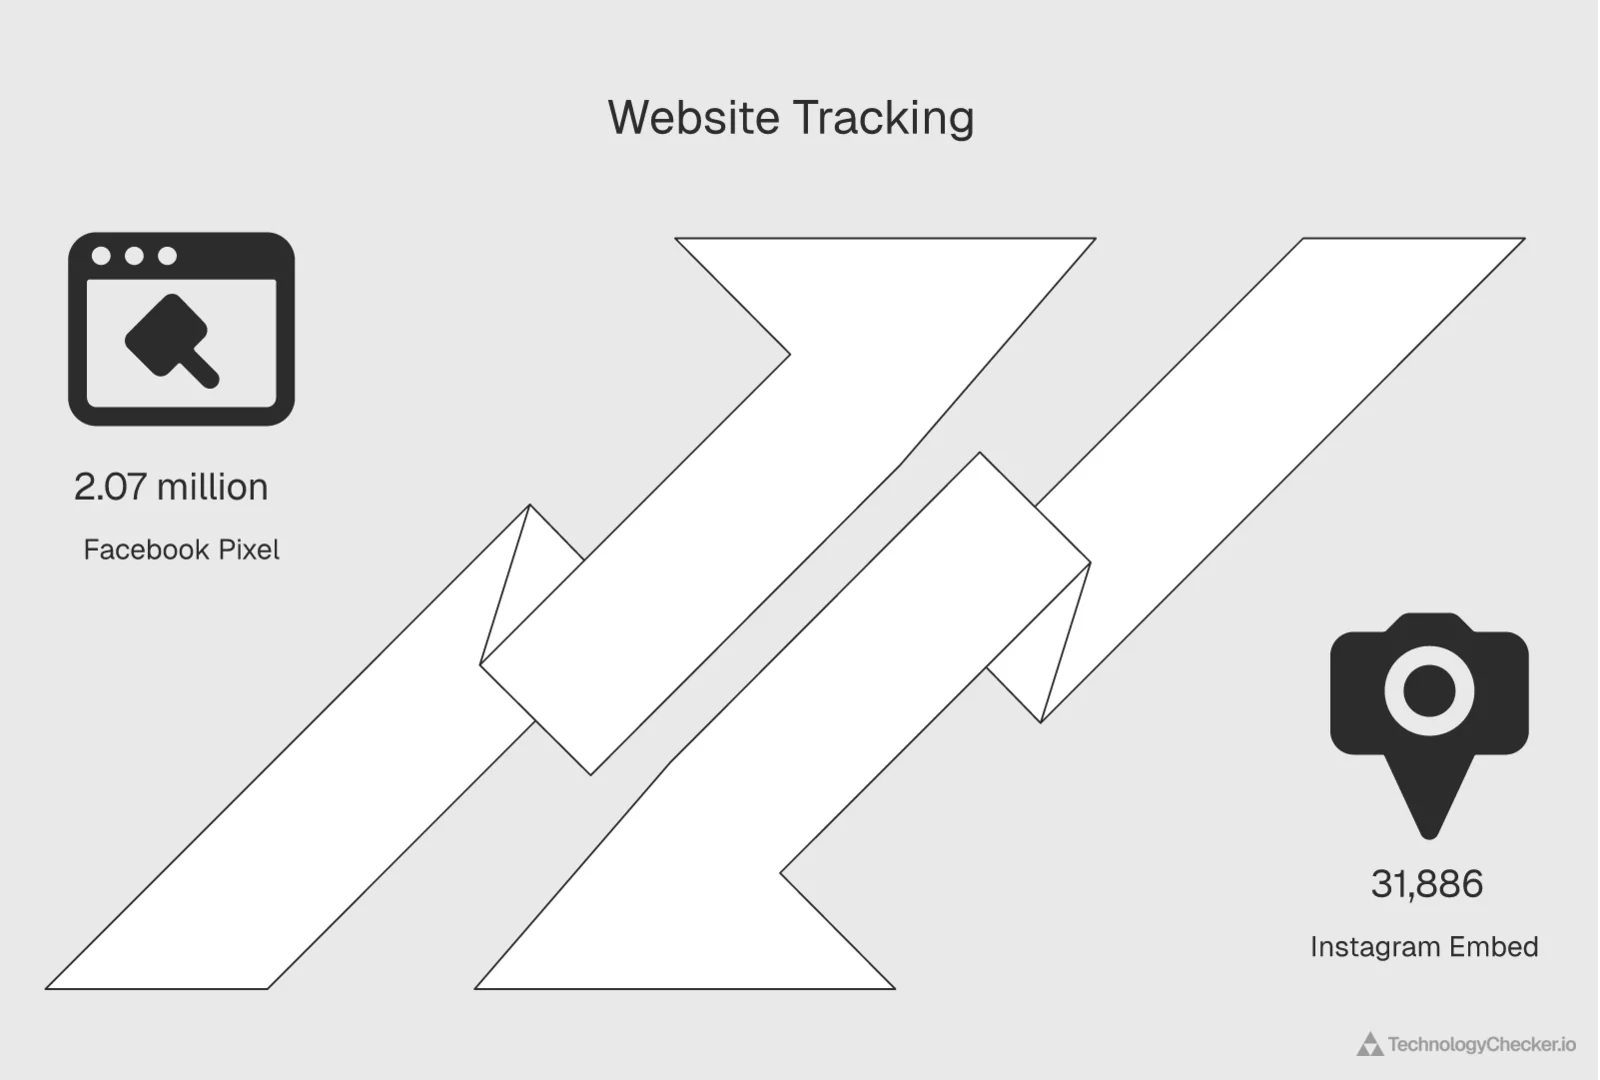
- The Facebook Pixel runs on 2.07 million sites we crawl, roughly 65x as many as use Instagram. Companies wire in Meta's tracking far more than they link their social profiles. -- TechnologyChecker
In my decade running B2B growth campaigns, Instagram is the platform clients most often misjudge. They assume it's plateauing in the U.S. (it isn't), assume its users are mostly women (globally, they're not), and assume the "2 billion users" stat they read in 2021 still holds (it's now closer to 3 billion). Let's fix all three with current data. And that detection crawl drives a B2B layer most stats roundups can't touch: which companies actually use Instagram on their sites, broken down by size, industry, and country, plus how Instagram's website footprint stacks up against every other major social platform we detect.
How many monthly active users does Instagram have in 2026?
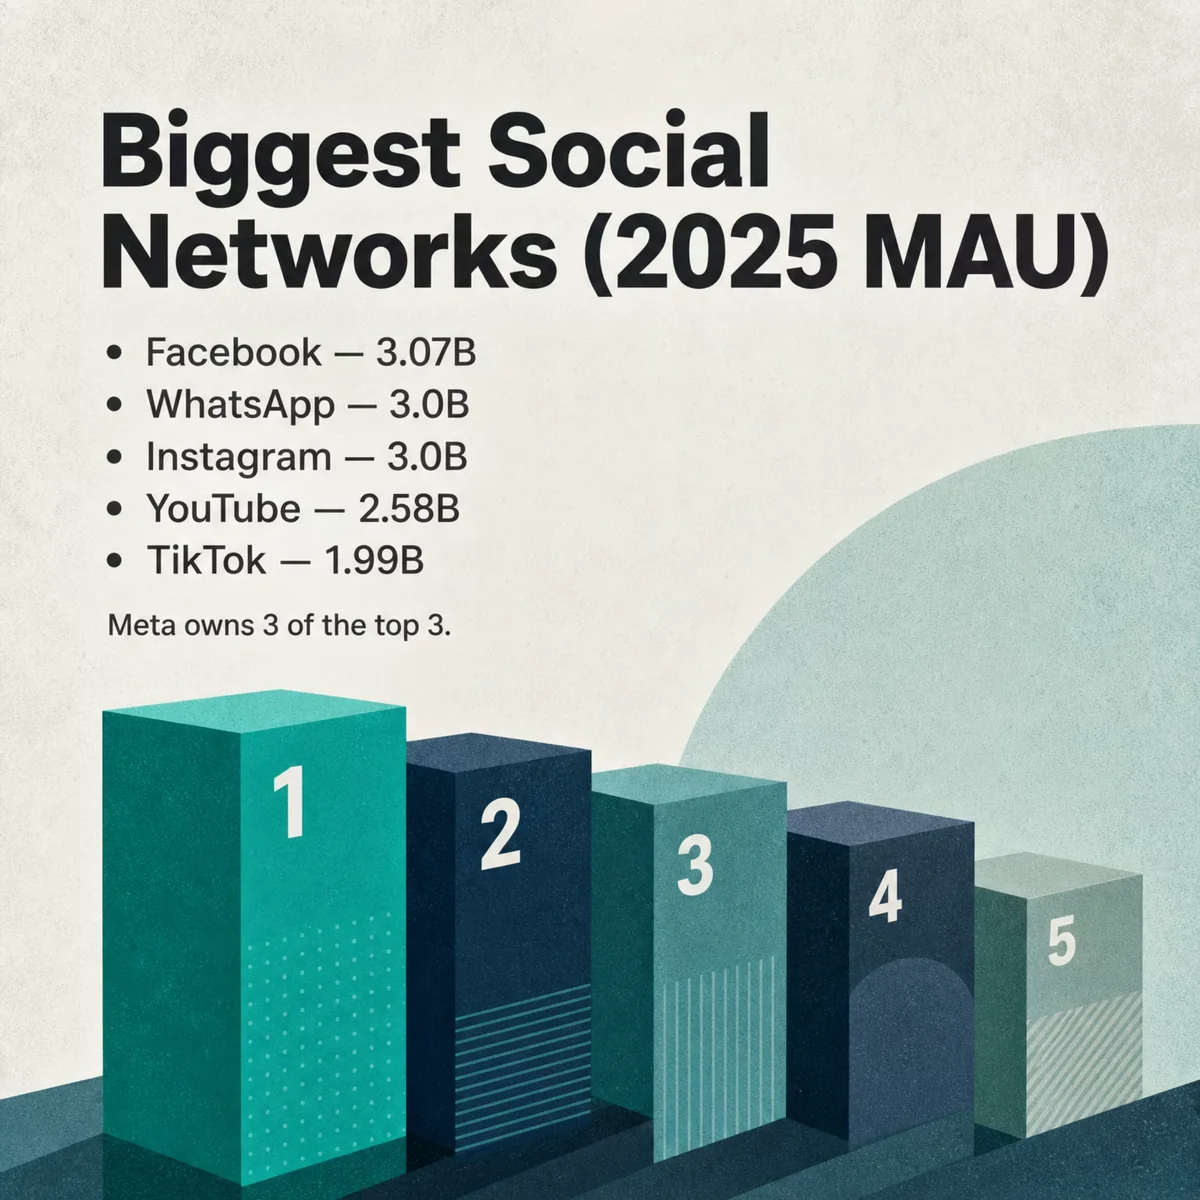
Instagram has approximately 3 billion monthly active users (MAU) worldwide as of 2026. Meta confirmed the milestone in 2025, and DataReportal's October 2025 platform rankings place Instagram level with WhatsApp at 3.0 billion, just behind Facebook's 3.07 billion. That puts three of the four most-used platforms on the planet under Meta's roof.
Most Used Social Networks 2025: Facebook Leads With 3.07B Users
Market leader Facebook was the first social network to surpass one billion registered accounts and currently sits at more than three billion monthly active users. Meta Platforms owns four of the biggest social media platforms - Facebook, WhatsApp, Messenger, and Instagram - all with more than one billion monthly active users each.
Source: DataReportal; Meltwater; We Are Social · 2025
| Platform | Monthly active users (billions) |
|---|---|
| 3.07B | |
| 3B | |
| 3B | |
| YouTube | 2.58B |
| TikTok | 1.99B |
| 1.41B | |
| Telegram | 1B |
| Messenger | 0.94B |
| Snapchat | 0.93B |
| 0.77B | |
| Douyin | 0.73B |
| Kuaishou | 0.72B |
| 0.59B | |
| 0.58B | |
| X | 0.56B |
- Facebook leads with 3.07 billion monthly active users
- Meta owns four of the largest platforms, each above 1 billion MAU
- TikTok reaches 1.99 billion users even before counting Douyin
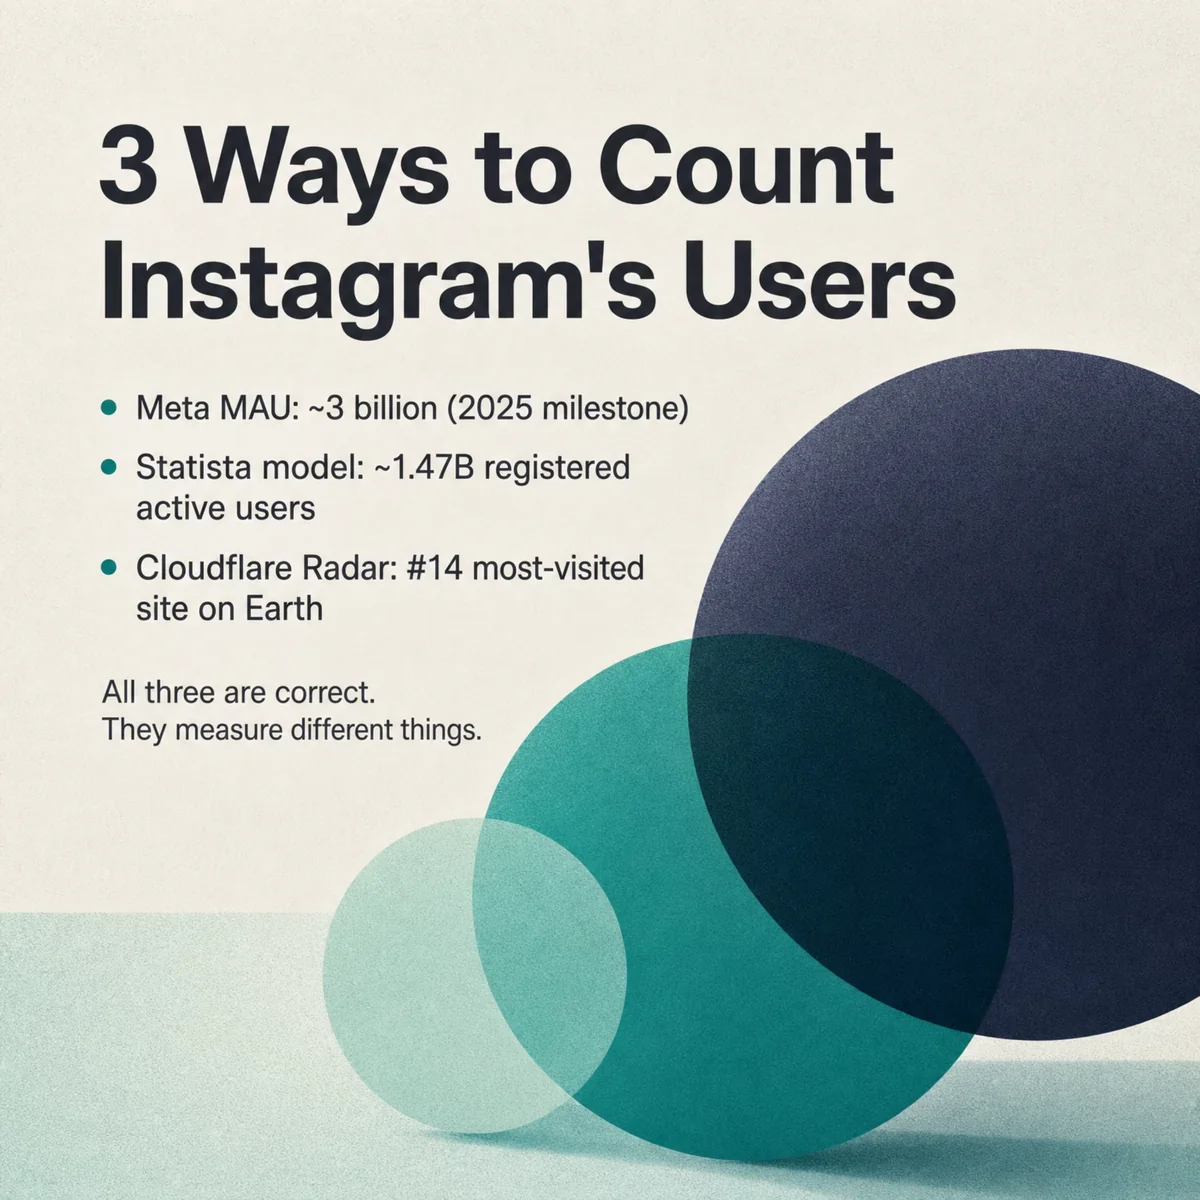
Here's the nuance that matters. The "3 billion" figure is the monthly active user count Meta and DataReportal report. But Statista's separate user-base model (which estimates registered active users with a more conservative method) puts Instagram at about 1.47 billion for 2025, projected to peak near 1.8 billion in 2028. Both are "correct"; they measure different things. When you see Instagram user counts range from 1.8 billion to 3 billion across articles, this methodology gap is why.

How does Instagram rank among all websites? Cloudflare Radar's view
There's a third way to size Instagram that no survey captures: actual internet traffic. As of June 15, 2026, Cloudflare Radar ranks instagram.com as the #14 most-visited domain in the world, and the #2 social network by web traffic, behind only Facebook (#8). I pulled this live from Cloudflare's global domain ranking, which is based on real DNS-resolution traffic rather than self-reported user numbers.
| Platform | Cloudflare Radar global rank | Category |
|---|---|---|
| facebook.com | #8 | Social Networks |
| youtube.com | #12 | Video Streaming |
| instagram.com | #14 | Social Networks |
| snapchat.com | #55 | Photography |
| whatsapp.com | #64 | Instant Messengers |
| linkedin.com | #73 | Professional Networking |
| tiktok.com | #92 | Social Networks |
The TikTok line is the tell. TikTok rivals Instagram on monthly active users, yet sits at #92 by web traffic because it's almost entirely app-first. People rarely visit tiktok.com in a browser. Instagram is also app-first, so its #14 web ranking signals genuinely massive pull across both app and browser. Web-traffic rank and MAU measure different behaviors, and the gap between them is where the real story lives.
Where Instagram ranks highest: a country-by-country view (Q1 vs Q2 2026)
That #14 is a global average, and averages hide the interesting parts. So I pulled instagram.com's rank inside individual countries from Cloudflare Radar, taking the median across three sample weeks in Q1 (January to March) and three in Q2 (April to June) so one noisy day couldn't skew the read. Two things jumped out.
| Market | Q1 2026 rank | Q2 2026 rank | Direction |
|---|---|---|---|
| Brazil | #6 | #6 | Steady |
| India | #7 | #7 | Steady |
| Indonesia | #7 | #6 | Up 1 |
| Turkey | #8 | #7 | Up 1 |
| Mexico | #9 | #8 | Up 1 |
| Germany | #10 | #8 | Up 2 |
| United Kingdom | #10 | #10 | Steady |
| France | #12 | #9 | Up 3 |
| Japan | #14 | #14 | Steady |
| United States | #21 | #17 | Up 4 |
First, Instagram ranks far higher inside emerging markets than its global spot suggests. In Brazil it's the 6th most-visited site on the whole internet. In India and Indonesia it sits 6th or 7th, ahead of most local news, banking, and shopping sites. Second, the United States is the laggard, not the leader. At about #17 it lands well below where it does in Jakarta or São Paulo, because the American web is more crowded at the top: Amazon, a deep bench of news sites, and the streaming giants all outrank it at home.

In the markets where Instagram is a top-seven website, it functions less like an app people open and more like a layer of the open internet itself.
The trend ran one way over the half-year. Instagram climbed in six of these ten markets between Q1 and Q2 2026 and slipped in none. The US gained four places, France three, Germany two. Globally, instagram.com stayed in a tight #12 to #14 band across the same stretch and finished Q2 around #13.
Source: Cloudflare Radar global domain rankings (radar.cloudflare.com), median of three weekly snapshots per quarter, Q1 and Q2 2026. Ranks reflect DNS-resolution web traffic, not in-app activity.
One year on: which markets Instagram climbed in (Q2 2025 vs Q2 2026)
The table above is a half-year view. Widen it to a full year and the pattern sharpens. I pulled the same per-country ranks for Q2 2025, using the identical median-of-weekly-snapshots method, and set them beside Q2 2026.
| Market | Q2 2025 rank | Q2 2026 rank | Year-over-year |
|---|---|---|---|
| Brazil | #8 | #6 | Up 2 |
| India | #9 | #8 | Up 1 |
| Indonesia | #9 | #7 | Up 2 |
| Turkey | #7 | #7 | Steady |
| Mexico | #12 | #8 | Up 4 |
| Germany | #11 | #8 | Up 3 |
| United Kingdom | #15 | #10 | Up 5 |
| France | #17 | #10 | Up 7 |
| Japan | #12 to #35 (volatile) | #14 | Stabilized |
| United States | #16 | #16 | Steady |
Over the full year, instagram.com held or climbed in all ten of these markets and fell in none. But the clear gains, the moves of three or more places, came from one specific group: markets that started outside the top ten. France rose seven places, the United Kingdom five, Mexico four, Germany three. A year ago each sat at or below the edge of the top ten; each has now crossed into it.
The markets where Instagram was already a top-ten site tell the opposite story. Brazil, India, Indonesia, and Turkey were all top-ten a year ago, so there was almost nowhere left to climb, and they barely moved. Instagram's dominance in São Paulo and Jakarta is not a fresh 2026 gain; it is a year-old steady state. What actually changed over the past year is the group one rung down closing the distance.
Two markets sit outside that story. The United States held roughly steady at about #16 across the full year: the four-place climb it posted between Q1 and Q2 2026 (in the table above) mostly recovered ground it had lost earlier in the year rather than gaining new, and it remains the one major market where Instagram stays outside the top fifteen. Japan is the noisiest read of all: its rank swung between the low teens and the mid-thirties through 2025 before settling at a stable #14 in 2026, so treat its improvement as a move out of volatility, not a precise climb.
Source: Cloudflare Radar global domain rankings (radar.cloudflare.com), median of six weekly snapshots per quarter, Q2 2025 versus Q2 2026. Ranks reflect DNS-resolution web traffic, not in-app activity, and individual weeks vary by several places, so small year-over-year moves fall within that noise. Pulled 2026-07-03.
Instagram user growth: 2019 to 2028
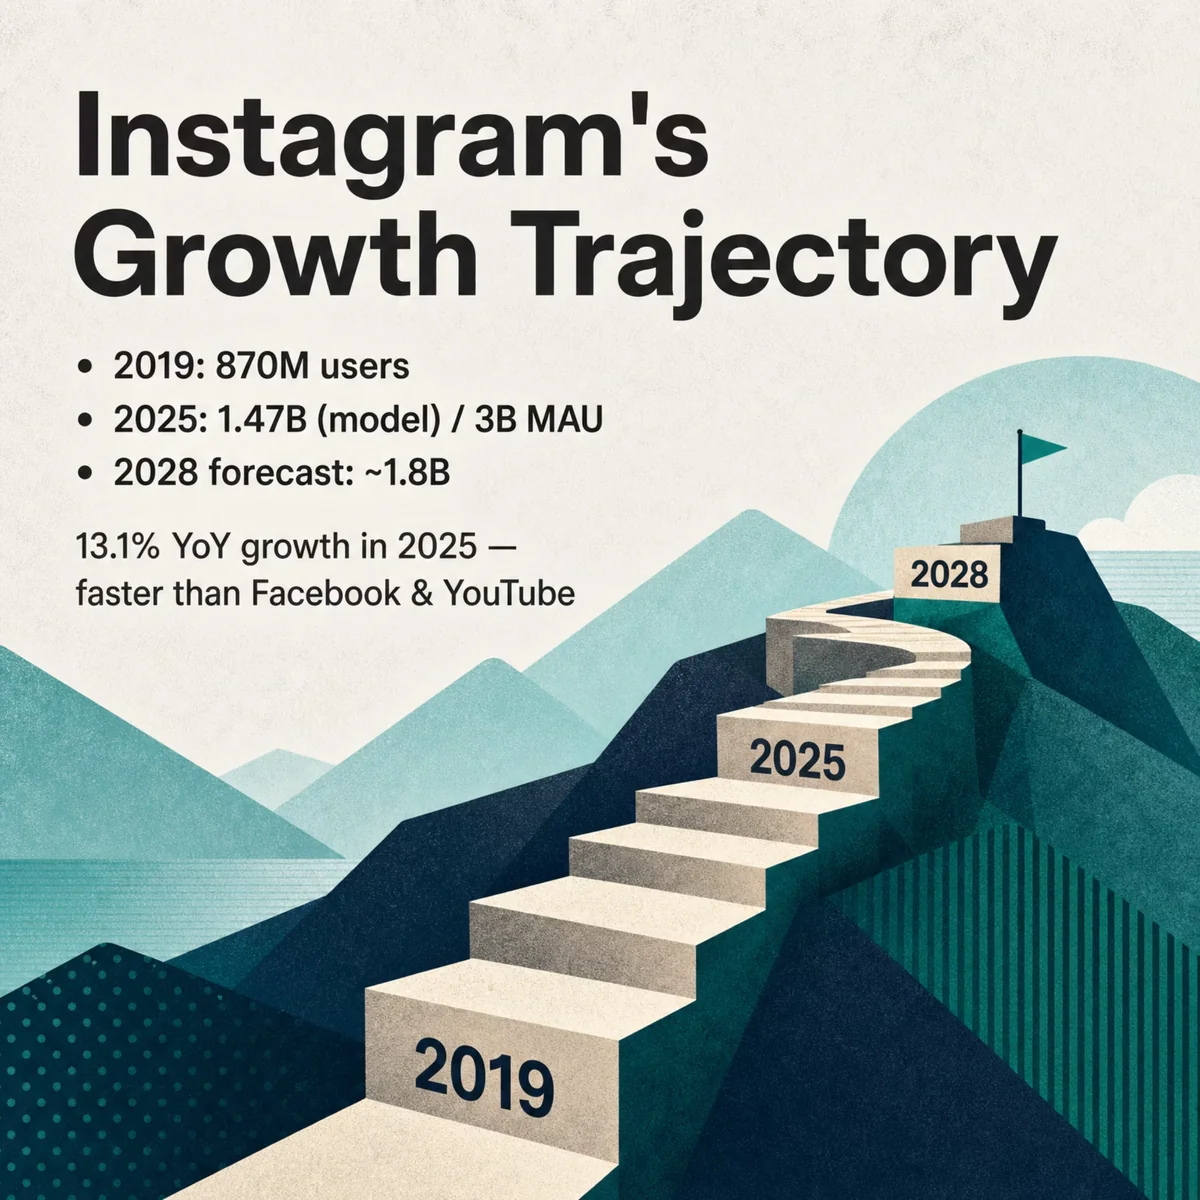
Instagram's user base has grown for nine consecutive years. By the conservative user-base model (the one charted below), it rose from about 870 million users in 2019 to roughly 1.47 billion in 2025, and is forecast to reach a peak of around 1.8 billion by 2028, a 25.68% increase between 2024 and 2028 alone.
Instagram Users Worldwide 2019-2028: Climbing Toward 1.8 Billion
Statista's user model estimates the global Instagram user base grew from roughly 870 million in 2019 to about 1.47 billion in 2025, and projects continued growth to a peak of around 1.8 billion users by 2028 after nine consecutive years of annual increases. This user-model figure is deliberately more conservative than the 3 billion monthly-active-user milestone Meta reported in 2025 — the two metrics count different things.
Source: Statista · 2019-2028
| Year | Instagram users (millions) |
|---|---|
| 2019 | 870M |
| 2020 | 1070M |
| 2021 | 1220M |
| 2022 | 1240M |
| 2023 | 1330M |
| 2024 | 1410M |
| 2025 | 1470M |
| 2026 | 1520M |
| 2027 | 1560M |
| 2028 (forecast) | 1760M |
- Statista's user model: ~870M (2019) rising to a projected ~1.8B peak (2028)
- Nine straight years of growth — a 25.68% increase from 2024 to 2028
- More conservative than Meta's 3 billion MAU milestone because the two measure different things
Growth has slowed from the explosive early years but never stalled. The flattening curve after 2022 reflects market saturation in mature regions (North America, Western Europe) offset by continued expansion in Asia, Latin America, and Africa. For comparison, Instagram posted 13.1% year-over-year audience growth in 2025, behind only TikTok (17.6%) and LinkedIn (14.9%) among major platforms. Not bad for a 15-year-old app.
Instagram users by country
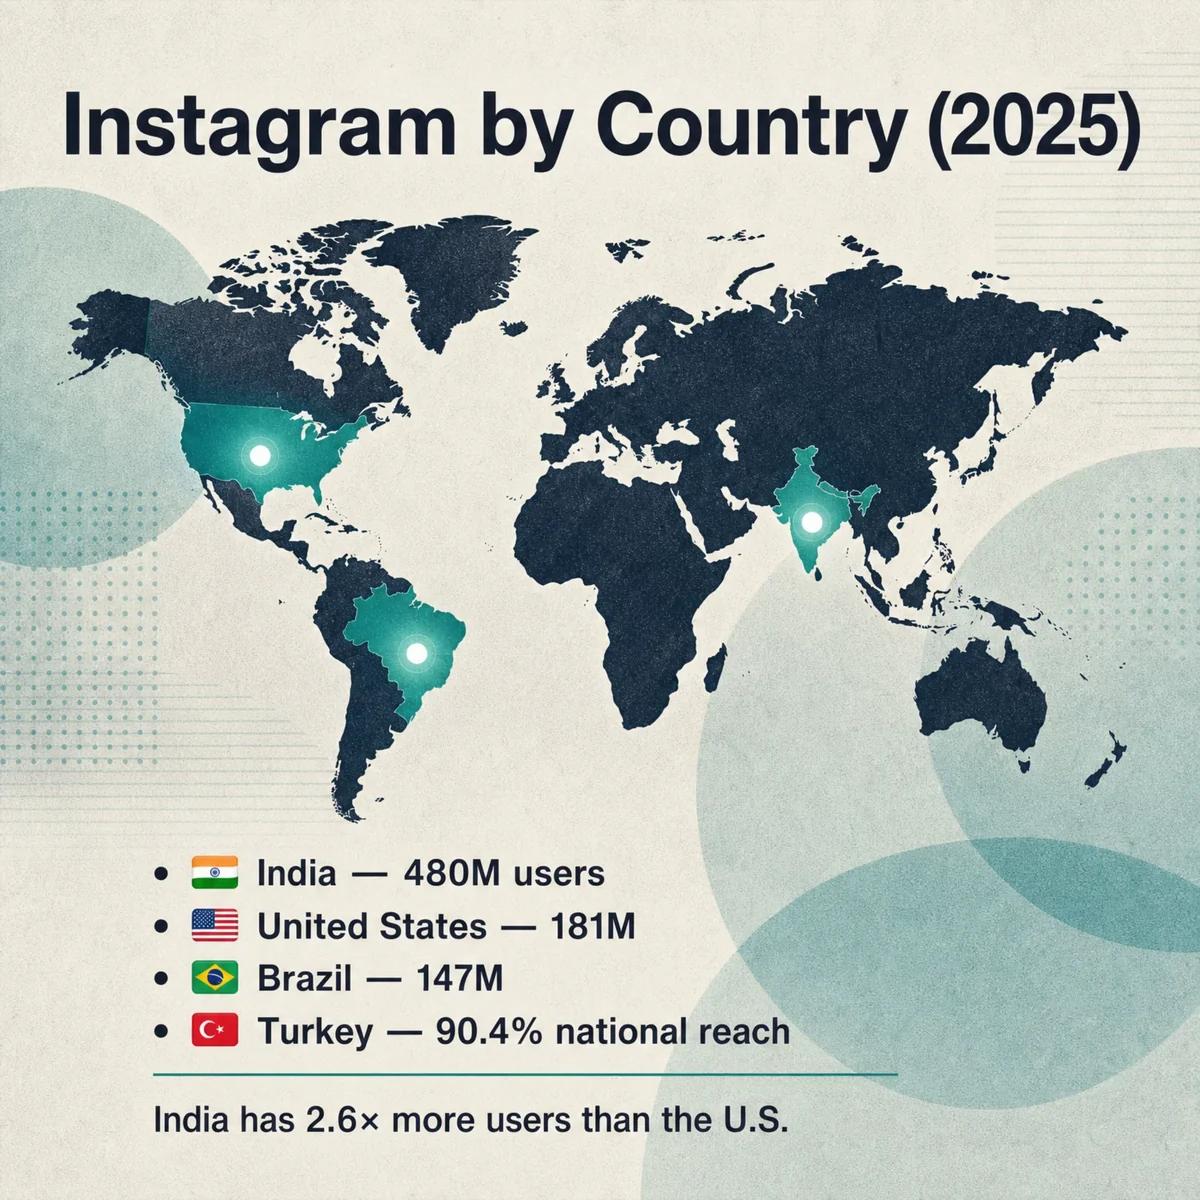
India has the largest Instagram audience in the world, with 480.55 million users as of October 2025, more than double the United States in second place (181.75 million). Brazil ranks third with 147 million, followed by Indonesia (107.6M) and Japan (63.2M). The top three countries together account for more than 800 million users.
One caveat on that India figure, because it swings hard between articles. The 480.55 million is Instagram's addressable ad audience — the reach Meta's own advertising tools report — captured in October 2025, and NapoleonCat puts it at almost exactly the same level (484.23 million) for that month. But it's a fast-moving number: the same metric read about 414 million in January 2025 (DataReportal) and roughly 508 million by December. So a lower India figure you see elsewhere is usually an earlier snapshot of this one series, not a rival source — the spread here is mostly when it was counted, not how. Unlike the 3-billion-versus-1.47-billion gap above, which is a real methodology fork, India's number is well-corroborated across trackers once you line up the dates.
Instagram Users by Country 2025: India Leads With 480 Million
India has the largest Instagram audience in the world with 480.55 million users as of October 2025 — more than double the United States in second place at 181.75 million. Brazil ranks third with 147 million, followed by Indonesia at 107.6 million and Japan at 63.2 million.
Source: DataReportal; Meltwater; Meta Platforms; We Are Social · October 2025
| Country | Instagram users (millions) |
|---|---|
| India | 480.55M |
| United States | 181.75M |
| Brazil | 147M |
| Indonesia | 107.6M |
| Japan | 63.2M |
| Turkey | 62.25M |
| Mexico | 53.55M |
| United Kingdom | 35.45M |
| Germany | 31.25M |
| Argentina | 31.05M |
- India alone has 480M Instagram users — 2.6x the United States
- The top three countries (India, US, Brazil) hold over 800M users combined
- Turkey has the highest reach: 90.4% of its population is on Instagram
Raw audience size and penetration tell different stories, though. The countries where Instagram reaches the highest share of the population aren't the big-population giants. They're smaller, highly-connected markets:
| Country | Audience reach (% of population) |
|---|---|
| Turkey | 90.4% |
| Kazakhstan | 89.7% |
| Brazil | 87.4% |
| Uruguay | 87.1% |
| UAE | 87.1% |
| Bahrain | 85.5% |
| Argentina | 85.4% |
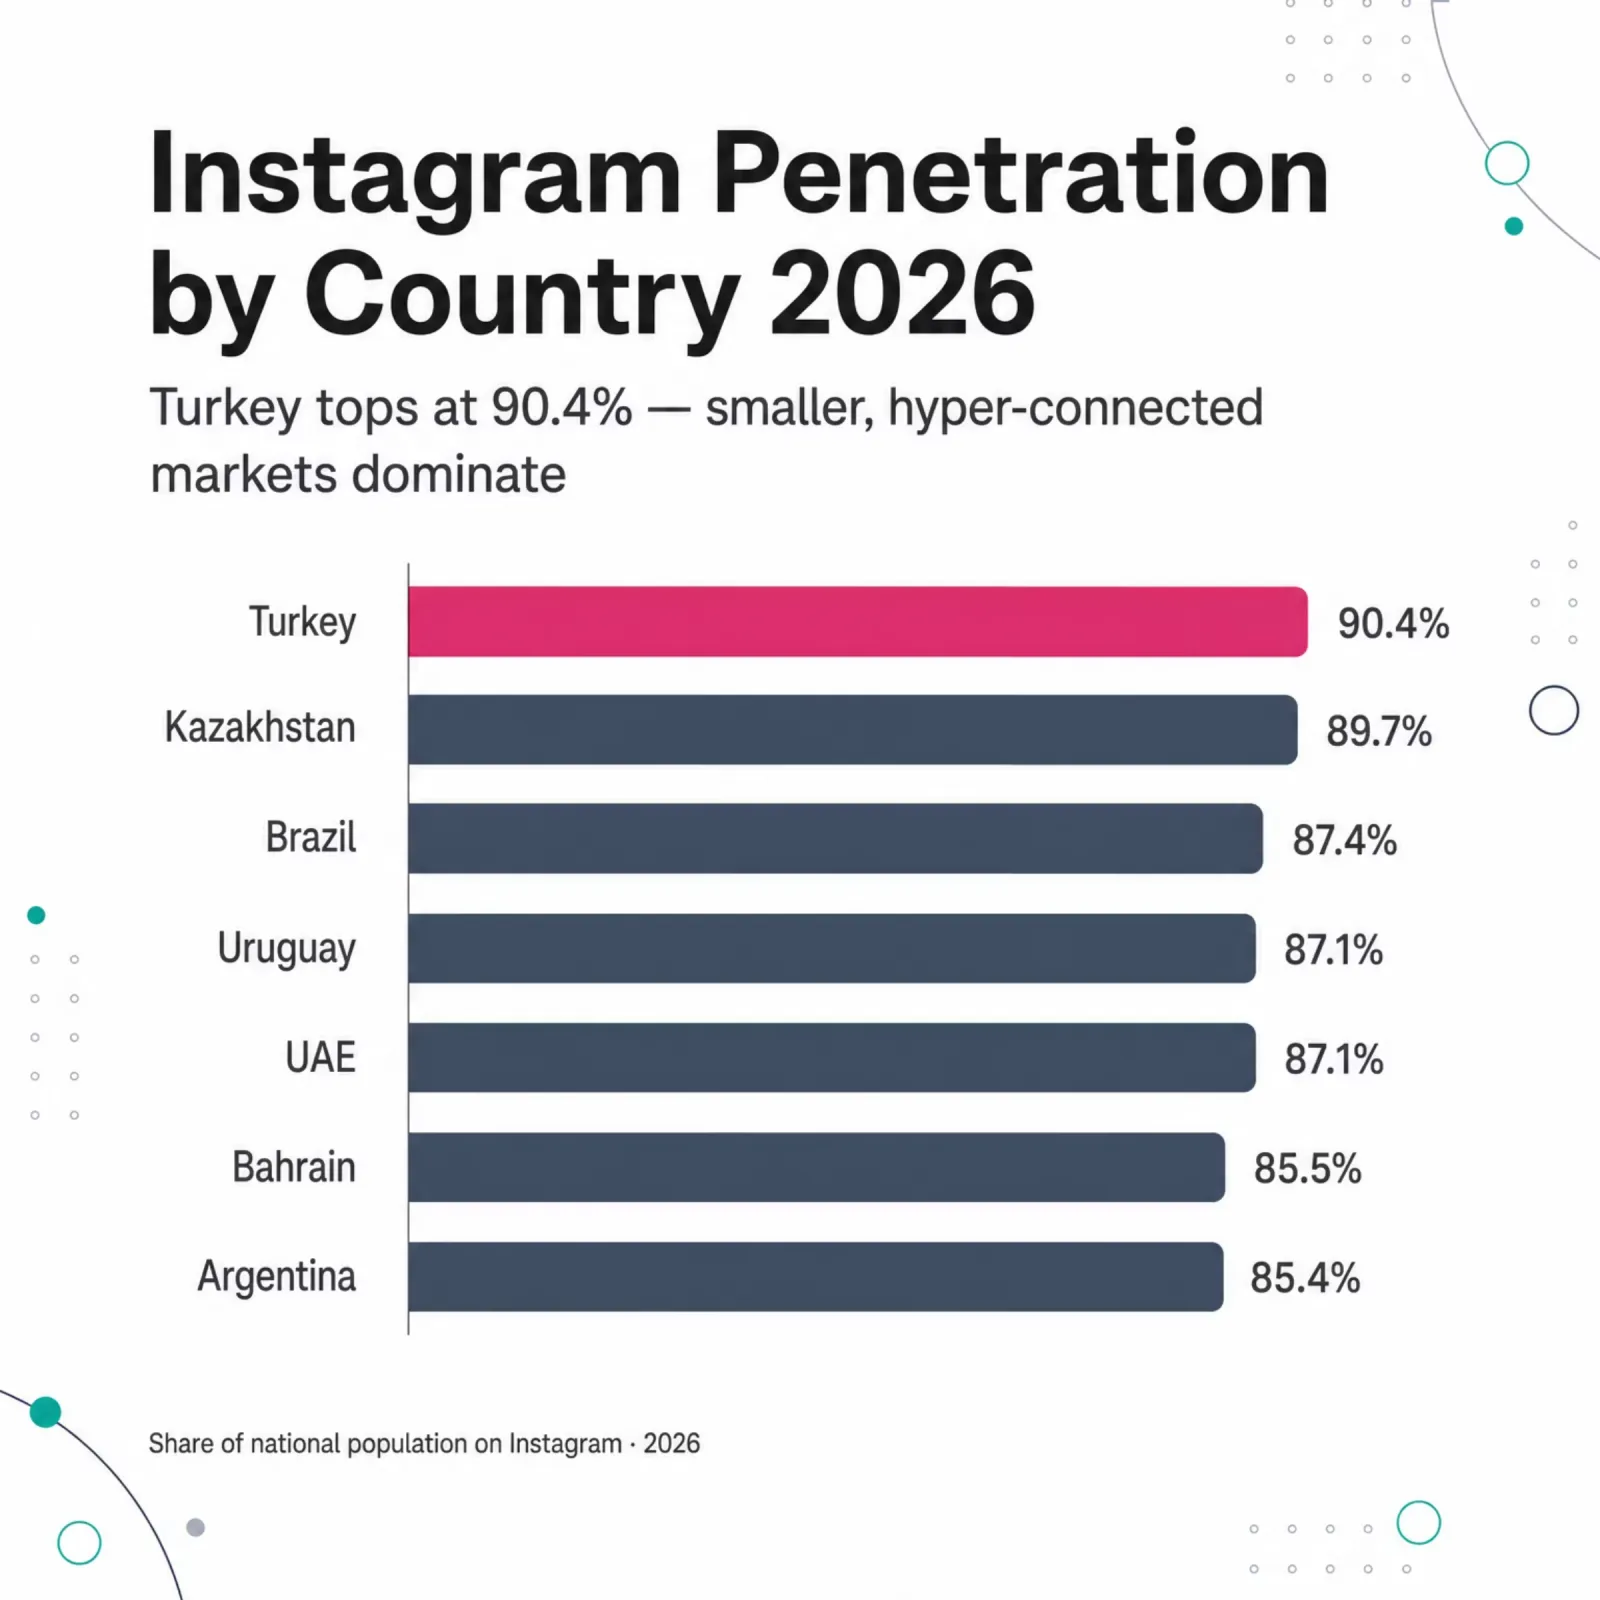
Turkey is the standout: 90.4% of the population uses Instagram, the highest reach of any country, even though it ranks sixth in absolute users. If you're benchmarking a market, audience size answers "how many people can I reach," while reach answers "how saturated is this channel already."
Instagram demographics: age and gender
Instagram's audience is young. As of July 2025, the 25-34 age group is the largest cohort at 33.3% of global users, followed closely by 18-24 year-olds at 29.7%. Together, under-35s make up roughly 63% of all Instagram users, while only 8.8% are 55 or older.
Instagram Age Demographics 2025: 63% of Users Are Under 35
As of July 2025, the largest Instagram age group worldwide is 25-34 year-olds at 33.3 percent, followed by 18-24 year-olds at 29.7 percent. Together, under-35s make up roughly 63 percent of the global Instagram audience, confirming the platform's continued skew toward younger users. Only 8.8 percent of users are aged 55 or older.
Source: DataReportal; Meltwater; We Are Social · July 2025
| Age group | Share of Instagram users (%) |
|---|---|
| 18-24 | 29.7% |
| 25-34 | 33.3% |
| 35-44 | 17.4% |
| 45-54 | 9.7% |
| 55-64 | 5.3% |
| 65+ | 3.5% |
- 25-34 is the largest cohort at 33.3% of all global users
- Under-35s account for roughly 63% of the global audience
- Only 8.8% of Instagram users are 55 or older
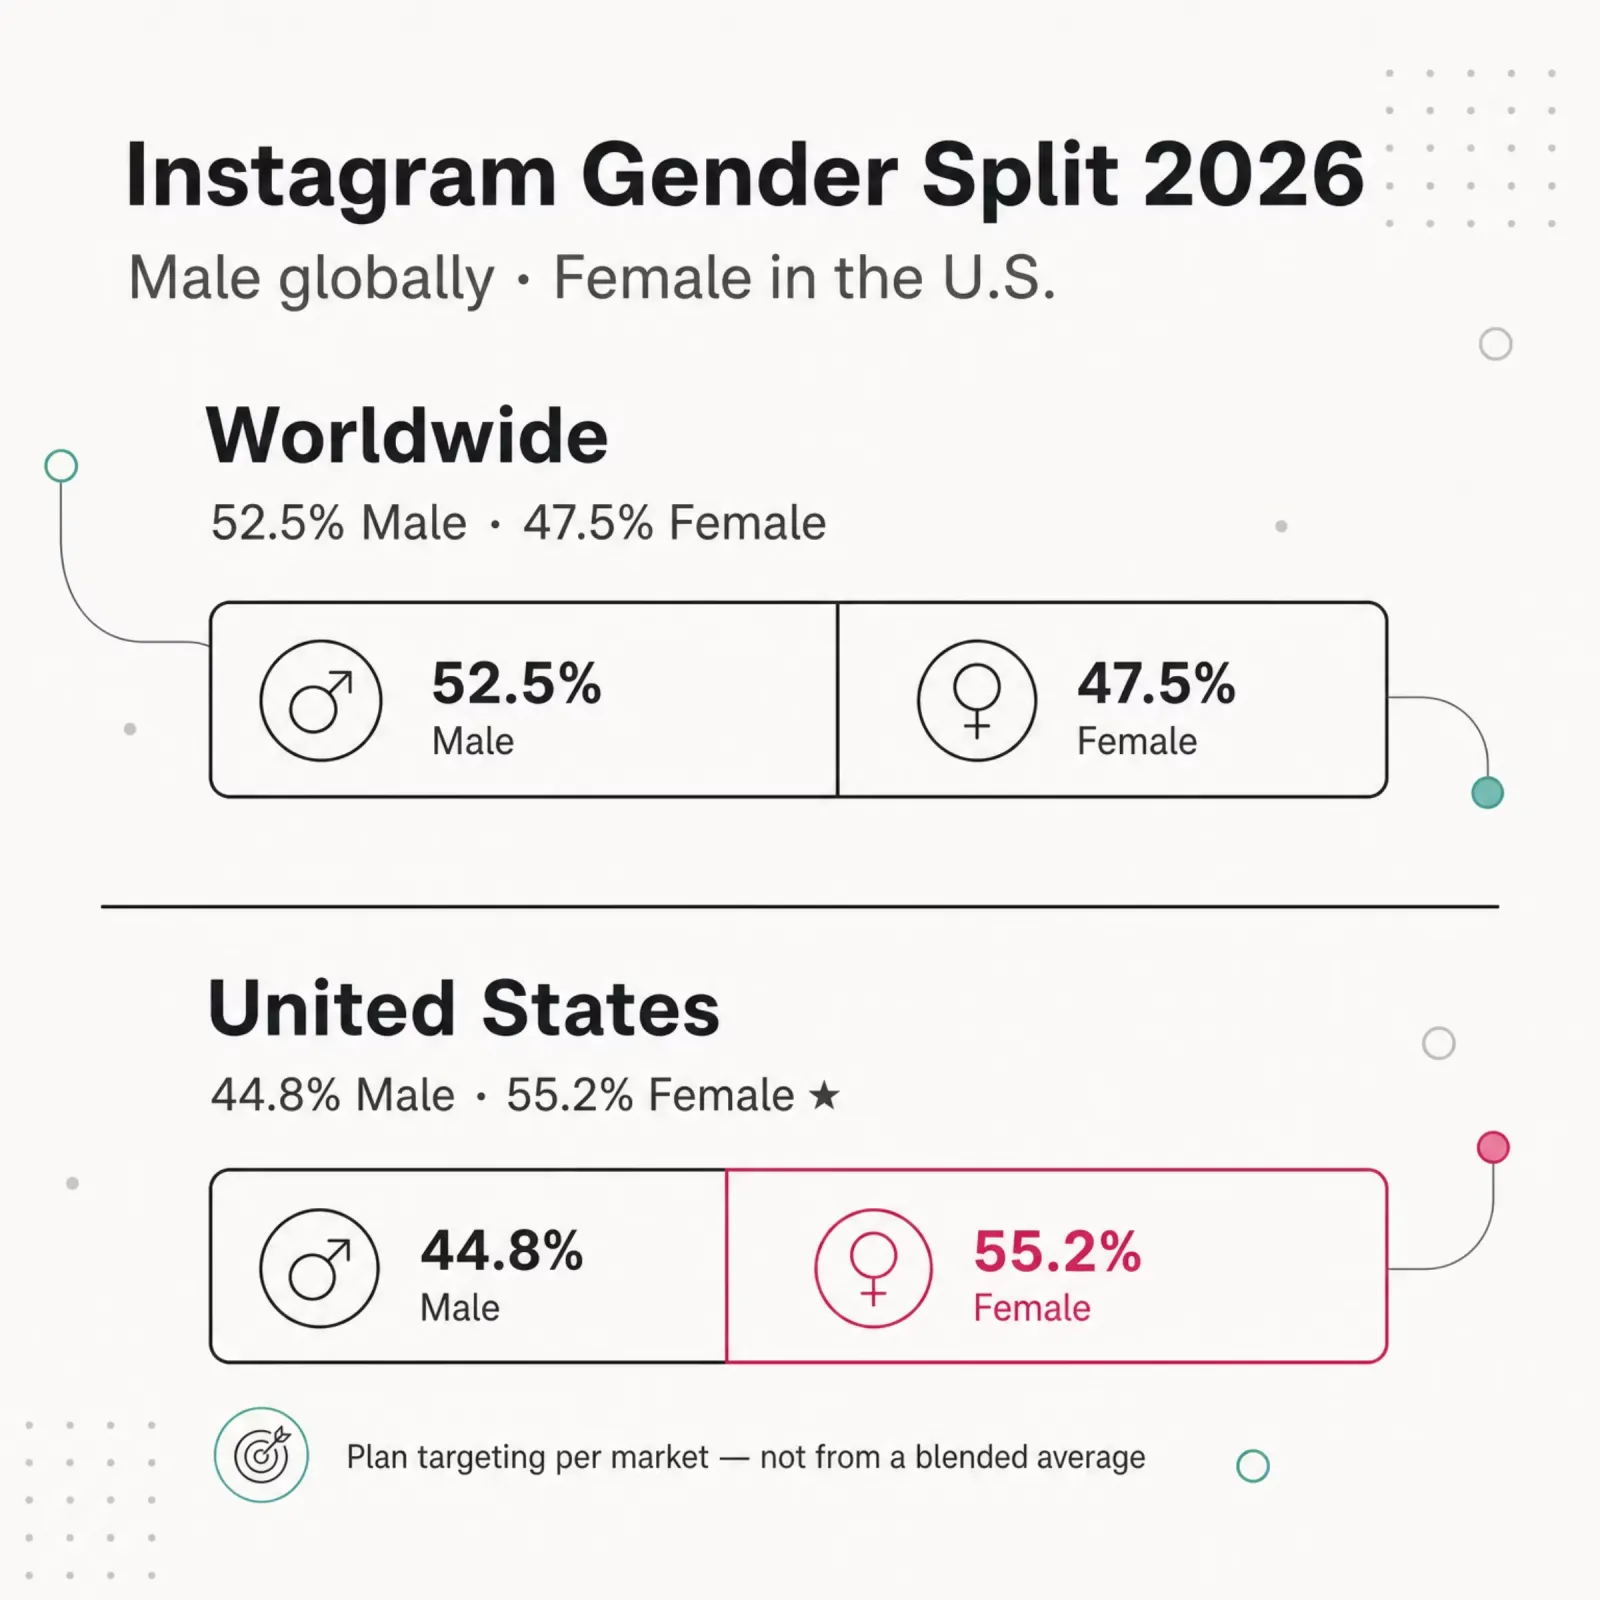
Gender is where Instagram surprises people. Globally, men make up 52.5% of users and women 47.5%, a slight male skew that contradicts the platform's long-standing "it's a women's app" reputation. The single largest demographic slice worldwide is men aged 25-34, at 18.7% of the entire user base.
But that global picture flips in the United States, where 55.2% of Instagram users are women and 44.8% are men (NapoleonCat, March 2026). So the honest answer to "is Instagram mostly men or women?" is: it depends entirely on which country you're asking about.
Who uses Instagram in the United States?
The United States is Instagram's second-largest market, with about 188 million users as of March 2026 (NapoleonCat). The U.S. audience leans female (55.2%) and, like the global base, concentrates in the 25-34 bracket.
| U.S. age group | Share of users |
|---|---|
| 18-24 | 20.2% |
| 25-34 | 30.5% |
| 35-44 | 19.6% |
| 45-54 | 13.0% |
| 55-64 | 8.9% |
| 65+ | 7.7% |
What stands out: the U.S. audience is meaningfully older than the global one. Where 63% of global users are under 35, in the U.S. that figure is closer to 51%. Instagram has aged up with its earliest American adopters. The 35-plus cohorts (48.5% combined) are now nearly half the U.S. base, which reshapes who you can actually reach there.
How many daily users does Instagram have, and how long do they stay?
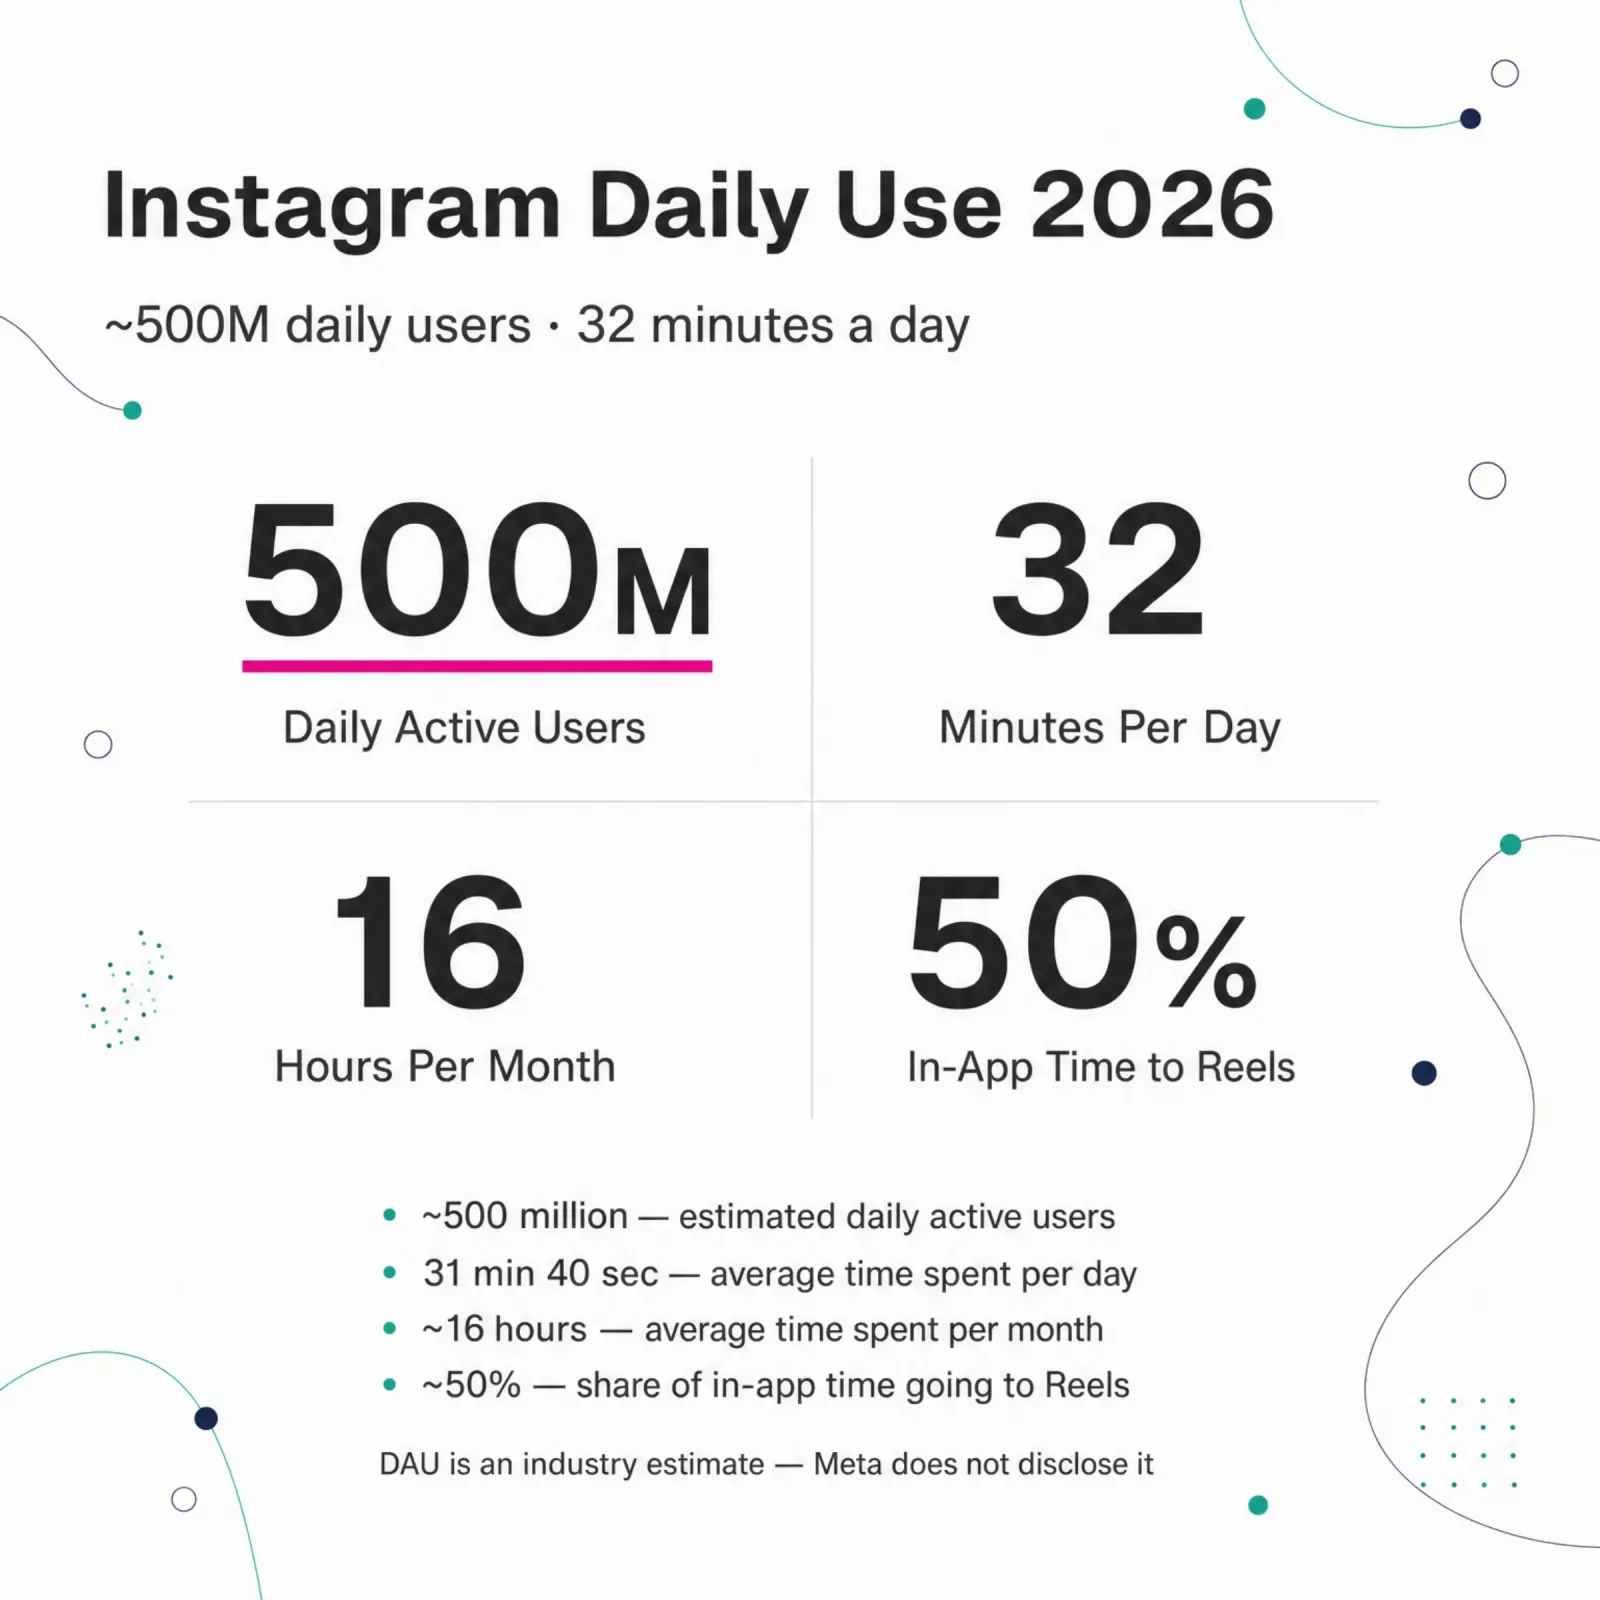
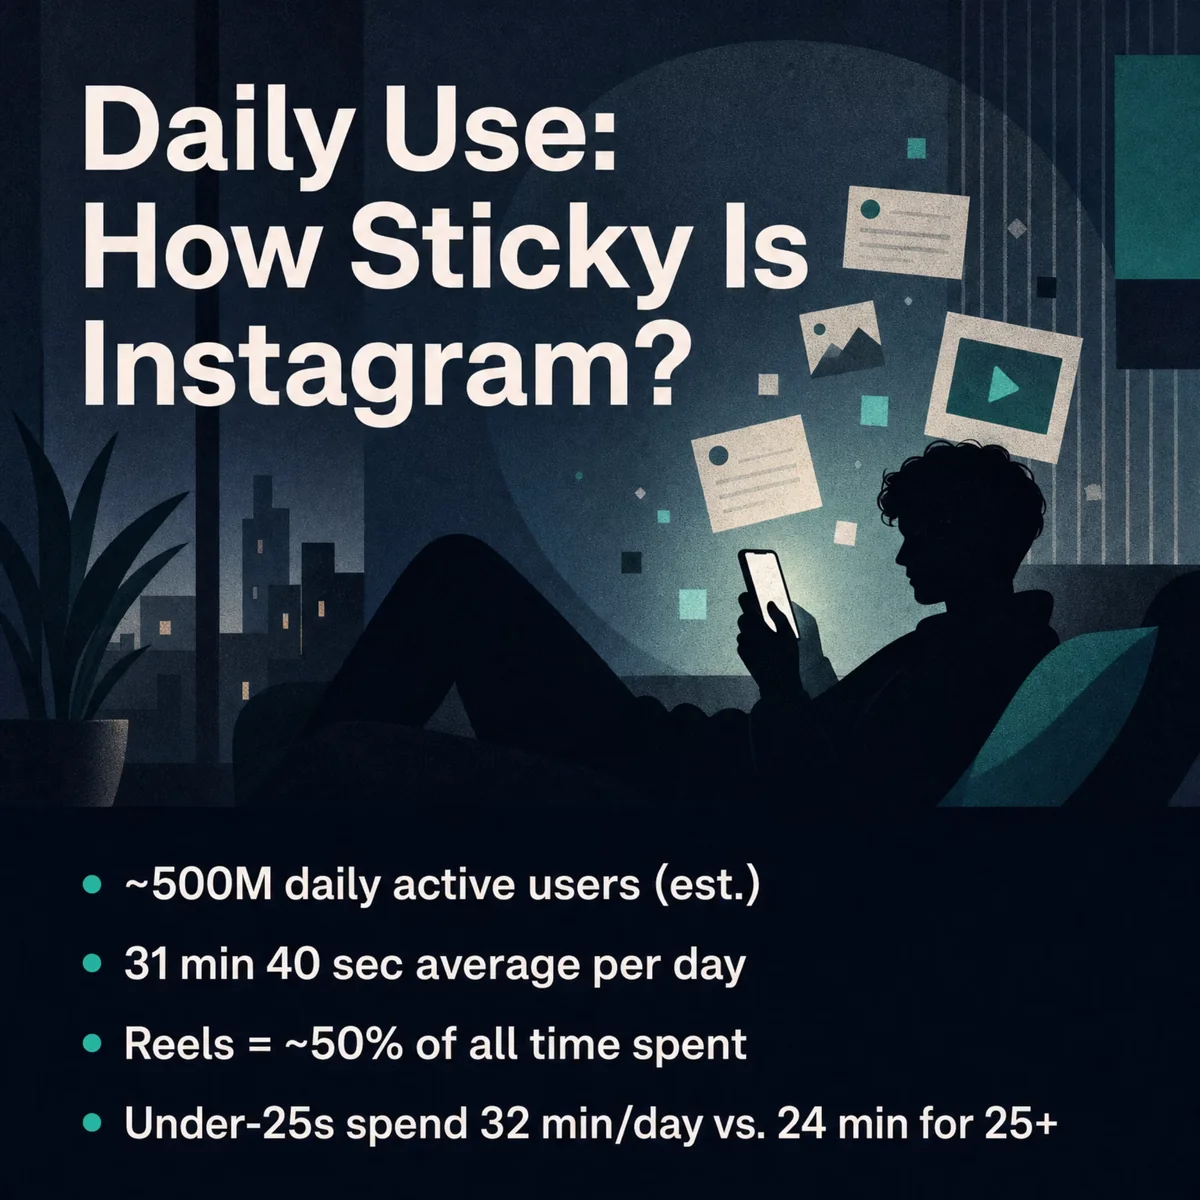
The monthly figure gets the headlines, but daily use is where stickiness shows. Instagram is widely reported to have around 500 million daily active users, though one caveat belongs up front. Meta does not officially break out Instagram's DAU, so that number is an industry estimate, not a disclosed figure. Treat it as directional.

Roughly 32 minutes a day, about 16 hours a month. Daily time spent is the metric Instagram competes on hardest.
Time spent is better documented. The average Instagram user spends 31 minutes and 40 seconds per day on the app, according to DataReportal, close to 16 hours a month. That splits sharply by age: users under 25 average about 32 minutes a day, while users over 25 average 24 minutes. And Reels now account for roughly half of all time spent in the app, which is the single clearest explanation for why the feed keeps surfacing them.
Instagram engagement statistics
Reach per post has fallen, but engagement per impression has risen. In 2024, the average image post reached around 5,200 users, down from 14,800 in 2023, roughly a 64% year-over-year drop as the feed shifted toward Reels and recommendations. Yet the people who do see content interact with it more.
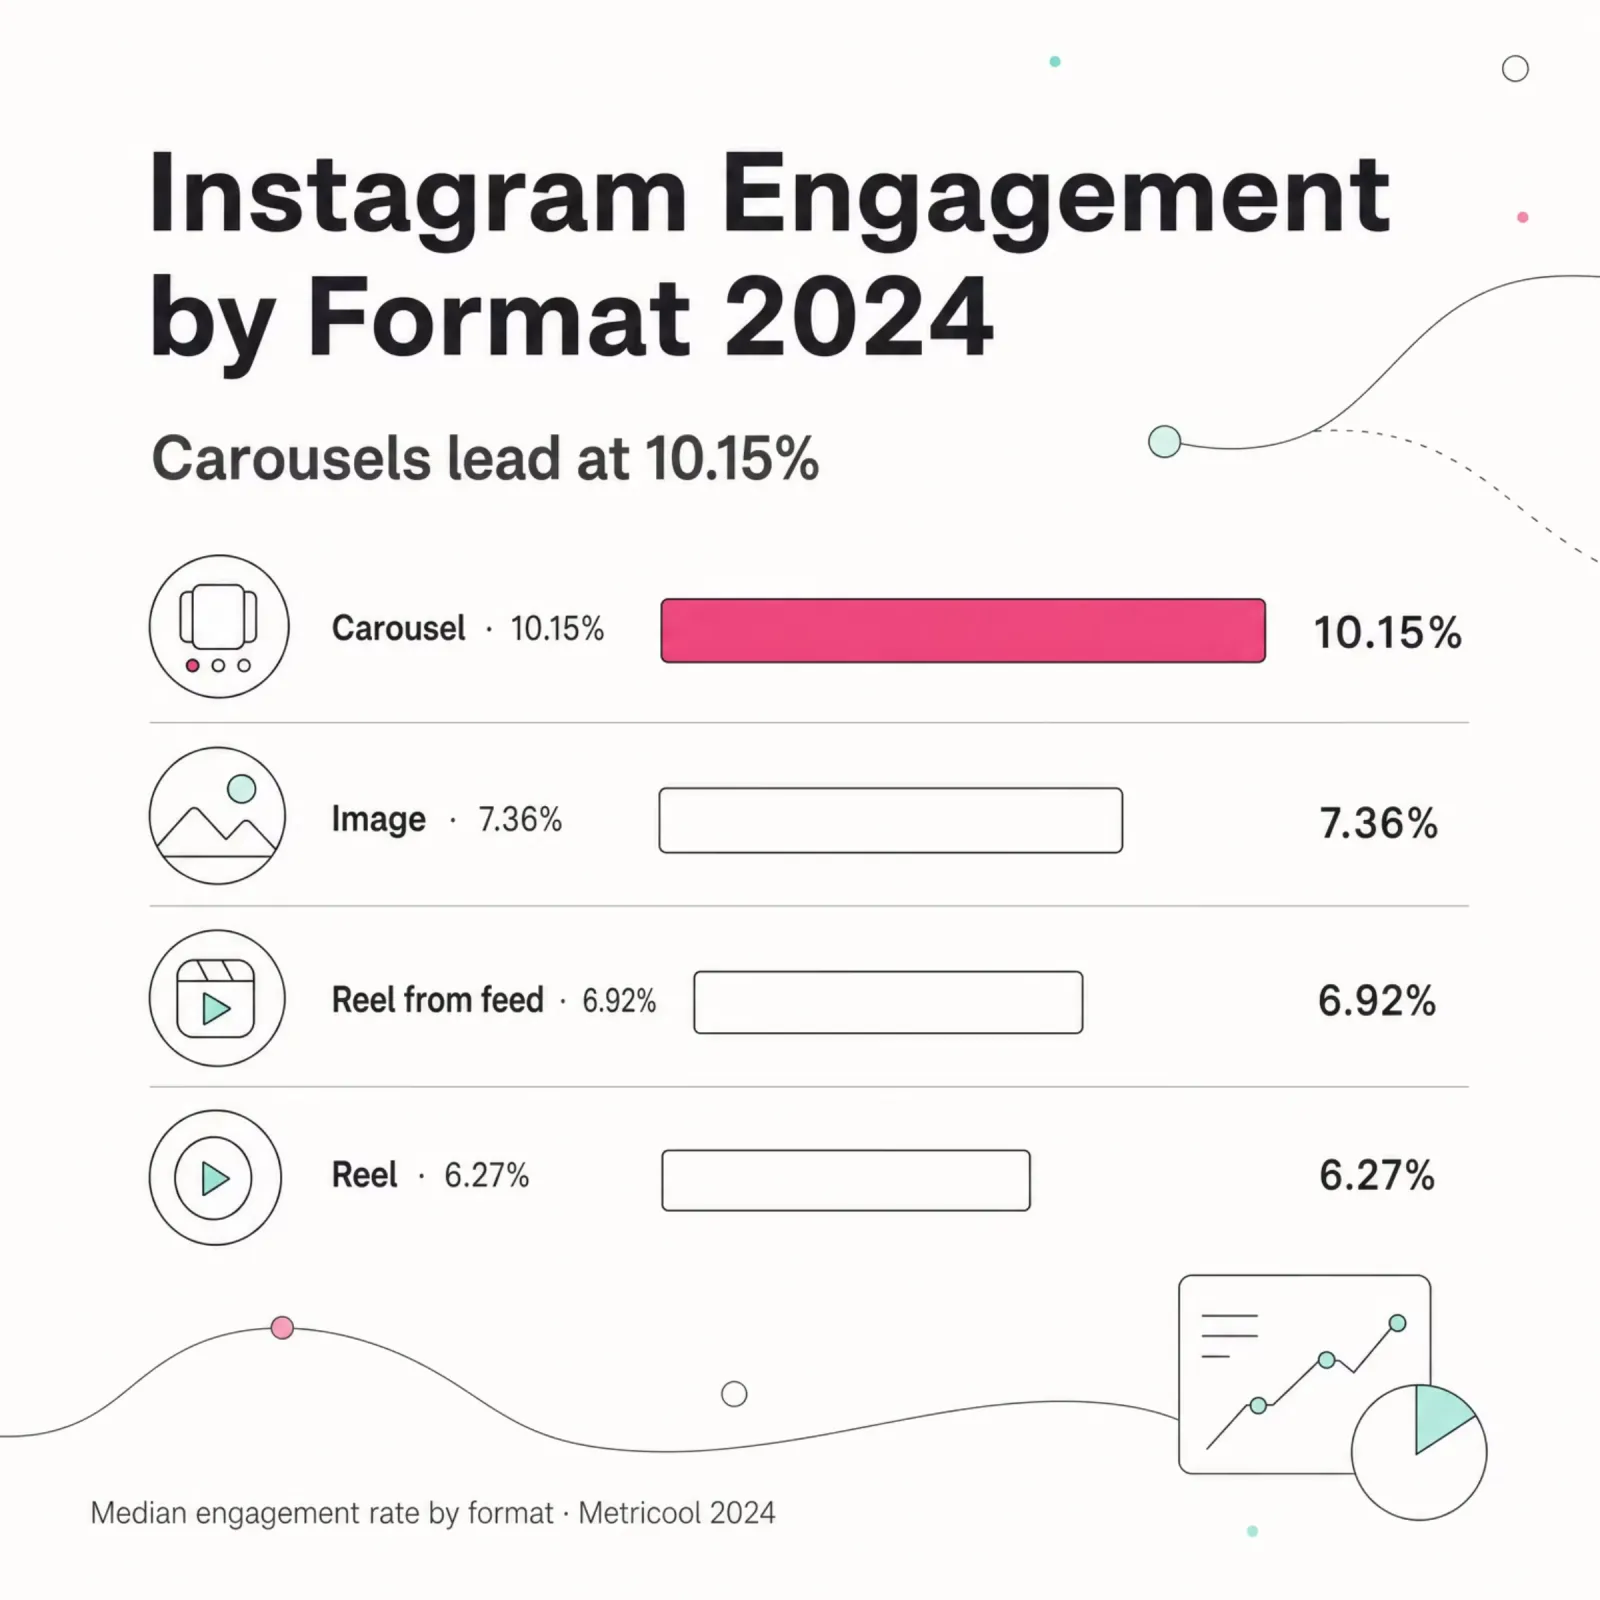
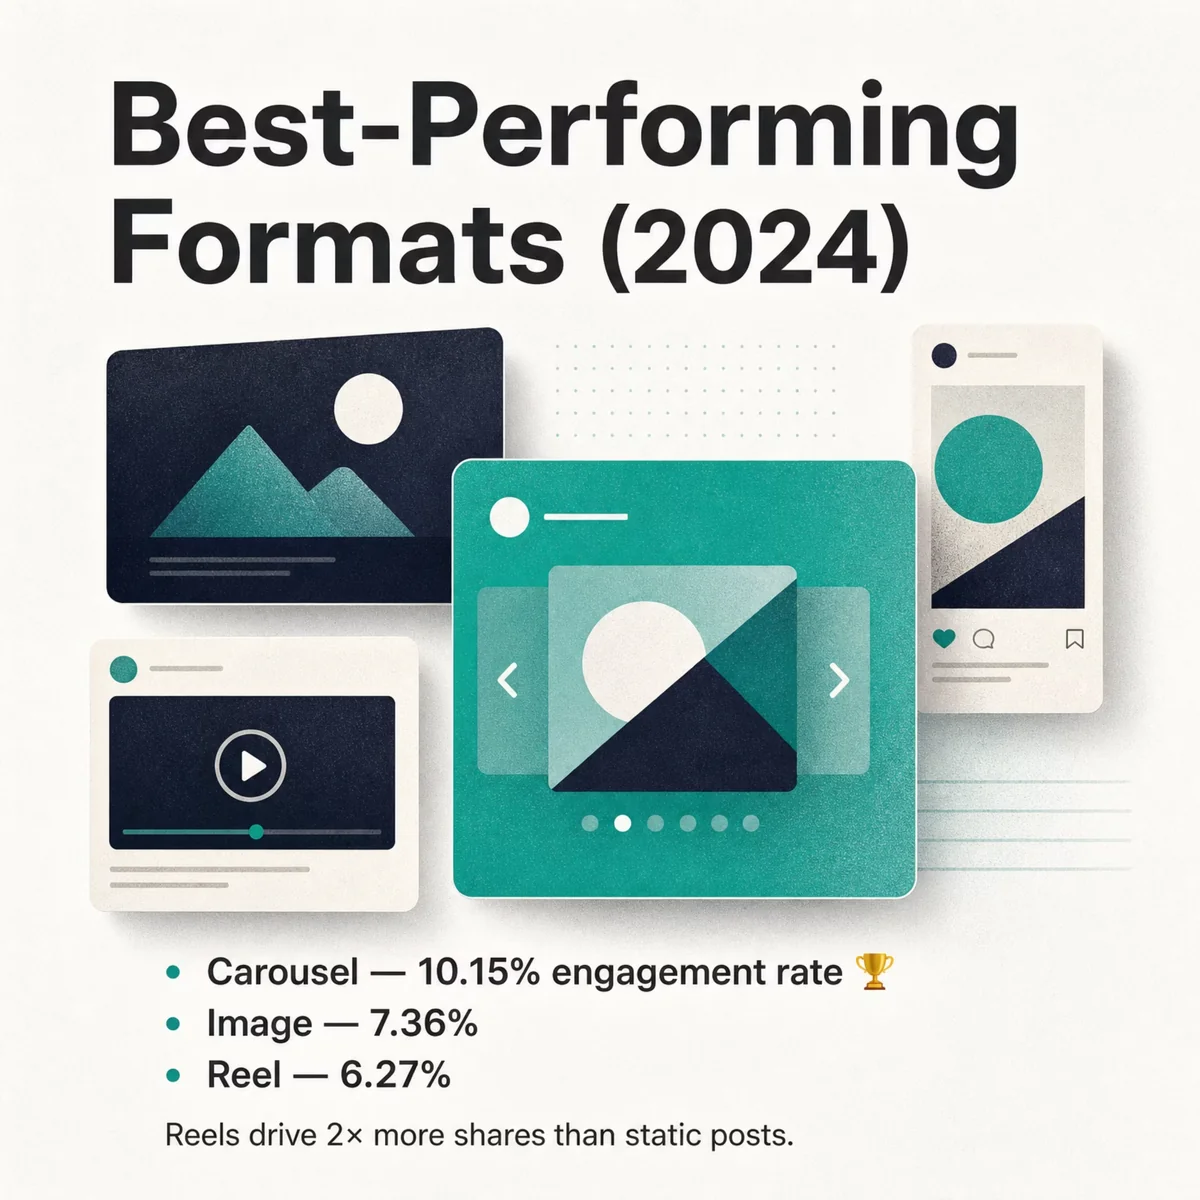
Carousels are the engagement champion. By format, here's the 2024 engagement-rate picture from Metricool's study of 391,490 professional accounts:
| Format | Engagement rate (2024) |
|---|---|
| Carousel | 10.15% |
| Image | 7.36% |
| Reel from feed | 6.92% |
| Reel | 6.27% |
On raw interactions, the average 2025 Instagram post drew 377 likes, 11.8 comments, 17 saves, and ~40 shares, while the average Reel pulled 476 likes and 91.5 shares. Reels generate more than double the shares of static posts, which is exactly why the algorithm keeps pushing them.
Instagram for marketers: business statistics
Instagram is a near-default channel for marketing teams. In Social Media Examiner's January 2026 survey of 840 marketers worldwide, 82% reported using Instagram for marketing, second only to Facebook (86%) and ahead of LinkedIn (72%) and YouTube (58%). Among B2C marketers specifically, Instagram usage climbs to 87%; even among B2B teams it reaches 78%.
When asked which platform is most important, the ranking tightens:
Most Important Social Media Platform for Marketers 2026: Facebook at 36%
During a 2026 survey among marketers worldwide, approximately 36 percent said Facebook was the most important social media platform. Instagram and LinkedIn followed, named by 27 and 26 percent of respondents respectively, while YouTube, TikTok, and X/Twitter trailed well behind.
Source: Social Media Examiner · 2026
| Platform | Share of marketers |
|---|---|
| 36% | |
| 27% | |
| 26% | |
| YouTube | 7% |
| TikTok | 2% |
| X/Twitter | 1% |
- Facebook remains the single most important platform for 36% of marketers
- Instagram (27%) and LinkedIn (26%) are effectively tied for second
- TikTok is named most important by just 2% despite its reach
Facebook still leads on "most important" (36%), with Instagram (27%) and LinkedIn (26%) close behind. The pattern I see with clients: Instagram is rarely the single most important platform on paper, but it's the one almost nobody is willing to drop. It's the connective tissue between top-of-funnel discovery and brand credibility. For the broader picture on where ad budgets actually flow, see our social media advertising and marketing insights.
How much revenue does Instagram generate?
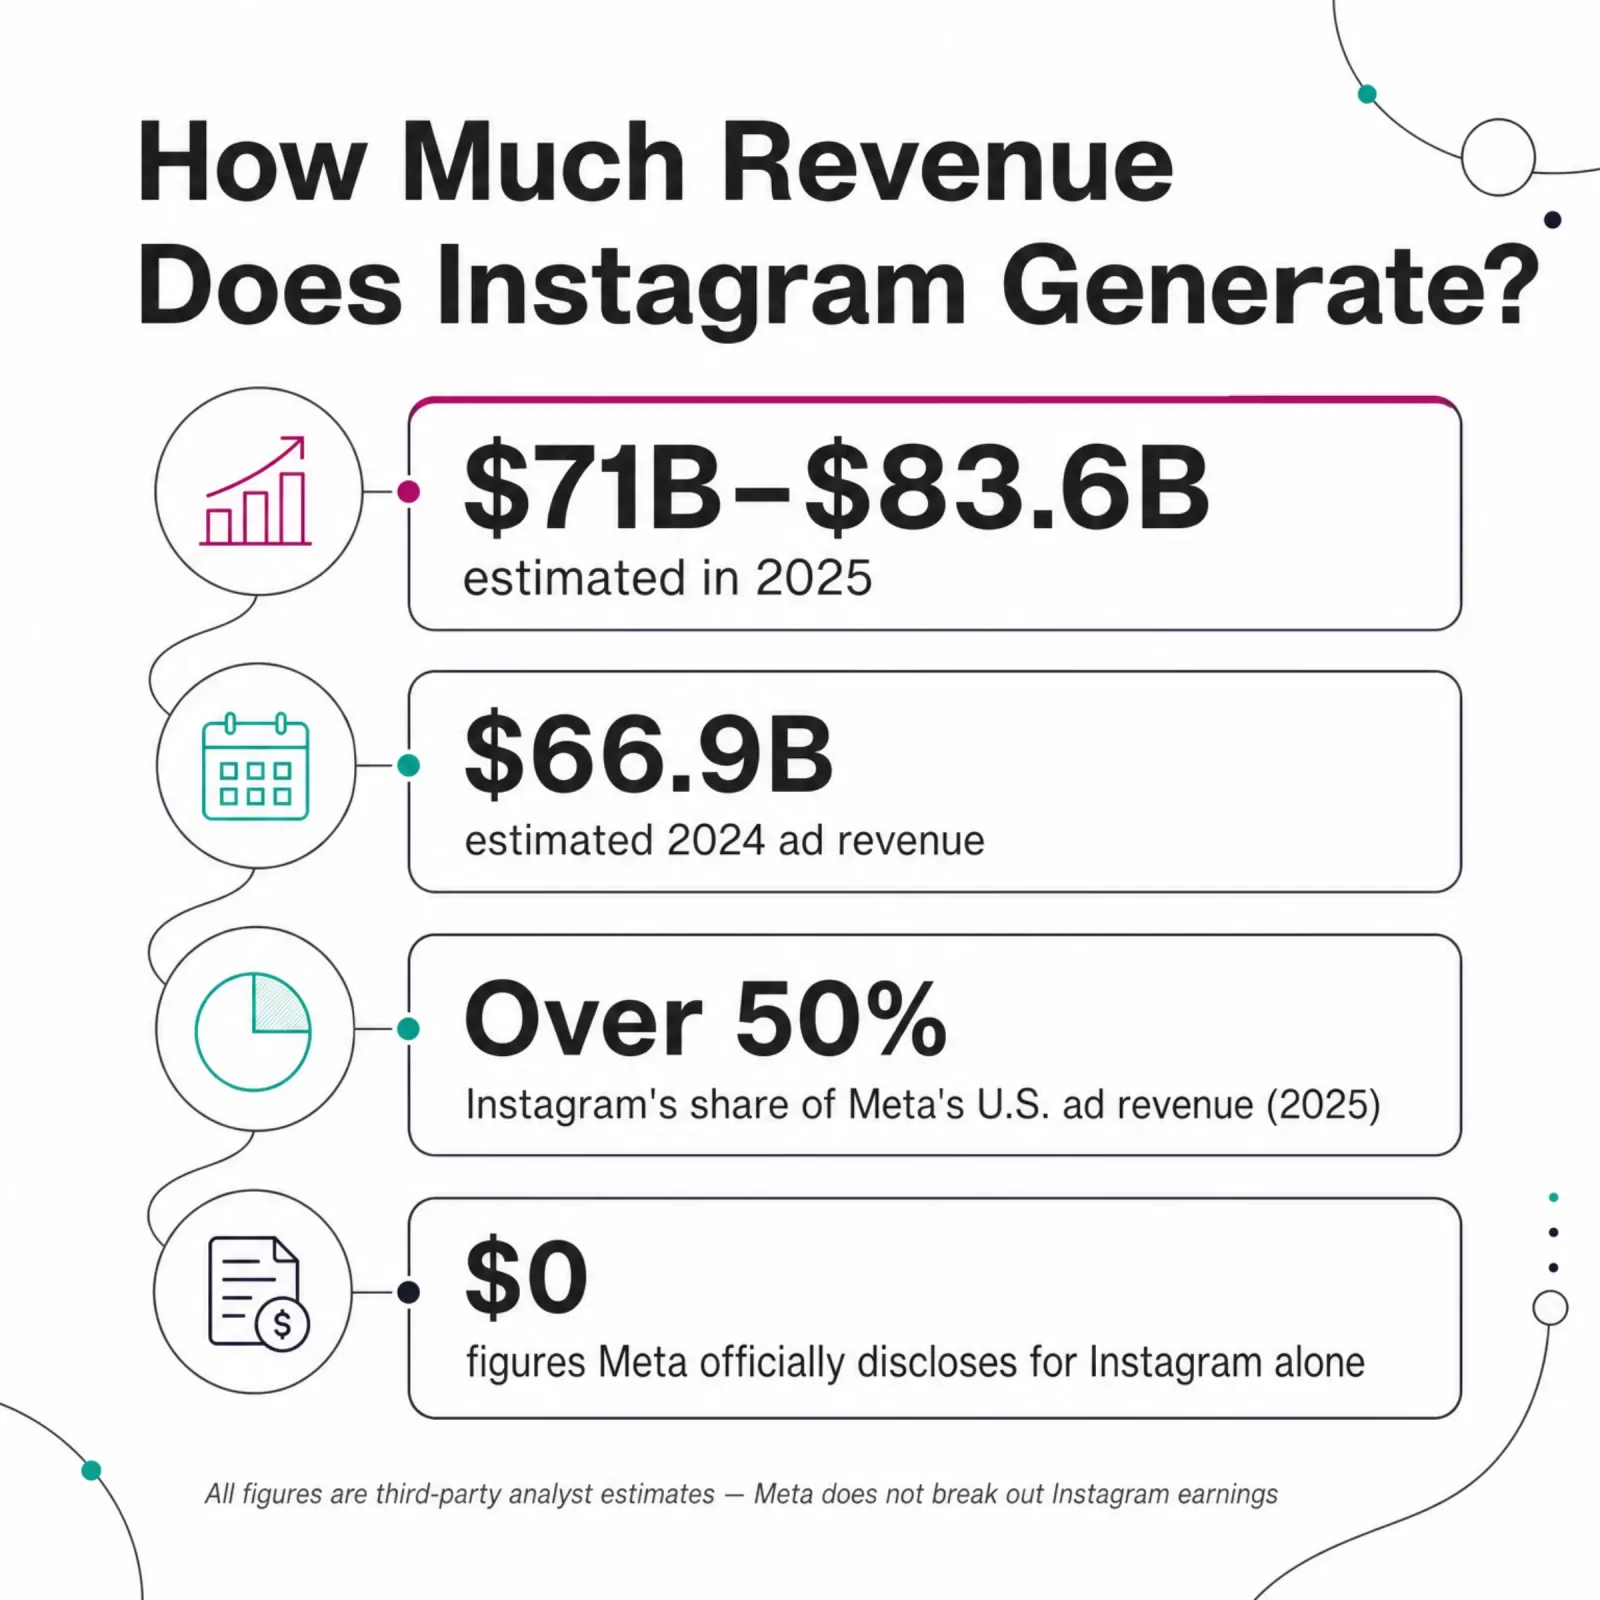
Here's the catch that makes Instagram revenue its own guessing game: Meta has never separately disclosed it. Instagram's earnings are folded into Meta's "Family of Apps," so every dollar figure you'll read is an analyst estimate, not an SEC number. It's the same measurement gap we saw with user counts, this time applied to money.
The estimates land in a wide band. Instagram generated roughly $66.9 billion in 2024 (Business of Apps), about 40% of Meta's ad revenue. For 2025, projections range from about $71 billion (≈37% of Meta's ad take) to as high as $83.6 billion, a spread of more than $12 billion driven entirely by differing methodologies. In the U.S. specifically, Instagram is estimated to have crossed 50.3% of Meta's domestic ad revenue in 2025, the first time it cleared half. That milestone says more about Instagram's commercial weight than any user count does.
Much of that money rides on the creator and influencer economy, where Instagram is still the default platform for branded partnerships.
Which companies use Instagram on their websites?
Instagram's own stats never answer one question: which businesses actually put Instagram on their websites? That's where our data comes in. At TechnologyChecker, we detect when a company adds its Instagram account to its own site (the profile link or handle businesses place in a header, footer, or contact page) across a crawl of nearly 30 million active domains. As of June 2026, 31,886 websites use Instagram this way, with a further 6,370 that did and later dropped it. That's a 4.25% share of its detection category. Browse the full list of companies using Instagram for the complete size, industry, and country breakdown.
One caveat first, because it matters: this counts businesses that publicly connect their site to their Instagram, not every company that happens to have an Instagram account (which would run into the tens of millions). It's a narrower, more revealing signal. These are companies deliberately pointing their website visitors to their Instagram presence.
The recognizable names skew large:
| Company | Industry | Employees | Country |
|---|---|---|---|
| NVIDIA | Computer Hardware Mfg | 10,001+ | United States |
| General Motors | Motor Vehicle Mfg | 10,001+ | United States |
| Airbnb | Software Development | 5,001-10,000 | United States |
| T-Mobile | Telecommunications | 10,001+ | United States |
| Hitachi | IT Services | 10,001+ | Japan |
| Virgin | VC & Private Equity | 10,001+ | United Kingdom |
| Mary Kay | Personal Care Products | 1,001-5,000 | United States |
| Dunkin' | Food & Beverage | 1,001-5,000 | United States |
| U.S. Navy | Armed Forces | 10,001+ | United States |
| Chicago Public Schools | Education | 10,001+ | United States |
But those enterprises are the exception, not the rule.
Using Instagram is an SMB-first signal
Cross-referenced against LinkedIn firmographic data for the 13,383 companies we matched, the typical site using Instagram is tiny. 68.76% of companies that use Instagram have just 1-10 employees, and roughly 85% have fewer than 50. Fewer than 4% have more than 1,000.

The median site linking its Instagram account isn't an enterprise brand team. It's a business small enough that the owner shoots the product photos.
Companies Using Instagram by Size 2026: 69% Are Tiny
Of the 13,383 companies TechnologyChecker matched to firmographic data, 68.76 percent of those using Instagram on their websites have just 1-10 employees, and nearly 85 percent have fewer than 50. Fewer than 4 percent have more than 1,000 employees — confirming that using Instagram on a company site is overwhelmingly a small-business signal, even though recognizable enterprises also do it.
Source: TechnologyChecker · June 2026
| Company size (employees) | Share of companies (%) |
|---|---|
| 1-10 | 68.76% |
| 11-50 | 15.97% |
| 51-200 | 7.38% |
| 201-500 | 2.83% |
| 501-1,000 | 1.39% |
| 1,001-5,000 | 1.78% |
| 5,001-10,000 | 0.42% |
| 10,001+ | 1.46% |
- 68.76% of companies using Instagram have just 1-10 employees
- ~85% have fewer than 50 staff — it's an SMB-first signal
- Fewer than 4% have more than 1,000 employees
Which industries use Instagram?
No single industry dominates; adoption is broad and consumer-facing. The top sectors, by share of firmographic-matched companies:
| Industry | Share of companies |
|---|---|
| Retail | 3.55% |
| Advertising Services | 3.41% |
| Spectator Sports | 3.31% |
| Non-profit Organizations | 3.20% |
| Online Audio & Video Media | 3.12% |
| Media Production | 2.97% |
| Book & Periodical Publishing | 2.49% |
| Technology & Internet | 2.21% |
| Broadcast Media | 2.15% |
| Wellness & Fitness | 2.08% |
The pattern is visual, brand-led sectors: retail, advertising, sports, media, publishing, and wellness all cluster at the top. If a business sells something people want to see, it tends to put Instagram on its site.
Adoption versus usage: two different maps
Here's the finding I didn't expect. In consumer terms, India is Instagram's biggest market (480 million users). But in business terms (companies using Instagram on their sites), the United States dominates with 4,624 sites, and India ranks only fourth (583).
Companies Using Instagram by Country 2026: US Leads
The United States leads business adoption of Instagram by a wide margin, with 4,624 detected company websites — far ahead of Brazil (945) and the United Kingdom (627). This is the reverse of consumer usage, where India leads the world with 480 million Instagram users but ranks only fourth for business adoption (583 sites). Where people use Instagram and where businesses put it on their websites are two different maps.
Source: TechnologyChecker · June 2026
| Country | Company websites using Instagram |
|---|---|
| United States | 4624 |
| Brazil | 945 |
| United Kingdom | 627 |
| India | 583 |
| France | 394 |
| Spain | 381 |
| Canada | 329 |
| Italy | 329 |
| Australia | 306 |
| Germany | 295 |
- The US leads business adoption with 4,624 sites — 4.9x Brazil in second
- India leads consumer users (480M) but ranks only #4 for business adoption (583 sites)
- Business adoption and consumer usage are two different maps
How Instagram compares to other social platforms on company websites
Instagram is one signal; it gets sharper next to every other social platform we detect on the same crawl. One honest note before the table: these are different kinds of footprint. Some companies link out to a platform (their Instagram profile); others install its ad or tracking tag (the Facebook Pixel, the LinkedIn Insights Tag) or embed its content (a YouTube video). The table below measures breadth of presence on company websites, not a like-for-like product contest.
| Social platform footprint | What we detect | Live sites (June 2026) |
|---|---|---|
| Facebook Pixel | Meta ad / conversion tag | 2,066,299 |
| YouTube | Embedded video player | 1,396,145 |
| Save button / tag | 883,066 | |
| LinkedIn Insights Tag | B2B conversion tag | 111,433 |
| LinkedIn Ads | B2B ad tag | 83,686 |
| Profile / account link | 31,886 | |
| Twitter / X Ads | Ad / conversion tag | 24,173 |
Two patterns jump out. First, Meta owns the company website on both axes. The Facebook Pixel is the single most common analytics tag in our entire crawl, on 2.07 million live sites, roughly 65 times as many sites as link their Instagram account. Businesses wire Meta's measurement layer into their sites far more than they point visitors to their Instagram, which tells you how companies actually use the two: Instagram as an outbound social link, the Pixel for tracking what their site earns.
Second, the post-2022 retreat from X is visible in our data. We detect Twitter/X's ad tag on just 24,173 live sites, but 326,902 sites have removed it. For every site still running X's tag, about thirteen have dropped it. That's the starkest abandonment curve of any platform we track.
What this means for B2B and GTM teams
If you sell to businesses, a company that appears in our list of businesses using Instagram is a usable firmographic signal. It clusters around small, consumer-facing companies in retail, media, and wellness, so for an ICP of SMB brands, its presence is a cheap proxy for "marketing-active, visually-driven, probably running paid social." For enterprise sellers the inverse holds: an Instagram link on a 10,000-person site (a Mary Kay, a Dunkin') usually flags a specific brand or campaign team, not the whole org. We see the same playbook with workflow-automation adoption: the tool a company installs tells you who they are.
Instagram 2026 in ten shareable cards
Here's the whole report distilled into ten cards you can screenshot, save, or drop into a deck. Every figure traces back to a section above, and underneath them is a look at the feature set driving those engagement numbers.

Instagram's current feature set (Reels, Stories, DMs, and Notes) is what turns billions of accounts into 31-plus minutes a day. Source: Meta / Instagram (2025).

How to check your own Instagram statistics
If you landed here looking for your account's stats rather than platform-wide numbers, the fastest route is Instagram's built-in Insights. Switch to a Professional account (Business or Creator) under Settings → Account type, and you'll see reach, interactions, follower growth, and per-post performance directly in the app. For deeper, exportable analysis, marketers typically pair Insights with a third-party tool (Metricool, Sprout Social, or similar) that tracks trends over time and benchmarks against competitors. The macro statistics in this guide tell you what "normal" looks like; your Insights tab tells you where you stand against it.
Methodology and data sources
Two first-party sources anchor this guide: our own detection crawl of nearly 30 million live domains (everything in the business-adoption sections) and a live Cloudflare Radar pull (the web-traffic ranking). The consumer figures come directly from the primary researchers that track Instagram (DataReportal, Meltwater, We Are Social, Meta Platforms, NapoleonCat, Metricool, Social Media Examiner, HypeAuditor, and Social Blade), each named inline next to its number rather than hidden behind an aggregator.
The web-traffic ranking is first-party data I pulled live from the Cloudflare Radar global domain ranking on June 15, 2026, along with the per-country rankings behind the Q1-versus-Q2 country table (each cell is the median of three weekly snapshots in that quarter, so a single noisy day can't skew it). Radar reflects DNS-resolution traffic to each platform's primary domain, not in-app activity, so it under-represents app-first platforms (a caveat that cuts hardest for TikTok). The "3 billion MAU" milestone is Meta's own disclosure, reported in 2025. Forecasts (the 1.8 billion 2028 figure) are Statista user-model estimates, not guarantees.
Revenue figures deserve their own caveat: Meta does not break out Instagram's earnings in its SEC filings, so every dollar amount here is a third-party analyst estimate, and I've given the range rather than pick a single number. The website-footprint data (how many sites use Instagram or run each platform's tag) is also first-party, pulled from our own June 2026 crawl of nearly 30 million active domains. It counts sites that wire a platform into their pages, not the platforms' user bases.
A note on freshness: social platform numbers move monthly. Every figure here is timestamped to its source date (mostly mid-to-late 2025 and early 2026), and we refresh this page as new dossiers and Radar pulls land.
Frequently asked questions
How many users does Instagram have in 2026? Instagram has approximately 3 billion monthly active users worldwide as of 2026, per Meta and DataReportal. Statista's separate user-base model gives a more conservative ~1.47 billion for 2025, rising toward 1.8 billion by 2028. The difference is methodology, not contradiction.
When did Instagram become popular? Instagram launched in October 2010 and hit 1 million users within two months. Its popularity inflection came after Facebook (now Meta) acquired it for about $1 billion in April 2012; it reached 1 billion users in 2018 and 2 billion in 2021.
Is Instagram still growing in 2026? Yes. Instagram posted 13.1% year-over-year audience growth in 2025, ahead of Facebook and YouTube, though behind TikTok (17.6%) and LinkedIn (14.9%). The conservative user-base model projects continued growth through a 2028 peak.
What country has the most Instagram users? India, with 480.55 million users as of October 2025, more than double the United States (181.75 million). By penetration, Turkey leads, with 90.4% of its population on the platform.
In which countries is Instagram most popular by web traffic? By Cloudflare Radar's domain ranking, instagram.com is a top-7 website in Brazil (#6), India (#7), and Indonesia (#6), but only around #17 in the United States. It ranks higher in emerging markets, where it competes with fewer large local sites. Across the first half of 2026 it climbed in six of the ten major markets we tracked and fell in none.
Has Instagram's website ranking gone up or down over the past year? Up or steady almost everywhere. Over the full year to Q2 2026, instagram.com's national web rank held or climbed in all ten of the major markets we tracked and fell in none. The clear multi-place gains came from markets that were outside the top ten a year earlier: France rose from about #17 to #10, the United Kingdom from #15 to #10, Germany from #11 to #8, and Mexico from #12 to #8. The emerging markets where Instagram was already a top-ten site (Brazil, India, Indonesia, Turkey) had little room left and barely moved, and the United States held roughly steady at about #16, still outside the top fifteen. Figures are medians of weekly Cloudflare Radar snapshots per quarter.
Is Instagram mostly used by men or women? Globally, men slightly outnumber women (52.5% vs 47.5%). In the United States, it reverses: 55.2% of users are women. The answer depends on the market.
Who owns Instagram? Meta Platforms (formerly Facebook, Inc.) owns Instagram, alongside Facebook, WhatsApp, and Messenger, four of the world's most-used platforms, each with over a billion users.
How much revenue does Instagram generate? Estimates put Instagram's 2025 ad revenue between roughly $71 billion and $83.6 billion, up from about $66.9 billion in 2024. The wide range exists because Meta does not disclose Instagram's revenue separately; it's bundled into Meta's Family of Apps, so every figure is an analyst estimate. In the U.S., Instagram is believed to have passed 50% of Meta's domestic ad revenue for the first time in 2025.
How much time do people spend on Instagram per day? The average user spends about 31 minutes and 40 seconds per day on Instagram, per DataReportal, nearly 16 hours a month. Users under 25 spend more (around 32 minutes daily) than users over 25 (around 24 minutes), and Reels account for roughly half of all time spent in the app.
Instagram in 2026 is bigger than its own headline numbers suggest, younger than its U.S. audience implies, and more male than its reputation admits. If you're building a strategy on it, start from the market you actually serve. The global average will mislead you in either direction. For how the next generation is reshaping these platforms, see our Gen Z social media statistics, and for the AI-search angle on social platforms, our ChatGPT statistics.

CMO & Co-founder
10+ years of experience
Elif is the CMO and co-founder of TechnologyChecker.
- MBA, London Business School
- Google Analytics Certified Professional
- HubSpot Inbound Marketing Certified
Never miss our research