Operating System Market Share September 2026: Android 36%, Windows 33%, iOS 19%
Operating system market share September 2026: Android 36.1%, Windows 32.9%, iOS 19.4%. Cloudflare Radar data, and why the Linux desktop spike wasn't real.
Published •Data through September 2026•26 min read

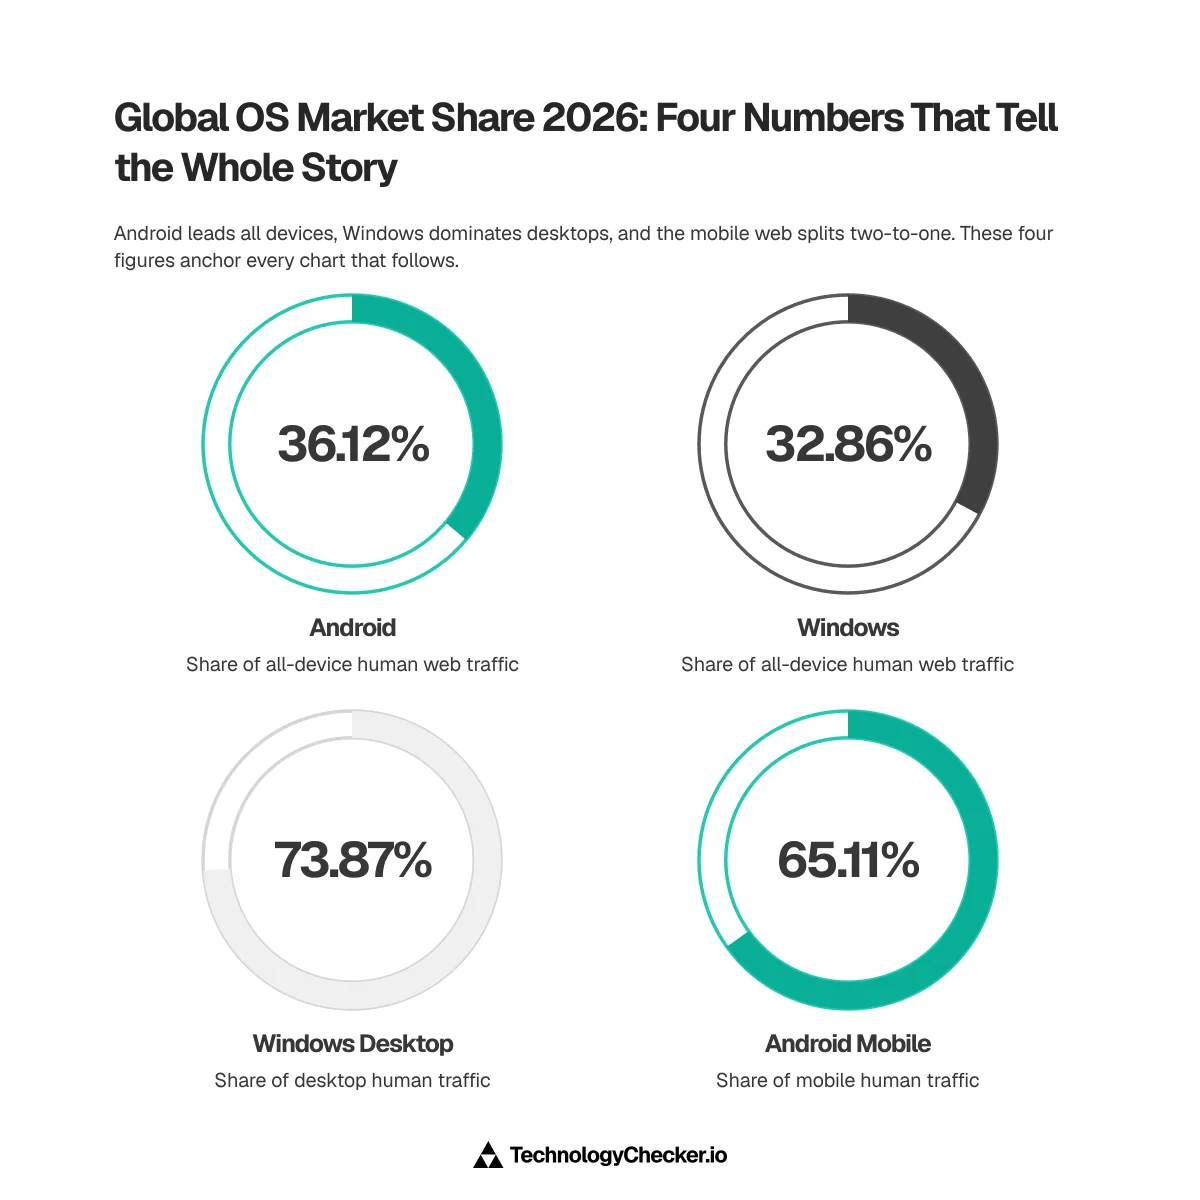
Android holds 36.12% of human web traffic worldwide in September 2026, ahead of Windows on 32.86% and iOS on 19.37%. Those three cover 88% of everything a website serves to a person. macOS takes 8.84%, Linux 2.10% and ChromeOS 0.68%. Figures are Cloudflare Radar's 28-day window ending 13 September 2026.

I pulled every number below from the Cloudflare Radar API on 13 September 2026, then re-cut the same queries by device type, by bot classification, by country and by month back to January. I'm a data analyst at TechnologyChecker and my normal job is turning technology-detection signals into prospect lists, so I read OS share the way a go-to-market team has to read it: not as a scoreboard, but as the thing that decides which browser bugs cost you money and which push-notification strategy is a waste of a sprint.
One warning before the tables. This report will not agree with the operating system market share numbers you've seen elsewhere, and the disagreement is the most useful thing in it.
Which operating system has the most market share in 2026?
Android has the most, at 36.12% of human web traffic. Here's the full distribution across every device that reached a Cloudflare-proxied site in the 28 days to 13 September 2026.
| Operating system | Share of human web traffic |
|---|---|
| Android | 36.12% |
| Windows | 32.86% |
| iOS | 19.37% |
| macOS | 8.84% |
| Linux | 2.10% |
| ChromeOS | 0.68% |
| Smart TV | 0.04% |
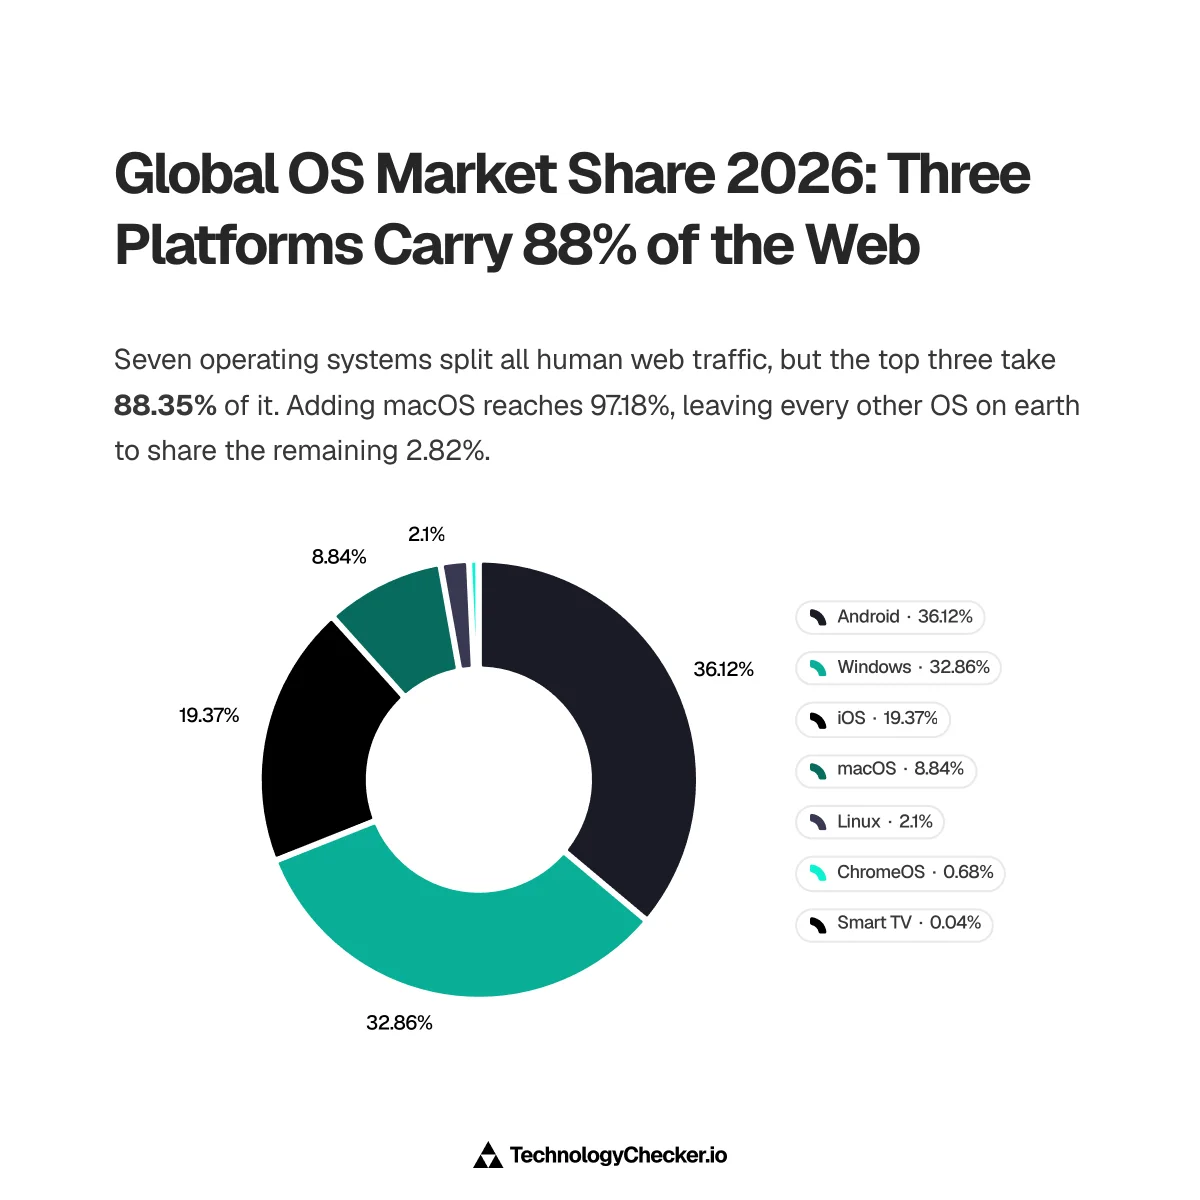
Two things in that table surprise people.
The first is how close Android and Windows are. A gap of 3.26 points across the whole internet is nothing. It flips depending on the hour of the day, and it flips completely depending on whether you count bots.
The second is Linux at 2.10%. Hold that number, because the rest of this report spends a lot of time on it.
Underneath the OS split sits a device split that explains most of it: mobile is 54.07% of human requests and desktop is 45.91%. That balance shifts hard by country, as our mobile vs desktop usage breakdown shows. Android and iOS are fighting over the bigger half. Windows and macOS are fighting over the smaller one.
Operating system market share month by month in 2026
Here is the full 2026 series, all devices, human traffic only. Each row is a calendar month pulled with explicit start and end dates; the September row is the 28-day window to the 13th, so it is not directly comparable to the eight full months above it.
| Month (2026) | Android | Windows | iOS | macOS | Linux | ChromeOS |
|---|---|---|---|---|---|---|
| January | 37.45% | 31.55% | 20.20% | 8.49% | 1.44% | 0.82% |
| February | 36.58% | 32.48% | 19.68% | 8.89% | 1.36% | 0.96% |
| March | 36.01% | 33.00% | 19.43% | 9.10% | 1.44% | 0.96% |
| April | 35.67% | 33.44% | 19.43% | 9.07% | 1.44% | 0.91% |
| May | 36.34% | 32.92% | 19.46% | 8.83% | 1.47% | 0.93% |
| June | 36.08% | 32.96% | 19.71% | 8.94% | 1.66% | 0.60% |
| July | 36.98% | 32.24% | 19.51% | 8.80% | 1.99% | 0.43% |
| August | 36.49% | 32.84% | 19.47% | 8.80% | 1.83% | 0.54% |
| September (28d to 13th) | 36.12% | 32.86% | 19.37% | 8.84% | 2.10% | 0.68% |
Nothing at the top of that table is moving. Across all nine rows Android's full range is 1.79 points, Windows' is 1.90, iOS sits inside 0.83 and macOS inside 0.61. Nine months of the biggest platform contest in computing, and the four leaders are within two points of where they started.
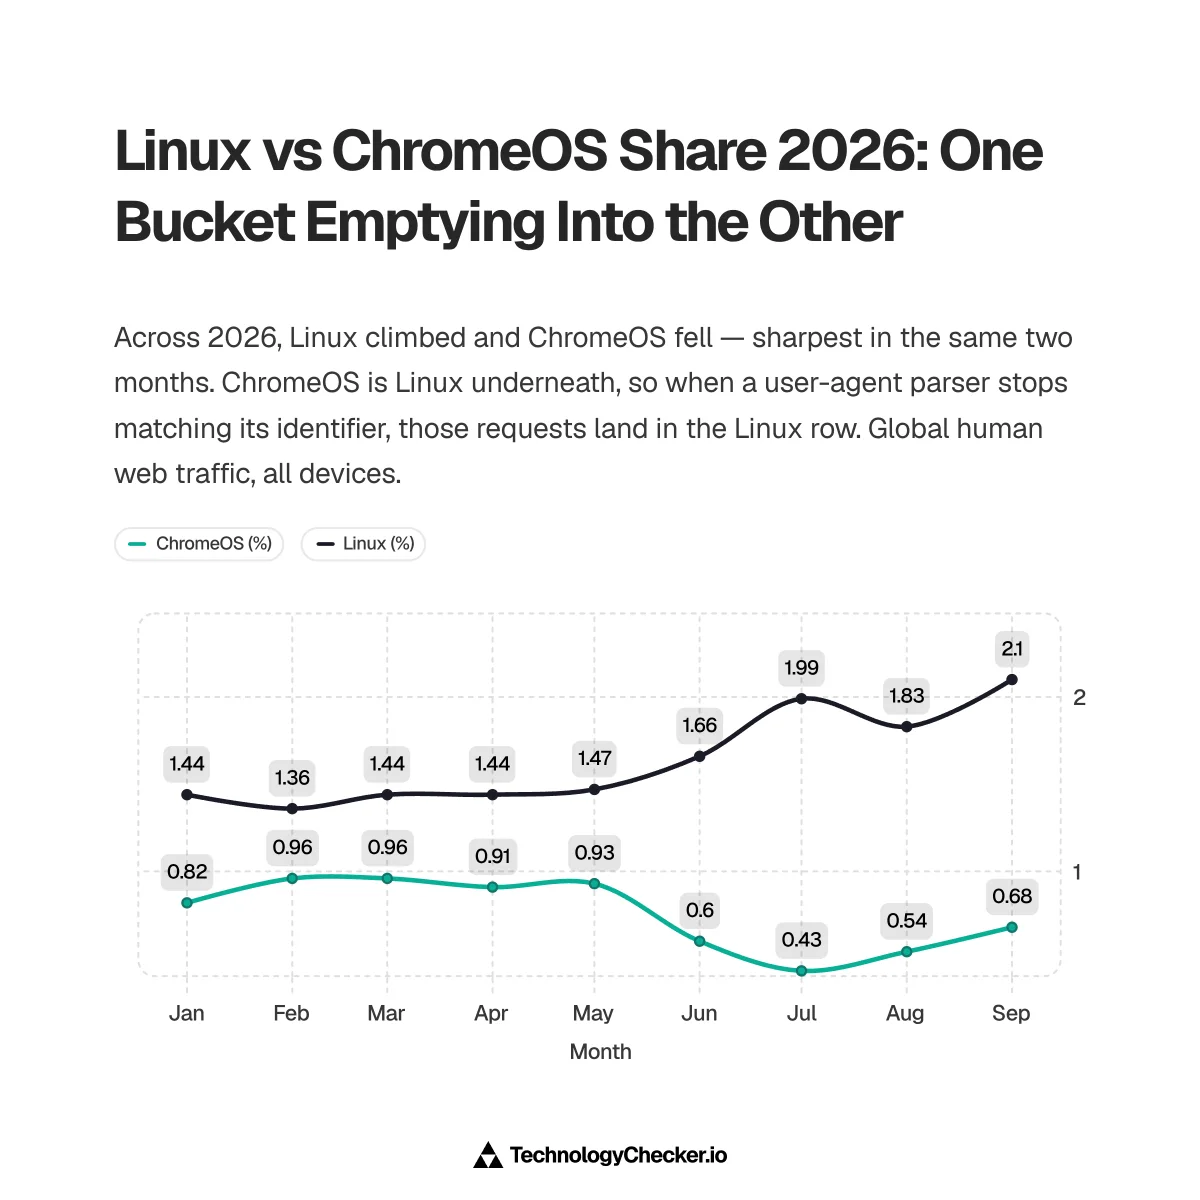
The two bottom rows are the exception, and they move together. Linux climbs 1.44% → 2.10% while ChromeOS falls 0.82% → 0.68%, with the sharpest part of both moves landing in the same two months, June and July. That pattern is the subject of a whole section below.
Year over year: three snapshots, not a trend
The same 28-day mid-September window, three years running:
| Window (28d to mid-September) | Android | Windows | iOS | macOS | Linux | ChromeOS |
|---|---|---|---|---|---|---|
| 2024 | 40.66% | 29.35% | 20.93% | 7.07% | 1.10% | 0.82% |
| 2025 | 33.69% | 33.19% | 21.28% | 9.41% | 1.49% | 0.92% |
| 2026 | 36.12% | 32.86% | 19.37% | 8.84% | 2.10% | 0.68% |
Read that Android column and then don't quote it as a trajectory. It goes 40.66 → 33.69 → 36.12, a seven-point fall followed by a two-and-a-half-point recovery. No device market moves like that. Phones do not leave a third of the world's hands in a year and come partly back the next. Something about how the traffic was sampled or classified changed in between, and Radar's public documentation doesn't say what.
The one column that does read cleanly is Linux: 1.10% → 1.49% → 2.10%, roughly doubling in two years. Even there, the section below shows most of the 2026 leg is a bucket transfer rather than adoption.
Why doesn't this match StatCounter?
Because the two measurements count different things, and the gap is roughly 6 points on Windows. Here are both sources for the same month, August 2026, side by side.
| Operating system | StatCounter, Aug 2026 | Cloudflare Radar, Aug 2026 (human) | Difference |
|---|---|---|---|
| Android | 38.66% | 36.49% | +2.17 |
| Windows | 26.49% | 32.84% | −6.35 |
| iOS | 19.02% | 19.47% | −0.45 |
| macOS | 11.37% | 8.80% | +2.57 |
| Linux | 3.76% | 1.83% | +1.93 |
Three mechanical differences produce that spread, and none of them means either source is wrong.
StatCounter counts pageviews; Radar counts requests. StatCounter's panel is a tracking script on a set of member sites, about 3 billion pageviews a month. Radar samples HTTP requests at Cloudflare's edge across roughly a fifth of the web. A desktop session that loads one heavy application and sits there generates one pageview and hundreds of requests. Desktop-shaped usage gets weighted up in a request-based count. That's most of the Windows gap.
Radar can separate humans from bots; a pageview tracker mostly can't. Automated requests are now a large share of everything a site serves, as our bot traffic statistics report sets out. More on this below, because it's the single biggest source of confusion in OS statistics right now.
StatCounter splits macOS into two rows. Its own August table lists "macOS" at 6.47% and "OS X" at 4.90% as separate operating systems. They're the same OS, split by a user-agent parsing quirk. Anyone quoting "macOS 6.47%" from that table is understating Apple's desktop share by nearly half, and it happens constantly.
The Wikipedia entry on usage share of operating systems carries a fourth wrinkle: its desktop table shows an "unknown operating systems" bucket at 18.75% as of June 2026, up from 10.8% eight months earlier. Nearly a fifth of desktop traffic in the most-cited desktop dataset is unlabelled, and that bucket has been growing. Radar has no equivalent hole. When you read "Windows has fallen to 62% of desktop", check whether Windows fell or whether the unknown pile grew.

My position on this: use StatCounter for long time series, because it goes back to 2009 and Radar doesn't. Use Radar for anything where bot contamination or request weighting matters. Don't average them. They're two rulers with different units.
What is the desktop operating system market share?
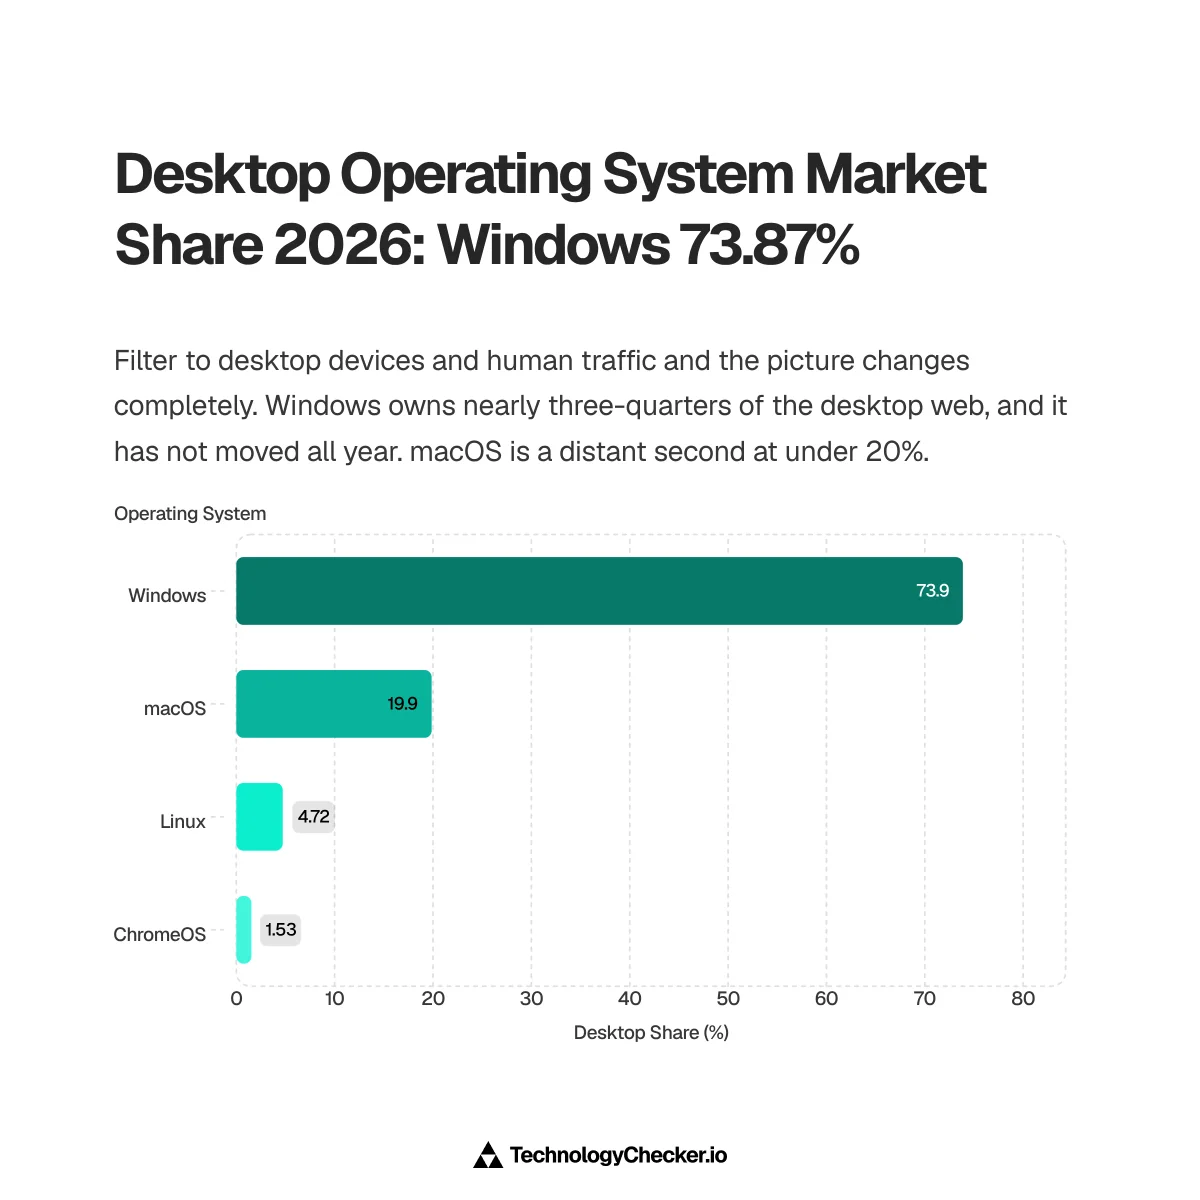
Windows holds 73.87% of desktop human web traffic, macOS 19.86%, Linux 4.72% and ChromeOS 1.53%. Filtering Radar to desktop devices and human traffic removes both the mobile mass and the bot layer, which is the cleanest read of "what are people actually sitting in front of."
| Desktop OS | Human traffic | Automated traffic |
|---|---|---|
| Windows | 73.87% | 60.18% |
| macOS | 19.86% | 27.60% |
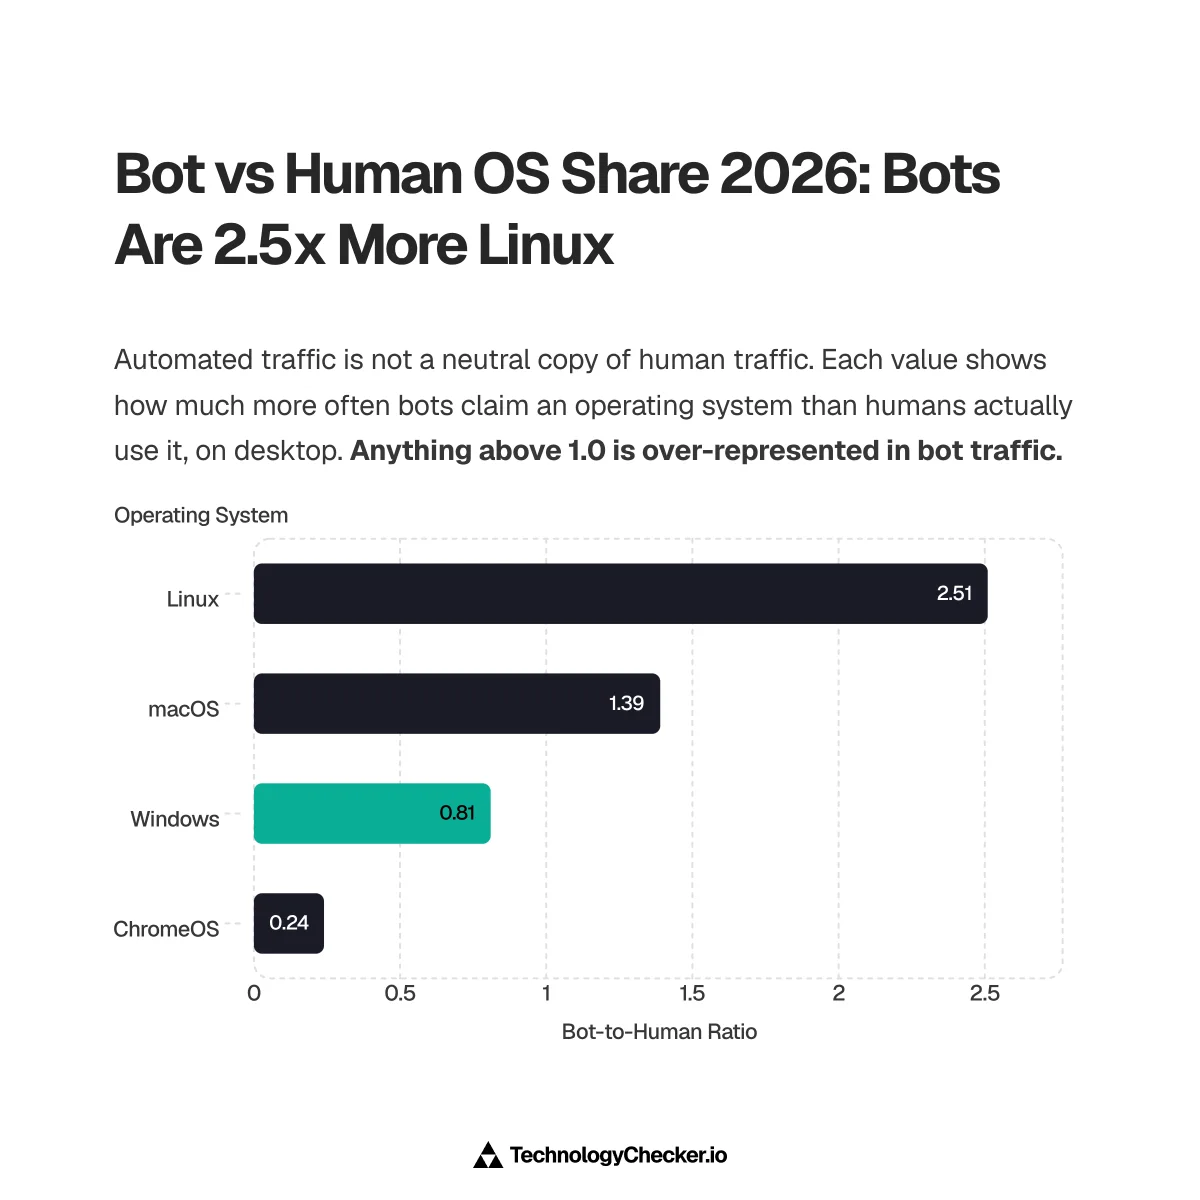
| Linux | 4.72% | 11.84% |
| ChromeOS | 1.53% | 0.36% |
Look at the two columns together. Bots claim to be macOS 1.4 times as often as humans are, and Linux 2.5 times as often. Automated traffic is not a neutral copy of human traffic wearing a different hat, and any desktop OS figure that doesn't say which column it's from is ambiguous. The same inversion shows up browser-side, where our Firefox market share analysis found Firefox's bot share running above its human share.
Now the part nobody talks about. Windows desktop share has not moved in 2026:
| Month (2026) | Windows | macOS | Linux | ChromeOS |
|---|---|---|---|---|
| January | 74.59% | 20.07% | 3.41% | 1.93% |
| March | 74.15% | 20.45% | 3.24% | 2.16% |
| May | 74.53% | 20.00% | 3.34% | 2.11% |
| July | 74.18% | 20.26% | 4.57% | 0.99% |
| August | 74.62% | 20.00% | 4.15% | 1.22% |
Eight months, and Windows sits between 74.15% and 74.64% every single one. macOS holds a 20% line just as tightly. The only two rows that move are Linux and ChromeOS, and they move in opposite directions by almost exactly the same amount.
Did Linux really pass 10% on the desktop?
No. On Radar's numbers, most of that headline is bot traffic and a classification change, not people switching to Linux.
Here's the story it refers to. In August 2026 Slashdot reported that StatCounter put Linux desktop share in North America at 10.65% for July, up from 5.52% in June: nearly a doubling in one month, and 11.87% in the US alone. PCWorld's response was blunt: blame bots.
PCWorld is partly right. Radar lets me check, because it measures the same country on the same months and can split human from automated.
| US desktop Linux, 2026 | Human only | All traffic (humans + bots) |
|---|---|---|
| May | 3.03% | 5.53% |
| June | 4.27% | 7.59% |
| July | 6.96% | 10.55% |
| August | 5.58% | 8.99% |
Radar's unfiltered July figure of 10.55% lands within a point and a half of StatCounter's 11.87%. Two independent measurements, similar answer, which is a good sign both are measuring something real. But the human-only figure for the same month is 6.96%. The bot layer is worth 3.59 points, about a third of the headline.
That accounts for a third. What about the rest?

Look at what ChromeOS did in the US over the same window, human traffic only:
| US desktop, human (2026) | Linux | ChromeOS | Both combined |
|---|---|---|---|
| January | 3.05% | 4.58% | 7.63% |
| May | 3.03% | 4.87% | 7.90% |
| June | 4.27% | 2.14% | 6.42% |
| July | 6.96% | 1.56% | 8.52% |
| August | 5.58% | 2.35% | 7.93% |
Linux gained 3.93 points between May and July. ChromeOS lost 3.31 in the same two months. The combined column barely moves: 7.90% in May, 8.52% in July. ChromeOS is Linux under the hood, and its user-agent string identifies itself with a CrOS token that a parser has to be looking for. When something stops looking for it, those requests fall through to plain Linux. That's the signature here: a redistribution inside one family, not growth.
Put the two effects together and July's 10.55% decomposes almost exactly:
- 3.59 points of bot traffic wearing Linux user agents
- 3.31 points of ChromeOS being counted as Linux
- 3.03 points of human Linux that was already there in May
- 0.62 points of genuine growth
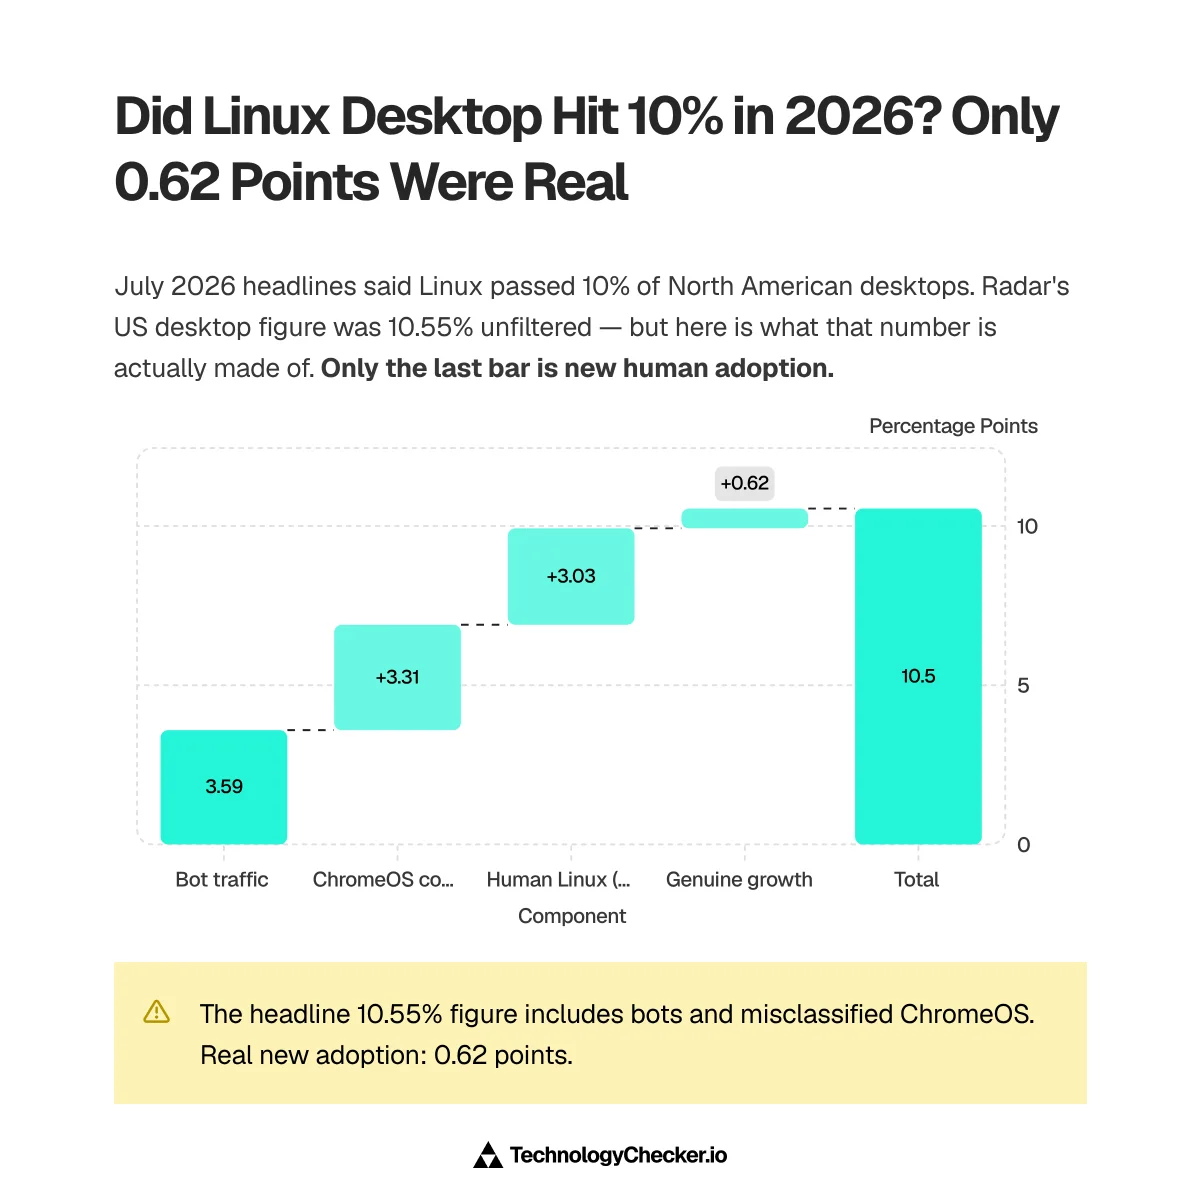
Genuine Linux desktop growth in the US this year is real, and it's about six tenths of a point. Everything else in that headline was already Linux, already ChromeOS, or wasn't a person.
Two caveats I'd want if I were reading this. Cloudflare's human/bot classification isn't perfect, and a sophisticated scraper that passes as human sits in the "human" column here. And I can't prove which parser changed. The pattern is visible in Radar and in StatCounter at the same time, which points at something upstream of both, most likely a widely-used user-agent parsing library. What I can say is that the combined Linux-plus-ChromeOS share held flat while the split inside it moved by nearly 4 points, and no adoption story explains that shape.
What is the mobile operating system market share?
Android holds 65.11% of mobile human web traffic and iOS 34.89%. That ratio has been flat all year: 64.97/35.03 in January, 64.74/35.26 in April, 65.21/34.78 in August.
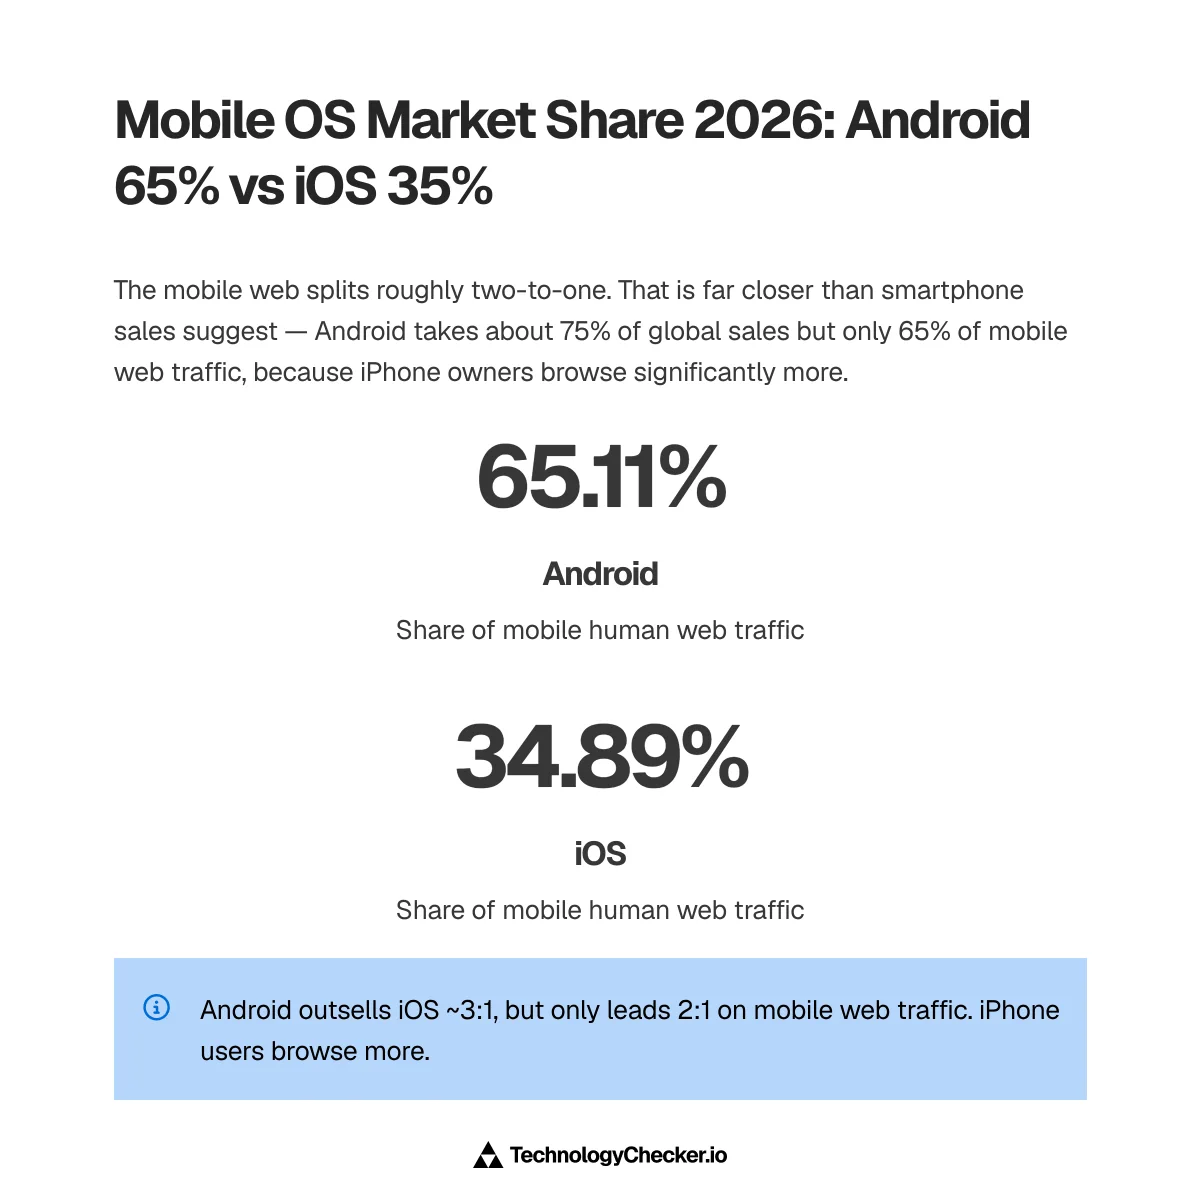
That's a very different picture from smartphone sales. Counterpoint Research put Android at 75% of Q2 2026 global smartphone sales against 20% for iOS, with HarmonyOS taking 5% globally and 24% inside China. Sales share and web-traffic share differ by roughly 15 points in Apple's favour, and it isn't a measurement error. iPhone owners browse more, on faster connections, in higher-spending markets. If you're sizing a mobile web audience, the sales figure will mislead you by a lot.
The browser layer tracks this closely: Mobile Safari carries 12.49% of human requests against Chrome Mobile's 27.75%, which is the same story told through a different dimension in our Safari market share report. HarmonyOS is worth a note because it's the OS most likely to change this table. It doesn't appear in Radar's os dimension at all, and Huawei's browser sends an Android-compatible user agent, so its traffic is almost certainly sitting inside the Android row. A quarter of Chinese smartphone sales is not visible as a separate line anywhere in this dataset.
Operating system market share by country
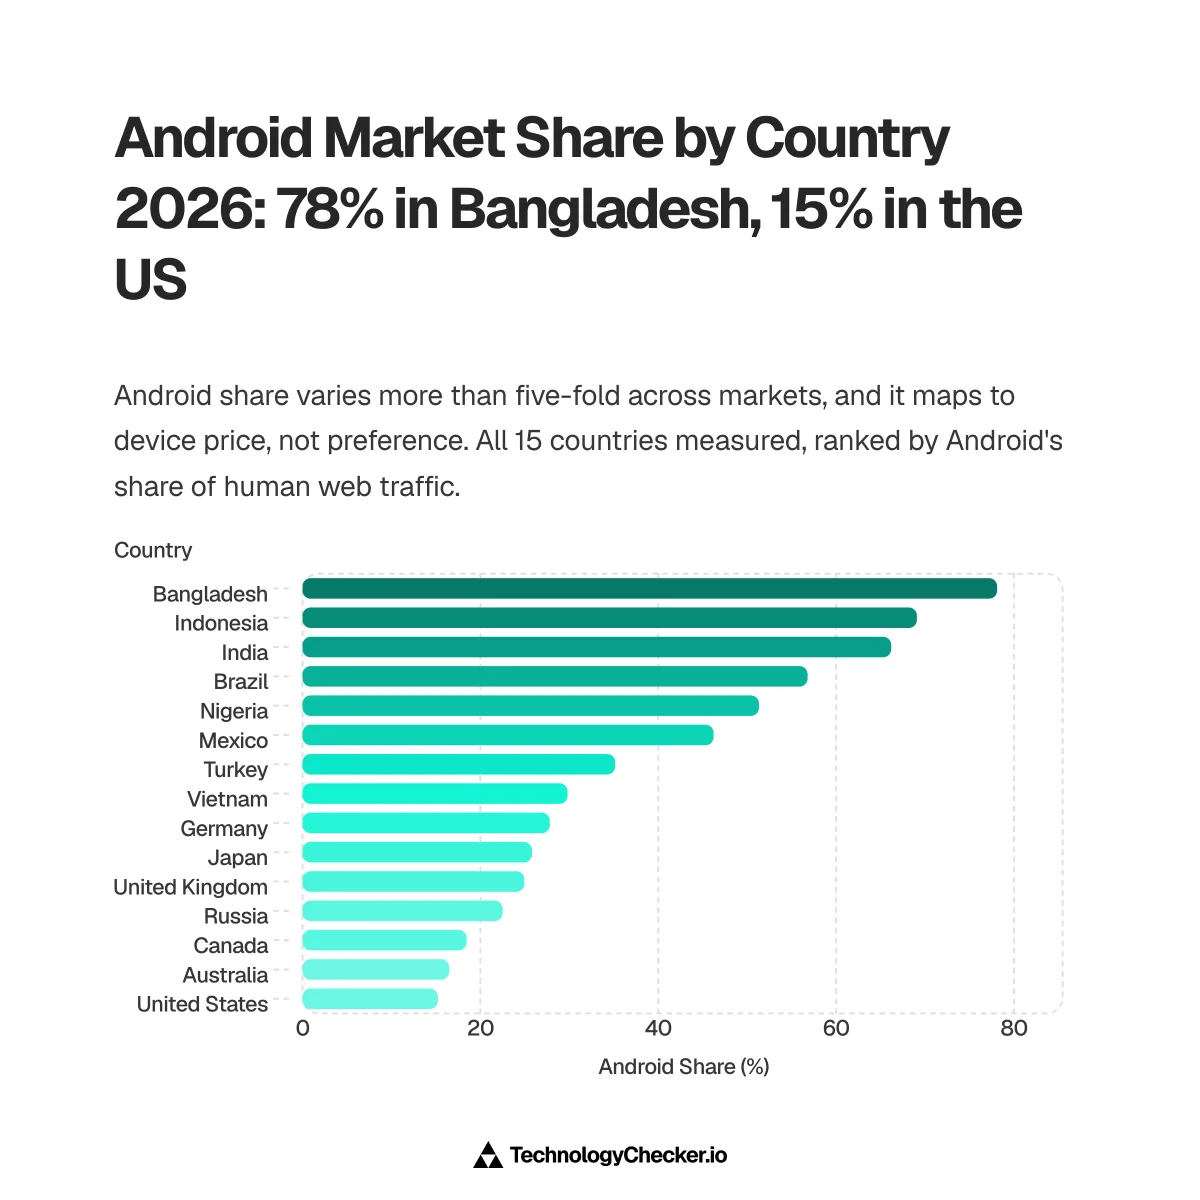
The country split is the widest variation in the whole dataset. Android runs from 15.22% of human traffic in the United States to 78.10% in Bangladesh. Same OS, five-fold difference.
| Country | Android | Windows | iOS | macOS | Linux |
|---|---|---|---|---|---|
| United States | 15.22% | 36.03% | 26.75% | 15.79% | 4.31% |
| United Kingdom | 24.94% | 29.77% | 29.71% | 12.60% | 2.05% |
| Germany | 27.80% | 36.63% | 21.11% | 11.02% | 3.17% |
| Japan | 25.80% | 34.43% | 30.69% | 7.75% | 0.85% |
| Canada | 18.46% | 37.35% | 26.05% | 15.24% | 1.87% |
| Australia | 16.49% | 38.27% | 26.31% | 16.32% | 1.36% |
| Russia | 22.50% | 59.37% | 12.84% | 3.51% | 1.71% |
| Turkey | 35.15% | 35.37% | 22.75% | 4.93% | 1.56% |
| Brazil | 56.79% | 25.78% | 13.44% | 2.58% | 1.01% |
| Mexico | 46.22% | 29.38% | 15.37% | 7.60% | 1.15% |
| India | 66.19% | 21.59% | 6.62% | 3.82% | 1.49% |
| Indonesia | 69.08% | 19.07% | 7.88% | 2.76% | 1.04% |
| Nigeria | 51.32% | 21.16% | 22.38% | 3.89% | 1.10% |
| Vietnam | 29.80% | 28.38% | 36.61% | 4.39% | 0.73% |
| Bangladesh | 78.10% | 14.65% | 3.28% | 3.14% | 0.78% |
Vietnam is the outlier I didn't expect. At 36.61% it has the highest iOS share of any country on earth, above Japan (30.69%) and the UK (29.71%). Nigeria at 22.38% iOS is higher than Germany.
The extremes are stranger still. Ranked by concentration:
- Windows: Turkmenistan 99.21%, Iran 86.69%, Cambodia 59.73%, Russia 59.40%
- Android: Sudan 87.84%, Somalia 84.62%, Eswatini 83.51%, Yemen 82.86%
- macOS: Monaco 23.08%, Andorra 20.96%, Jersey 17.98%, Bermuda 17.70%
- Linux: Finland 4.85%, United States 4.32%, Germany 3.17%, Singapore 3.00%
- ChromeOS: El Salvador 9.95%, Saint Lucia 4.18%, Bahamas 4.03%
Turkmenistan at 99.21% Windows is the most extreme reading in the entire dataset, and it says more about how a heavily-restricted internet gets accessed than about consumer preference. The macOS list is a wealth ranking with no other explanation: Monaco, Andorra, Jersey, Bermuda, the Cayman Islands. And El Salvador at 9.95% ChromeOS, roughly five times the US rate, almost certainly reflects a national education device programme rather than a retail market.
Finland topping the Linux list is a nice coincidence. Linus Torvalds is Finnish.

What is the server operating system market share?
Radar can't answer this, because it measures the OS of the client making a request, not the OS of the machine answering it. So I used our own crawl instead.
TechnologyChecker detects an operating system on roughly 814,000 domains, out of 29.9 million live domains in the crawl. Here's how those break down:
| Server OS | Domains detected | Share of domains that disclose one |
|---|---|---|
| Ubuntu | 409,810 | 50.33% |
| UNIX | 209,466 | 25.73% |
| Debian | 130,134 | 15.98% |
| CentOS | 32,041 | 3.94% |
| AlmaLinux | 13,392 | 1.64% |
| Windows Server | 6,467 | 0.79% |
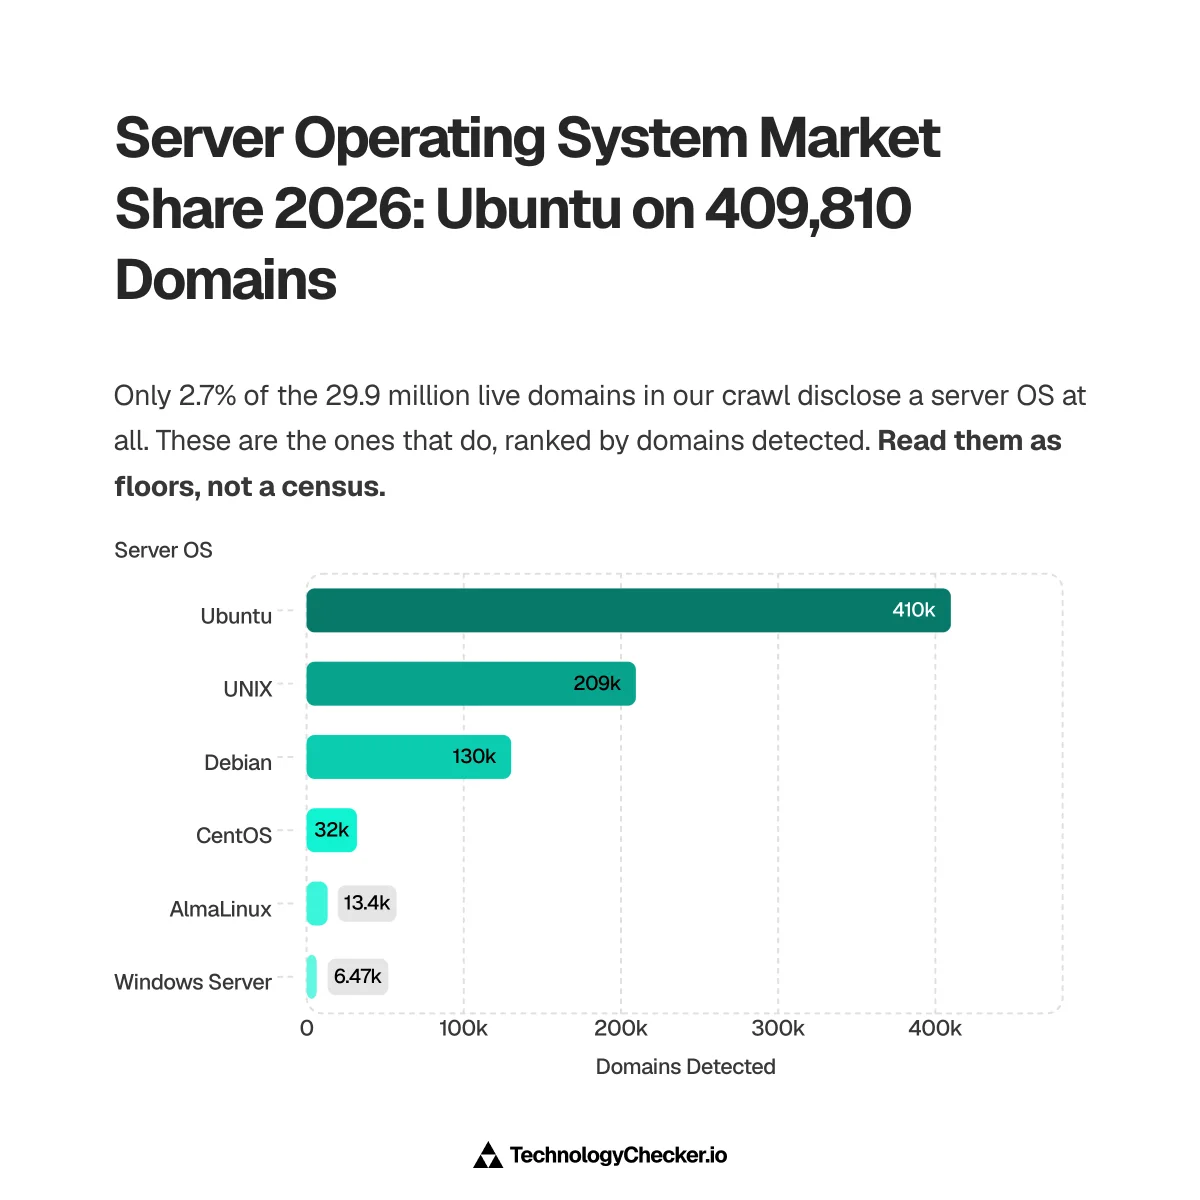
Read that denominator carefully, because it's the whole point. Only about 2.7% of live domains disclose a server operating system at all. Every one of these detections comes from an OS token the web server volunteers in its HTTP response headers, the Apache/2.4.62 (Ubuntu) pattern. Nginx doesn't emit one by default. Anything behind a CDN usually has it stripped. These are floors measured with the same ruler, not a census.
Which makes Windows Server at 0.79% the most misread number on this page. It does not mean 0.79% of the world's web servers run Windows. IIS advertises itself as Microsoft-IIS/10.0 with no OS token, so a Windows Server box that would happily tell you it's IIS never tells you it's Windows. Our category ranks who talks, not who exists. W3Techs' operating system survey uses a different inference method and lands somewhere else entirely, which is what you'd expect.
What the disclosure data is good for is churn and geography, because those are internally consistent. We track 31,709 domains that previously showed Ubuntu (8% the size of its live base), 11,607 for Debian (9%) and 3,667 for CentOS (11%). CentOS having the highest churn ratio of the three fits its situation: both of its last two releases are out of support, and the domains still announcing it are running something nobody is patching. If you sell infrastructure or security tooling, that list of 32,041 domains is a buying-intent signal, not a statistic.
Geography splits along predictable lines. Ubuntu's largest single market is the United States (49,791 domains). Debian's is Germany (17,850), and Germany plus France together account for more of Debian's located base than the US does. The full operating systems category has all sixteen.
Which countries and industries run which server OS?
The client-side country table above comes from Radar. This one doesn't — it's our own detection data, so it can go somewhere Radar can't: down to the industry vertical and the company size behind each domain.

Server OS by country
Nine countries appear in all three distributions, so these are directly comparable. Counts are domains that disclose the OS in a response header.
| Country | Ubuntu | Debian | CentOS | Debian's share of the three |
|---|---|---|---|---|
| United States | 49,791 | 9,308 | 3,270 | 14.9% |
| Germany | 14,985 | 17,850 | 698 | 53.2% |
| United Kingdom | 12,684 | 2,953 | 1,189 | 17.6% |
| Brazil | 11,790 | 2,360 | 675 | 15.9% |
| France | 7,348 | 11,843 | 416 | 60.4% |
| Canada | 6,880 | 2,243 | 577 | 23.1% |
| Italy | 6,560 | 3,023 | 803 | 29.1% |
| Spain | 5,582 | 2,494 | 684 | 28.5% |
| Netherlands | 4,903 | 1,904 | 382 | 26.5% |
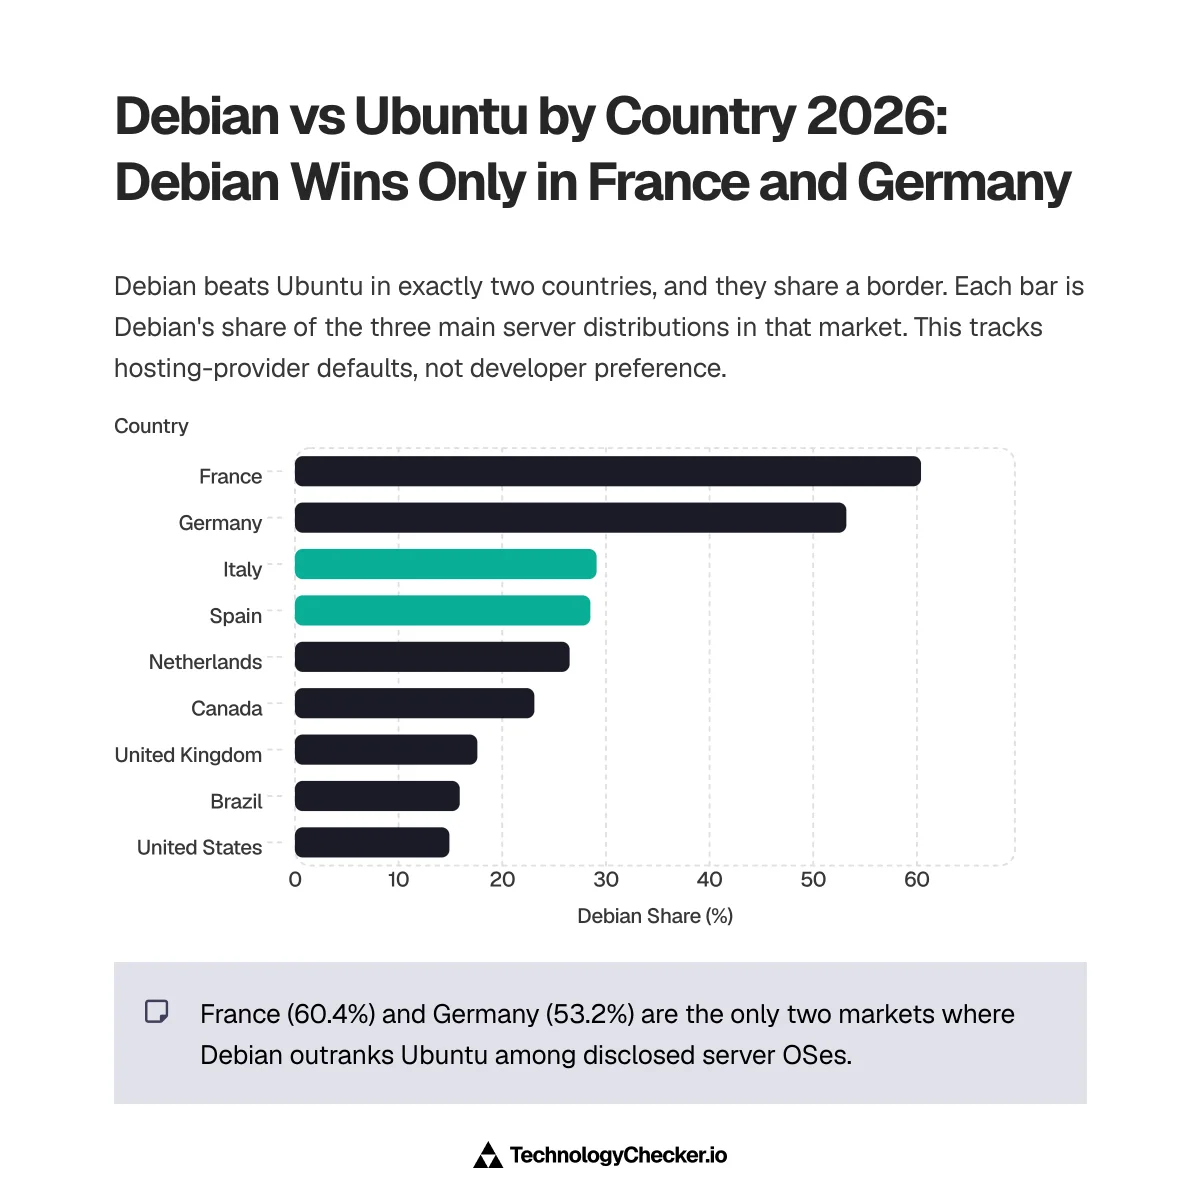
Debian beats Ubuntu in exactly two countries, and they share a border. France runs 60.4% Debian and Germany 53.2%, against 14.9% in the United States and 15.9% in Brazil. Everywhere else Ubuntu wins by three to seven times. This is the clearest regional split in the whole report, and it isn't about the software: it tracks which hosting providers dominate each market and what their default image is. OVH and Hetzner built their fleets on Debian; almost everyone else shipped Ubuntu. Infrastructure share is decided by a handful of providers at every layer — the hyperscaler version of the same concentration is in our cloud provider traffic share report.
India is the other outlier, in the opposite direction. It's Ubuntu's second-largest market anywhere at 21,746 domains, ahead of Germany, and Debian doesn't place India in its top fifteen at all.
Server OS by industry vertical
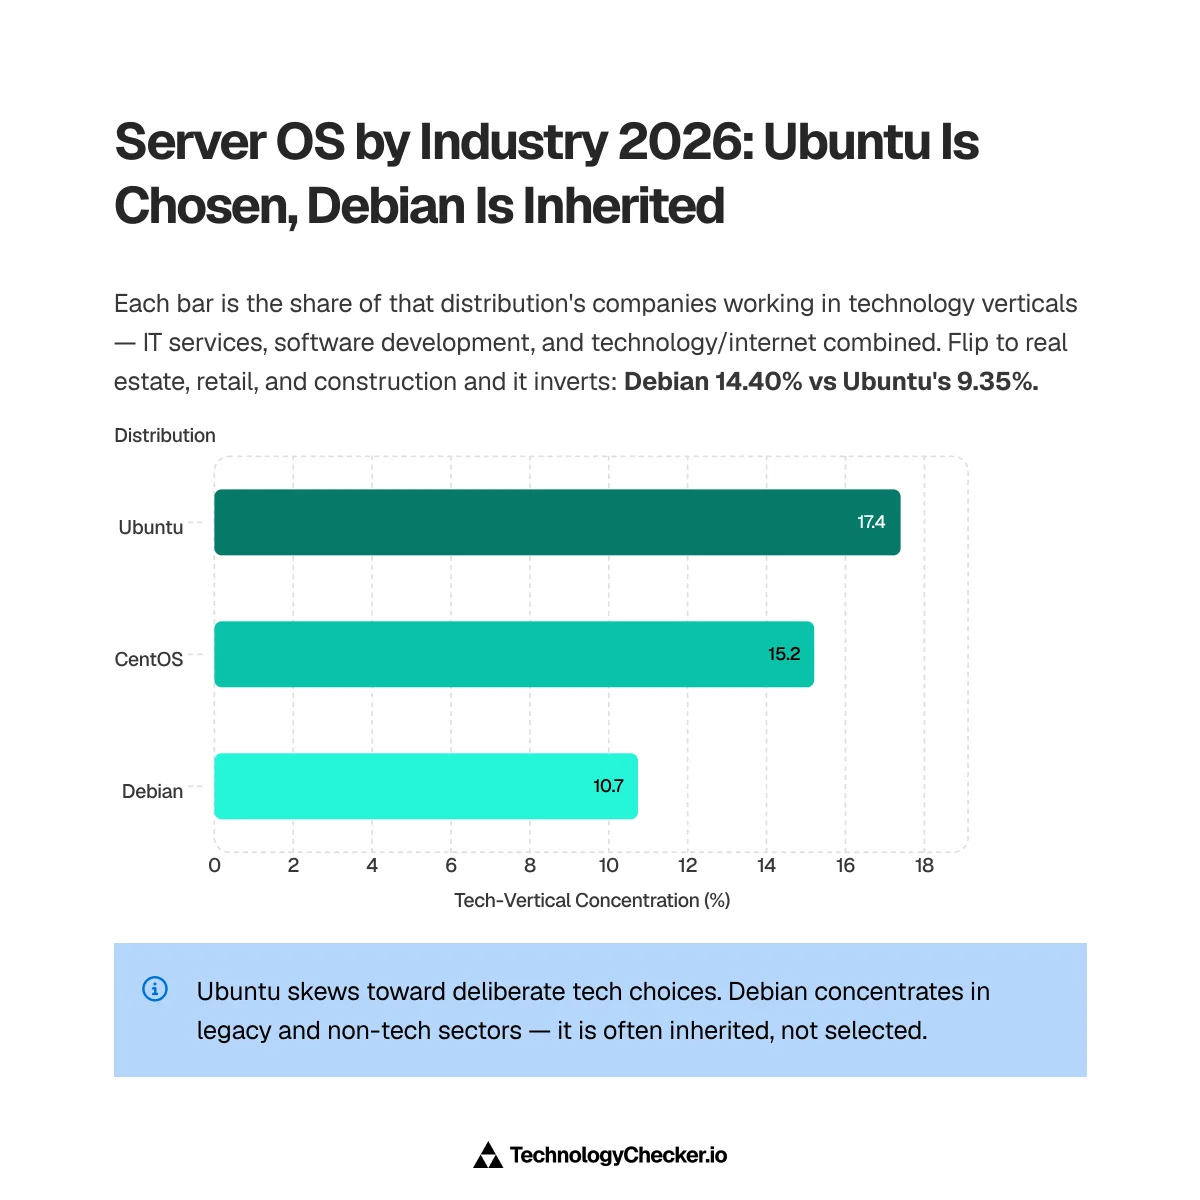
Percentages are of each technology's enriched company base — 227,955 companies for Ubuntu, 77,750 for Debian, 15,734 for CentOS. A dash means the vertical isn't in that technology's top ten, not that it's zero.
| Industry vertical | Ubuntu | Debian | CentOS |
|---|---|---|---|
| IT Services and IT Consulting | 7.33% | 4.93% | 7.91% |
| Software Development | 5.97% | 3.55% | 4.58% |
| Technology, Information and Internet | 4.10% | 2.26% | 2.72% |
| Real Estate | 3.76% | 5.96% | 2.83% |
| Retail | 3.29% | 4.45% | 3.20% |
| Construction | 2.30% | 3.99% | 3.28% |
| Business Consulting and Services | 2.35% | 3.85% | 2.14% |
| Advertising Services | 2.46% | 1.98% | 2.04% |
| Higher Education | — | — | 2.46% |
| Telecommunications | — | — | 2.40% |
Three readings, and they all point the same way.
Ubuntu and CentOS are chosen; Debian is inherited. Roll up the three technology verticals and Ubuntu takes 17.40% of its base, CentOS 15.21%, Debian 10.74%. Roll up real estate, retail and construction and it inverts: Debian 14.40% against Ubuntu's 9.35%. Real estate is Debian's single largest vertical. Estate agents do not pick a Linux distribution. Their web host does.
CentOS survives in the two slowest procurement environments on earth. Higher education (2.46%) and telecommunications (2.40%) appear in CentOS's top ten and in neither of the others'. Both run multi-year refresh cycles and change-control boards, which is exactly where an operating system whose last two releases are out of support keeps running anyway.
Company size says the same thing a third way.
| Employees | Ubuntu | Debian | CentOS |
|---|---|---|---|
| 1–10 | 57.19% | 65.25% | 53.42% |
| 11–50 | 25.31% | 21.30% | 23.78% |
| 51–200 | 10.25% | 7.89% | 11.89% |
| 201+ | 7.26% | 5.55% | 10.88% |
Debian is the most small-business-weighted of the three (65.25% under eleven people) and CentOS the most enterprise-weighted (10.88% above two hundred, nearly double Debian's). CentOS is the Red Hat lineage, and it kept the customer shape even after Red Hat discontinued it.
What should you do with OS share numbers?
Pick the cut that matches the decision, then stop looking at the global number. Four cases I run into constantly:

Deciding what to QA. Use desktop human share for your top three countries, never the global all-device figure. A US-only B2B product faces Windows 62.10% / macOS 27.21% / Linux 7.43% on desktop, and a browser mix to match (see the Chrome market share breakdown). Testing macOS as an afterthought at "9% global" when it's 27% of your actual desktop audience is how a checkout bug survives to production.
Sizing a mobile investment. Use mobile web share (Android 65.11% / iOS 34.89%), not smartphone sales share. The 15-point gap between those two framings has decided a lot of bad roadmap arguments.
Reading any "OS X has grown" headline. Check three things before you repeat it: does the source separate bots, does it have an unknown bucket, and did the neighbouring row fall by the same amount. The Linux story above failed all three tests.
Building a target list from infrastructure. Server OS disclosure is a floor, so treat a match as a strong positive and a non-match as no information at all. The 32,041 domains still announcing CentOS are real and reachable. The absence of a Windows Server token tells you nothing.
One broader read, and it's mine rather than the data's. The interesting change in operating system market share this year wasn't any operating system's share. Windows desktop moved 0.04 points in eight months. What moved was measurement: a growing unknown bucket in one dataset, a parser change that shuffled ChromeOS into Linux in every dataset, and a bot population large enough to add three points to a country's Linux figure on its own. If you track OS share as an input to real decisions, the instrument is now the thing worth watching.
Methodology
Client OS figures come from the Cloudflare Radar REST API, endpoints http/summary/os, http/top/locations/os/{os} and http/timeseries_groups/os, pulled 13 September 2026. The headline window is the 28 days from 16 August to 13 September 2026. Monthly rows use explicit dateStart/dateEnd calendar-month boundaries. Every figure labelled "human" carries botClass=LIKELY_HUMAN; desktop and mobile cuts use deviceType=DESKTOP and deviceType=MOBILE. Radar normalises this dataset as a percentage of requests, not of users, devices or sessions, and Cloudflare's confidence annotations were empty for this window.
Server OS figures come from TechnologyChecker's own crawl of 29.9 million live domains, analysed 29 August 2026 for Ubuntu and 7 September 2026 for Debian and CentOS. Detection is by operating-system token in HTTP response headers. Shares are of the ~814,000 domains that disclose an OS, not of all domains.
Third-party comparisons are quoted as published, on the dates given, and linked to source.
Known limits: Radar sees Cloudflare-proxied traffic, which is a large but not random slice of the web. Bot classification is a model and gets some calls wrong. Neither dataset can split Windows 11 from Windows 10, or iPadOS from iOS. HarmonyOS has no row and is most likely counted inside Android.
Source: Cloudflare Radar — radar/http/summary/os and related endpoints (radar.cloudflare.com), 16 August to 13 September 2026.
Operating system market share FAQ
Which operating system has the most market share?
Android, at 36.12% of human web traffic worldwide in September 2026. Windows is second on 32.86% and iOS third on 19.37%. On desktop only, Windows leads with 73.87%.
What are the big three operating systems?
Android, Windows and iOS. Together they carry 88.35% of human web traffic. Adding macOS takes it to 97.18%, which leaves every other operating system on earth sharing under 3%.
Who is bigger, Apple or Android?
Android, but not by as much as sales figures suggest. Combining iOS and macOS gives Apple 28.20% of human web traffic against Android's 36.12%. On mobile alone Android leads 65.11% to 34.89%. On smartphone sales the gap is far wider, around 75% to 20% in Q2 2026, because Apple users generate more web traffic per device.
What is the Linux desktop market share in 2026?
4.72% of desktop human web traffic worldwide, and 7.43% in the United States. Reports of Linux passing 10% in North America measured unfiltered traffic including bots, and coincided with ChromeOS traffic being reclassified as Linux. Both effects are quantified above.
What is the PC operating system market share?
Windows 73.87%, macOS 19.86%, Linux 4.72%, ChromeOS 1.53%, measured as desktop human web traffic in the 28 days to 13 September 2026. Sources that report Windows near 62% are usually carrying a large unlabelled "unknown" category alongside it.
Is Windows losing market share?
Not on desktop. Windows held between 74.15% and 74.64% of desktop human traffic every month from January to August 2026. Its share of all traffic across every device drifts down as mobile grows, which is a different claim and worth keeping separate.
What is the most used operating system in the world?
By web traffic, Android. By installed devices the answer depends on what counts as a device, and no dataset measures that directly. Every figure in this report is share of web requests, which is the thing that decides what your website has to support.
Which country has the highest Windows share?
Turkmenistan, at 99.21% of human web traffic, followed by Iran (86.69%) and Cambodia (59.73%). Among large economies, Russia is highest at 59.37%.
How often does this data change?
Cloudflare Radar updates continuously and the 28-day window rolls daily. Month-to-month movement in the top four operating systems is usually under half a point. We re-pull and re-date this report on a monthly cadence.
What changed in this report
First edition. Client-OS figures from Cloudflare Radar for the 28 days to 13 September 2026, with monthly rows back to January and mid-September snapshots for 2024 and 2025. Server-OS figures from our own crawl of 29.9M live domains.
- Added the desktop and mobile cuts (
deviceType=DESKTOP/MOBILE), which most OS-share reports don't separate - Decomposed the July 2026 "Linux desktop passed 10%" story into bots, reclassification and real growth
- Added server OS by country, by industry vertical and by company size, none of which Radar can measure
Related research

Data Analyst
5+ years of experience
Emma is a Data Analyst at TechnologyChecker, where she analyses technology adoption data to build better prospect lists and uncover actionable patterns for sales teams.
- BSc Data Science, Cardiff University
- Google Data Analytics Professional Certificate
- Tableau Desktop Certified Associate
Never miss our research