Browser Market Share 2026: Chrome 68.3%, Safari 18.9%
Chrome took 68.3% of human web traffic in October 2026, Safari 18.9%, Edge 6.6% (Cloudflare Radar). See the split by OS, device and country.
Published •Data through October 2026•31 min read

Browser market share in October 2026: Chrome took 68.31% of human web requests worldwide, Safari 18.93% and Edge 6.59%, in our analysis of Cloudflare Radar, with bots removed. One exception shapes the count: requests that present Chrome's user agent are counted as Chrome, so Brave and Yandex Browser may sit partly inside its figure.
Source: TechnologyChecker analysis of Cloudflare Radar, http/summary/browser_family, botClass=LIKELY_HUMAN, worldwide, October 2026, pulled 2026-11-11.
These are shares of requests, not of people or page views, which is why other trackers print different numbers for the same month. StatCounter's October 2026 figure, Chrome 68.79%, counts page views on sites running its tracker, and W3Counter's 76.85% counts its own sample of 12,122,296 browser observations.
What is the browser market share in 2026?
Chrome holds 68.31% of human web requests worldwide in October 2026, ahead of Safari at 18.93%, Edge at 6.59%, Firefox at 3.60%, Samsung Internet at 1.24% and Opera at 1.16%. The scope is every request Cloudflare's network served that month that its bot classification marked as human, from any device and any country, with the browser read from the User-Agent and Client Hints.
Browser market share is the percentage of web traffic that comes from each browser; on this page the unit is the HTTP request. The table ranks the six browser families Radar names, plus all others, by share of human requests.
| Browser | Share of human requests, October 2026 |
|---|---|
| Chrome | 68.31% |
| Safari | 18.93% |
| Edge | 6.59% |
| Firefox | 3.60% |
| Samsung Internet | 1.24% |
| Opera | 1.16% |
| All other browsers | 0.17% |
Source: TechnologyChecker analysis of Cloudflare Radar, http/summary/browser_family, botClass=LIKELY_HUMAN, worldwide, 1 to 31 October 2026 (UTC), pulled 2026-11-11.
Browser Market Share, October 2026: Chrome 68.31% of Human Requests
Chrome took 68.31% of human web requests worldwide in October 2026, Safari 18.93% and Edge 6.59%, followed by Firefox at 3.60%, Samsung Internet at 1.24% and Opera at 1.16%. All other browsers together took 0.17%.
Source: Cloudflare Radar · Oct 2026
| Browser | Share of human requests (%) |
|---|---|
| Chrome | 68.31% |
| Safari | 18.93% |
| Edge | 6.59% |
| Firefox | 3.6% |
| Samsung Internet | 1.24% |
| Opera | 1.16% |
- Chrome took 68.31% of human web requests in October 2026
- Safari, at 18.93%, is the only other browser above 7%
- All browsers outside these six took 0.17% together
http/summary/browser_family, botClass=LIKELY_HUMAN, 1 to 31 October 2026, pulled 11 November 2026.Six browser families carry all but 0.17% of human requests, with UC Browser accounting for 0.16% of all human requests. As a data analyst who works with technology-adoption data, I read the order before the decimals: build in Chrome, test Safari second, then weight Edge and Firefox by your audience's device mix. Our Chrome market share report follows Chrome's line back to mid-2025.
Key findings
Eight findings stand out in our analysis of Cloudflare Radar for October 2026, led by Chrome's 68.31% share of human requests, flat on a year earlier. Each uses human requests unless it says all traffic.
- Chrome is flat year on year: 68.31% of human requests in October 2026 against 68.35% in October 2025, a change of 0.03 points on the unrounded figures.
- Safari gained 0.77 points in a year, from 18.16% to 18.93%, and rose 0.90 points between September and October 2026, its largest monthly rise of the year (both months provisional).
- Samsung Internet fell from 1.94% in January 2026 to 1.24% in October, with its two steepest monthly drops in September (0.20 points) and October (0.22 points).
- Bots inflate Chrome and deflate Safari: counting all traffic gives Chrome 71.34% and Safari 15.68%, against 68.31% and 18.93% for human requests alone.
- Mobile and desktop share a leader but not a runner-up: Chrome takes 67.97% of mobile and 68.79% of desktop requests, while Safari takes 28.47% of mobile and Edge 14.65% of desktop.
- Browser rankings differ by operating system: Safari takes 74.88% of iOS requests, Edge 19.82% of Windows requests and Firefox 16.45% of Linux requests.
- Safari's share runs from 4.38% in India to 31.39% in the United Kingdom among the 13 countries we cut, and Chrome leads in all 13.
- Edge falls from 7.15% on weekdays to 4.73% at weekends, while Safari rises from 18.36% to 20.77%, as the mean of daily shares.
Source: TechnologyChecker analysis of Cloudflare Radar, http/summary/browser_family (finding 8: http/timeseries_groups/browser_family, aggInterval=1d), botClass=LIKELY_HUMAN except finding 4's all-traffic figures, October 2025 and January to October 2026, pulled 2026-11-11.
Browser market share month by month in 2026
Chrome's share of human requests stayed between 68.03% and 68.85% in every month from January to October 2026, while Safari rose to 18.93% in October and Samsung Internet fell to 1.24%. Each row below is a separate calendar-month query on human requests, with October 2025 as the same month a year earlier.
The table compares each browser's monthly share of human requests from October 2025 to October 2026.
| Month | Chrome | Safari | Edge | Firefox | Samsung Internet | Opera |
|---|---|---|---|---|---|---|
| October 2025 | 68.35% | 18.16% | 6.19% | 3.85% | 1.90% | 1.39% |
| January 2026 | 68.54% | 18.29% | 5.98% | 3.70% | 1.94% | 1.37% |
| February 2026 | 68.32% | 18.03% | 6.44% | 3.74% | 1.88% | 1.36% |
| March 2026 | 68.50% | 17.73% | 6.56% | 3.79% | 1.84% | 1.36% |
| April 2026 | 68.51% | 17.72% | 6.67% | 3.72% | 1.79% | 1.35% |
| May 2026 | 68.03% | 17.75% | 6.74% | 4.07% | 1.80% | 1.37% |
| June 2026 | 68.49% | 17.95% | 6.58% | 3.68% | 1.76% | 1.34% |
| July 2026 | 68.85% | 17.59% | 6.69% | 3.64% | 1.76% | 1.27% |
| August 2026 | 68.35% | 17.53% | 7.37% | 3.67% | 1.66% | 1.22% |
| September 2026 (provisional) | 68.58% | 18.03% | 6.91% | 3.64% | 1.46% | 1.20% |
| October 2026 (provisional) | 68.31% | 18.93% | 6.59% | 3.60% | 1.24% | 1.16% |
| Change, October 2025 to October 2026 | −0.03 pt | +0.77 pt | +0.40 pt | −0.25 pt | −0.66 pt | −0.24 pt |
Source: TechnologyChecker analysis of Cloudflare Radar, http/summary/browser_family, botClass=LIKELY_HUMAN, one call per calendar month (UTC), January to October 2026 and October 2025, plus Q3 2026 (1 July to 30 September) for the quarter figures below, pulled 2026-11-11. Other browsers took 0.16% to 0.24% each month. Changes use unrounded shares, so one can differ by 0.01 from the rounded figures.
Chrome is flat. Chrome read 68.35% of human requests in October 2025 and 68.31% in October 2026, a change of 0.03 points on the unrounded figures, and inside 2026 it ranged from 68.03% in May to 68.85% in July. The data shows no slide.
Safari's October rise is provisional. Safari climbed 0.90 points from September to October 2026, to 18.93%, its largest monthly rise of the year, and stands 0.77 points above October 2025. I'd confirm the October level before calling it a trend, because Safari rose 0.20 points in June and gave back 0.36 in July. Our Safari market share analysis follows its device and country split.
Safari Market Share by Month, 2026: 18.29% in January, 18.93% in October
Safari's share of human web requests moved between 17.53% (August) and 18.93% (October) in 2026. It rose 0.90 points from September to October 2026, its largest monthly rise of the year; both months are provisional.
Source: Cloudflare Radar · Jan 2026 – Oct 2026
| Month | Safari share of human requests (%) |
|---|---|
| Jan 2026 | 18.29% |
| Feb 2026 | 18.03% |
| Mar 2026 | 17.73% |
| Apr 2026 | 17.72% |
| May 2026 | 17.75% |
| Jun 2026 | 17.95% |
| Jul 2026 | 17.59% |
| Aug 2026 | 17.53% |
| Sep 2026 | 18.03% |
| Oct 2026 | 18.93% |
- Safari's 2026 low was 17.53% in August
- October 2026 reached 18.93%, up 0.90 points on September (provisional)
- Safari stands 0.77 points above October 2025 (18.16%)
http/summary/browser_family, botClass=LIKELY_HUMAN, one call per calendar month, pulled 11 November 2026.Samsung Internet is shrinking. Samsung Internet fell from 1.94% in January 2026 to 1.24% in October, losing 0.20 points in September and 0.22 in October, and sits 0.66 points below October 2025; the data records the fall, not its cause. Opera drifted from 1.37% to 1.16% over the same months.
August's Edge peak may be a relabel. Edge reached 7.37% in August 2026 as Chrome fell 0.50 points, while every other browser moved 0.10 points or less. When two Chromium browsers move almost equally and oppositely and the rest stay put, the shares alone can't tell a change in how requests were classified from people switching. Edge gave back 0.46 points in September and 0.32 in October.
Across Q3 2026, Chrome took 68.60% of human requests, Safari 17.78% and Edge 6.93%, a quarter to compare with other quarters, not with months. Month to month, compare a month with the one before or the same month a year earlier, and give a month 8 weeks before calling a move of under a point a trend.
Mobile vs desktop browser market share
Chrome leads both platforms in October 2026, with 67.97% of human mobile requests and 68.79% of desktop requests, but its runner-up changes: Safari takes 28.47% on mobile and Edge 14.65% on desktop. This cut filters the same October 2026 query by Cloudflare's device type, so each column sums across browsers within mobile or desktop requests alone.
The table compares each browser's share of human requests on desktop and on mobile.
| Browser | Desktop | Mobile |
|---|---|---|
| Chrome | 68.79% | 67.97% |
| Safari | 7.28% | 28.47% |
| Edge | 14.65% | 0.00% |
| Firefox | 7.22% | 0.65% |
| Samsung Internet | 0.09% | 2.11% |
| Opera | 1.96% | 0.50% |
| All other browsers | 0.01% | 0.30% |
Source: TechnologyChecker analysis of Cloudflare Radar, http/summary/browser_family, botClass=LIKELY_HUMAN, deviceType=DESKTOP and MOBILE, October 2026, pulled 2026-11-11.
Desktop is a four-browser market. On desktop, Edge takes 14.65% of human requests, Safari 7.28% and Firefox 7.22%. On mobile only Safari holds a real slice: Samsung Internet's 2.11% is next, and Edge registers 0.00% of mobile requests in this cut. Edge's 6.59% worldwide share is, in this data, a desktop share.
StatCounter sees the same shape. StatCounter's desktop figures for October 2026 give Chrome 66.98%, Edge 13.24%, Safari 7.83% and Firefox 5.72% of desktop page views, and its mobile figures give Chrome 70.37%, Safari 21.91%, Samsung Internet 3.16% and Opera 1.88%. Its tablet page views give Chrome 54.77% and Safari 28.51%; our cut has no tablet row. The sources count different things, so I compare rankings: the desktop top four and the mobile top three agree, while lower mobile places differ.
Who should weight Edge and Firefox higher. If your audience works at a desk, test Edge and Firefox as first-class targets; on phones, Safari is the second browser that matters. Our Google vs Microsoft market share comparison puts Chrome against Edge, and our UK mobile vs desktop usage study shows one country's device split without bots.
Which browser leads on each operating system?
Chrome leads on five of the six operating systems in October 2026, from 58.42% of human requests on macOS to 99.96% on ChromeOS, and Safari leads only on iOS, with 74.88%. This cut filters the October 2026 query by Cloudflare's operating-system value, so each row shows how the browsers split the human requests from one operating system.
The table compares each browser's share of human requests within each operating system.
| Operating system | Chrome | Safari | Edge | Firefox | Samsung Internet | Opera |
|---|---|---|---|---|---|---|
| Windows | 70.22% | 0.00% | 19.82% | 7.42% | 0.00% | 2.53% |
| macOS | 58.42% | 35.33% | 0.82% | 4.95% | 0.00% | 0.47% |
| Android | 94.52% | 0.00% | 0.00% | 0.78% | 3.40% | 0.80% |
| iOS | 24.69% | 74.88% | 0.00% | 0.42% | 0.00% | 0.00% |
| Linux | 80.39% | 0.08% | 0.87% | 16.45% | 1.78% | 0.43% |
| ChromeOS | 99.96% | 0.00% | 0.03% | 0.00% | 0.00% | 0.00% |
Source: TechnologyChecker analysis of Cloudflare Radar, http/summary/browser_family, botClass=LIKELY_HUMAN, os=WINDOWS, MACOSX, ANDROID, IOS, LINUX and CHROMEOS, October 2026, pulled 2026-11-11. Other browsers take 0.48% or less on each operating system.
Windows and macOS. On Windows, Edge takes 19.82% of human requests against Chrome's 70.22%, with Firefox at 7.42% and Opera at 2.53%. On macOS, Chrome leads Safari 58.42% to 35.33%, so Apple's browser is second on Apple's own desktop.
iOS and Android. On iOS, Safari takes 74.88% of human requests and Chrome 24.69%; on Android, Chrome takes 94.52% and Samsung Internet 3.40%. Each phone platform has one browser above 74%, and that shapes the mobile column in the section above.
Linux and ChromeOS. Among the six operating systems we pulled, Firefox's highest share is on Linux, 16.45% of human requests against Chrome's 80.39%, and ChromeOS is Chrome's alone at 99.96%. Samsung Internet's 1.78% on Linux is the one figure the cut can't explain, since it doesn't say which devices send those requests. Our Linux market share report covers who runs Linux in the first place.
Cloudflare's 2025 figures. Cloudflare's own 2025 Year in Review gave Safari 79% and Chrome 19% on iOS, Chrome 85% and Samsung Internet 6.6% on Android, and Chrome 69% and Edge 19% on Windows, for 1 January to 2 December 2025 and with a finer grouping that names Huawei Browser at 1% on Android. The window and grouping both differ from ours, so I don't read the gap as a change.
Test the default of each operating system. Follow the operating systems your audience uses: Safari for iOS and macOS, Edge for Windows, Chrome everywhere, and Firefox for a Linux audience. Our operating system market share report gives each system's share of human requests.
Browser market share by country
Chrome leads in all 13 countries we cut for October 2026, from 52.00% of human requests in the United Kingdom to 89.22% in India, and Safari is second in every one of them. Each row is the October 2026 query filtered by Cloudflare's location, the country a request comes from; Russia and China were pulled but left out, for reasons the methodology gives.
The table compares the three leading browsers by share of human requests in each country, sorted by Chrome's share.
| Country | Chrome | Safari | Third browser |
|---|---|---|---|
| India | 89.22% | 4.38% | Edge 3.19% |
| Indonesia | 86.52% | 6.55% | Edge 2.79% |
| Brazil | 79.19% | 12.12% | Edge 4.03% |
| Mexico | 75.24% | 15.05% | Edge 6.09% |
| Turkey | 73.40% | 17.68% | Edge 3.22% |
| Nigeria | 71.50% | 21.12% | Edge 2.88% |
| Vietnam | 69.11% | 24.75% | Edge 3.42% |
| South Korea | 68.87% | 12.08% | Edge 10.69% |
| France | 60.18% | 20.27% | Firefox 8.33% |
| United States | 56.97% | 29.24% | Edge 8.19% |
| Japan | 56.46% | 28.25% | Edge 11.73% |
| Germany | 52.25% | 22.74% | Firefox 11.70% |
| United Kingdom | 52.00% | 31.39% | Edge 10.05% |
Source: TechnologyChecker analysis of Cloudflare Radar, http/summary/browser_family, botClass=LIKELY_HUMAN, location=IN, ID, BR, MX, TR, NG, VN, KR, FR, US, JP, DE and GB, October 2026, pulled 2026-11-11.
Where Safari matters most. Safari ranges from 4.38% of human requests in India to 31.39% in the United Kingdom, and sits between 28.25% and 31.39% in Japan, the United States and the United Kingdom, where a Safari bug reaches more than a quarter of human requests. In India, Indonesia and Brazil, Chrome alone carries 79.19% to 89.22%, so set each market's test budget from its own row. Our analysis of mobile internet usage by country shows the device mix behind these splits.
Where Firefox and Edge break through. Germany and France are the only two of the 13 where Firefox is third, at 11.70% and 8.33%. Edge reaches 11.73% in Japan, 10.69% in South Korea and 10.05% in the United Kingdom. Safari reaches 21.12% in Nigeria and 24.75% in Vietnam, far above its share in India or Indonesia.
StatCounter's US figure. StatCounter's United States figures for October 2026 give Chrome 56%, Safari 28.03%, Edge 7.11% and Firefox 3.64% of US page views. Our US row is a different measure, human requests, and the two rank the top three the same way.
How much do bots change browser market share?
Counting bots adds 3.03 points to Chrome and takes 3.24 points from Safari: in October 2026 Chrome had 71.34% of all requests against 68.31% of human requests, and Safari 15.68% against 18.93%. The page's all-traffic figures come from the same October 2026 query, run once with Cloudflare's human filter and once without it.
A human request is an HTTP request that Cloudflare's bot classification marks as likely human (LIKELY_HUMAN), and every Radar figure on this page uses only those unless it is labelled all traffic. The table compares each browser's share of human requests with its share of all requests.
| Browser | Human requests | All requests | Difference |
|---|---|---|---|
| Chrome | 68.31% | 71.34% | +3.03 pt |
| Safari | 18.93% | 15.68% | −3.24 pt |
| Edge | 6.59% | 6.41% | −0.19 pt |
| Firefox | 3.60% | 3.72% | +0.12 pt |
| Samsung Internet | 1.24% | 1.56% | +0.32 pt |
| Opera | 1.16% | 1.11% | −0.05 pt |
Source: TechnologyChecker analysis of Cloudflare Radar, http/summary/browser_family, with botClass=LIKELY_HUMAN (human) and without a botClass filter (all), October 2026, pulled 2026-11-11. Differences use unrounded shares.
Counting Bots Adds 3.03 Points to Chrome and Takes 3.24 From Safari
In October 2026 Chrome had 71.34% of all requests on Cloudflare's network against 68.31% of human requests, and Safari 15.68% against 18.93%. Counting bots raises Chrome, Samsung Internet and Firefox and lowers Safari, Edge and Opera.
Source: Cloudflare Radar · Oct 2026
| Browser | All requests minus human requests (points) |
|---|---|
| Chrome | 3.03 pts |
| Safari | -3.24 pts |
| Edge | -0.19 pts |
| Firefox | 0.12 pts |
| Samsung Internet | 0.32 pts |
| Opera | -0.05 pts |
- Chrome: 68.31% of human requests, 71.34% of all requests
- Safari: 18.93% of human requests, 15.68% of all requests
- Every other browser moves by 0.32 points or less
http/summary/browser_family, with and without botClass=LIKELY_HUMAN, pulled 11 November 2026.What the gap means. Adding bots raises Chrome's share and lowers Safari's, so the automated clients in Cloudflare's traffic present as Chrome more often than people do, and as Safari less often. In our paired October 2026 queries, including them raised Chrome by 3.03 points and lowered Safari by 3.24 points.
Why this matters for comparisons. Part of a gap between an all-traffic figure and this page can be the population rather than a disagreement. Our bot traffic statistics show how much traffic is automated; check whether each side counts bots before comparing a browser figure with your own analytics.
Do people switch browsers at the weekend?
The browser mix shifts at the weekend: in October 2026 Edge fell from 7.15% of human requests on weekdays to 4.73% at weekends, and Safari rose from 18.36% to 20.77%. The window is October 2026's 31 daily readings, split into 22 weekdays and 9 weekend days, with each day's share weighted equally in the mean.
The table compares each browser's mean daily share of human requests on weekdays and at weekends.
| Browser | Weekdays (22 days) | Weekends (9 days) |
|---|---|---|
| Chrome | 68.43% | 67.99% |
| Safari | 18.36% | 20.77% |
| Edge | 7.15% | 4.73% |
| Firefox | 3.61% | 3.58% |
| Samsung Internet | 1.18% | 1.44% |
| Opera | 1.11% | 1.30% |
| All other browsers | 0.16% | 0.19% |
Source: TechnologyChecker analysis of Cloudflare Radar, http/timeseries_groups/browser_family, aggInterval=1d, botClass=LIKELY_HUMAN, 1 to 31 October 2026, daily shares averaged over weekdays and over weekend days, pulled 2026-11-11.
Chrome barely moves. Chrome reads 68.43% on weekdays and 67.99% at weekends, and Firefox 3.61% and 3.58%, while Samsung Internet and Opera rise at weekends. The data shows the browser mix changing with the day of the week; it can't show whether anyone changed browser.
Why the calendar matters. A window with more weekdays shows more Edge and less Safari, and a window heavy on weekends does the reverse. The mean of October's daily shares gives Safari 19.06% while the month's summary gives 18.93%: the daily mean counts every day equally, while the summary aggregates the whole month's requests. When you compare two weeks or two partial months, match their weekend days, or the comparison mostly measures the calendar.
Why doesn't this match StatCounter?
StatCounter gives Chrome 68.79% for October 2026 against our 68.31% because it counts page views on sites running its tracker, while we count human requests on Cloudflare's network; W3Counter's 76.85% comes from its own sample of browser observations. Each source answers a slightly different question, so a gap between them is expected.
The table compares what each source reports for the leading browsers and what each one counts.
| Source | Chrome | Safari | Edge | Firefox | What it counts | Window |
|---|---|---|---|---|---|---|
| TechnologyChecker analysis of Cloudflare Radar | 68.31% | 18.93% | 6.59% | 3.60% | Human HTTP requests on Cloudflare's network, bots removed | October 2026 |
| StatCounter | 68.79% | 16.59% | 5.36% | 2.57% | Page views on sites running its tracker, "based on over 3 billion monthly page views" | October 2026 |
| W3Counter | 76.85% | 7.93% | 2.96% (listed as IE & Edge) | 1.60% | Its own sample of "12,122,296 recorded browser observations" | October 2026 |
| Cloudflare, 2025 Year in Review | "two-thirds" | 15.4% | 7.4% | 3.7% | "request traffic to Cloudflare" | 1 January–2 December 2025 |
Sources: StatCounter, W3Counter and Cloudflare pages linked above, each read on 11 November 2026; our row as in the first table on this page.
Page views versus requests. A page view counts once per page load, while a request is every file a browser fetches, so a browser whose visits make more requests weighs more in our figure. StatCounter samples sites running its tracker, the way most web analytics tools count visits, and we sample sites on Cloudflare's network; neither is the whole web.
Bots and grouping. Our figure removes bots by Cloudflare's classification, while Cloudflare's 2025 review describes "request traffic" without saying whether bots were removed, and it uses a finer browser grouping that names Huawei Browser on Android and gives Yandex Browser a share our family cut folds into Chrome. martech.zone's browser share page, which embeds Radar's live chart, showed Chrome at 64.09% for the latest hour when we read it on 11 November 2026, because that chart counts people and automated clients together and lists Chromium as its own family.
W3Counter's sample moves. W3Counter's own September 2026 reading was 83.82%, so its sample can swing several points in a month. A gap between two trackers does not mean one is wrong, because each counts a different population over a different window, so I never compute a change from one source's figure to another's.
Which browsers should a SaaS team support and test in 2026?
A SaaS team should support all six browser families and test them in three tiers: Chrome and Safari on every release, Edge and Firefox wherever desktop users matter, and Samsung Internet and Opera through error tracking. Chrome took 68.31% and Safari 18.93% of human requests in October 2026, and the lower tiers follow where each browser carries requests rather than its worldwide rank: Edge's 6.59% worldwide share becomes 19.82% on Windows.
The table places each browser family in a tier, with the October 2026 figure that puts it there.
| Tier | Browser | Where it matters | The figure that puts it there |
|---|---|---|---|
| Tier 1 | Chrome | Every device, operating system and country | 68.31% of human requests worldwide, first in all 13 countries we cut |
| Tier 1 | Safari | iOS and macOS | 74.88% of iOS and 35.33% of macOS human requests |
| Tier 2 | Edge | Windows and desktop | 19.82% of Windows and 14.65% of desktop human requests |
| Tier 2 | Firefox | Linux and desktop | 16.45% of Linux and 7.22% of desktop human requests |
| Tier 3 | Samsung Internet | Android phones | 3.40% of Android and 2.11% of mobile human requests |
| Tier 3 | Opera | Windows desktops | 2.53% of Windows and 1.96% of desktop human requests |
Source: TechnologyChecker analysis of Cloudflare Radar, http/summary/browser_family, botClass=LIKELY_HUMAN, worldwide and by deviceType, os and location, October 2026, pulled 2026-11-11. The tiers are my reading of these figures.
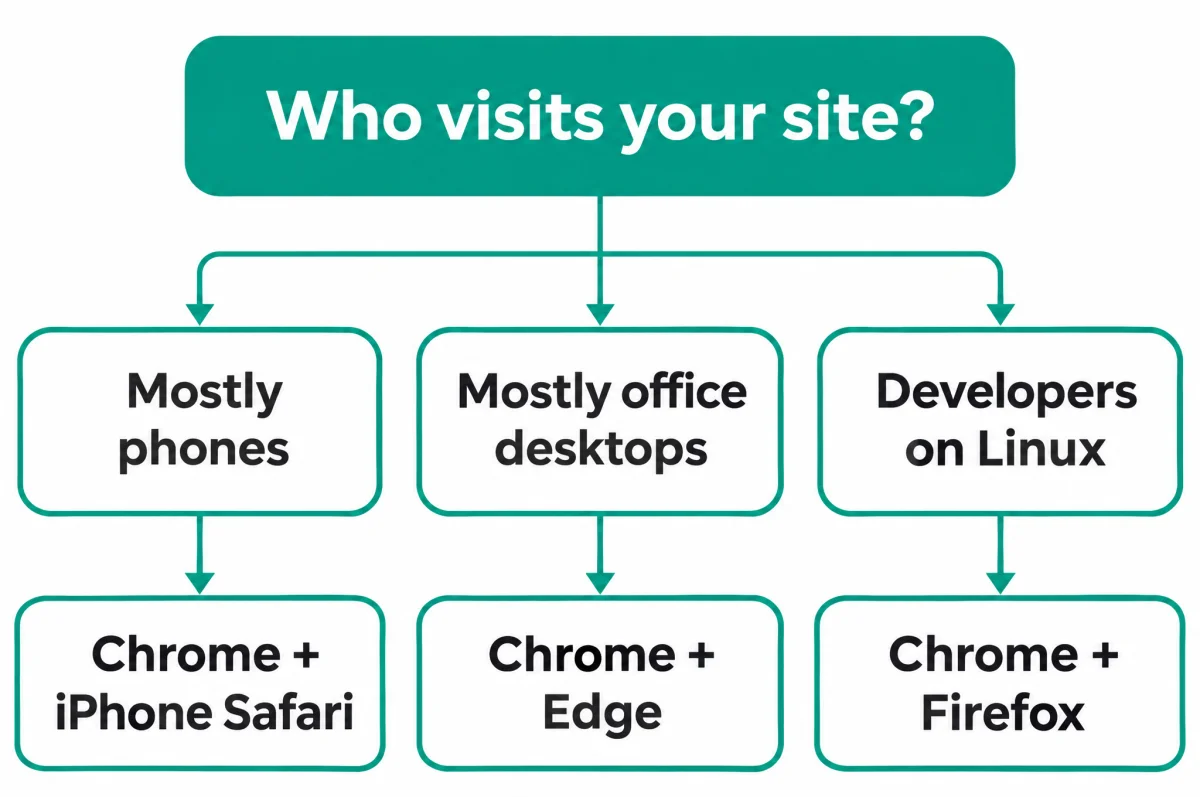
The diagram reduces the table to one question, who visits your site. Mostly phones points to Chrome + iPhone Safari, because Safari takes 74.88% of iOS human requests; mostly office desktops points to Chrome + Edge, with Edge at 19.82% on Windows; and developers on Linux points to Chrome + Firefox, with Firefox at 16.45% on Linux.
What I'd do with this. If I ran a web or GTM team, I'd weight the browser test plan by the audience's operating-system and country mix, read from the country table above, before the worldwide ranking. A team selling into the United Kingdom, the United States or Japan, where Safari takes between 28.25% and 31.39% of human requests, would give Safari as much test time as Chrome. A team selling into Germany or France would test Firefox on every release, since it is third there at 11.70% and 8.33%, while one selling into India, where Chrome takes 89.22%, could spend most of its test time on Chrome. I'd leave Samsung Internet and Opera to error tracking tools unless the site's own analytics show them above their worldwide shares.
From a prospect-intelligence view, these tiers answer how your own site should be tested, not which accounts to target. For that, our technographic data API shows which technologies a prospect's website runs, so a GTM team can check that its target accounts use a stack its product works with.
Methodology
Every Radar figure on this page comes from Cloudflare Radar's HTTP dataset, pulled on 11 November 2026 for windows from October 2025 to October 2026, using the calls below. Each response is stored with its request, so every figure reproduces from its call.
- Headline:
http/summary/browser_familywith dateStart=2026-10-01T00:00:00Z, dateEnd=2026-11-01T00:00:00Z, botClass=LIKELY_HUMAN and limitPerGroup=20. - Second way:
http/timeseries_groups/browser_familyover the same window and filters with aggInterval=1d, the bucket at the window's end dropped; our script took the mean, the median and the weekday and weekend means of the 31 daily shares. - All traffic: the headline call without botClass.
- Device: the headline call with deviceType=DESKTOP, then deviceType=MOBILE.
- Operating system: the headline call with os=WINDOWS, MACOSX, ANDROID, IOS, LINUX and CHROMEOS.
- Countries: the headline call with location=US, IN, BR, ID, JP, DE, GB, FR, RU, KR, MX, NG, TR, VN and CN.
- Months: the headline call for each calendar month from January to October 2026, for October 2025, and for Q3 2026 (1 July to 30 September 2026).
Filters and windows. On 11 November 2026 we ran each filter (botClass, deviceType, os and location) with a nonsense value over the same window, and Radar rejected every one, so each filter applies. Windows are calendar months in UTC; October 2026 is provisional until 26 December 2026 and September 2026 until 25 November 2026.
Population choice. I chose human requests for the headline because they sit closest to the people loading your pages. The table gives October 2026 both ways, with the daily median.
| Browser | Month summary | Mean of 31 daily shares | Median of daily shares |
|---|---|---|---|
| Chrome | 68.31% | 68.30% | 68.31% |
| Safari | 18.93% | 19.06% | 18.49% |
| Edge | 6.59% | 6.45% | 7.07% |
| Firefox | 3.60% | 3.60% | 3.61% |
| Samsung Internet | 1.24% | 1.26% | 1.20% |
| Opera | 1.16% | 1.17% | 1.12% |
| All other browsers | 0.17% | 0.17% | 0.16% |
Source: TechnologyChecker analysis of Cloudflare Radar, http/summary/browser_family (summary) and http/timeseries_groups/browser_family, aggInterval=1d (daily), botClass=LIKELY_HUMAN, 1 to 31 October 2026, pulled 2026-11-11.
What it counts. Radar identifies the browser of each HTTP request through Cloudflare's network from its User-Agent and Client Hints, and removes bots by Cloudflare's classification. Requests are not people or page views, and differences use unrounded shares.
What it can't see. Five blind spots limit what this page can claim.
- Sites off Cloudflare. Requests to sites that don't use Cloudflare's network are not in the sample; our Cloudflare technology profile shows which business websites run on it.
- Borrowed user agents. A browser family is Radar's grouping of browsers by the name their user agent presents, so requests that present as Chrome may be counted inside Chrome. Brave reads 0.0006% of human requests in October 2026 and Yandex Browser 0.004%, and the data can't show how many of their requests, or those of AI browsers, sit in Chrome's figure.
- Russia and China. In Russia, Radar's family cut gives Chrome 81.95% and Yandex Browser 0.20% of human requests, while Cloudflare's 2025 review gave Chrome 44% and Yandex Browser 33% for a different window and grouping. The two can't be compared directly, and the gap is too wide to publish a Russia row we can't reconcile, so we leave it out. China (Chrome 51.38%) is left out for the same caution: we had no published figure to check it against.
- The long tail. The six named browsers leave 0.17% of human requests; UC Browser takes 0.16%, and Yandex Browser, Brave and Cốc Cốc share the rest. No browser was left out of any response.
- People. A request share is not a count of users, devices or installs.
Source for the figures in this list: TechnologyChecker analysis of Cloudflare Radar, http/summary/browser_family, botClass=LIKELY_HUMAN, worldwide and location=RU and CN, October 2026, pulled 2026-11-11; Cloudflare's figures from its 2025 Year in Review, linked above.
Relabel check. We checked each month-to-month move for an equal and opposite shift between two browsers with the rest unchanged. August 2026 (Chrome −0.50 points, Edge +0.68 points, every other browser within 0.10 points) fits that pattern, so we treat it as a possible change in classification, not as established switching. TechnologyChecker's own detection data records which technologies websites run, not which browsers their visitors use, so no first-party figure appears here.
How to cite this page: "Browser market share, October 2026: TechnologyChecker analysis of Cloudflare Radar HTTP requests (human traffic), technologychecker.io/blog/browser-market-share." Quote the figures and reuse the tables with that credit and the window each one covers.
How often we check: monthly, alongside our Chrome, Safari and Firefox reports. A new edition follows only when Chrome's headline share moves 1.0 point or 5% of its value, or when a new figure contradicts a claim on this page.
Frequently asked questions
Which browser has the biggest market share?
Chrome has the biggest browser market share, with 68.31% of human web requests worldwide in October 2026 in our analysis of Cloudflare Radar, ahead of Safari at 18.93% and Edge at 6.59%. Chrome also leads StatCounter's page-view count for the same month, at 68.79%, and W3Counter's sample, at 76.85%, so the three sources agree on the leader while measuring different things. Chrome leads on every operating system we pulled except iOS, where Safari takes 74.88%, and in all 13 countries we cut.
What are the top 5 most used browsers?
The top 5 browsers by share of human web requests in October 2026 are Chrome (68.31%), Safari (18.93%), Edge (6.59%), Firefox (3.60%) and Samsung Internet (1.24%), in our analysis of Cloudflare Radar. Opera is sixth at 1.16%, and every other browser together takes 0.17%. StatCounter's page-view ranking for the same month puts Opera fifth at 2.16% and Samsung Internet sixth at 2.05%. The top four are the same in both: Chrome, Safari, Edge and Firefox, in that order.
What is the most popular browser in 2026?
Chrome is the most popular browser in 2026, with between 68.03% and 68.85% of human web requests in every month from January to October, in our analysis of Cloudflare Radar, and 68.31% in October against 68.35% a year earlier. Safari has been second in every month of 2026, between 17.53% and 18.93%, and Edge third, peaking at 7.37% in August. On phones the top two are the same: Chrome takes 67.97% of human mobile requests and Safari 28.47%.
What market share does Chrome have?
Chrome has 68.31% of human web requests worldwide in October 2026, in our analysis of Cloudflare Radar, and 71.34% once bots are counted; on desktop it takes 68.79% and on mobile 67.97%. Its share runs from 24.69% on iOS to 99.96% on ChromeOS, and, among the 13 countries in our table, from 52.00% in the United Kingdom to 89.22% in India. StatCounter's page-view figure for the same month is 68.79%. Chrome's figure includes browsers that present its user agent, such as Brave, whose own row reads 0.0006%.
Is Firefox losing market share?
Firefox's share is slightly lower than a year ago: 3.60% of human web requests in October 2026 against 3.85% in October 2025, a fall of 0.25 points, in our analysis of Cloudflare Radar. Inside 2026 it moved between 3.60% and 4.07%, peaking in May. Firefox is far larger on desktop (7.22%) than on mobile (0.65%), takes 16.45% of Linux requests and is the third browser in Germany, at 11.70%. Our Firefox market share analysis tracks it against Chrome.
Why is Firefox losing market share?
Firefox fell from 3.85% of human web requests in October 2025 to 3.60% in October 2026, in our analysis of Cloudflare Radar, but request shares show where Firefox stands, not why it lost share. Inside 2026, Firefox rose 0.35 points in May and lost 0.39 in June, both larger moves than its 0.25-point fall over the year. Firefox's position is a desktop one: it takes 7.22% of desktop requests against 0.65% on mobile, and 16.45% on Linux, its highest share among the six operating systems we pulled. A reason for the fall needs a source that measures why people choose a browser, which request counts can't do.
Why are people switching away from Chrome?
Our analysis of Cloudflare Radar shows Chrome's share broadly stable: 68.31% of human web requests in October 2026 against 68.35% in October 2025, a change of 0.03 points on the unrounded figures, and between 68.03% and 68.85% in every month of 2026. Over the same year Safari gained 0.77 points and Edge 0.40 while Samsung Internet lost 0.66, so the net change sat among the smaller browsers. Request shares can't show whether individual people switched, or why anyone chose a browser.
What is the mobile browser market share?
On mobile, Chrome takes 67.97% of human requests and Safari 28.47% in October 2026, in our analysis of Cloudflare Radar, followed by Samsung Internet at 2.11%, Firefox at 0.65% and Opera at 0.50%, while Edge registers 0.00%. StatCounter's mobile page-view figures for the same month give Chrome 70.37%, Safari 21.91%, Samsung Internet 3.16% and Opera 1.88%. Both sources put Chrome first and Safari second on phones, and in our data Safari's mobile share is far above its 7.28% on desktop.
What is Safari's market share in 2026?
Safari has 18.93% of human web requests worldwide in October 2026, in our analysis of Cloudflare Radar, up 0.77 points on October 2025 and 0.90 points on September 2026, its largest monthly rise of the year (provisional until 26 December 2026). Safari takes 74.88% of human requests on iOS and 35.33% on macOS, and is second in all 13 countries we cut, peaking at 31.39% in the United Kingdom. Counting bots lowers its share to 15.68%, and StatCounter gives it 16.59% of page views.
Why do StatCounter and W3Counter show different numbers?
StatCounter gives Chrome 68.79% and W3Counter 76.85% for October 2026, against our 68.31%, because each counts something different. StatCounter counts page views on sites running its tracker, "based on over 3 billion monthly page views", while W3Counter counts its own sample of 12,122,296 browser observations and read 83.82% in September. Our figure is human requests on Cloudflare's network, where a browser that makes more requests per visit weighs more. All three agree that Chrome leads, but their percentages measure different things, so compare figures only within one source.
Is Brave in browser market share data?
Brave appears in our analysis of Cloudflare Radar at only 0.0006% of human web requests in October 2026, and Radar groups browsers by the name their user agent presents, so any Brave requests that present as Chrome are counted as Chrome. Yandex Browser is in the same position, at 0.004% worldwide and 0.20% in Russia, where Cloudflare's own 2025 Year in Review gave it 33%. Requests from other Chromium browsers, AI browsers among them, may sit inside Chrome's 68.31% here, and a Brave-only share needs a source that can tell Brave apart from Chrome.
What are the three biggest browser trends in 2026?
The three biggest browser trends in our 2026 data are Chrome holding at 68.31% of human requests, Safari gaining 0.77 points over the year, and Samsung Internet falling from 1.94% in January to 1.24% in October. Each one changes a different decision.
- Chrome has stopped moving. At 68.31% against 68.35% a year earlier, a test plan built on Chrome's share needs no re-weighting this year.
- Safari is the browser that grew. Safari added 0.77 points over the year and a provisional 0.90 in October; if that holds, give it more test time in the United Kingdom, the United States and Japan, where it already takes more than a quarter of human requests.
- Samsung Internet is fading. Samsung Internet takes 1.24% of human requests worldwide and 3.40% even on Android, so a dedicated test for it ranks behind Safari, Edge and Firefox for most audiences.
Browser share tells you which browsers a site's visitors use, not what a prospect's own site is built on. Our free Website Technology Checker extension shows the technology stack of the page you are on, including its CMS, frameworks, analytics and CDN.
Update history
First published with October 2026 figures on human requests: Chrome 68.31%, Safari 18.93%, Edge 6.59%. Includes the month-by-month series from January to October 2026 with October 2025, the device, operating-system and 13-country cuts, the human-versus-all-traffic comparison and the weekday-versus-weekend split. September and October 2026 are provisional.

Data Analyst
5+ years of experience
Emma is a Data Analyst at TechnologyChecker, where she analyses technology adoption data to build better prospect lists and uncover actionable patterns for sales teams.
- BSc Data Science, Cardiff University
- Google Data Analytics Professional Certificate
- Tableau Desktop Certified Associate
Never miss our research