HubSpot Statistics 2026: Trends, Insights and HubSpot Market Share
We analyzed 121,300 HubSpot domains and 99,700 companies to reveal HubSpot's market share, migration trends, and company adoption data for 2026.
Published •42 min read

HubSpot generated $3.13 billion in FY2025 revenue, ended 2025 with more than 288,000 customers, and ranks #3 in the Marketing Automation category at 7.76% market share, based on our analysis of 121,300 active HubSpot domains. This report breaks down HubSpot statistics for 2026, from financials to migration patterns across 99,700 enriched companies.
As the Product Marketing Manager at TechnologyChecker.io, I spent the past quarter leading our research team through 121,300 domains running HubSpot's marketing and CRM components. The goal was simple: build the most detailed, data-backed picture of HubSpot in 2026. Our analysis combines direct web detection, LinkedIn company enrichment across 99,700 businesses, HubSpot's own SEC filings, and aggregated G2 review data to surface intelligence you won't find in a vendor deck.
I've spent seven years analyzing enterprise technology adoption, and this report deliberately triangulates five independent sources so no single dataset drives the story: TechnologyChecker's monthly crawl of 50M+ domains (our first-party web detection), our job-description crawl (which surfaces HubSpot users with no public web footprint), HubSpot's filings with the U.S. Securities and Exchange Commission (audited GAAP financials), HubSpot's official Q4 and full-year 2025 results (non-GAAP metrics, customer and headcount figures), and over 12,500 G2 review mentions (user sentiment). Where these sources agree, a finding is solid. Where they diverge, that gap is usually the most interesting part of the story. For live market share data, migration trends, and company-level intelligence, visit our HubSpot technology profile.
What you'll learn in this report:
- HubSpot's FY2025 financial performance and 2026 guidance
- HubSpot market share and competitive positioning in Marketing Automation
- Who actually uses HubSpot: company size, industry, and geography
- Migration corridors: who HubSpot wins from, and who it loses to
- Technology stack overlap across 99,700 HubSpot companies
- Actionable recommendations based on real detection data
Executive Summary: Key Findings from Our 2026 Analysis

HubSpot enters 2026 as a $3.13 billion company that keeps growing at scale while its detection footprint tells a more complicated story. The financials are strong. The competitive picture is a genuine fight. Here's what the numbers say.
Critical HubSpot Statistics at a Glance
- $3.13 billion FY2025 revenue, up 19% year-over-year, with subscription revenue of $3.06 billion (98% of the total)
- 288,706 customers at year-end 2025 (299,000+ by Q1 2026) across 135+ countries, adding more than 40,000 during 2025
- First GAAP-profitable year in 2025: operating profit of +$7.4M and net income of +$45.9M, after years of losses (U.S. SEC filings)
- $11,683 average subscription revenue per customer in Q4 2025, up 3% year-over-year
- 121,300 active domains with HubSpot web components in our tracking database
- 99,700 companies enriched through LinkedIn matching, a 72.7% match rate
- 7.76% market share in Marketing Automation, ranking #3 behind MailChimp (18.11%) and Klaviyo (9.43%)
- 52.56% of detected companies have 1-10 employees, and 75.82% have 50 or fewer
- 11,866 companies switched from MailChimp to HubSpot, versus 4,714 going the other way (a 2.5:1 win)
- 3,741 companies left HubSpot for Klaviyo, versus 671 arriving (a 5.6:1 loss in e-commerce email)
- Notable customers detected: Siemens, FedEx, NVIDIA, KPMG, McKinsey, Novartis, DHL Express
So what does this mean? HubSpot is winning the B2B mid-market and pulling steady traffic away from simpler email tools like MailChimp. But it is bleeding e-commerce-focused customers to Klaviyo at a rate that should concern anyone betting on HubSpot for online retail. If you're evaluating marketing automation in 2026, the platform you pick should match where your business actually lives: content-driven B2B, or transactional e-commerce.
Methodology: How We Conducted This Analysis
Data Sources
- TechnologyChecker.io proprietary detection — Our crawlers scan 50M+ domains monthly, detecting HubSpot web components including tracking pixels, forms, chat widgets, meetings embeds, and CTA scripts. This yielded 121,300 domains with active HubSpot signals.
- LinkedIn company enrichment — For 99,700 of those domains, we matched them to LinkedIn company profiles to extract industry, employee count, founding year, and location. That's a 72.7% enrichment rate.
- HubSpot SEC filings (audited GAAP financials) — Gross profit, operating profit, net income, total assets, equity, and net cash come from HubSpot Inc. (NYSE: HUBS) annual reports filed with the U.S. Securities and Exchange Commission. The FY2024 Form 10-K also reports operations across 135+ countries, with roughly 47% of revenue earned outside the United States.
- HubSpot earnings releases (non-GAAP and operating metrics) — Revenue, customer count (288,706 at year-end 2025), ARPU, free cash flow, headcount (8,882 employees), and 2026 guidance come from HubSpot's Q4/full-year 2025 results and its Q1 2026 update.
- G2 review aggregation — User sentiment is drawn from over 12,500 G2 review mentions for HubSpot Marketing Hub.
Detection Methodology
Our system detects HubSpot through JavaScript fingerprints, tracking-script domains, HTML form patterns, and DNS records. We track both currently active and previously detected domains, which gives us migration and churn signals over time.
HubSpot is not one product but several: Marketing Hub, Sales Hub (the CRM), Service Hub, Content Hub, and Operations Hub. We maintain a distinct detection pattern for each web-facing component, and most of what we count comes from the marketing side (tracking pixels, forms, meetings links, chat widgets) because those live on public pages. The CRM itself has almost no public web fingerprint: a company can run its entire sales pipeline in Sales Hub without exposing a single detectable signal on its website. To catch some of those CRM-only users, we also crawl job descriptions, where a line like "HubSpot CRM experience required" surfaces companies our web crawler alone would miss. That combined approach is why our counts skew toward marketing-led deployments, and why HubSpot's true CRM footprint is larger than any web-only method can measure.
Limitations to Consider
- Web detection vs. total customer base: HubSpot reports 288,000+ paying customers globally. Our 121,300 figure tracks domains with detectable web components. That's roughly a 42% detection rate, much higher than a server-side platform like Salesforce (where we detect closer to a quarter of the customer base), because HubSpot's tracking pixel and forms live on public-facing pages rather than behind a login.
- Web-facing share is representative here: Unlike server-side CRMs, HubSpot is a client-side marketing tool. Our 7.76% Marketing Automation detection share is a meaningful competitive signal, not an artifact of hidden deployments.
- Category framing matters: We classify HubSpot in Marketing Automation, a category dominated by email-first tools. HubSpot's all-in-one CRM model isn't a like-for-like comparison with MailChimp or Klaviyo, so read the ranking as positioning, not a verdict.
- Employee counts come from LinkedIn and may lag actual headcount by 6-12 months.
- Historical domain data before 2015 uses DNS heuristics for approximation.
Part 1: HubSpot Revenue and Financial Performance

HubSpot's financial trajectory is one of the cleaner growth-to-profitability stories in software. The company crossed $3 billion in annual revenue for the first time in 2025 while nearly doubling free cash flow over two years. Here are the actual numbers.
FY2025 Full Year Results
According to HubSpot's official Q4 and full-year 2025 results, the company delivered record numbers:
| Metric | FY2025 | FY2024 | Change |
|---|---|---|---|
| Total Revenue | $3.13 billion | $2.63 billion | +19% YoY |
| Subscription Revenue | $3.06 billion | ~$2.58 billion | +19% YoY |
| Q4 Revenue | $846.7 million | ~$706 million | +20% YoY |
| Non-GAAP Operating Margin | 18.6% | 17.5% | +1.1 pts |
| Free Cash Flow | $594.9 million | $488.1 million | +21.9% YoY |
Subscription revenue at $3.06 billion makes up 98% of the total, which is the healthiest possible mix for a software company. Recurring revenue is higher-margin and more predictable than one-time services, and HubSpot has kept services to a rounding error. For buyers, that signals a company investing in product depth rather than propping up growth with consulting fees.
The free cash flow story is the quiet standout. HubSpot converted 2025 revenue into $594.9 million of free cash flow, up from $488.1 million a year earlier. That's a 19% free-cash-flow margin, and it funded a new $1 billion share repurchase authorization the company announced alongside the results.
Customers and Revenue Per Customer
HubSpot ended 2025 with more than 288,000 customers, adding over 40,000 net new customers during the year and 9,800 in Q4 alone. Average subscription revenue per customer reached $11,683 in Q4 2025, up 3% year-over-year.
That combination matters. HubSpot is adding customers fast and growing revenue per customer, which means the land-and-expand motion is working. New customers land on cheaper tiers, then expand into additional Hubs (Marketing, Sales, Service, Content, Operations) as they grow. The 3% ARPU lift shows the expansion is outpacing the dilution from all those small new logos.
Revenue Growth Over the Past Six Years
Here's the full trajectory showing how HubSpot scaled from under $900 million to $3.13 billion:
| Fiscal Year | Annual Revenue | YoY Growth | Context |
|---|---|---|---|
| FY2020 | $883.0 million | +31% | Pandemic-era inbound surge |
| FY2021 | $1.30 billion | +47% | Peak growth year |
| FY2022 | $1.73 billion | +33% | Multi-Hub expansion |
| FY2023 | $2.17 billion | +25% | Crossed $2B |
| FY2024 | $2.63 billion | +21% | Pricing model shift |
| FY2025 | $3.13 billion | +19% | Crossed $3B, AI features ramp |
The pattern is textbook SaaS maturation. HubSpot's hyper-growth years (the 47% of 2021) are behind it, but the company has held double-digit growth while margins climbed. Revenue growing 19% on a $3 billion base is harder than 47% on a $900 million base, and it's paired with real profitability now.
The Profitability Story
Between 2020 and 2025, HubSpot grew revenue 3.5x while turning free cash flow from a rounding error into $594.9 million. The non-GAAP operating margin climbed from 17.5% in 2024 to 18.6% in 2025, and the company announced a new $1 billion share buyback alongside the results. That combination, rising margins plus buybacks, marks the shift from growth-at-any-cost to disciplined, cash-generative growth.
For buyers, this is more reassuring than it looks. A vendor generating $594.9 million in annual free cash flow can fund years of product development without hiking prices just to stay solvent. That financial cushion is the clearest evidence that the platform you buy today will keep improving under you.
The GAAP Profitability Inflection
Non-GAAP margins tell the operating story, but HubSpot's audited filings reveal a sharper milestone: 2025 was the first year it turned GAAP-profitable. According to HubSpot's filings with the U.S. Securities and Exchange Commission, GAAP operating profit swung to +$7.4 million in 2025 after bottoming at -$208.1 million in 2023, and GAAP net income reached +$45.9 million, up from a razor-thin +$4.6 million in 2024 and losses every year before.
| Metric (GAAP) | 2021 | 2022 | 2023 | 2024 | 2025 |
|---|---|---|---|---|---|
| Gross profit | $1.04B | $1.42B | $1.82B | $2.23B | $2.62B |
| Operating profit | -$54.8M | -$109.1M | -$208.1M | -$67.6M | +$7.4M |
| Net income | -$77.8M | -$112.8M | -$176.3M | +$4.6M | +$45.9M |
| Net cash | $238.7M | $273.2M | $351.0M | $598.6M | $760.7M |
The gross-margin picture is the quieter strength. At $2.62 billion of gross profit on $3.13 billion of revenue, HubSpot runs an 83.7% gross margin, the kind of number that funds a generous free CRM tier without bleeding the business. Pair that with $760.7 million of net cash and $2.07 billion of total equity, and you get a company that can keep the free-to-paid flywheel spinning (the 52.56% micro-business base from Part 4) while finally posting a profit. HubSpot also runs lean: 8,882 employees at year-end 2025 against $3.13 billion of revenue works out to roughly $352,000 of revenue per employee.
2026 Guidance
For full-year 2026, HubSpot guided to total revenue of $3.69 billion to $3.70 billion, up 18% as-reported and 16% in constant currency. Management expects non-GAAP operating profit of $736 million to $740 million, a roughly 20% operating margin, and free cash flow of approximately $740 million.
Read that guidance next to the product roadmap. HubSpot is pouring investment into AI (Breeze, its AI layer, plus AI-powered content and prospecting agents). The guidance says leadership expects that investment to keep growth in the high teens while margins expand toward 20%. For a company evaluating HubSpot as a multi-year platform bet, sustained double-digit growth and rising margins are the strongest signal that product investment isn't slowing. That guidance is already tracking: HubSpot reported $881 million in Q1 2026 revenue and crossed 299,000 customers across 135+ countries in its Q1 2026 update.
Part 2: HubSpot's Market Position in 2026
HubSpot's market position needs two lenses: its detection share in our Marketing Automation category, and its real-world position as an all-in-one CRM platform. Both tell a useful story, and they don't fully agree.
Marketing Automation Market Share
HubSpot holds 7.76% of the Marketing Automation category, ranking #3 by domain count, based on our monthly crawl of 50M+ domains. It sits behind two email-first giants and ahead of the budget and agency players.
| Platform | Market Share | Domains Tracked | Positioning |
|---|---|---|---|
| MailChimp | 18.11% | 283,090 | Email-first, massive SMB base |
| Klaviyo | 9.43% | 147,491 | E-commerce email and SMS |
| HubSpot | 7.76% | 121,300 | All-in-one CRM + marketing |
| MailerLite | 6.13% | 95,861 | Budget-conscious creators |
| HighLevel | 4.63% | 72,439 | Agency all-in-one |
| Brevo | 4.31% | 67,311 | Transactional email |
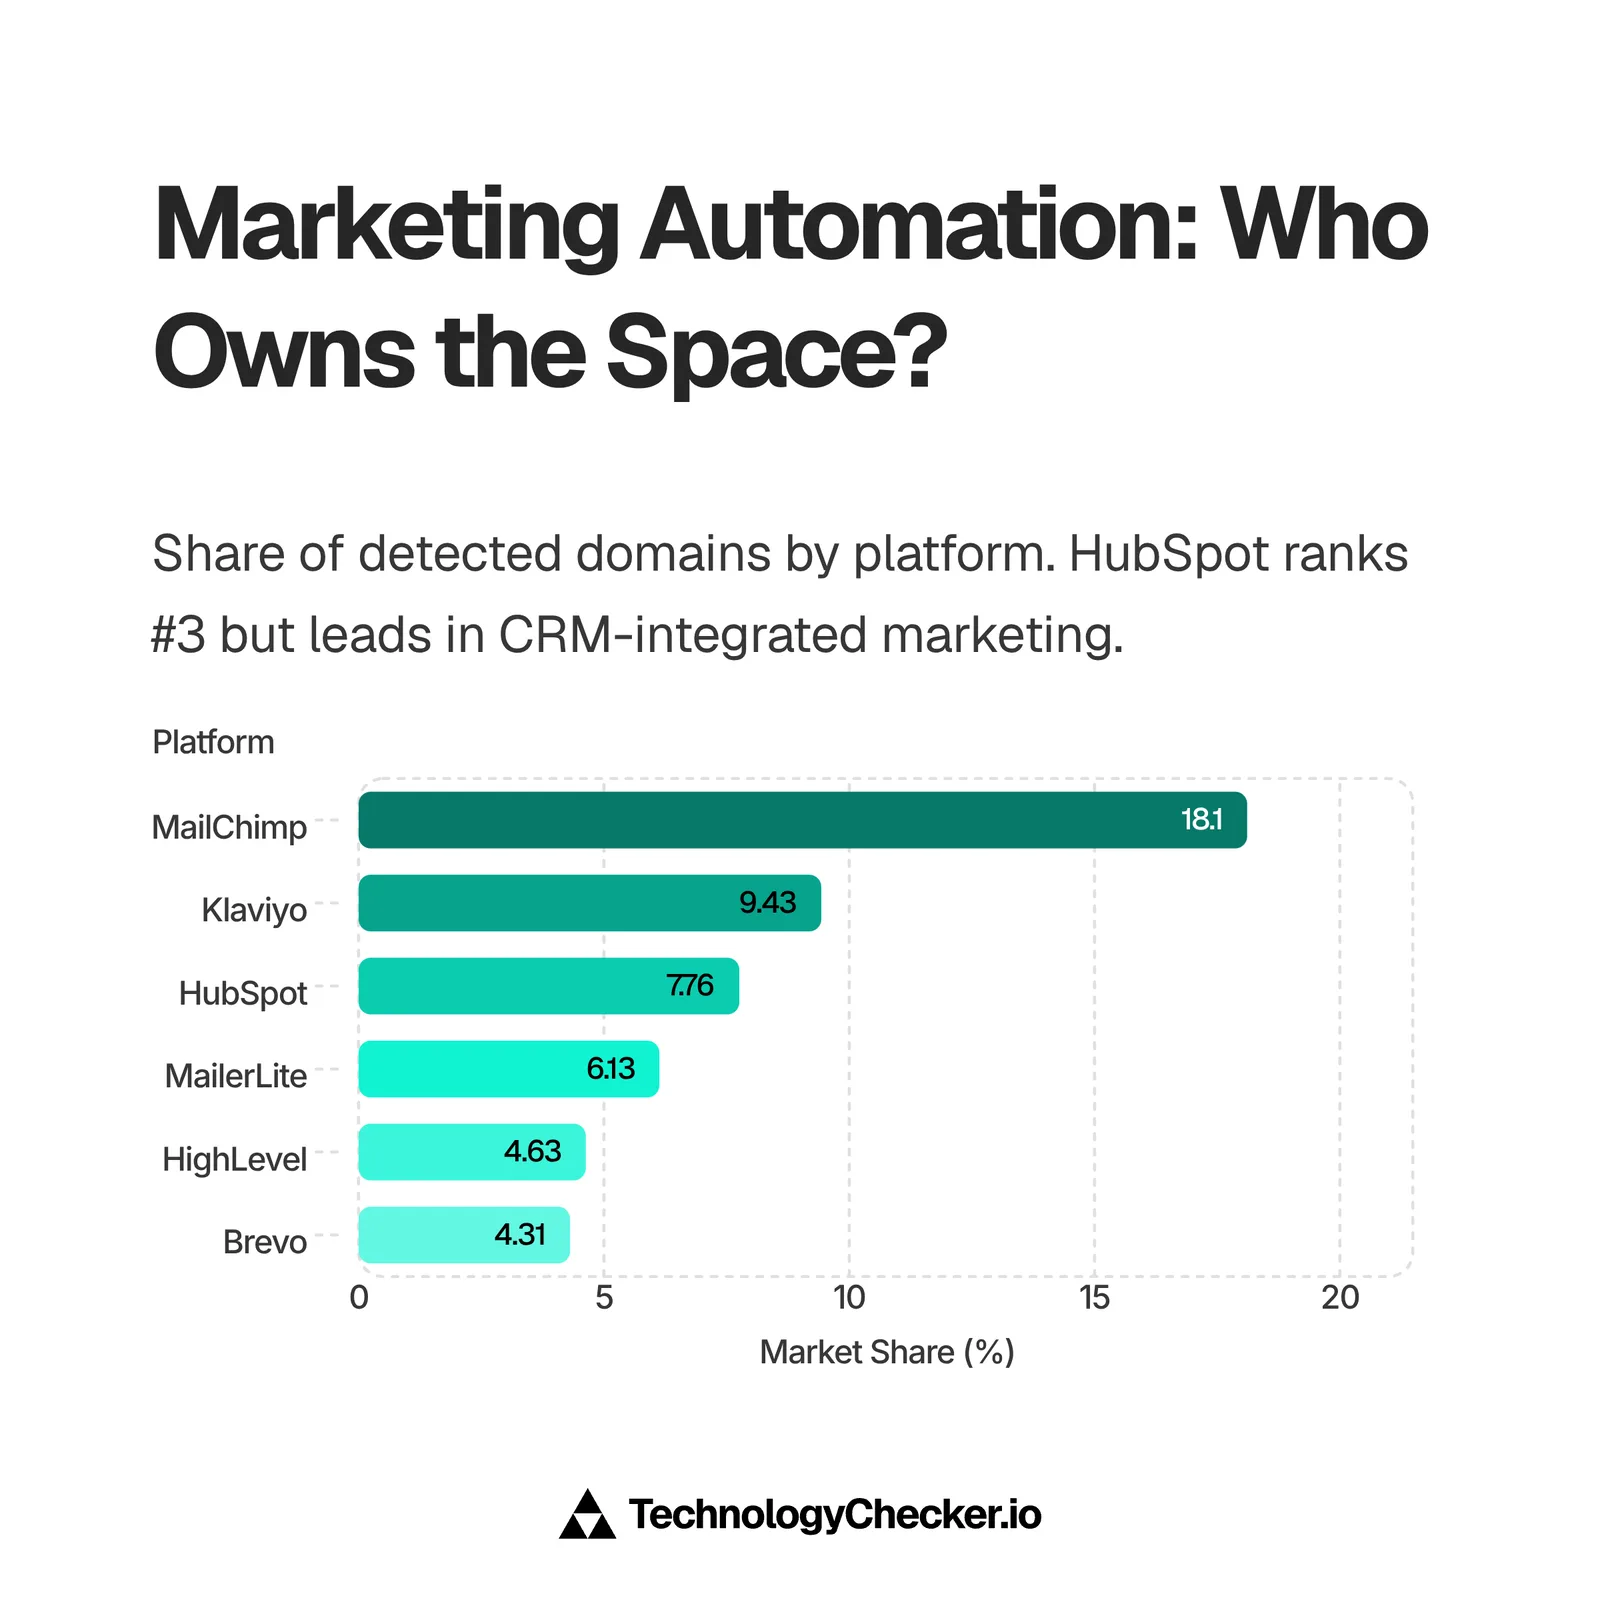
That #3 ranking undersells what HubSpot actually is. MailChimp and Klaviyo lead by raw domain count because email tools get installed on far more small sites, often as a single newsletter signup form. HubSpot's 121,300 domains represent something heavier: businesses running a connected CRM, forms, tracking, and often a full content operation. Fewer installs, deeper commitment.
HubSpot is not the only platform pulling domains off MailChimp. The two tools directly above and below it in that table run their own corridors: 2,897 domains moved from MailChimp to Klaviyo in 90 days against 475 back, and 321 moved to MailerLite against 82 back. Neither is a clean replacement, since 28,700 domains run MailChimp and Klaviyo together and 4,021 run MailChimp and MailerLite together. See MailChimp vs Klaviyo: who is switching and Compare MailChimp vs MailerLite.
The CRM-Integrated Difference
HubSpot's real edge is that it bundles CRM, marketing, sales, and service in one system. Its email-only competitors don't. That shows up in who uses it (heavier B2B mix, larger mid-market presence) and in the migration data we'll cover in Part 5, where companies consolidating onto a single platform pick HubSpot over stitching together point tools.
For an independent read on category dynamics, our 2026 Marketing Automation Market Share Report breaks down how the six platforms above compete across segments. And for the enterprise CRM view that sits adjacent to this market, our Salesforce statistics report covers the platform HubSpot increasingly competes with in the mid-market.
What 7.76% Actually Means
The Marketing Automation category we track spans roughly 1.56 million domains. HubSpot's 7.76% is those 121,300 active domains, third by volume but a heavier class of deployment than the leaders above it. MailChimp's 283,090 domains are inflated by single-purpose newsletter forms on small sites. HubSpot's footprint skews toward businesses running a connected CRM, forms, tracking, and content together.
There's a competitor here that isn't even in this category: Salesforce. As mid-market companies in the 51-200 employee band outgrow email tools, they weigh HubSpot against Salesforce, not against MailChimp. HubSpot wins that comparison on setup speed and ease of use, and concedes it on deep customization. That mid-market tug-of-war, not the email-tool ranking, is HubSpot's real competitive front.
Part 3: Historical Growth Trends
Our detection database goes back to 2005, giving us two decades of HubSpot web-component adoption data. The curve is one of the steadiest in the category, with one detection anomaly and a recent dip worth explaining.
Web Detection Growth: 2005-2025
| Period | Active Domains | Change | Notable Context |
|---|---|---|---|
| Jul 2005 | 1 | Baseline | First detected (HubSpot founded 2006) |
| Jan 2010 | 91 | — | Early inbound-marketing era |
| Jan 2013 | 899 | +888% (3yr) | Post-funding expansion |
| Jan 2015 | 2,199 | +145% (2yr) | Year after IPO |
| Jan 2017 | 5,604 | +155% (2yr) | Growth Hub launch |
| Jan 2019 | 16,262 | +190% (2yr) | Multi-product platform |
| Jan 2020 | 23,487 | +44% (1yr) | Pre-pandemic baseline |
| Jan 2021 | 36,971 | +57% (1yr) | Remote-work inbound surge |
| Jan 2022 | 51,533 | +39% (1yr) | Free CRM adoption |
| Jan 2023 | 68,661 | +33% (1yr) | Steady expansion |
| Jan 2024 | 89,509 | +30% (1yr) | Pre-peak baseline |
| Jan 2025 | 119,741 | +34% (1yr) | All-time peak |
| Jul 2025 | 102,644 | -14% (6mo) | Detection normalization |
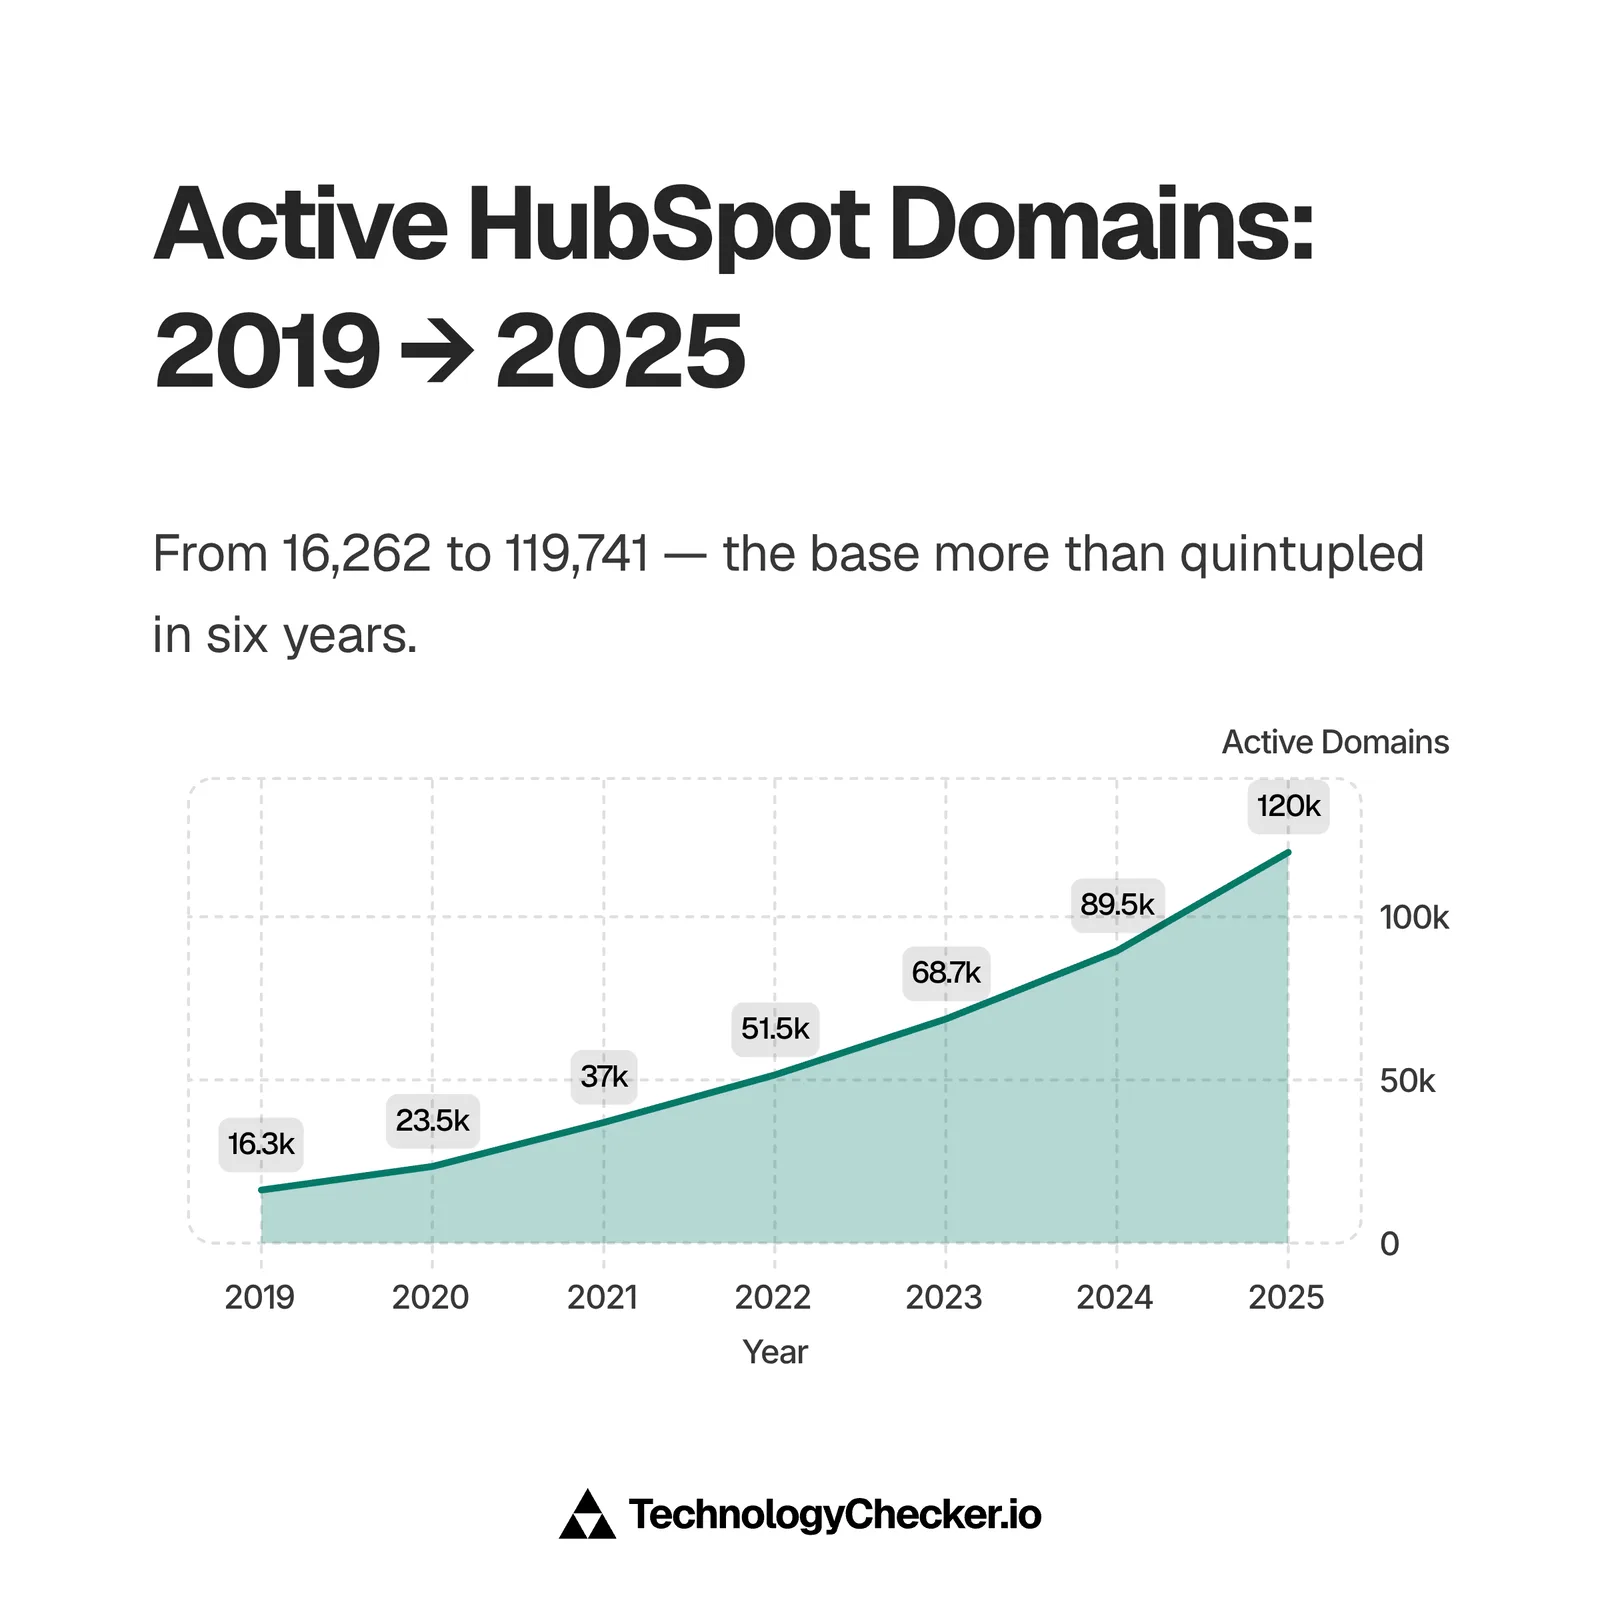
Key Insights from Historical Data
1. More than quintupled between 2019 and 2024
Active domains grew from 16,262 in January 2019 to 89,509 in January 2024, and then to a peak of 119,741 by January 2025. That's roughly 5.5x in five years. The driver is straightforward: inbound marketing became the default B2B growth playbook, and HubSpot's free CRM tier (launched to remove the adoption barrier) pulled hundreds of thousands of small businesses into the ecosystem.
2. The pandemic accelerator (2020-2021): +57% in a single year
Active domains jumped from 23,487 to 36,971 between January 2020 and January 2021. When in-person selling stopped, companies scrambled for digital lead generation, and HubSpot captured a large share of that urgency. The pattern mirrors what we documented in our analysis of why SaaS companies switch CRMs: compressed timelines pushed buyers toward all-in-one platforms.
3. The 2025 dip: from 119,741 to 102,644
The decline from the January 2025 peak to 102,644 by mid-2025 looks alarming at first. Context matters. Notice that in July 2025, active domains equal total domains (both 102,644), where earlier periods showed a gap. That convergence points to a cleanup of stale and duplicate detections rather than mass churn. Our headline tracking figure of 121,300 active domains reflects the most recent detection pass. Even the conservative 102,644 count is more than 6x the January 2019 level.
Year-Over-Year Growth Rate Trends
Calculating annual growth from our January snapshots shows the deceleration pattern clearly:
| Period | Jan Active Domains | YoY Growth | Phase |
|---|---|---|---|
| 2019 to 2020 | 16,262 → 23,487 | +44% | Pre-pandemic base |
| 2020 to 2021 | 23,487 → 36,971 | +57% | Pandemic surge |
| 2021 to 2022 | 36,971 → 51,533 | +39% | Free CRM adoption |
| 2022 to 2023 | 51,533 → 68,661 | +33% | Steady expansion |
| 2023 to 2024 | 68,661 → 89,509 | +30% | Pre-peak base |
| 2024 to 2025 | 89,509 → 119,741 | +34% | Peak year |
The 2020-to-2021 spike (+57%) is the standout, driven by the remote-work scramble for digital lead generation. What's notable is how the rate held in the 30-34% range from 2022 through 2025, even as the base tripled. Most platforms decelerate sharply as they scale. HubSpot's web footprint kept compounding by roughly a third each year, which tracks with its financial revenue growth staying in the high teens to twenties over the same span.
Part 4: Who Actually Uses HubSpot? (Company Analysis)
At TechnologyChecker.io, we went past surface-level statistics. Using our detection system combined with LinkedIn enrichment, we analyzed 99,700 HubSpot companies to understand the real businesses behind the installs. You can explore the full list of companies using HubSpot in our live dataset.
Company Size Distribution
| Employee Range | Company Count | Percentage | What This Tells Us |
|---|---|---|---|
| 1-10 employees | 51,610 | 52.56% | Core base: micro-businesses |
| 11-50 employees | 22,842 | 23.26% | Growing small teams |
| 51-200 employees | 12,543 | 12.77% | Mid-market sweet spot |
| 201-500 employees | 2,864 | 2.92% | Upper mid-market |
| 501-1,000 employees | 1,348 | 1.37% | Lower enterprise |
| 1,001-5,000 employees | 1,187 | 1.21% | Mid-enterprise |
| 5,001-10,000 employees | 223 | 0.23% | Large enterprise |
| 10,001+ employees | 247 | 0.25% | Global enterprises |
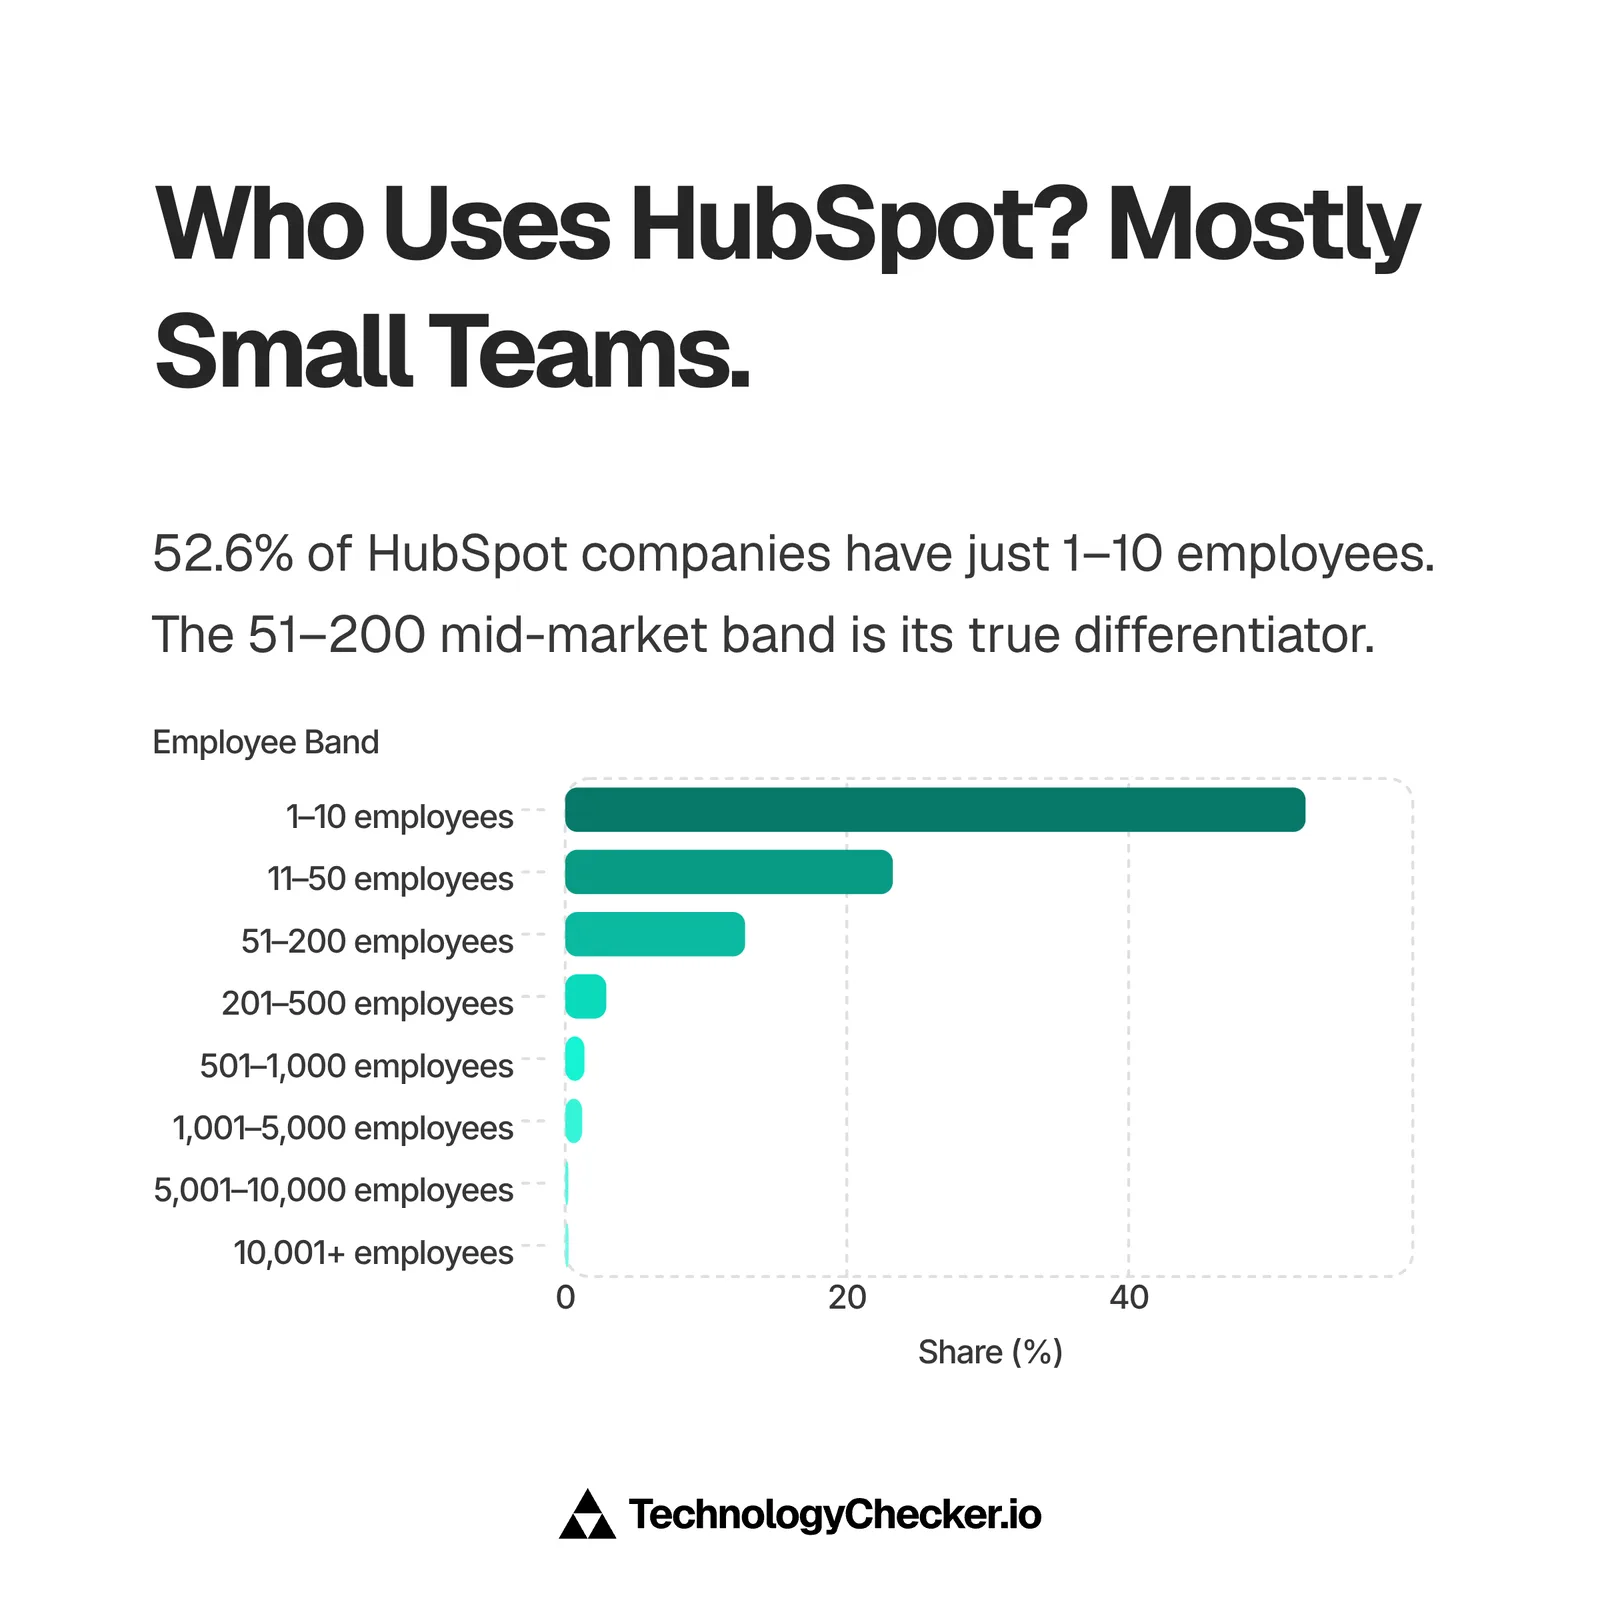
The core is small, but the mid-market is the story. Over half of detected HubSpot companies (52.56%) have 10 or fewer employees, and 75.82% have 50 or fewer. That confirms HubSpot's small-business reputation. But look at the 51-200 band: at 12.77%, it's roughly double what email-only tools like MailChimp or MailerLite show. That mid-market concentration is HubSpot's real differentiator, because those are companies big enough to need CRM integration but not so big they default to Salesforce.
The 0.25% enterprise segment (10,001+ employees) is tiny by percentage, but it's 247 real companies including Siemens, FedEx, and NVIDIA. Their presence validates HubSpot for mid-market buyers doing competitive due diligence, even if these giants run it for specific divisions rather than company-wide.
Industry Distribution
| Rank | Industry | Company Count | Percentage |
|---|---|---|---|
| 1 | Software Development | 8,081 | 8.54% |
| 2 | IT Services and IT Consulting | 6,240 | 6.59% |
| 3 | Advertising Services | 5,346 | 5.65% |
| 4 | Business Consulting and Services | 4,625 | 4.88% |
| 5 | Technology, Information and Internet | 3,718 | 3.93% |
| 6 | Financial Services | 3,427 | 3.62% |
| 7 | Real Estate | 2,524 | 2.67% |
| 8 | Marketing Services | 2,458 | 2.60% |
| 9 | Construction | 2,311 | 2.44% |
| 10 | Professional Training and Coaching | 1,827 | 1.93% |
No single industry exceeds 9%, and the top five are all technology or professional services. That's HubSpot's B2B DNA showing through. Software Development leads at 8.54%, and when you add IT Services (6.59%) and Technology/Internet (3.93%), tech-adjacent businesses make up nearly a fifth of all HubSpot companies. Advertising Services at 5.65% and Marketing Services at 2.60% reflect the agency crowd that resells and manages HubSpot for clients.
The under-representation of retail and consumer industries is telling. This is not where you find e-commerce-first brands, which aligns with the Klaviyo migration data we'll cover in Part 5. HubSpot indexes toward businesses that sell to other businesses through content and long sales cycles.
Geographic Distribution
| Rank | Country | Company Count | Percentage |
|---|---|---|---|
| 1 | United States | 38,400 | 38.5% |
| 2 | United Kingdom | 9,510 | 9.5% |
| 3 | Germany | 6,359 | 6.4% |
| 4 | Australia | 3,810 | 3.8% |
| 5 | Canada | 3,524 | 3.5% |
| 6 | France | 3,292 | 3.3% |
| 7 | Spain | 2,284 | 2.3% |
| 8 | Netherlands | 2,045 | 2.1% |
| 9 | India | 1,584 | 1.6% |
| 10 | Italy | 1,517 | 1.5% |
The US dominates at 38.5%, expected for a Cambridge, Massachusetts company. But the European footprint is the interesting part. The UK (9.5%), Germany (6.4%), France (3.3%), Spain (2.3%), the Netherlands (2.1%), and Italy (1.5%) together account for roughly 25% of detected companies. That's a genuine European base, stronger than most US-born marketing tools show. Germany at 6.4% is especially notable, since German buyers tend to favor local and privacy-first vendors.
HubSpot's own filings show the international story runs deeper than our detection captures. Per its FY2024 annual report, HubSpot operates across 135+ countries and earns roughly 47% of revenue outside the United States. Our web detection is more US-weighted (38.5%) than that revenue split, and the gap is a genuine finding: international HubSpot customers are under-represented in public web detection, either because they deploy fewer public-facing components or run more of HubSpot behind a login. For sales teams, that gap is a signal, not noise. The non-US market HubSpot actually monetizes is bigger than the one you can see from the outside.
Company Age Analysis
| Founding Decade | Company Count | Percentage | Profile |
|---|---|---|---|
| 2010s | 31,689 | 42.31% | Cloud-native scale-ups |
| 2020s | 17,908 | 23.91% | Post-pandemic founders |
| 2000s | 11,613 | 15.51% | Web-era businesses |
| 1990s | 5,621 | 7.51% | Dot-com survivors |
| 1980s | 3,082 | 4.12% | Established mid-market |
| Pre-1960 | 2,512 | 3.35% | Legacy enterprises |
| 1970s | 1,573 | 2.10% | Industrial-era firms |
| 1960s | 894 | 1.19% | Traditional corporates |
Companies founded in the 2010s make up the largest segment at 42.31%, and the 2020s add another 23.91%. Combined, two-thirds of HubSpot companies were founded since 2010. That's the youngest customer base of any platform we track at this scale, and it fits the story: HubSpot grew up alongside the inbound-marketing generation of startups. The pre-1960 segment (3.35%) shows a smaller but real tail of legacy enterprises like Siemens (founded 1847) using HubSpot for specific digital initiatives.
Ideal Customer Profile
Based on our enrichment analysis, the typical HubSpot customer looks like this:
| Attribute | Value |
|---|---|
| Company Size | 1-10 employees |
| Top Industries | Software, IT Consulting, Advertising |
| Location | US, UK, or Germany |
| Founded | 2010-2019 |
| Company Age | ~5-15 years old |
This ICP is gold for sales teams. If you sell to HubSpot users (integrations, agencies, complementary tools), your best prospects are young B2B tech and services companies in the US, UK, and Germany. For a deeper look at using technographic data in outreach, our technology lookup industry statistics report covers the methodology.
Cross-Referencing Size, Industry, and Geography
Overlay the three dimensions and a sharper picture emerges. The typical detected HubSpot company is a 1-50 person software or services firm in the US, UK, or Germany, founded since 2010. That profile covers 75.82% of the base, and it's what HubSpot's free-to-paid funnel is built to capture.
The high-value segment looks different. The 247 companies with 10,001+ employees skew toward manufacturing, IT services, and consulting, and they cluster in the US, Germany, and Switzerland. They run HubSpot narrowly, on a campaign or a single division, but they anchor its enterprise credibility.
For B2B sales teams, this creates two distinct plays:
- Volume play: Target the 1-50 employee segment (75.82% of companies) with mid-ticket offerings. These businesses decide quickly and concentrate in Software, IT Consulting, and Advertising.
- Mid-market play: Target the 51-200 band (12.77%) with higher-ticket, integration-heavy solutions. This is HubSpot's sweet spot, where companies are large enough to need connected systems but small enough to move fast.
Part 5: Customer Migration Trends
Migration data reveals more about platform satisfaction than any marketing claim. Our detection tracks when domains add or remove HubSpot components over time, giving us real switching signals across the Marketing Automation category.
Switching TO HubSpot (Where They Came From)
| Platform | Total Switches | Last 1 Year | Last 3 Years | Last 5 Years |
|---|---|---|---|---|
| MailChimp | 11,866 | 1,713 | 4,472 | 7,912 |
| MailerLite | 2,600 | 803 | 2,471 | 2,555 |
| ActiveCampaign | 2,147 | 463 | 1,344 | 1,855 |
| Brevo | 1,169 | 297 | 843 | 1,081 |
| Klaviyo | 671 | 261 | 524 | 620 |
| HighLevel | 563 | 362 | 554 | 563 |
The MailChimp-to-HubSpot corridor is the largest migration pattern in our entire Marketing Automation dataset: 11,866 total switches, with 1,713 in the last year alone. This is the classic upgrade path. Companies using MailChimp start with basic email, then hit a ceiling when they need CRM, lead scoring, and sales alignment, and graduate to HubSpot. MailChimp doesn't offer a CRM, so this migration is structural, not just a pricing complaint.
Switching FROM HubSpot (Where They Went)
| Platform | Total Switches | Last 1 Year | Last 3 Years | Last 5 Years |
|---|---|---|---|---|
| MailChimp | 4,714 | 518 | 1,321 | 2,568 |
| Klaviyo | 3,741 | 871 | 1,980 | 3,073 |
| ActiveCampaign | 1,982 | 425 | 900 | 1,507 |
| MailerLite | 1,832 | 517 | 1,342 | 1,650 |
| Brevo | 1,721 | 126 | 732 | 1,436 |
| HighLevel | 1,522 | 735 | 1,470 | 1,522 |
Here's where it gets uncomfortable for HubSpot. Klaviyo pulls 3,741 companies away while only sending back 671, a 5.6:1 loss. Klaviyo is built for e-commerce email and SMS, and when an online retailer outgrows HubSpot's commerce features, Klaviyo is the destination. This is HubSpot's clearest weakness.
HighLevel is the fast-rising threat. It took 1,522 companies from HubSpot, and 1,470 of those (96.6%) happened in the last three years. HighLevel's all-in-one model targets agencies, and the companies using HighLevel are exactly the crowd (Advertising Services, 5.65% of HubSpot companies) that HubSpot has historically owned.
Net Migration Analysis
The math:
- Total switched TO HubSpot (across these six platforms): 19,016 domains
- Total switched FROM HubSpot: 15,512 domains
- Net gain: +3,504 domains (1.23:1 ratio in favor of HubSpot)
By platform:
| Platform | To HubSpot | From HubSpot | Net | Ratio |
|---|---|---|---|---|
| MailChimp | 11,866 | 4,714 | +7,152 | 2.52:1 |
| MailerLite | 2,600 | 1,832 | +768 | 1.42:1 |
| ActiveCampaign | 2,147 | 1,982 | +165 | 1.08:1 |
| Brevo | 1,169 | 1,721 | -552 | 0.68:1 |
| HighLevel | 563 | 1,522 | -959 | 0.37:1 |
| Klaviyo | 671 | 3,741 | -3,070 | 0.18:1 |
HubSpot Migration by Platform 2026: Wins MailChimp, Loses Klaviyo
Across six marketing automation platforms, HubSpot gained 19,016 companies and lost 15,512, a net of +3,504 (1.23:1). The MailChimp corridor drives the entire net gain: 11,866 companies switched to HubSpot versus 4,714 leaving (a 2.5:1 win). Klaviyo is the largest drain, pulling 3,741 companies away versus only 671 arriving (5.6:1 against HubSpot) as e-commerce brands leave for commerce-native email. HighLevel is the fastest-rising threat, taking 1,522 companies with 96% of those moves in the last three years.
Source: TechnologyChecker.io · 2026
| Platform | Companies switched (all-time) |
|---|---|
| MailChimp | 11866 |
| MailerLite | 2600 |
| ActiveCampaign | 2147 |
| Brevo | 1169 |
| Klaviyo | 671 |
| HighLevel | 563 |
- MailChimp is the biggest source: 11,866 companies switched to HubSpot vs 4,714 leaving (2.5:1)
- Klaviyo is the biggest drain: 3,741 companies left HubSpot vs 671 arriving (5.6:1 against)
- HighLevel took 1,522 companies, 96% of them within the last three years
- Net across the six platforms: +3,504 companies in HubSpot's favor (1.23:1)
The overall 1.23:1 ratio means HubSpot gains more than it loses, but the margin is thinner than the headline growth suggests. One corridor (MailChimp, +7,152) carries the entire net gain. Strip out MailChimp and HubSpot is net-negative across the other five platforms combined. The competitive fight is real, and it splits cleanly: HubSpot wins the "upgrade from basic email" battle and loses the "specialized e-commerce and agency" battle.
"The 5.6:1 Klaviyo migration ratio tells us HubSpot's weakness isn't CRM or B2B. It's e-commerce. Any HubSpot customer running Shopify should be on your retention watch list." — Mehmet Suleyman, CEO, TechnologyChecker.io
Context on churn: our database contains 289,752 domains that previously used HubSpot but no longer do. That's roughly 2.4 previously-used domains for every active one. High churn is normal in marketing automation, because companies redesign sites, swap tracking scripts, and consolidate tools without necessarily abandoning the underlying strategy. But that 289,752 figure is also a prospecting goldmine: those are businesses that already know HubSpot and may be open to a re-adoption pitch.
What Migration Data Means for Sales Teams
Migration corridors are the most actionable intelligence in this report. A company that just moved from MailChimp to HubSpot is in new-platform mode: evaluating integrations, cleaning data, budgeting for onboarding. That's a 3-6 month window of heightened buying activity for complementary tools and services.
The reverse signal is just as useful. Companies leaving HubSpot for Klaviyo are e-commerce brands using Klaviyo, consolidating around commerce-native email. They need migration services, template rebuilds, and SMS setup, not more B2B tooling. Knowing which way a company is moving tells you which pitch lands.
The 289,752 previously-used domains are the quietest opportunity. These businesses had HubSpot components and removed them. Some churned to a competitor, others just redesigned a site. Cross-reference that list against current detection and you find companies with marketing-automation budgets, HubSpot familiarity, and no current platform, which is the warmest kind of re-adoption prospect.
Part 6: Technology Stack and Third-Party Integrations
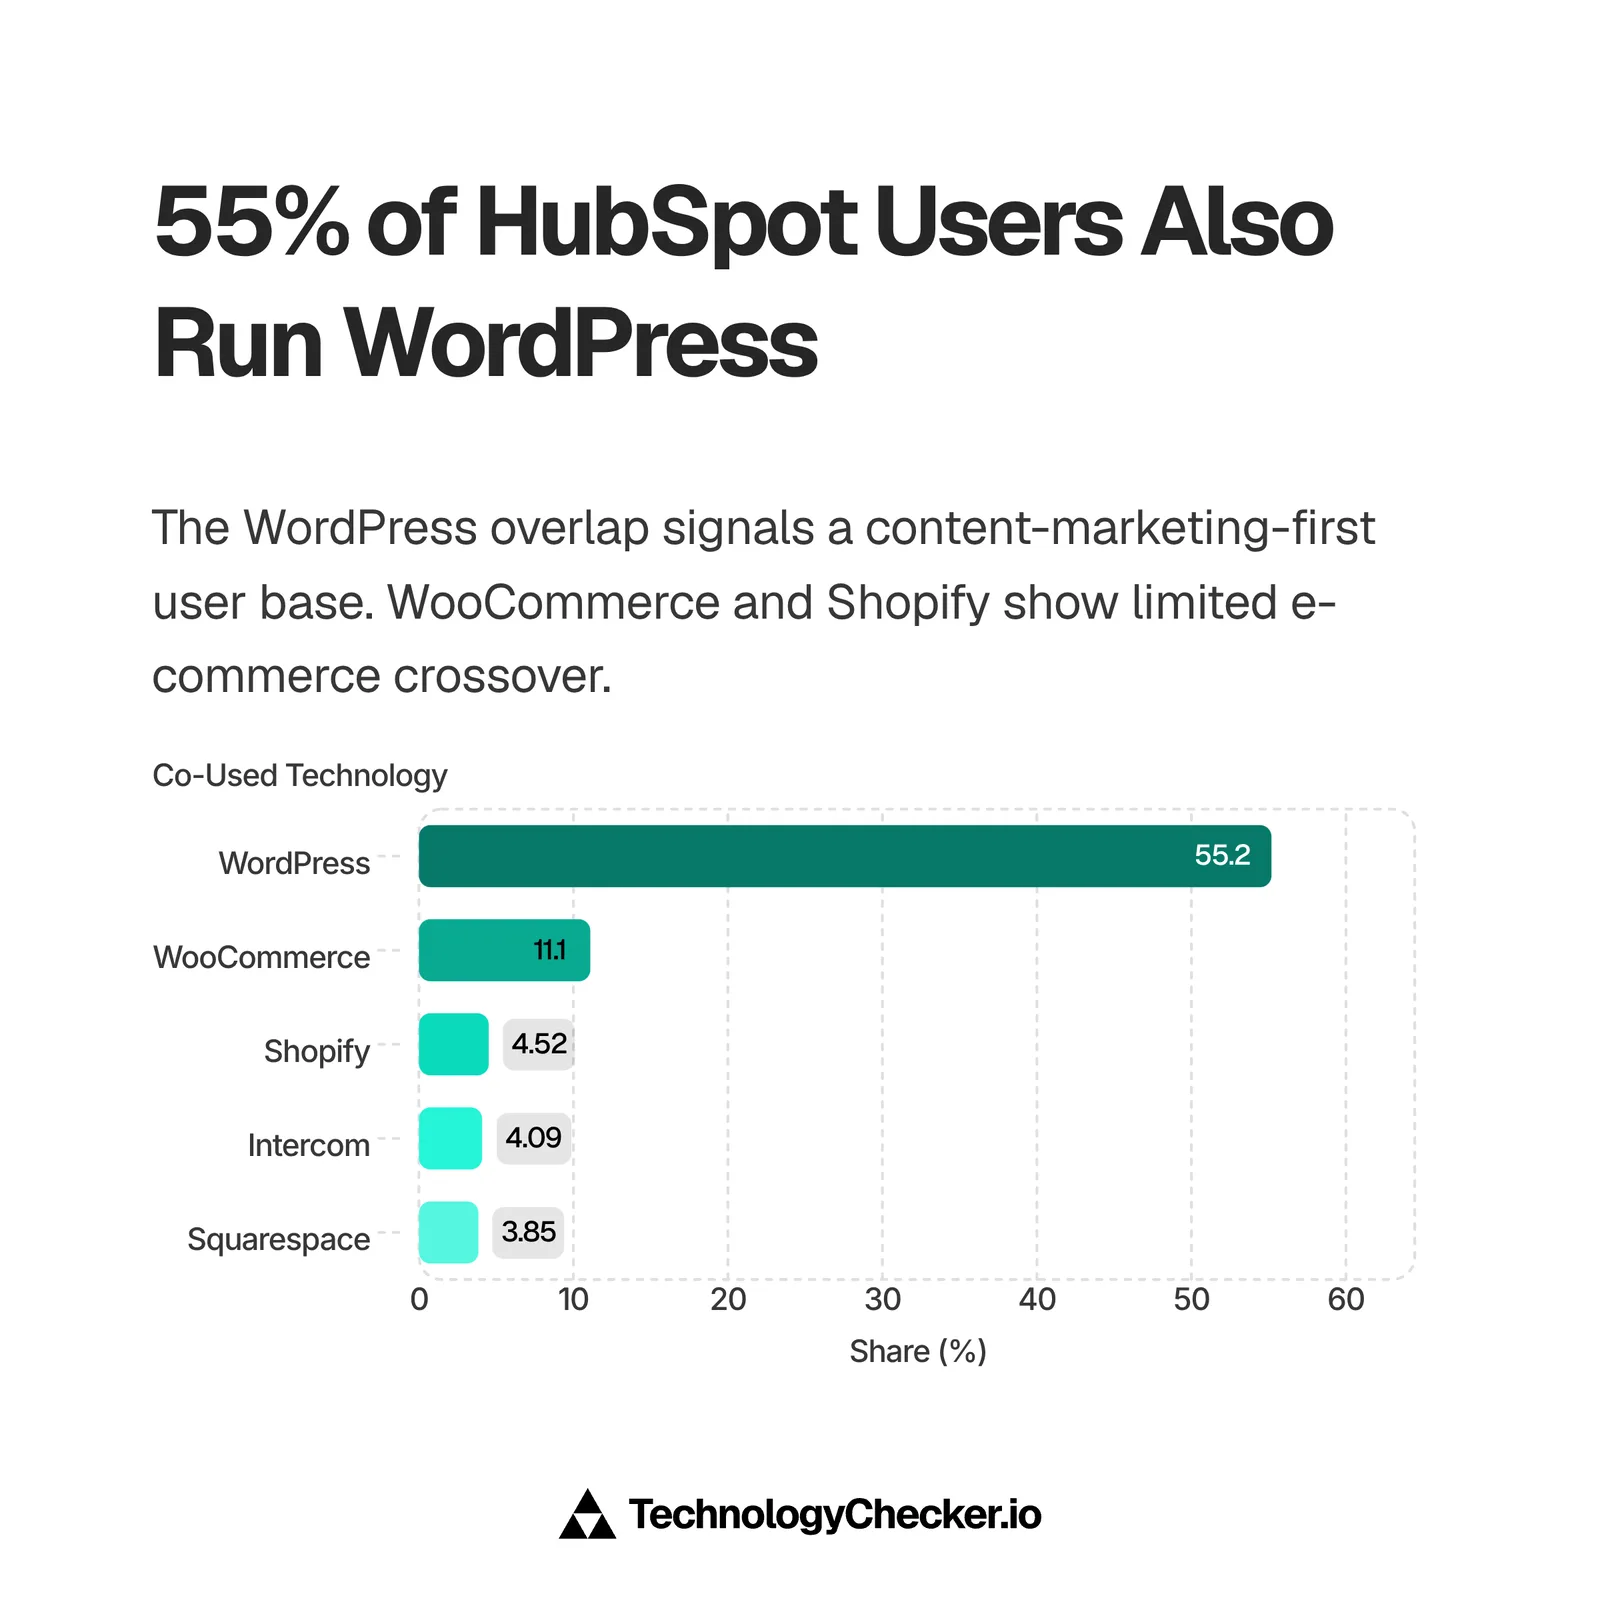
What else do HubSpot companies run? Our co-occurrence analysis across 99,700 enriched companies reveals a clear content-marketing-first pattern.
CMS and Website Platforms
| Technology | Overlap Count | Adoption Rate | Purpose |
|---|---|---|---|
| WordPress | 55,184 | 55.18% | CMS / blogging |
| Squarespace | 3,849 | 3.85% | Website builder |
| Wix | 3,244 | 3.24% | Website builder |
| Drupal | 1,307 | 1.31% | Enterprise CMS |
| Joomla | 558 | 0.56% | CMS |
| Weebly | 321 | 0.32% | Website builder |
WordPress dominates at 55.18% overlap, more than 14x the next CMS. That single number tells you almost everything about the HubSpot user: content-driven B2B businesses that publish regularly and use HubSpot to capture and nurture the leads their content generates. The HubSpot-WordPress pairing is the most common CMS-plus-marketing-automation combination in the entire category.
E-Commerce Platforms
| Technology | Overlap Count | Adoption Rate | Purpose |
|---|---|---|---|
| WooCommerce | 11,090 | 11.09% | WordPress e-commerce |
| Shopify | 4,523 | 4.52% | Hosted e-commerce |
| Ecwid | 3,006 | 3.01% | Embedded store |
| Wix eCommerce | 2,705 | 2.70% | Website-builder store |
| Webflow Ecommerce | 1,699 | 1.70% | Designer e-commerce |
| Magento | 542 | 0.54% | Enterprise e-commerce |
WooCommerce leads e-commerce overlap at 11.09%, which fits the WordPress-heavy base (WooCommerce is a WordPress plugin). Shopify follows at 4.52%. Here's the tension worth flagging: these are exactly the merchants most exposed to the Klaviyo migration from Part 5. A HubSpot customer running WooCommerce or Shopify is running the platform in the segment where HubSpot is weakest and Klaviyo is strongest.
Live Chat Tools
| Technology | Overlap Count | Adoption Rate | Purpose |
|---|---|---|---|
| Intercom | 4,088 | 4.09% | B2B SaaS support chat |
| Brevo | 2,722 | 2.72% | Chat + email |
| Zendesk Embeddables | 1,841 | 1.84% | Support chat |
| Tawk.to | 1,592 | 1.59% | Free live chat |
| LiveChat | 1,312 | 1.31% | Sales chat |
| Tidio | 881 | 0.88% | SMB chat + bots |
Intercom is the top live-chat pairing at 4.09%, which reinforces the B2B SaaS profile. Companies that pair HubSpot with Intercom are running a classic modern B2B stack: content and CRM in HubSpot, product-led support and onboarding in Intercom. The same B2B SaaS crowd shows up from the other side: HubSpot runs on 53.09% of the main websites of companies that publish a Vanta Trust Center. The help-desk side shows the pairing too: HubSpot runs on 10.27% of the websites where our September 2026 crawl finds Help Scout's Beacon widget or Docs site, parked for-sale domains excluded.
What the Tech Stack Tells Us
Three patterns stand out. First, HubSpot companies are content-marketing businesses, full stop. The 55.18% WordPress overlap is the defining signal, far above anything else in the category. Second, the e-commerce overlap (WooCommerce plus Shopify at nearly 16% combined) is both an opportunity and a risk, because those merchants are Klaviyo's prime targets. Third, the Intercom pairing marks the B2B SaaS crowd, HubSpot's most loyal and highest-value segment. If you build tools for HubSpot users, "WordPress plus a standalone email tool" is your single best prospecting filter. Sales-intelligence vendors see the same base from their side: HubSpot runs on 34.47% of the sites where companies that use Apollo.io have installed its visitor tracker, against 3.44% for Salesforce.
One more pattern is worth naming: HubSpot users rarely run a second marketing-automation tool alongside it. Where point tools show up in fragmented stacks with three or four overlapping apps, HubSpot tends to be the single system routing marketing, forms, and CRM. That consolidation is the all-in-one pitch working in practice, and it's exactly why the MailChimp-to-HubSpot upgrade path is so durable: once a business commits, it stops shopping.
Part 7: Notable Companies Using HubSpot

These aren't self-reported logos. Our detection confirms active HubSpot web components on these companies' public domains, often on a specific division or campaign subdomain.
Verified Enterprise Adopters
| Company | Industry | Country | Employees | Founded |
|---|---|---|---|---|
| Siemens | Automation Machinery Mfg. | Germany | 10,001+ | 1847 |
| FedEx | Freight & Package Transport | United States | 10,001+ | 1973 |
| DHL Express | Logistics & Supply Chain | Germany | 10,001+ | 1969 |
| NVIDIA | Computer Hardware Mfg. | United States | 10,001+ | 1993 |
| Novartis | Pharmaceutical Mfg. | Switzerland | 10,001+ | 1996 |
| KPMG | Financial Services | United States | 10,001+ | — |
| McKinsey | Business Consulting | United States | 10,001+ | — |
| RTX (Raytheon) | Aerospace Component Mfg. | United States | 10,001+ | — |
| Fujitsu | IT Services & Consulting | Japan | 10,001+ | 1935 |
| Randstad | Human Resources Services | Netherlands | 10,001+ | 1960 |
| Adecco | Staffing & Recruiting | Switzerland | 10,001+ | 1996 |
| Wolters Kluwer | Software Development | Netherlands | 10,001+ | 1836 |
| Synopsys | Software Development | United States | 10,001+ | 1986 |
| Analog Devices | Semiconductor Mfg. | United States | 10,001+ | 1965 |
| TELUS | Telecommunications | Canada | 10,001+ | 2001 |
| Denso | Motor Vehicle Mfg. | United States | 10,001+ | 1947 |
| Aramark | Hospitality | United States | 10,001+ | 1939 |
| CGI Group | IT Services & Consulting | Canada | 10,001+ | 1976 |
| Edelman | Public Relations | United States | 5,001-10,000 | 1952 |
| Delivery Hero | Technology & Internet | Germany | 10,001+ | — |
What These Brands Tell Us
The diversity is the story. This isn't a list of scrappy startups. You have industrial manufacturing (Siemens, Denso), logistics (FedEx, DHL), Big Four and consulting (KPMG, McKinsey), pharma (Novartis), semiconductors (NVIDIA, Analog Devices, Synopsys), and PR (Edelman). Most of these enterprises run HubSpot on a specific subdomain, a careers portal, a regional campaign, or a single business unit, rather than company-wide. That's the enterprise pattern: HubSpot lands in one team, proves value, and coexists with heavier systems elsewhere.
Two clusters stand out. Professional and IT services firms (McKinsey, KPMG, Fujitsu, CGI, Edelman, Randstad, Adecco) are over-represented, which matches the industry data from Part 4 where consulting and services dominate. And the European enterprise presence (Siemens, DHL, Novartis, Wolters Kluwer, Delivery Hero, Randstad) reinforces the 25% European footprint we found in the geographic breakdown. For mid-market buyers, that enterprise adoption is a due-diligence checkmark, even if these giants use it narrowly.
How Enterprises Actually Deploy HubSpot
Look at the detection URLs behind these brands and a pattern appears. Siemens runs HubSpot on its Additive Manufacturing Network blog. FedEx uses it for a custom-boxes division. DHL runs it on Latin America operations. Novartis uses it for virtual event platforms. Delivery Hero runs it on a careers portal. None of these giants runs HubSpot as its company-wide system of record. They deploy it where speed matters more than deep customization: a campaign, a microsite, or a single team that needed to launch without waiting on an enterprise rollout.
That's the land-and-expand pattern, and it's good news for HubSpot. Every narrow deployment is a foothold inside a 10,000-plus-person company. The open question is whether those footholds expand across the org or stay contained to one team.
Part 8: What Users Actually Say (HubSpot Reviews Analysis)

We analyzed aggregated review data from G2 to understand real user sentiment. Total review mentions across categories exceed 12,500, a statistically meaningful sample.
Top Praised Features
| Rank | What Users Like | Mentions |
|---|---|---|
| 1 | Easy to use for campaign management and daily work | 3,102 |
| 2 | All-in-one integration of marketing, sales, and data | 1,408 |
| 3 | User-friendly email marketing features | 1,350 |
| 4 | Intuitive interface for campaign creation | 1,274 |
| 5 | Smooth automation that simplifies team workflows | 1,213 |
Top Complaints
| Rank | What Users Dislike | Mentions |
|---|---|---|
| 1 | Missing features in social media and Sales Hub integration | 953 |
| 2 | Steep learning curve for template customization | 951 |
| 3 | Limited features affecting overall usability | 940 |
| 4 | Pricing steep for startups and solo creators | 763 |
| 5 | Complexity in reporting and setup | 589 |
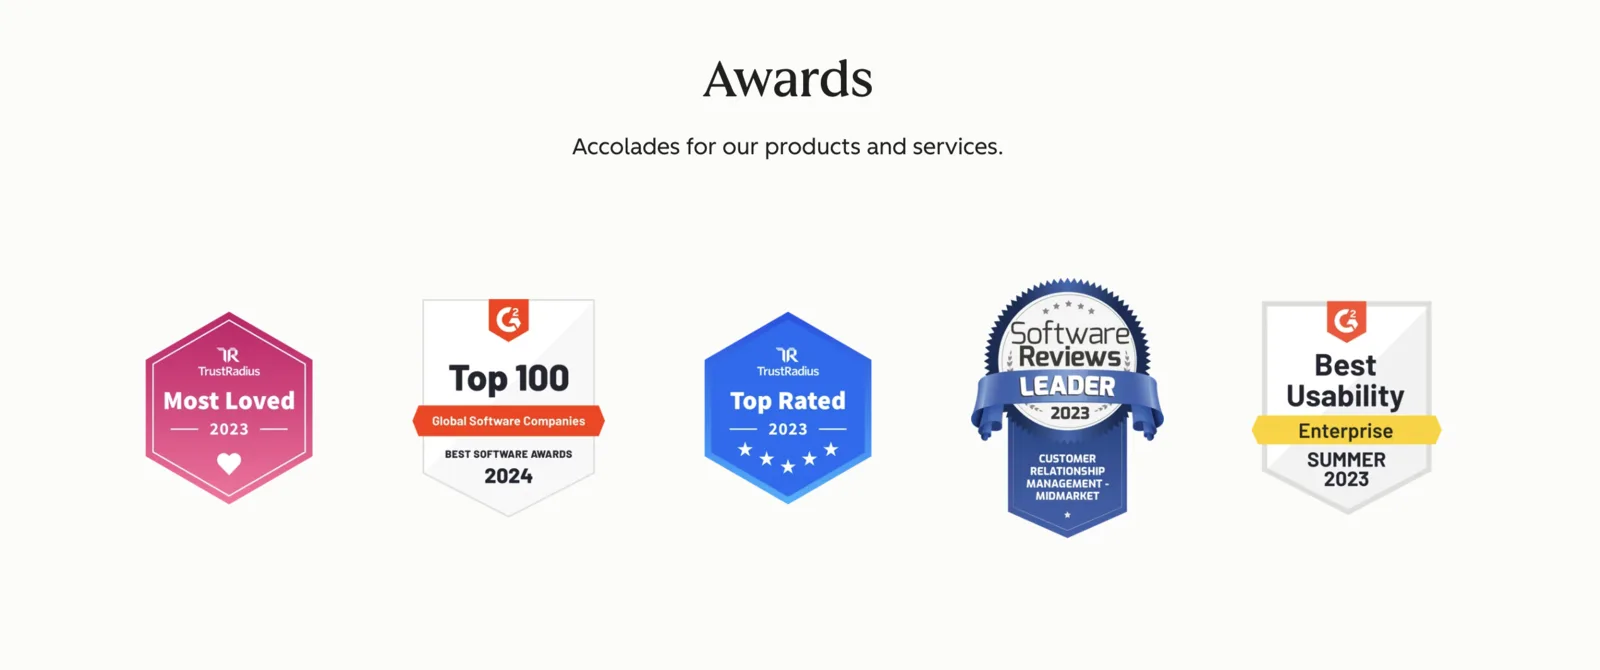
HubSpot's sentiment scores show up in third-party recognition, too. It has collected usability and mid-market CRM awards from G2, TrustRadius, and SoftwareReviews:
What the Sentiment Data Reveals
The praise-to-complaint ratio is strongly favorable. The top praise ("easy to use," 3,102 mentions) has more than triple the mentions of the top complaint ("missing features," 953). Ease of use is HubSpot's signature strength, and it shows up in the migration data too: the MailChimp-to-HubSpot corridor exists partly because HubSpot is approachable enough that non-technical marketers can run it.
The complaints cluster around two themes. First, feature gaps, especially in social media and deeper Sales Hub integration (953 + 940 mentions for missing and limited features). Second, cost. The 763 pricing mentions map directly to the migration losses from Part 5, because budget-conscious users who feel the pinch have somewhere cheaper to go, whether that's businesses using MailerLite or companies using Brevo, and e-commerce users have somewhere more specialized (Klaviyo).
"HubSpot's 12.8% mid-market share is roughly double what we see in email-only tools. That gap creates a clear upsell path for companies outgrowing simpler platforms." — Mehmet Suleyman, CEO, TechnologyChecker.io
The pricing complaint deserves nuance. HubSpot's free CRM tier is genuinely generous, which is what drives the massive 1-10 employee base (52.56%). The friction hits when small teams need automation, custom reporting, or advanced segmentation, and the jump from free to paid Hubs feels steep. That's the exact moment a startup weighs a cheaper point tool against HubSpot's all-in-one convenience.
How Sentiment Aligns with Migration Data
Cross-referencing the G2 complaints with the migration data from Part 5 shows the two datasets telling the same story. The 763 pricing complaints map to the losses to cheaper tools: MailerLite took 1,832 companies and Brevo took 1,721, both plays for budget-conscious teams feeling the free-to-paid jump.
The 953 "missing features" complaints, concentrated in social media and commerce, map to the Klaviyo bleed. When an e-commerce brand hits a commerce-email gap, Klaviyo is the destination, which is why that corridor runs 5.6:1 against HubSpot. The reviews aren't just opinions. They're leading indicators of exactly where the platform loses customers.
Part 9: What You Can Do With This Data
Raw statistics only matter if you can act on them. Here's how different readers can use this HubSpot data.
If you're evaluating HubSpot
- Match the platform to your business model. HubSpot is built for content-driven B2B. If you're a software, IT services, or consulting company in the 1-200 employee range, you're squarely in its sweet spot (Part 4). If you're an e-commerce brand, weigh the Klaviyo migration data (Part 5) seriously before committing.
- Budget for the jump past free. The free CRM is generous, but the 763 pricing complaints (Part 8) are real. Plan for the tier upgrade you'll need once you want automation and custom reporting, not just the entry price.
- Check the migration corridors. If you're on MailChimp and need a CRM, you'd be joining a well-worn path (11,866 companies made that move). See live migration data on our HubSpot technology profile.
If you're already using HubSpot
- Audit your stack against the norms. If you're running HubSpot without WordPress (55.18% of HubSpot companies do) or a connected CRM workflow, you may be under-using the platform. The tech-stack data in Part 6 is your benchmark.
- Watch your e-commerce exposure. If you run WooCommerce or Shopify alongside HubSpot, evaluate whether HubSpot's commerce features meet your needs before Klaviyo's 5.6:1 pull becomes your story too.
- Use the free-to-paid moment deliberately. The expansion from free CRM into paid Hubs is where HubSpot's value compounds. Map which Hub (Sales, Service, Content) solves your next bottleneck rather than upgrading blindly.
If you sell products or services to HubSpot users
- Target the ICP. The typical HubSpot company has 1-10 employees, is in Software, IT Consulting, or Advertising, sits in the US, UK, or Germany, and was founded 2010-2019 (Part 4). That's your prospect list starting point.
- Filter by "WordPress plus standalone email." Any company running WordPress with a separate email tool like MailChimp or ConvertKit is a prime HubSpot-adjacent prospect. The 55.18% WordPress overlap makes this your highest-yield filter.
- Time outreach to migration signals. Companies that just switched from MailChimp to HubSpot are in "new platform" mode, evaluating integrations and complementary tools. That's a 3-6 month window of heightened buying activity.
If you compete with HubSpot
- Attack the e-commerce gap. HubSpot loses to Klaviyo 5.6:1 in e-commerce email (Part 5). If your product serves online retail, HubSpot's commerce-focused customers are your warmest prospects.
- Compete on price at the free-to-paid cliff. The 763 pricing complaints concentrate at the moment small teams outgrow the free tier. A cheaper, simpler alternative resonates there.
- Watch the 289,752 previously-used domains. These are companies that dropped HubSpot components. Cross-reference them with current detection to find businesses with marketing-automation budgets and HubSpot experience but no current platform. Browse the full field on our Marketing Automation category page.
Frequently Asked Questions
What is HubSpot's market share in 2026?
HubSpot holds 7.76% of the Marketing Automation category, ranking #3 behind MailChimp (18.11%) and Klaviyo (9.43%), based on our detection across 50M+ domains. That ranking reflects raw domain count in a category dominated by email-first tools. HubSpot's CRM-integrated model gives it a distinct edge in B2B that a domain-count ranking doesn't capture. See Part 2 for the full competitive breakdown.
How many companies use HubSpot?
HubSpot reported more than 288,000 customers at the end of 2025. Our detection data tracks 121,300 domains with active HubSpot web components, enriched with company data for 99,700 of them. The gap exists because our detection captures web-facing components, though at a ~42% rate that's far higher than server-side platforms. For live company data, check our HubSpot technology profile.
What is HubSpot's revenue in 2026?
HubSpot reported FY2025 revenue of $3.13 billion, up 19% year-over-year, with subscription revenue of $3.06 billion. For full-year 2026, the company guided to $3.69 billion to $3.70 billion, up 18% as-reported. HubSpot crossed $3 billion in annual revenue for the first time in 2025. See Part 1 for the full financial breakdown and free-cash-flow figures.
Which is better, HubSpot or Salesforce?
It depends on your size and needs. HubSpot is easier to set up and stronger for inbound marketing, with 3,102 G2 mentions praising ease of use. Salesforce offers deeper customization for enterprise sales teams. Our data shows 75.82% of HubSpot customers have 50 or fewer employees, making it the stronger choice for small and mid-market B2B companies that don't need Salesforce-level complexity. Our Salesforce statistics report covers the enterprise side.
What industries use HubSpot the most?
Software Development leads at 8.54%, followed by IT Services and IT Consulting (6.59%), Advertising Services (5.65%), and Business Consulting (4.88%), based on our analysis of 99,700 enriched companies. The top five industries are all technology or professional services, confirming HubSpot's B2B focus. Financial Services (3.62%) and Real Estate (2.67%) round out the top verticals. The full top 10 is in Part 4.
Is HubSpot good for small businesses?
Our data shows 52.56% of detected HubSpot companies have 1-10 employees, making micro-businesses the single largest segment. HubSpot's free CRM tier, generous contact limits, and user-friendly interface (3,102 G2 ease-of-use mentions) make it accessible for lean teams. However, G2 reviewers cite pricing as a pain point (763 mentions), so budget for a 2-3 month ramp and the eventual jump from free to paid Hubs.
Does HubSpot integrate with WordPress?
Yes, and it's the most common pairing by a wide margin. Our tech-stack data shows 55.18% of HubSpot companies also run WordPress, roughly 14x the next CMS (Squarespace at 3.85%). The integration lets WordPress sites track visitors, capture leads through forms, and sync contacts into HubSpot's CRM without leaving the site. See Part 6 for the full tech-stack breakdown.
How does HubSpot compare to Klaviyo?
HubSpot is a full CRM suite built for B2B, while Klaviyo focuses on e-commerce email and SMS. Our market-share data shows HubSpot at 7.76% versus Klaviyo at 9.43%. The migration data is more revealing: 3,741 companies switched from HubSpot to Klaviyo while only 671 came back, a 5.6:1 ratio favoring Klaviyo for e-commerce. Choose based on whether your business is content-driven B2B or transactional retail.
What are the disadvantages of HubSpot?
Based on aggregated G2 reviews, the most-cited disadvantages are missing features in social media and Sales Hub integration (953 mentions), a steep learning curve for template customization (951 mentions), and pricing that's steep for startups (763 mentions). Our migration data also shows HubSpot losing e-commerce customers to Klaviyo (5.6:1) and agency customers to HighLevel (2.7:1). See Part 5 and Part 8 for detail.
Can HubSpot replace Salesforce?
For many small and mid-market B2B companies, yes. HubSpot's CRM handles contact management, deal pipelines, and reporting that previously required Salesforce. Our data shows 75.82% of HubSpot customers have 50 or fewer employees, a segment where Salesforce's complexity often isn't justified. Enterprise teams with highly customized sales processes may still need Salesforce's deeper configuration, which is why the 51-200 mid-market band (12.77%) is HubSpot's key battleground.
Conclusion: HubSpot's Position in 2026
The data paints a clear, two-sided picture. HubSpot enters 2026 as a financially strong platform ($3.13 billion revenue, 19% growth, $594.9 million free cash flow) that dominates the "upgrade from basic email" market and owns the B2B mid-market. But it's in a real competitive fight on its flanks, losing e-commerce to Klaviyo and agencies to HighLevel.
The Numbers Tell the Story
- $3.13 billion FY2025 revenue — up 19%, crossing $3B for the first time, with 288,706 customers across 135+ countries
- First GAAP-profitable year (2025) — +$7.4M operating profit and +$45.9M net income, on an 83.7% gross margin
- 121,300 active web-detected domains — grown more than 5x since 2019
- 7.76% Marketing Automation share (#3) — but the clear leader in CRM-integrated marketing
- 52.56% micro-business, 12.77% mid-market — the mid-market concentration is the real differentiator
- 2.5:1 win over MailChimp, 5.6:1 loss to Klaviyo — HubSpot wins B2B consolidation, loses e-commerce specialization
- 55.18% WordPress overlap — the defining signal of a content-marketing-first user base
Why HubSpot Keeps Winning (and Where It Struggles)
- The free-CRM flywheel. A genuinely generous free tier pulls in micro-businesses at scale (52.56% have 1-10 employees), then land-and-expand grows revenue per customer, which lifted ARPU to $11,683.
- Mid-market ownership. The 12.77% concentration in 51-200 employee companies, roughly double email-only competitors, is HubSpot's structural moat: too big for MailChimp, not complex enough to need Salesforce.
- The e-commerce gap. The 5.6:1 loss to Klaviyo is the one metric that should worry HubSpot. Online retailers keep leaving, and HubSpot's commerce features haven't closed the gap.
What to Watch Next
The Klaviyo corridor is the metric to track. If e-commerce customers keep leaving at 5.6:1, HubSpot's addressable market narrows to pure B2B, which is fine but caps the growth story. The HighLevel threat is the second signal, because 96.6% of its gains from HubSpot came in the last three years, and it's targeting the agency segment HubSpot has historically owned. Watch whether HubSpot's AI push (Breeze) and any commerce investment slow those two corridors.
Two 2026 product moves are worth watching on top of that. HubSpot launched AEO (answer engine optimization) to help customers surface inside AI search results, a tacit admission that the same GEO shift reshaping our own detection data is now a product category HubSpot sells into. And it moved its Customer Agent and Prospecting Agent to outcomes-based pricing, where you pay only when the agent completes a task. That change aims squarely at the friction behind the #4 G2 complaint (763 mentions of steep pricing) and the migration losses to cheaper tools in Part 5.
For sales teams, marketers, and buyers evaluating marketing automation, the bottom line is this: HubSpot in 2026 is a $3.13 billion platform that wins decisively in content-driven B2B and the mid-market, and loses in specialized e-commerce. Pick it if that's where your business lives.
This report is based on data collected through mid-2026. We update our technology detection data monthly across 50M+ domains. Bookmark the HubSpot technology profile for real-time data between report updates, or browse the full Marketing Automation category for competitive market insights.

Product Marketing Manager
7+ years of experience
Sophie leads product marketing at TechnologyChecker, translating complex technology intelligence into compelling narratives for sales teams.
- BSc Business Management, University of Manchester
- Pragmatic Institute Certified Product Marketer
- Certified Scrum Product Owner (CSPO)
Never miss our research