Black Friday Statistics 2026: Traffic, Bots and Attacks
Black Friday statistics from Cloudflare Radar: in 2025, Cyber Monday drew more human web traffic (+4.0%) than Black Friday (+2.9%), and bots held near 28.5%.
Published •Data through December 2025•20 min read
Black Friday statistics from Cloudflare Radar show that Cyber Monday, not Black Friday, was the busiest day for human web traffic in the 2025 holiday window: up 4.0% worldwide against the three previous Mondays, versus 2.9% for Black Friday. Bot share slipped to 28.5% on Black Friday, while mobile rose to 45.2% of requests.
Most Black Friday pages are sales dossiers: what Americans spent online, and how much more than last year. This one measures what the internet did. I pulled day-level, country-level and hour-level data from Cloudflare Radar for November 1 to December 8, 2025, and compared each shopping day with the same weekday in the three weeks before it.
The traffic story doesn't match the sales story. Black Friday was a bigger internet event in South Africa, Canada, Germany and the UK than in the US, where traffic peaked on Cyber Monday, at 9 pm Eastern. Bots didn't surge, attacks didn't peak, and the scam share of malicious email nearly doubled. We'll update this post with Black Friday 2026 numbers the week after Cyber Monday 2026.
Did Black Friday Actually Spike Internet Traffic in 2025?
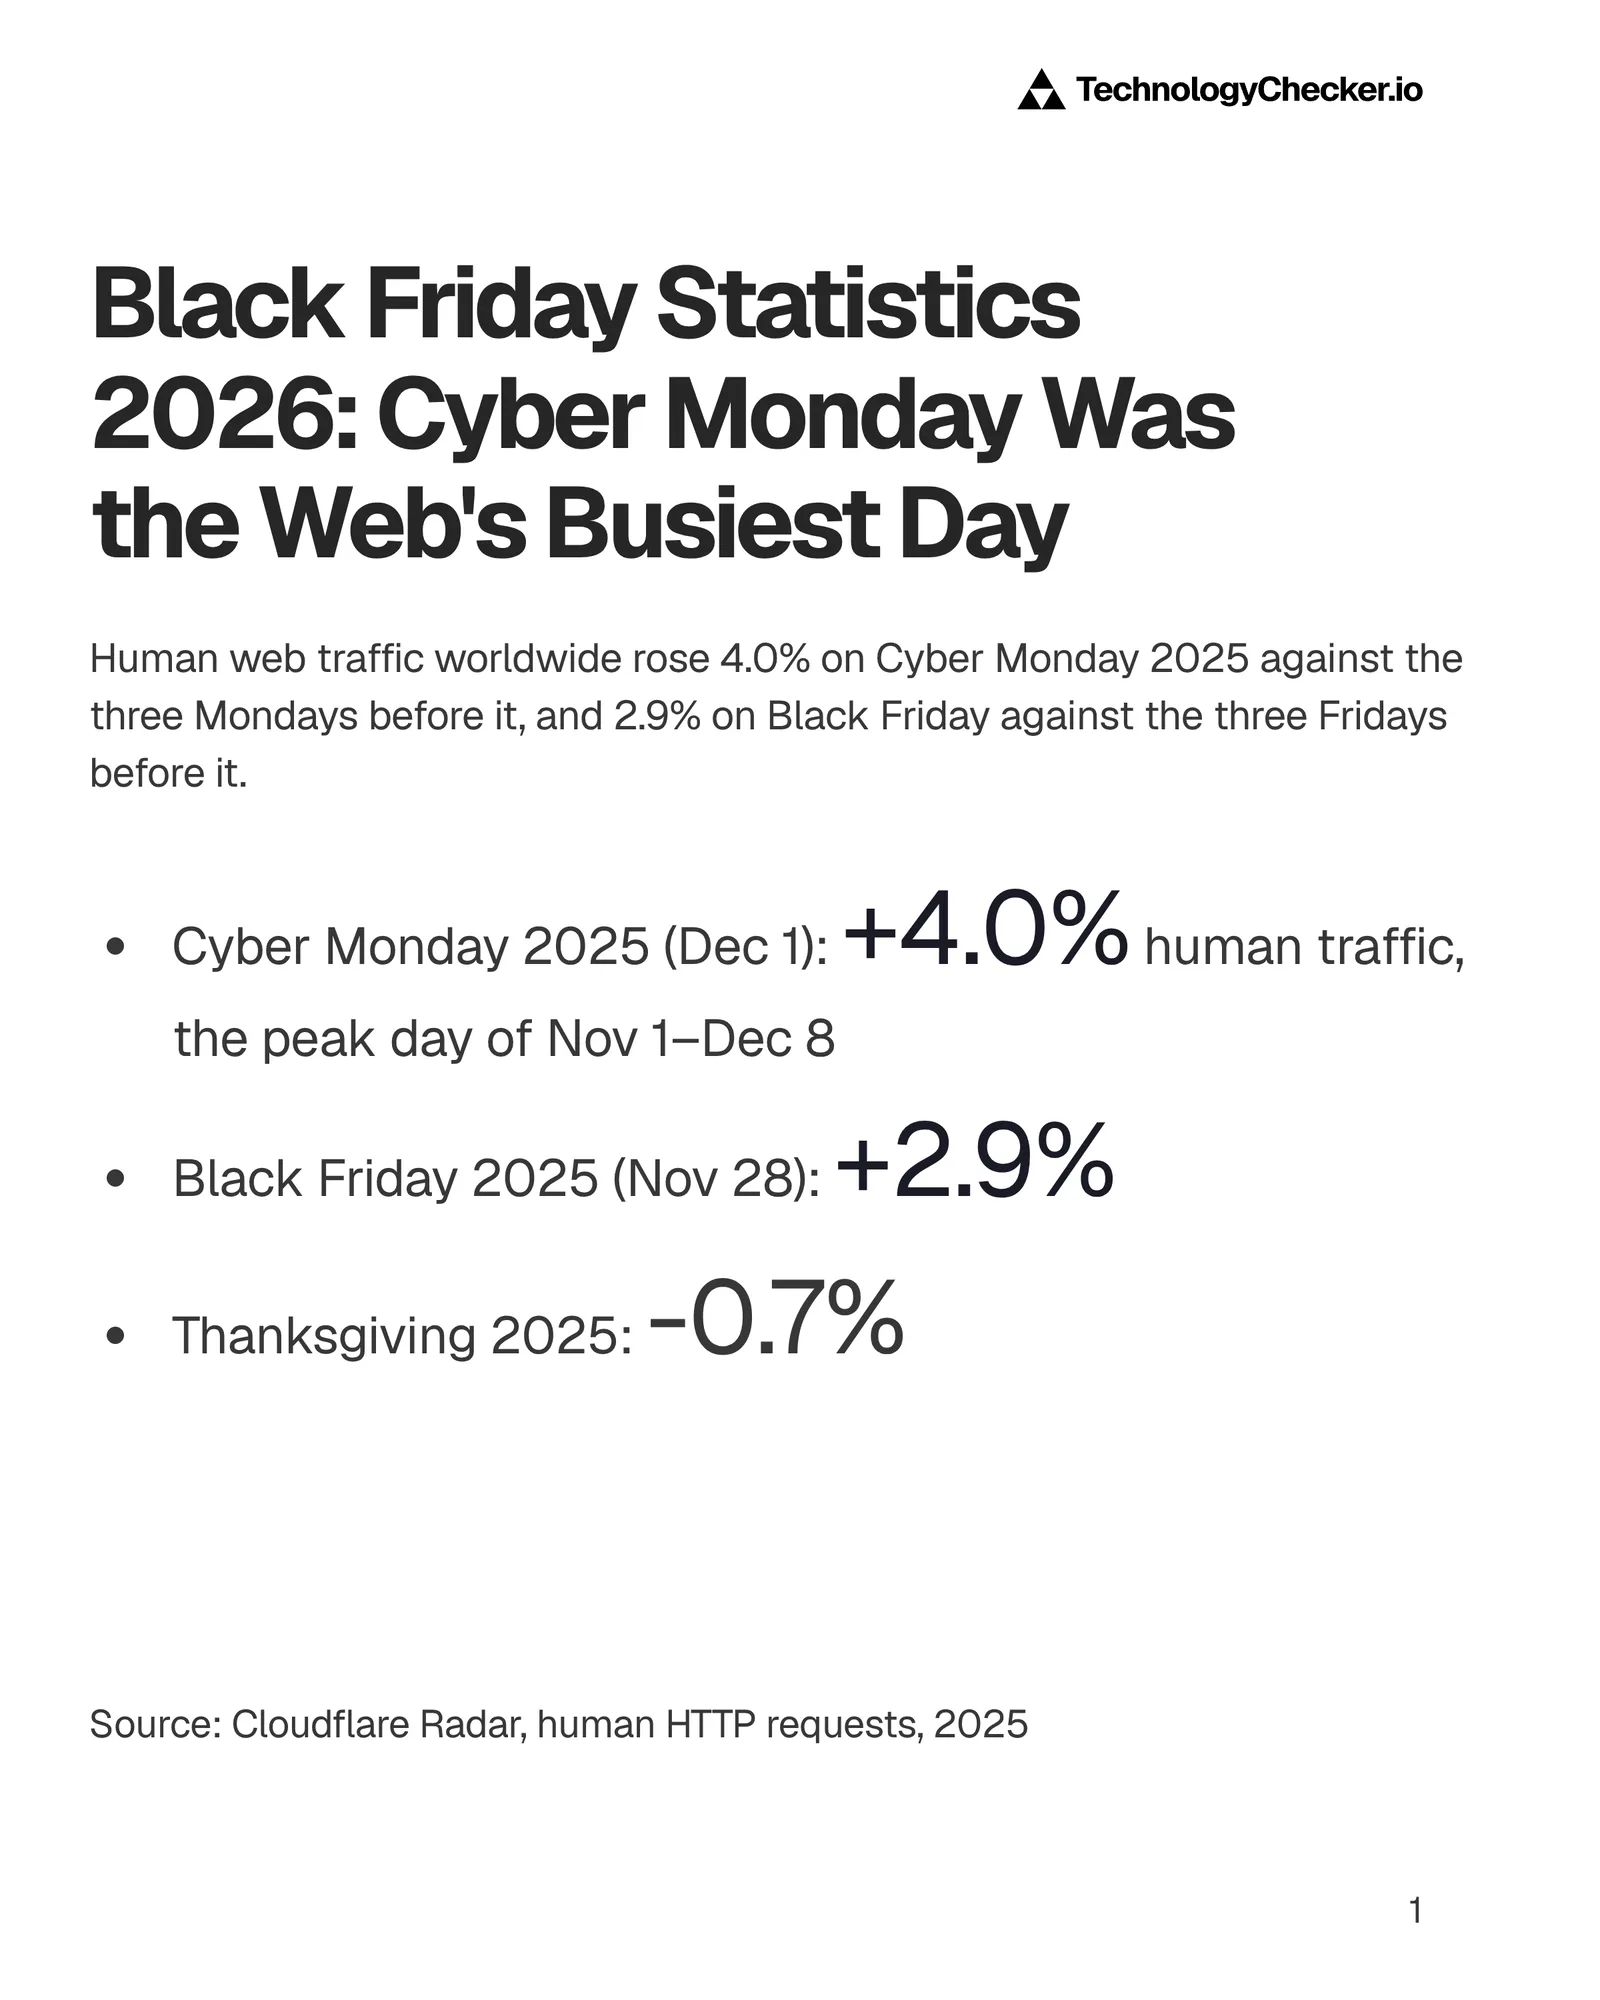
radar/http/timeseries (human requests), November 1 – December 8, 2025Black Friday lifted internet traffic in 2025, but by less than any other day of the shopping weekend: worldwide human requests rose 2.9% against the average of the three previous Fridays.
| Day (2025, UTC) | Worldwide human traffic vs the three previous same weekdays |
|---|---|
| Thanksgiving, Thu Nov 27 | −0.7% |
| Black Friday, Fri Nov 28 | +2.9% |
| Saturday, Nov 29 | +4.7% |
| Sunday, Nov 30 | +3.7% |
| Cyber Monday, Mon Dec 1 | +4.0% (busiest day of the window) |
Source: Cloudflare Radar, radar/http/timeseries (botClass=LIKELY_HUMAN, daily), November 1 – December 8, 2025.
Black Friday is NOT the internet's busiest day of the shopping season: Cyber Monday reached the top of Radar's human-traffic index (1.0) for the whole November 1 to December 8 window. The Saturday had the biggest lift, but Saturdays start from a lower base than Mondays, so Cyber Monday's 4.0% on a normal Monday's volume still made it the high point. The worldwide figure also averages in every country where Black Friday barely registers, so the US and country views below are sharper.
Why did US traffic peak on Cyber Monday instead of Black Friday?
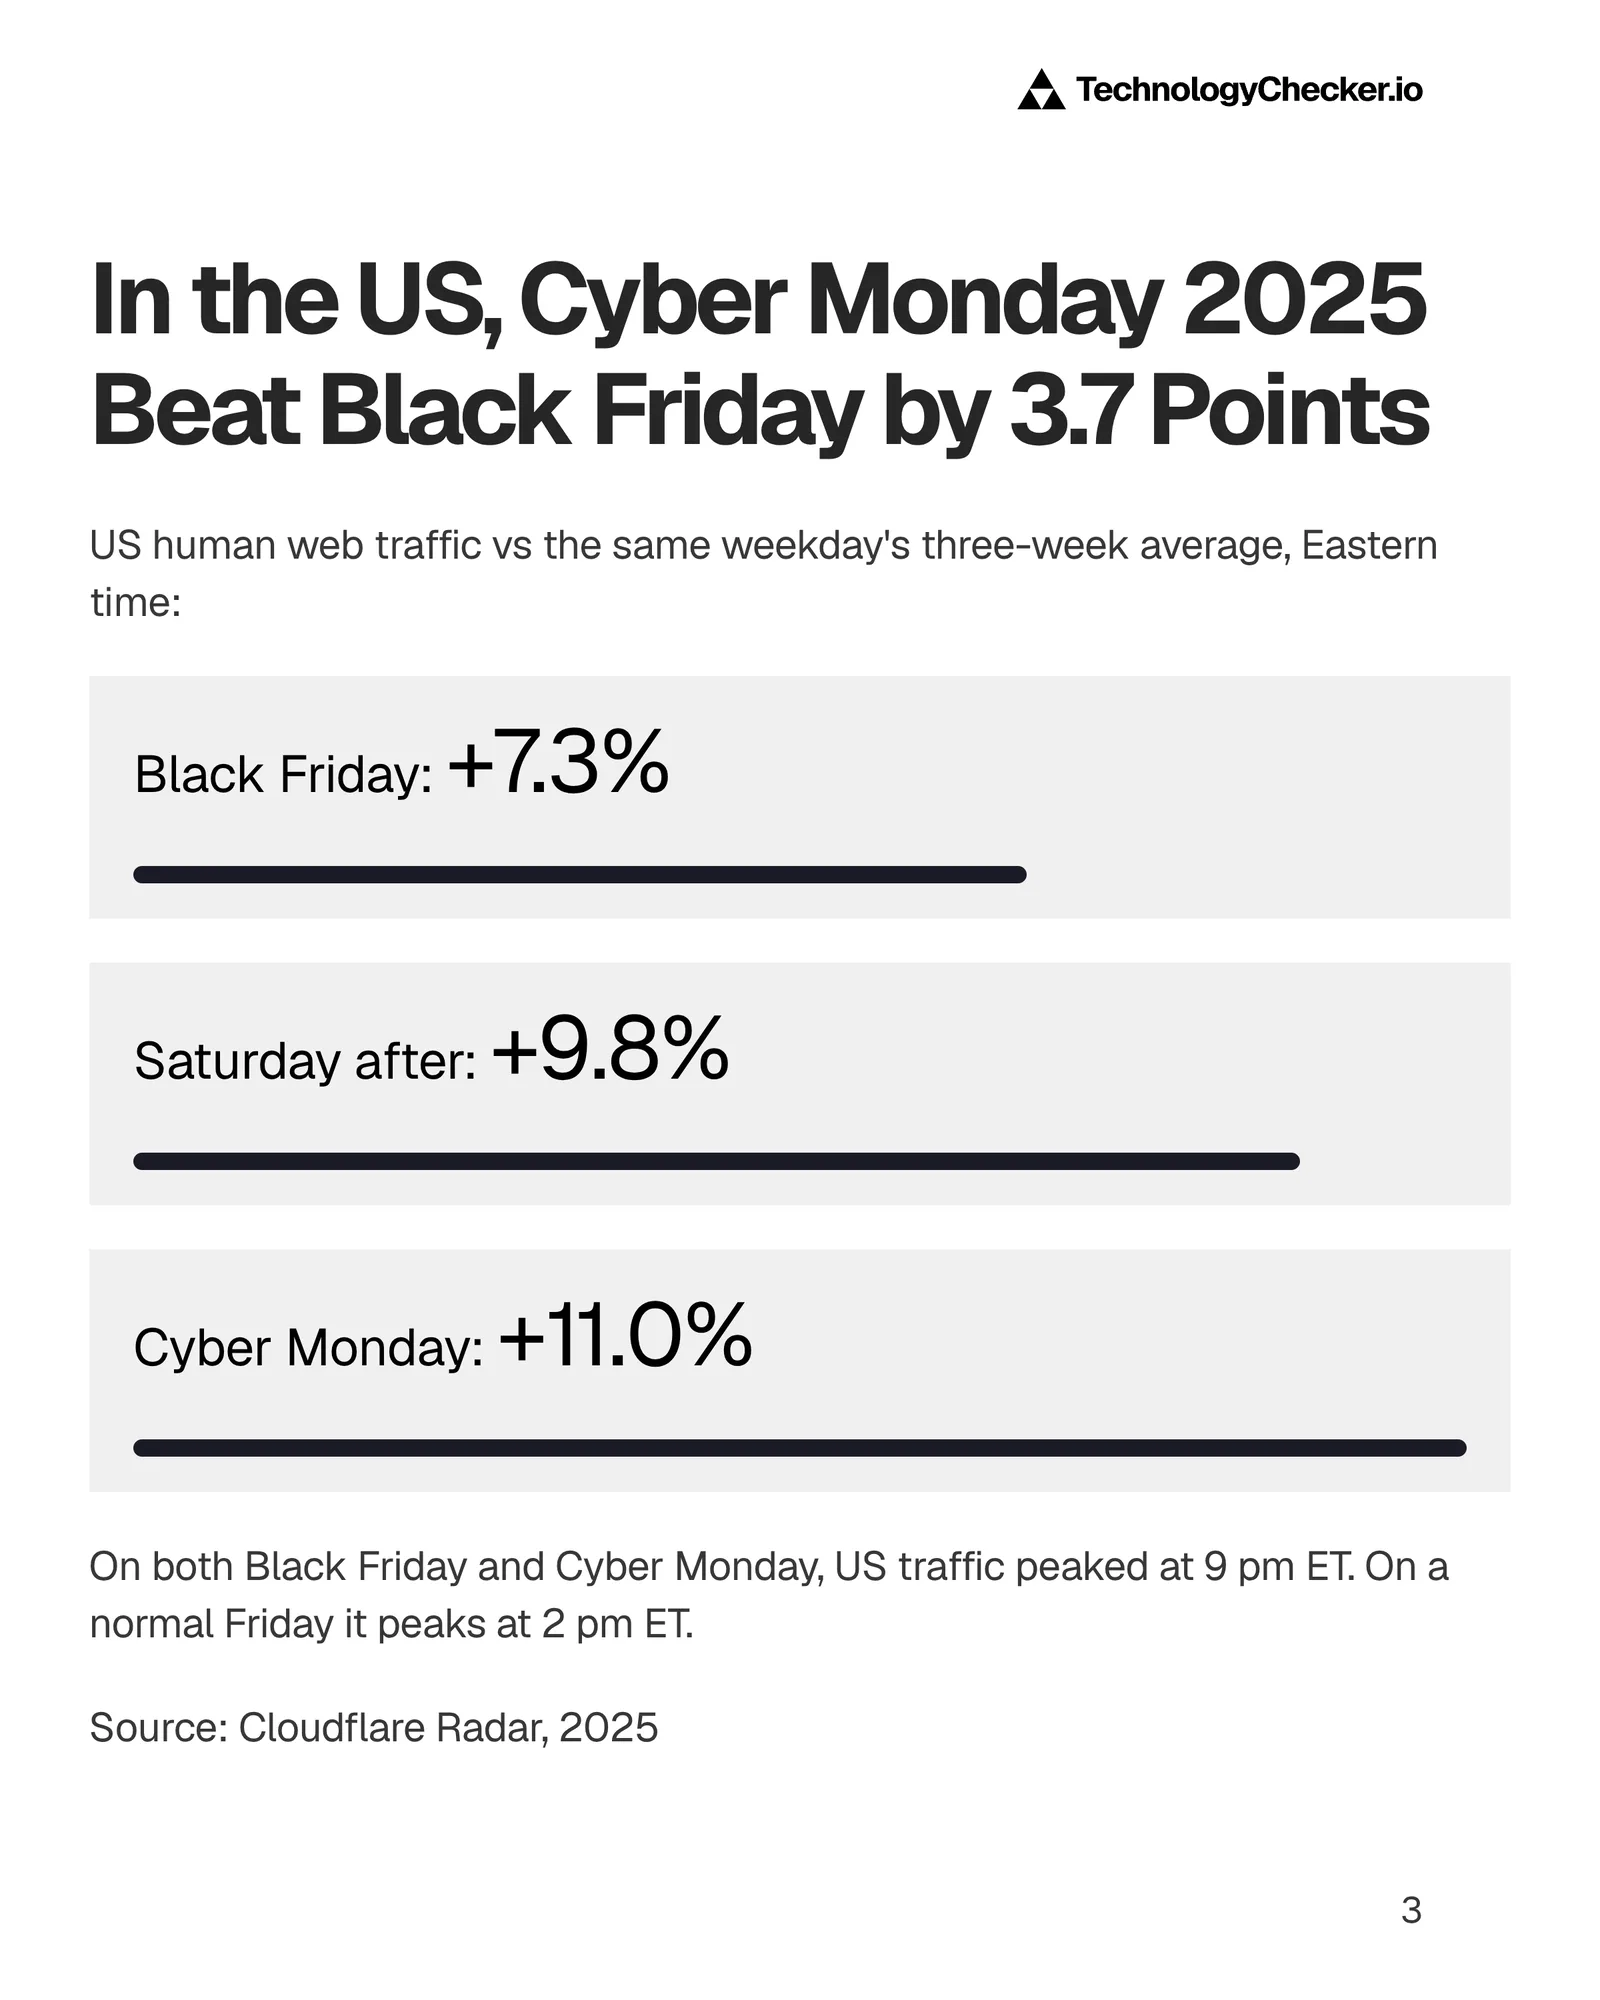
radar/http/timeseries, location=US, Eastern-time days, November 1 – December 8, 2025US human traffic climbed with each day of the weekend and peaked on Cyber Monday. Measured on Eastern-time days, it was up 7.3% on Black Friday, 9.8% on the Saturday and 11.0% on Cyber Monday against the three previous same weekdays. On the raw index, Cyber Monday carried 7.8% more human traffic than Black Friday.
The peak hour moved too. The three Fridays before peaked at 2 pm ET (19:00 UTC) and the Mondays before between 2 and 4 pm ET, but Black Friday and Cyber Monday both peaked at 9 pm ET (02:00 UTC). I read that as shopping traffic piling into the evening, outside working hours.
What Did Shoppers Spend on Black Friday 2025?
According to Adobe, US shoppers spent a record $11.8 billion online on Black Friday 2025, up 9.1%, and $14.25 billion on Cyber Monday, up 7.1%. Here are the headline Black Friday sales statistics in one table, each from the organisation that published it.
| Black Friday numbers, 2025 | Figure | vs 2024 | Source |
|---|---|---|---|
| US online spend, Black Friday (Nov 28) | $11.8 billion | +9.1% | Adobe |
| US online spend, Cyber Monday (Dec 1) | $14.25 billion | +7.1% | Adobe |
| US online spend, Cyber Week (Thanksgiving to Cyber Monday) | $44.2 billion | +7.7% | Adobe |
| Global Cyber Week sales (Nov 25 – Dec 1) | $336.6 billion | +7% | Salesforce |
| Shopify merchants' sales, Black Friday to Cyber Monday | $14.6 billion | +27% | Shopify |
| US shoppers, Thanksgiving to Cyber Monday | 202.9 million (record) | 197 million in 2024 | NRF |
| US online shoppers, Cyber Monday | 75.9 million | 64.4 million in 2024 | NRF |
Two details line up with the traffic data. Adobe put Cyber Monday's peak spending at $16 million per minute between 8 pm and 10 pm, so the money, like the traffic, arrived in the evening. And NRF counted 85.7 million online shoppers on Black Friday, fewer than in 2024, while Cyber Monday's online count rose by more than 11 million. Shopify's busiest minute came at midday instead: $5.1 million per minute at 12:01 pm EST on Black Friday.
Is Black Friday a Bigger Internet Event Outside the US?
Yes. On local-time days, Black Friday lifted human traffic more in South Africa (+16.8%), Canada (+11.3%), Germany (+11.2%) and the United Kingdom (+11.1%) than in the United States (+7.3%). In 13 of the 18 countries I checked, Black Friday was the biggest of the three shopping days.
| Country | Black Friday | Saturday after | Cyber Monday |
|---|---|---|---|
| South Africa | +16.8% | +7.6% | +3.5% |
| Canada | +11.3% | +5.4% | +5.7% |
| Germany | +11.2% | +4.5% | +4.2% |
| United Kingdom | +11.1% | +7.3% | +7.2% |
| Sweden | +9.6% | +3.3% | +1.2% |
| Australia | +9.2% | +6.6% | +3.9% |
| France | +8.2% | +6.3% | +5.7% |
| Poland | +8.0% | +6.6% | +5.3% |
| Spain | +7.7% | +5.5% | +5.9% |
| United States | +7.3% | +9.8% | +11.0% |
| Netherlands | +6.7% | +3.5% | +2.5% |
| Brazil | +6.0% | +1.1% | +4.0% |
| Italy | +5.0% | +3.5% | +3.2% |
| Turkey | +3.6% | +4.0% | +12.0% |
| Mexico | +3.0% | +0.9% | +0.4% |
| India | +2.3% | +2.8% | +3.0% |
| Japan | +1.5% | +3.5% | +1.3% |
| Argentina | +0.1% | +9.0% | +7.4% |
Source: Cloudflare Radar, radar/http/timeseries by location, human requests grouped into local-time days, November 1 – December 8, 2025. Bold marks each country's biggest day.
Five countries broke the pattern:
- The US and Turkey peaked on Cyber Monday. Turkey's +12.0% is the largest Cyber Monday lift in the table.
- Argentina barely noticed Black Friday (+0.1%) and peaked on the Saturday, as did Japan.
- India's three days sat within 0.7 points of each other, highest on Cyber Monday.
Mexico followed the Black Friday pattern but hardly moved (+3.0%). Its own retail event, El Buen Fin, runs in mid-November, and Mexico's busiest human-traffic day in the window was November 13, 2025. We didn't measure Buen Fin separately, so treat that as context. For cross-border sellers, each market's row is a better planning number than the worldwide +2.9%.
How Much Black Friday Traffic Was Bots?
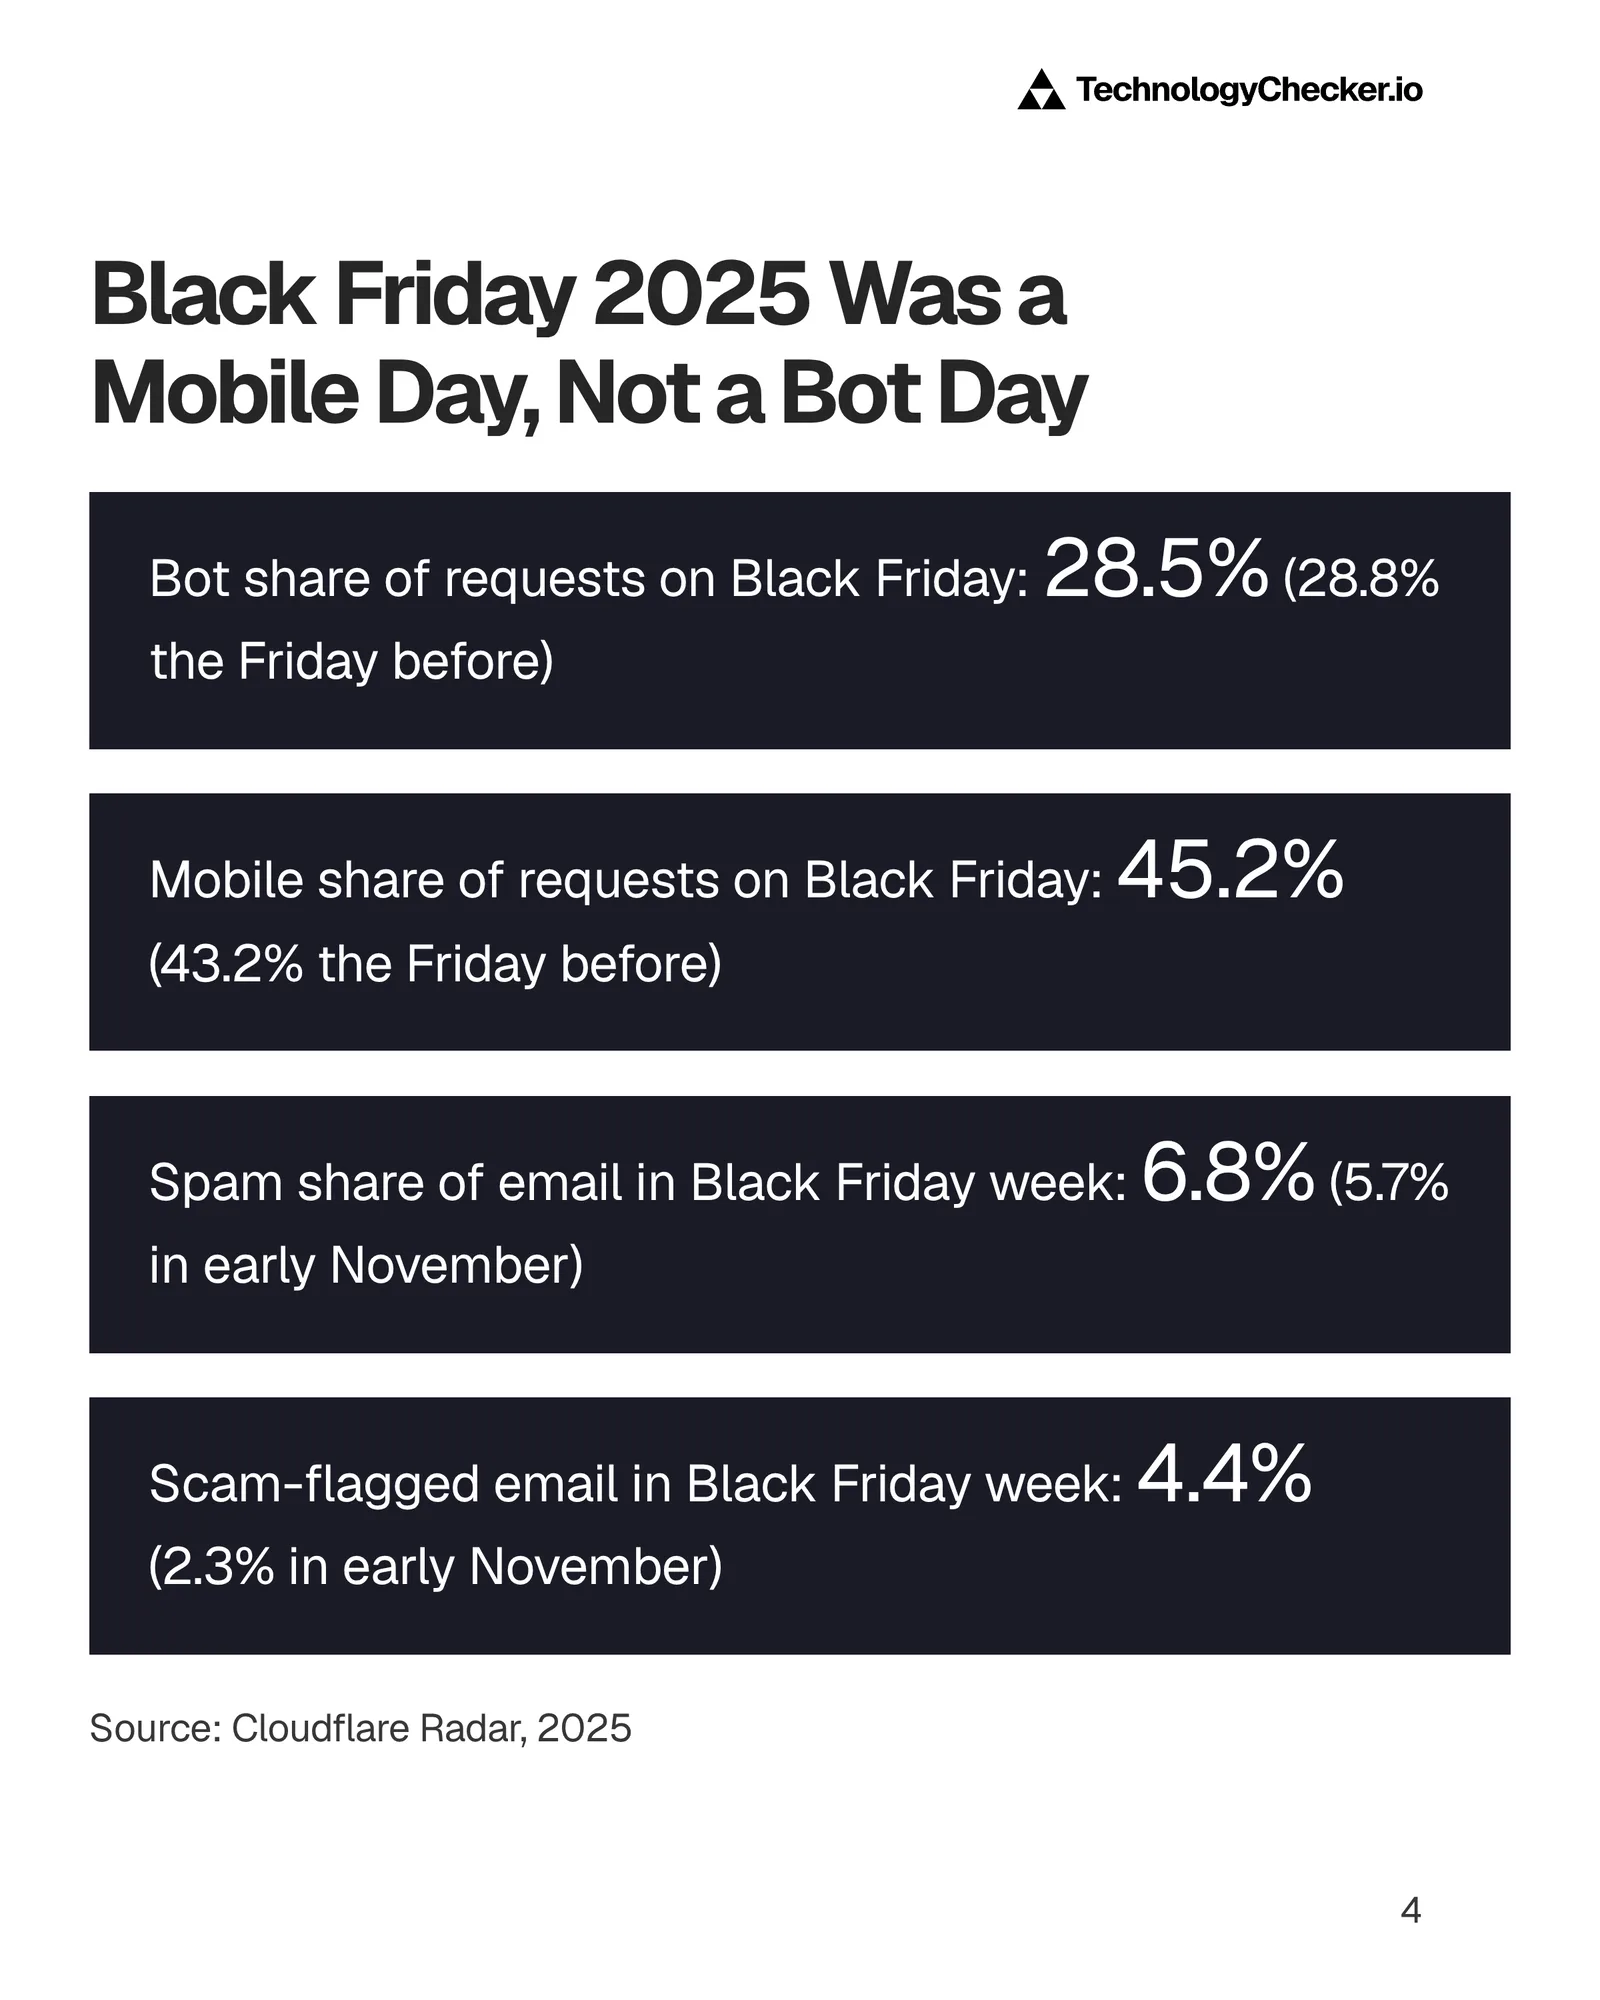
radar/http/summary and radar/email/security/summary, November – December 2025Bots made up 28.48% of requests on Black Friday 2025, slightly less than the 28.76% of the Friday before. The share that moved was mobile: mobile devices sent 45.19% of requests on Black Friday, up from 43.19% a week earlier.
| Share of all requests | Black Friday 2025 | Friday before (Nov 21) | Cyber Monday 2025 | Monday before (Nov 24) |
|---|---|---|---|---|
| Bots | 28.48% | 28.76% | 28.34% | 28.23% |
| Mobile devices | 45.19% | 43.19% | 43.55% | 43.37% |
Source: Cloudflare Radar, radar/http/summary/bot_class and radar/http/summary/device_type, one-day windows, November – December 2025.
2024 looked the same: bot share fell from 29.98% the Friday before to 28.95% on Black Friday, and mobile rose from 41.44% to 43.98%.
Bots didn't stay home, though. Automated requests rose 2.8% on Black Friday against the three previous Fridays, in step with the human lift, and 7.4% on Cyber Monday. Our bot traffic statistics cover that automated layer the rest of the year, and our mobile internet usage by country report shows how the baseline mobile share varies by market.
Bots aimed at stores are a different slice. According to Cloudflare's Grinch Bots analysis, bots sent 103 billion requests to e-commerce sites on Black Friday 2024, up to 19% of their traffic, and made 63% of login attempts, which is where credential stuffing happens. I couldn't find a 2025 edition. Queue-it's figure of 28% of requests from bots and data centres over Cyber Five 2025 counts traffic to retailers behind its waiting rooms, a different population, so the matching 28% is a coincidence, not a confirmation.
Were Retailers Attacked More During Black Friday Week?
Retailers drew a bigger share of application-layer DDoS attacks across Black Friday week, but not on the day itself. Retail's share of layer 7 (L7) DDoS attack requests was 12.31% on Black Friday against 13.68% the Friday before, and 10.49% on Cyber Monday against 10.72%. Across the week of November 24 to December 1, it rose to 10.83% from 9.63% in the week of November 3.
| Industry | Share of L7 DDoS attack requests, Nov 24 – Dec 1, 2025 |
|---|---|
| Computer Software | 15.95% |
| Retail | 10.83% |
| Gambling & Casinos | 8.34% |
| IT & Services | 8.09% |
| Media | 6.53% |
Source: Cloudflare Radar, radar/attacks/layer7 (target-industry shares), November – December 2025.
Total attack volume tells the same story: Radar's L7 attack index stood at 0.696 on Black Friday, against a window peak of 1.0 on December 7, 2025, nine days later. The year's largest DDoS attack, 31.4 Tbps, came in early November, according to Cloudflare's 2025 Year in Review.
According to Imperva, bot attacks on the retail sites it protects rose 50% around Black Friday 2025 against the November average, while retail traffic rose 37%. That's a different measure from Radar's share of all L7 DDoS requests, so both can be true.
Did scam emails rise in Black Friday week?
Yes. Scams made up 4.38% of malicious email in Black Friday week (November 24 to December 1), up from 2.25% in the week of November 3. Spam rose from 5.68% to 6.83% of messages, while the malicious share dipped from 7.37% to 6.85%.
The rest of the mix tilted toward links, which appeared in 72.3% of malicious messages (from 65.7%), and away from identity deception (38.2%, from 45.2%), brand impersonation (35.1%, from 40.2%) and credential harvesting (12.2%, from 14.3%). Categories overlap, so they sum to more than 100%. Leaked-credential checks barely moved: 61.1% came back compromised in Black Friday week, against 60.4% in the baseline week. Source: Cloudflare Radar, radar/email/security/summary, weeks of November 3 and November 24, 2025.
Which Ecommerce Sites Gained Rank Over Black Friday Weekend?
Taobao and eBay climbed during the weekend itself, but Shopify made the move that lasted. In Radar's e-commerce services ranking (a popularity ranking, not a sales one), Shopify was fourth behind Temu on November 1, 2025, held third from November 21 to December 5, and is second in November 2026.
| Service | Before the weekend, Nov 2025 | Black Friday weekend 2025 | November 2026 |
|---|---|---|---|
| Amazon | #1 | #1 | #1 |
| Shopee | #2 | #2 | #3 |
| Shopify | #3 (#4 on Nov 1) | #3 | #2 |
| Temu | #4 (#3 on Nov 1) | #4 | #5 |
| Alibaba | #5 | #7 | #6 |
| Taobao | #6 | #5, Black Friday to Cyber Monday | #7 |
| eBay | #7 | #6 on Nov 30 and Dec 1, #5 on Dec 2 | #4 |
| Vinted | outside top 10 | outside top 10 | #8 |
Source: Cloudflare Radar, radar/ranking/internet_services/timeseries_groups, serviceCategory=E-commerce, November 1 – December 5, 2025 and November 2026 (top 10 pulled).
Radar ranks services; it doesn't count stores. TechnologyChecker's crawl does, and matching our platform detections against Radar's top 1,000,000 domains shows where the larger stores sit.
| Platform | Live domains (TechnologyChecker) | In Radar's top 1M | In Radar's top 100k |
|---|---|---|---|
| Shopify | 2,246,824 | 45,691 | 2,720 |
| WooCommerce | 1,463,627 | 34,387 | 1,289 |
| Magento | 58,347 | 13,345 | 1,233 |
| PrestaShop | 70,082 | 11,364 | 551 |
| BigCommerce | 23,813 | 3,083 | 271 |
Source: TechnologyChecker detection data, live domains analysed 15 August – 10 October 2026; overlap with Radar's top-domains bucket for October 26 – November 2, 2026, queried 7 November 2026.
Magento is the outlier: 58,347 live domains, a small fraction of WooCommerce's, yet nearly level with WooCommerce inside Radar's top 100,000 (1,233 against 1,289). By our calculation, more than one in five Magento domains we detect sits in the top million, against about one in fifty for Shopify (counts taken in August and November 2026). Magento's installed base skews toward high-traffic stores.
For the marketplaces in Radar's list, our ecommerce marketplace market share report tracks the top four month by month.
Is Black Friday Dying, or Just Spreading Out?
Black Friday isn't dying, but its spike is getting flatter. Measured the same way both years, Black Friday's worldwide human-traffic lift fell from +4.7% in 2024 to +2.9% in 2025, and Cyber Monday's from +6.7% to +4.0%.
| Black Friday statistics by year | 2024 | 2025 |
|---|---|---|
| Thanksgiving, worldwide human traffic | −0.1% | −0.7% |
| Black Friday, worldwide human traffic | +4.7% | +2.9% |
| Cyber Monday, worldwide human traffic | +6.7% | +4.0% |
| Busiest human-traffic day, Nov 1 to early Dec | Sun Dec 1, 2024 (day before Cyber Monday) | Mon Dec 1, 2025 (Cyber Monday) |
| Black Friday US online spend growth (Adobe) | +10.2% | +9.1% |
Source: Cloudflare Radar, radar/http/timeseries, human requests, UTC days, November 1 – December 9, 2024 and November 1 – December 8, 2025; spend growth from Adobe.
The money points the other way. According to Adobe's 2025 season report, US online holiday spending hit a record $257.8 billion from November 1 to December 31, up 6.8%. NRF's survey found more Americans shopping online than in stores over the five days from Thanksgiving: 134.9 million against 129.5 million.
So the answer to "is Black Friday a dying trend?" is no: the day is being diluted by a longer season, and in the US its traffic peak has moved to Cyber Monday.
What Should You Watch on Black Friday 2026?
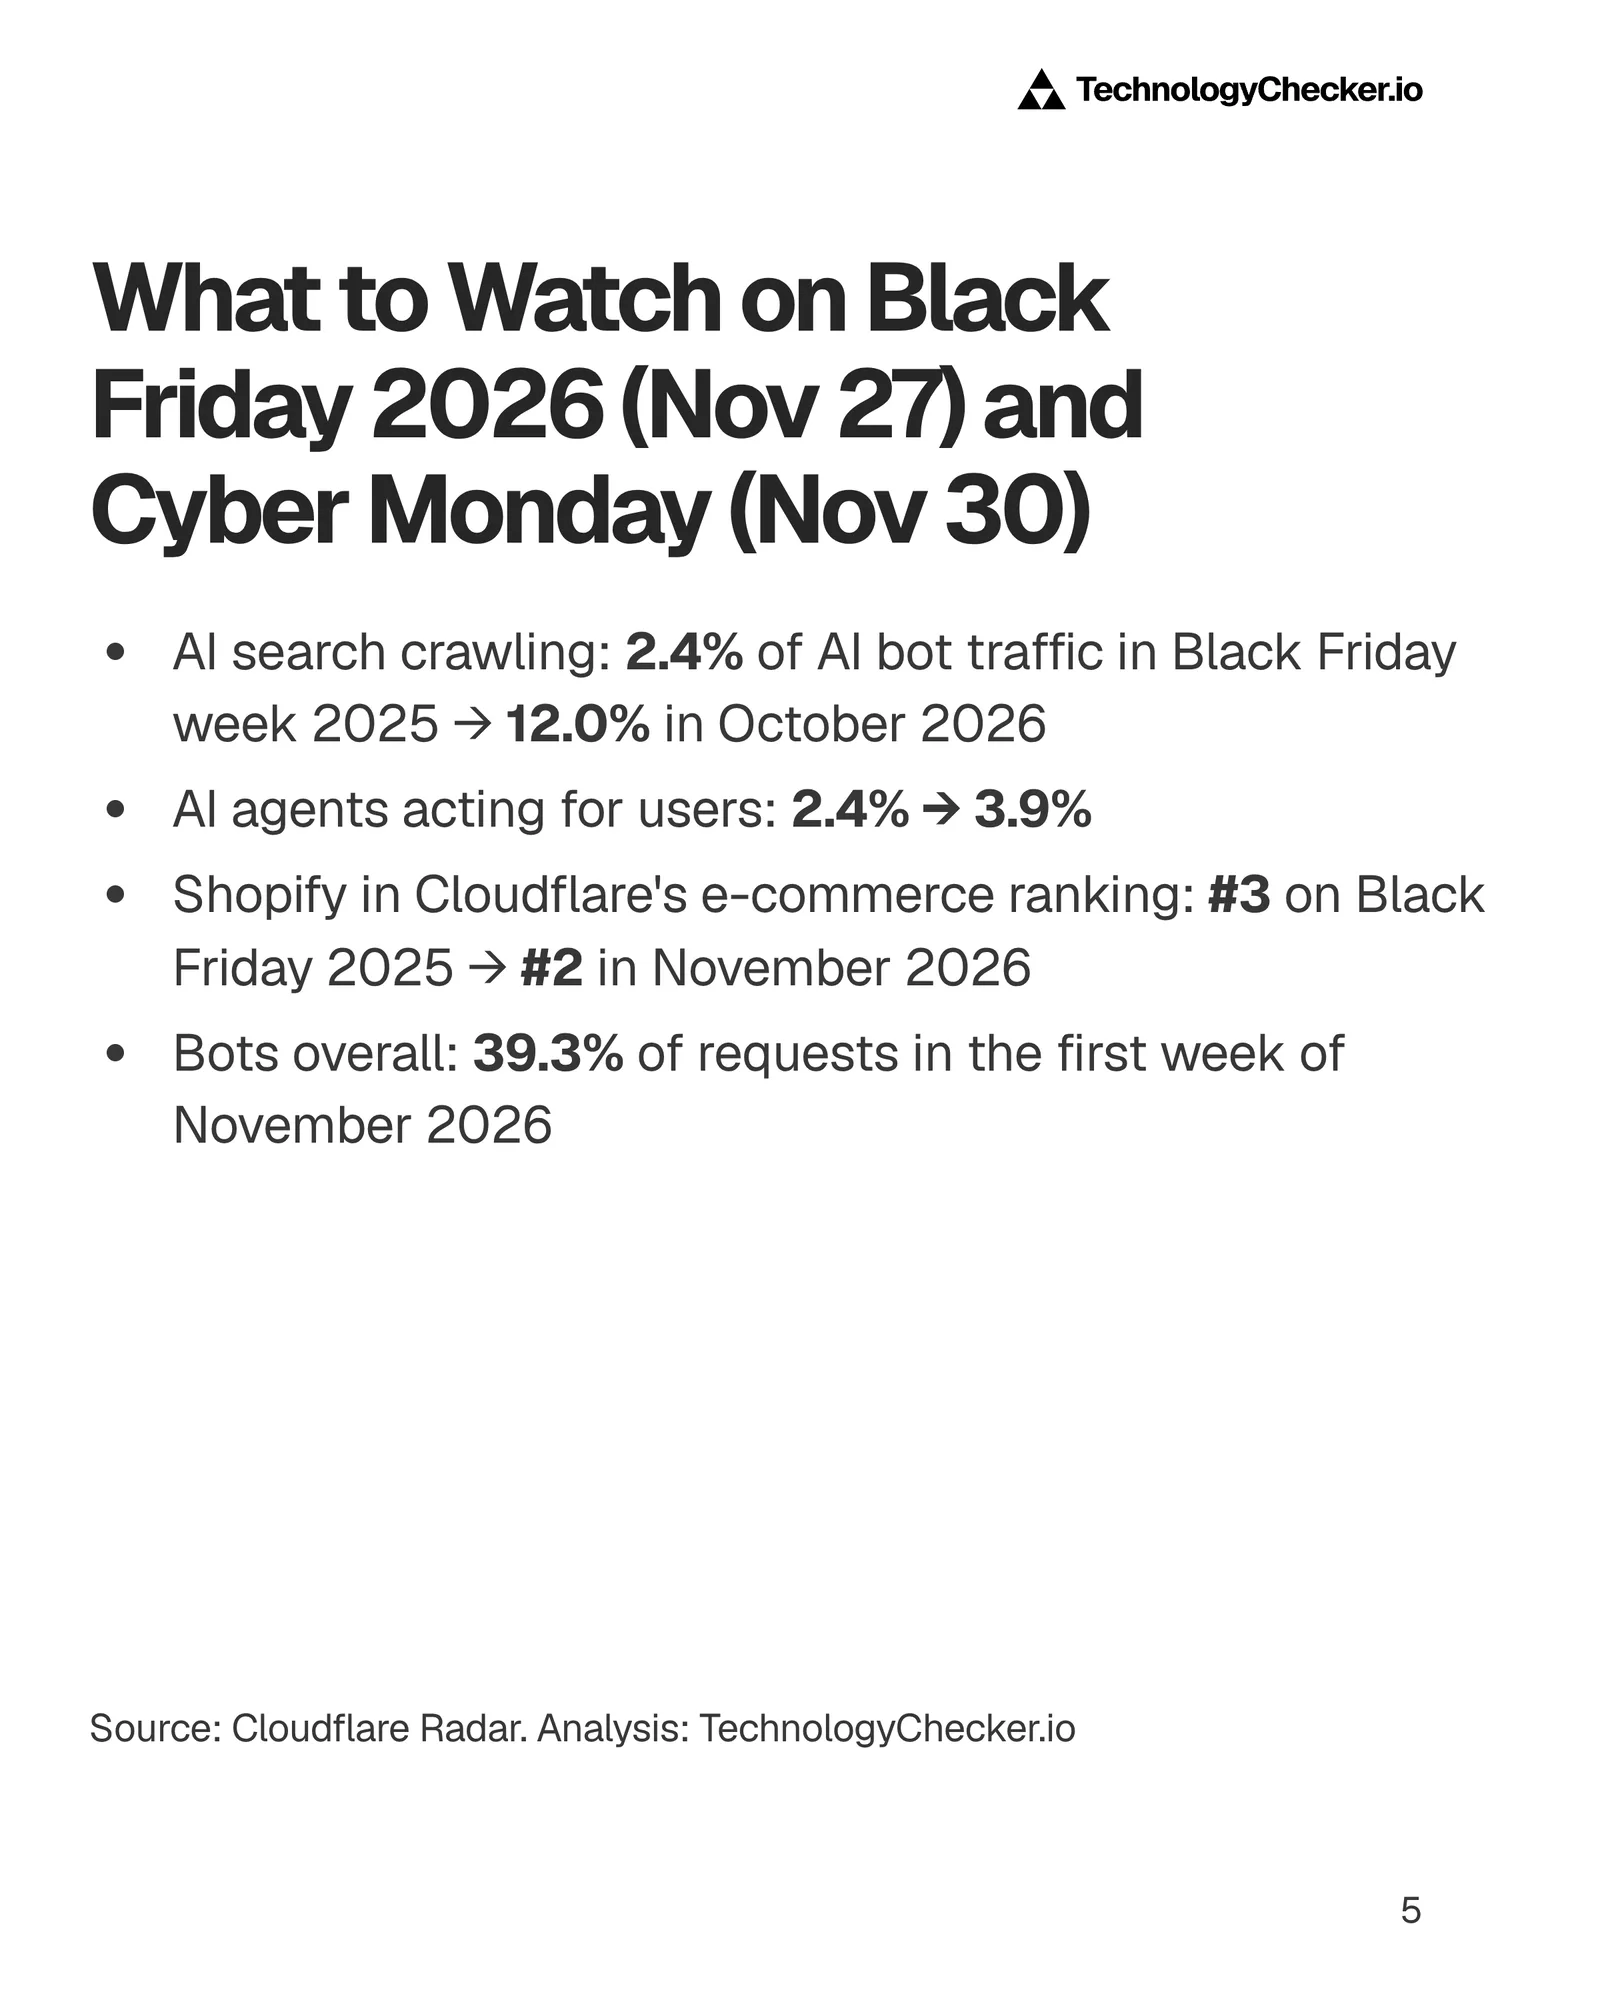
Black Friday 2026 falls on November 27 and Cyber Monday on November 30. Four signals in the data are worth checking on those days: AI search crawling, AI agents shopping for people, the bot share, and Shopify's rank.
According to Adobe's 2026 forecast, US shoppers will spend $12.9 billion online on Black Friday (+9.2%) and $15.1 billion on Cyber Monday (+6.2%). Deloitte's holiday forecast puts US holiday e-commerce at $316.1 billion to $318.9 billion from November 2026 to January 2027.
Will AI search crawlers be busier this Black Friday?
Probably, if the pre-season data holds. Search went from 2.4% of AI crawler traffic in Black Friday week 2025 to 12.0% in late October 2026, five times the share, while mixed-purpose crawling fell from 60.7% to 40.7%.
| AI crawler purpose | Black Friday week 2025 (Nov 24 – Dec 2) | Oct 24 – Nov 1, 2026 |
|---|---|---|
| Training | 34.1% | 42.0% |
| Mixed purpose | 60.7% | 40.7% |
| Search | 2.4% | 12.0% |
| User action (agents acting for a person) | 2.4% | 3.9% |
Source: Cloudflare Radar, radar/ai/bots/summary/crawl_purpose. The 2026 column is a pre-season baseline, not Black Friday week.
A store that blocks AI search crawlers now shuts out a much bigger slice of AI crawling than it did a year ago. Our AI crawler statistics track crawl purpose month by month and by vertical.
Will AI agents shop on people's behalf?
Some already do. User-action crawling, where an AI agent fetches pages because a person asked it to, rose from 2.4% to 3.9% of AI crawler traffic. Adobe measured traffic from generative AI tools to US retail sites up 693.4% over the 2025 season, and forecasts a further 130% rise in 2026.
Akamai's Cyber Week analysis counted nearly 4 million AI agent requests across its US commerce customers on Black Friday 2025, its Cyber Week peak, and the fewest on Cyber Monday, the reverse of the US human pattern. Salesforce's 2026 holiday predictions expect 20% of holiday e-commerce traffic to come from AI chat agents, competitors' scrapers included; that's a prediction, not a measurement.
Our agentic commerce report counts how many stores already publish a UCP manifest that AI shopping agents can read.
Will the bot share move on Black Friday 2026?
Radar's bot share stood at 39.3% of requests in the week to November 6, 2026. Cloudflare changed its bot classification in late September 2026, so that number can't be compared with Black Friday 2025's 28.5%. The test that still works is last year's: does the bot share rise or fall on Black Friday against the Friday before?
Will Shopify hold second place?
Shopify enters the season second in Radar's e-commerce ranking, behind Amazon. Watch whether it holds second through November 30, and whether eBay (fourth) or Temu (fifth) moves over the weekend, as eBay did in 2025.
How Should Ecommerce Teams Use These Black Friday Statistics?
Use them to plan for the right day, hour and market:
- Plan US capacity for Cyber Monday evening. Load tests built around a Black Friday afternoon test the wrong hour on the wrong day.
- Give each market its own calendar. Black Friday was the big day in the UK, all seven EU countries we checked, Canada, South Africa and Australia. Argentina peaked on the Saturday.
- Fix the mobile checkout first. Mobile's share of requests rose on Black Friday in both years we checked.
- Budget for steady bot load, not a bot spike. Put the effort into login protection against credential stuffing and into watching for scam email.
- Check what AI crawlers can reach. Make sure your robots.txt treats search crawlers the way you intend.
- Size the market by platform. If you sell to online stores, count who runs Shopify, WooCommerce, Magento or BigCommerce in TechnologyChecker before your season's outreach starts.
Methodology
Windows and pull date. Radar data was pulled on 7 November 2026. The 2025 window is November 1 to December 8, 2025 (Black Friday November 28, Cyber Monday December 1); the 2024 comparison uses November 1 to December 9, 2024 (Black Friday November 29, Cyber Monday December 2).
What the numbers are. Radar reports normalized indices (the highest point in a series is 1.0) or percentage shares of requests, never visit counts, and it only sees traffic that passes through Cloudflare. Its public HTTP data explorer exposes the same series.
How each uplift is calculated. Every uplift compares a day with the mean of the same weekday in the three previous weeks, so Black Friday 2025 is compared with November 7, 14 and 21.
UTC days and local-time days. Worldwide figures use UTC days. Country figures use local-time days, one offset per country: Eastern time for the US and Canada, UTC−6 Mexico, UTC−3 Brazil and Argentina, UTC for the UK, UTC+1 for the EU countries, UTC+2 South Africa, UTC+3 Turkey, UTC+5:30 India, UTC+9 Japan and UTC+11 Australia. On UTC days, US Black Friday reads only +0.5%, because the UTC day starts at 7 pm Eastern on Thanksgiving.
The 18 November outage. Cloudflare's global outage on Tuesday 18 November 2025 pulled the worldwide human-traffic index down to 0.816 that day. It dips the November baseline but falls on none of the baseline days used here. We log disruptions like it in our internet outage tracker.
Bot classification. Bot classification is Cloudflare's model, and Cloudflare changed it in late September 2026, which is why the 39.3% figure for November 2026 isn't compared with 2025.
TechnologyChecker detection. Live-domain counts come from TechnologyChecker's crawl (WooCommerce and Magento analysed 15 August 2026, BigCommerce 24 August, Shopify 27 August, PrestaShop 10 October). The top-list overlaps come from the same crawl, queried on 7 November 2026. Detection counts domains, not companies or revenue.
Third-party figures. Sales, shopper and forecast numbers come from the publishers' own releases (December 2025 to September 2026); we didn't re-measure them.
Frequently Asked Questions About Black Friday Statistics
What are the statistics for Black Friday shopping?
US shoppers spent $11.8 billion online on Black Friday 2025 and $14.25 billion on Cyber Monday, according to Adobe. Cloudflare Radar shows worldwide human traffic up 2.9% on Black Friday and 4.0% on Cyber Monday against prior weeks, with bots at 28.48% of Black Friday requests.
Was Black Friday 2025 a success or a failure?
For sales, a success: Adobe and NRF both reported records. For traffic, it was smaller than in 2024, with the worldwide human-traffic lift down from +4.7% to +2.9%, and US traffic peaked on Cyber Monday instead.
Is Black Friday a dying trend?
No. Spending and shopper counts set records in 2025. What's shrinking is the one-day spike, because demand is spread across a longer season: Adobe counted 25 days above $4 billion in US online spending, up from 18 in 2024.
How much of Black Friday traffic comes from bots?
About 28.5% of requests on Cloudflare's network on Black Friday 2025 were automated, slightly below the Friday before. On e-commerce sites alone, Cloudflare's 2024 analysis put bots at up to 19% of traffic and 63% of login attempts.
How does Black Friday traffic compare to Cyber Monday?
Cyber Monday draws more. Worldwide human traffic rose 4.0% on Cyber Monday against 2.9% on Black Friday in 2025; in the US the lifts were 11.0% and 7.3%, and both days peaked at 9 pm Eastern.
What cyber attacks spike during Black Friday shopping?
Scam email showed the clearest rise in 2025, nearly doubling as a share of malicious messages in Black Friday week. Retail's share of L7 DDoS attack requests rose over the week but fell on Black Friday itself, and total attack volume peaked on December 7.
Which countries have the biggest Black Friday traffic spike?
Of 18 countries measured on local-time days, South Africa led at +16.8%, ahead of Canada, Germany and the UK (all above +11%). The US was +7.3%, while Argentina and Japan peaked on the Saturday instead.
When is Black Friday 2026?
Black Friday 2026 is Friday, November 27, and Cyber Monday is November 30. Adobe forecasts $12.9 billion in US online spending on Black Friday and $15.1 billion on Cyber Monday.
How have Black Friday statistics changed by year?
From 2024 to 2025, Black Friday's US online spending growth slowed from +10.2% to +9.1% (Adobe), and its worldwide traffic lift fell from +4.7% to +2.9% (Cloudflare Radar). Mobile's share of requests rose on the day in both years.

Data Analyst
5+ years of experience
Emma is a Data Analyst at TechnologyChecker, where she analyses technology adoption data to build better prospect lists and uncover actionable patterns for sales teams.
- BSc Data Science, Cardiff University
- Google Data Analytics Professional Certificate
- Tableau Desktop Certified Associate
Never miss our research