Europe E-Commerce Statistics Q3 2026: Germany, France & Italy
Q3 2026: Germany is the EU's largest e-commerce market, Italy's human web traffic is 55% mobile, and shopping sites draw 31% of AI-bot requests.
Published •Updated •Data through September 2026•34 min read

Quick question before the data dump: which platform runs most online stores in Germany, France and Italy? 🤔
If you said Shopify, you're right… globally. We detect it on 2.45 million live businesses, roughly 46% of the whole e-commerce category. But zoom into Europe's three biggest online markets and that answer just falls apart. In France, the homegrown PrestaShop outnumbers Shopify by about 3.6 to 1 among the merchants we've matched. WooCommerce runs the most stores in Italy. Ecwid tops Germany. So the EU's largest markets? They don't run the stack you'd expect. 🇪🇺
Here's how I dug in. I analyse technology-adoption data for a living, so I looked at this three ways at once: how big each market is, what merchants actually run (from our own detection across 50M+ domains), and how Germans, French and Italians connect right now (live from Cloudflare Radar, now refreshed to Q3 2026). Market size, real platform mix, current behaviour. One post.
And it's a big market, by the way. EU online retail is worth about $456 billion in 2026 and heading for $546 billion by 2030. Not exactly niche. 📈
Updated October 1, 2026 with Q3 2026 data. I re-pulled every Cloudflare Radar figure in this post for the full third quarter (July to September 2026) and set it against Q2 2026 and Q3 2025. Two things changed the story. On all web requests, Italy slipped below 50% mobile (48.2%) for the first time in this series, yet on human traffic it is still 55.4% mobile: the gap is automated traffic, not Italians putting their phones down. And Italy's AI-crawler mix, which I read in July as Italian shoppers asking ChatGPT about products, turned out to be a share that moves when other crawlers grow. Both are in the Q3 analysis below.
💡 The short version (our May 2026 detection + the latest EU market figures + live Cloudflare Radar):
- 🛒 Shopify leads our global count at 2.45M businesses (~46% of the category), ahead of WooCommerce (946K) and Wix (411K). It doesn't win a single one of the big three EU markets though.
- 🇫🇷 France is PrestaShop country. We match 7,027 businesses on the French-built platform vs just 293 in Germany. It beats Shopify there ~3.6 to 1.
- 🇮🇹 WooCommerce runs Italy (4,827 matched stores). 🇩🇪 Ecwid runs Germany (6,272). Shopify? Never cracks the top three.
- 🆕 Q3 2026: on human traffic, mobile carried 55.4% of web requests in Italy, 50.4% in France and 46.6% in Germany. On all requests (bots included) Italy dipped to 48.2%, its first reading below half.
- 📱 The mobile shift is wildly uneven. In Q2 2026, mobile was 50% of web requests in Italy, but only 38% in France and 29% in Germany. Italy's the most Android-heavy too (37% Android vs 19% iOS). ⚠️ Q2 figures, since revised by Cloudflare to 51.3%, 39.1% and 29.8%; see the Q3 analysis.
- 💳 Digital wallets rule European payments at 38% of value, and slow delivery is the #1 reason shoppers ditch their carts (36%). Both swing hard by country.
- 🤖 E-commerce is the most AI-crawled corner of the web (32% of AI bot traffic), and shops are fighting back, fully blocking GPTBot, ClaudeBot and Bytespider while leaving Googlebot alone.
Selling into Europe? Keep reading. The country-by-country bits change how you'd build, price and ship. 👇

A note on scope before the numbers: the headline revenue, penetration and user figures cover the European Union (EU-27). Several country-comparison and survey charts widen the lens to include non-EU European markets such as the UK, Switzerland, Norway and Turkey. I've flagged the scope on each chart so the comparisons stay honest.
Which country uses e-commerce the most?
Germany is the EU's largest e-commerce market by both revenue and shoppers: $95.43 billion and 44.66 million online shoppers in 2024, ahead of France ($66.46 billion, 30.29 million) and Italy ($62.46 billion, 19.49 million), according to Statista Market Insights. By the share of people who buy online, the leaders are smaller northern markets: Denmark reached 87.3% in 2025, with Belgium (86.4%) and Luxembourg (86.0%) close behind.
| Measure | #1 | #2 | #3 | Source |
|---|---|---|---|---|
| E-commerce revenue, 2024 | Germany, $95.43B | France, $66.46B | Italy, $62.46B | Statista Market Insights |
| E-commerce users, 2024 | Germany, 44.66M | France, 30.29M | Italy, 19.49M | Statista Market Insights |
| Penetration (share of people buying online), 2025 | Denmark, 87.3% | Belgium, 86.4% | Luxembourg, 86.0% | Statista Market Insights |
Spain and Poland form the next tier by revenue in Statista's EU-27 series. The UK, Europe's other large online market, sits outside the EU figures used here.
Q3 2026 analysis: Italy's all-traffic mobile share fell below half, its human share didn't
Every row below compares full calendar quarters: Q3 2025, Q2 2026 and Q3 2026. "Human" means requests Cloudflare classifies as likely human; "all requests" includes bots.
| Metric (Cloudflare Radar) | Q3 2025 | Q2 2026 | Q3 2026 |
|---|---|---|---|
| Mobile share, human requests: Germany | 53.30% | 47.95% | 46.58% |
| Mobile share, human requests: France | 54.82% | 51.54% | 50.44% |
| Mobile share, human requests: Italy | 59.60% | 56.88% | 55.44% |
| Mobile share, all requests: Germany | 35.47% | 29.77% | 27.97% |
| Mobile share, all requests: France | 46.72% | 39.12% | 34.22% |
| Mobile share, all requests: Italy | 54.79% | 51.26% | 48.16% |
| Median download speed (p50): France | 33.1 Mbps | 30.4 Mbps | 33.8 Mbps |
| Median download speed (p50): Germany | 27.7 Mbps | 24.4 Mbps | 26.8 Mbps |
| Median download speed (p50): Italy | 20.8 Mbps | 17.4 Mbps | 17.8 Mbps |
| Shopping & General Merchandise share of AI-bot requests | 30.47% | 32.27% | 31.09% |
Source: Cloudflare Radar, http/summary/device_type (location=DE/FR/IT, all requests and botClass=LIKELY_HUMAN), quality/iqi/summary (metric=bandwidth, p50), ai/bots/summary/vertical; calendar quarters. Pulled 2026-10-01; Q3 2026 provisional.
I don't read Italy's dip below 50% as Italians putting their phones down. On human traffic Italy is still the most mobile of the three by five points, and that's the number that matters if you're building a store for Italian shoppers: mobile first, still. The finding I'd act on is France. At 50.4% human mobile it's now a coin flip, so a French storefront can't assume either device. Germany is the one market where desktop holds a majority of human browsing, at 53.4%.
A second correction, to my own July read. I wrote that Italy's AI-crawler traffic was over half ChatGPT-User, and took that as Italian shoppers asking AI assistants about products. Q3 says I over-read a share. ChatGPT-User was 91.6% of Italy's AI-bot requests in Q3 2025, 51.4% in Q2 2026 and 19.6% in Q3 2026, while Googlebot, Bytespider and Amazonbot grew into the mix. A share of a small denominator moves when the other agents arrive. It isn't a count of Italian shoppers, and I shouldn't have treated it like one.
| AI crawler share of AI-bot requests, Q3 2026 | 🇩🇪 Germany | 🇫🇷 France | 🇮🇹 Italy |
|---|---|---|---|
| Googlebot | 28.8% | 42.6% | 25.0% |
| ChatGPT-User | 9.5% | below top 9 | 19.6% |
| Meta-ExternalAgent | 9.7% | 11.0% | 3.4% |
| ClaudeBot | 7.5% | 3.7% | 3.2% |
| GPTBot | 3.9% | 4.9% | 3.4% |
| Bytespider | 5.4% | 3.8% | 6.7% |
Source: Cloudflare Radar, ai/bots/summary/user_agent (location=DE/FR/IT), Q3 2026. Pulled 2026-10-01. The "other" bucket is 23% in Germany and 25% in Italy, against 7% and 2% in Q2 2026: Cloudflare is resolving more distinct agents, so shares of named agents fall even when their traffic doesn't.
On crawl purpose, shops are crawled differently from the rest of the web. Inside the Shopping & General Merchandise vertical, 52.4% of AI-bot requests in Q3 2026 were mixed-purpose and 36.7% training, against 38.9% mixed and 47.6% training across all AI crawling. And in Cloudflare's robots.txt snapshot for 28 September 2026, e-commerce sites fully disallowed Bytespider on 39 domains (35 in June), GPTBot, ClaudeBot and CCBot on 33 each, and Google-Extended on 30, while no e-commerce site fully blocked Googlebot (2 in June). E-commerce remains the third most AI-restricting category, behind technology and business.
Source: Cloudflare Radar, ai/bots/summary/crawl_purpose (all, and vertical=Shopping & General Merchandise), Q3 2026; robots_txt/top/user_agents/directive (domainCategory=Ecommerce, directive=DISALLOW), single-day snapshots for 29 June and 28 September 2026; robots_txt/top/domain_categories, 28 September 2026. Pulled 2026-10-01.
Counts are not a like-for-like series over time: the set of domains we crawl turns over every month, with dead sites dropping out and newly discovered ones added, and our detection signals widen over time.
2026 month by month: mobile share of human web traffic
| Month (2026) | 🇩🇪 Germany | 🇫🇷 France | 🇮🇹 Italy |
|---|---|---|---|
| January | 48.24% | 52.29% | 59.41% |
| February | 47.37% | 50.84% | 57.05% |
| March | 47.46% | 51.11% | 56.69% |
| April | 47.23% | 51.18% | 57.12% |
| May | 47.64% | 51.54% | 56.61% |
| June | 48.41% | 51.33% | 56.45% |
| July | 46.63% | 50.98% | 56.50% |
| August | 46.41% | 50.90% | 55.46% |
| September (provisional) | 46.29% | 48.88% | 53.81% |
| Change, January to September | −1.95 pt | −3.41 pt | −5.60 pt |
Source: Cloudflare Radar, http/summary/device_type, location=DE/FR/IT, botClass=LIKELY_HUMAN, calendar months 2026. Pulled 2026-10-01.
📊 Europe's e-commerce market, by the numbers
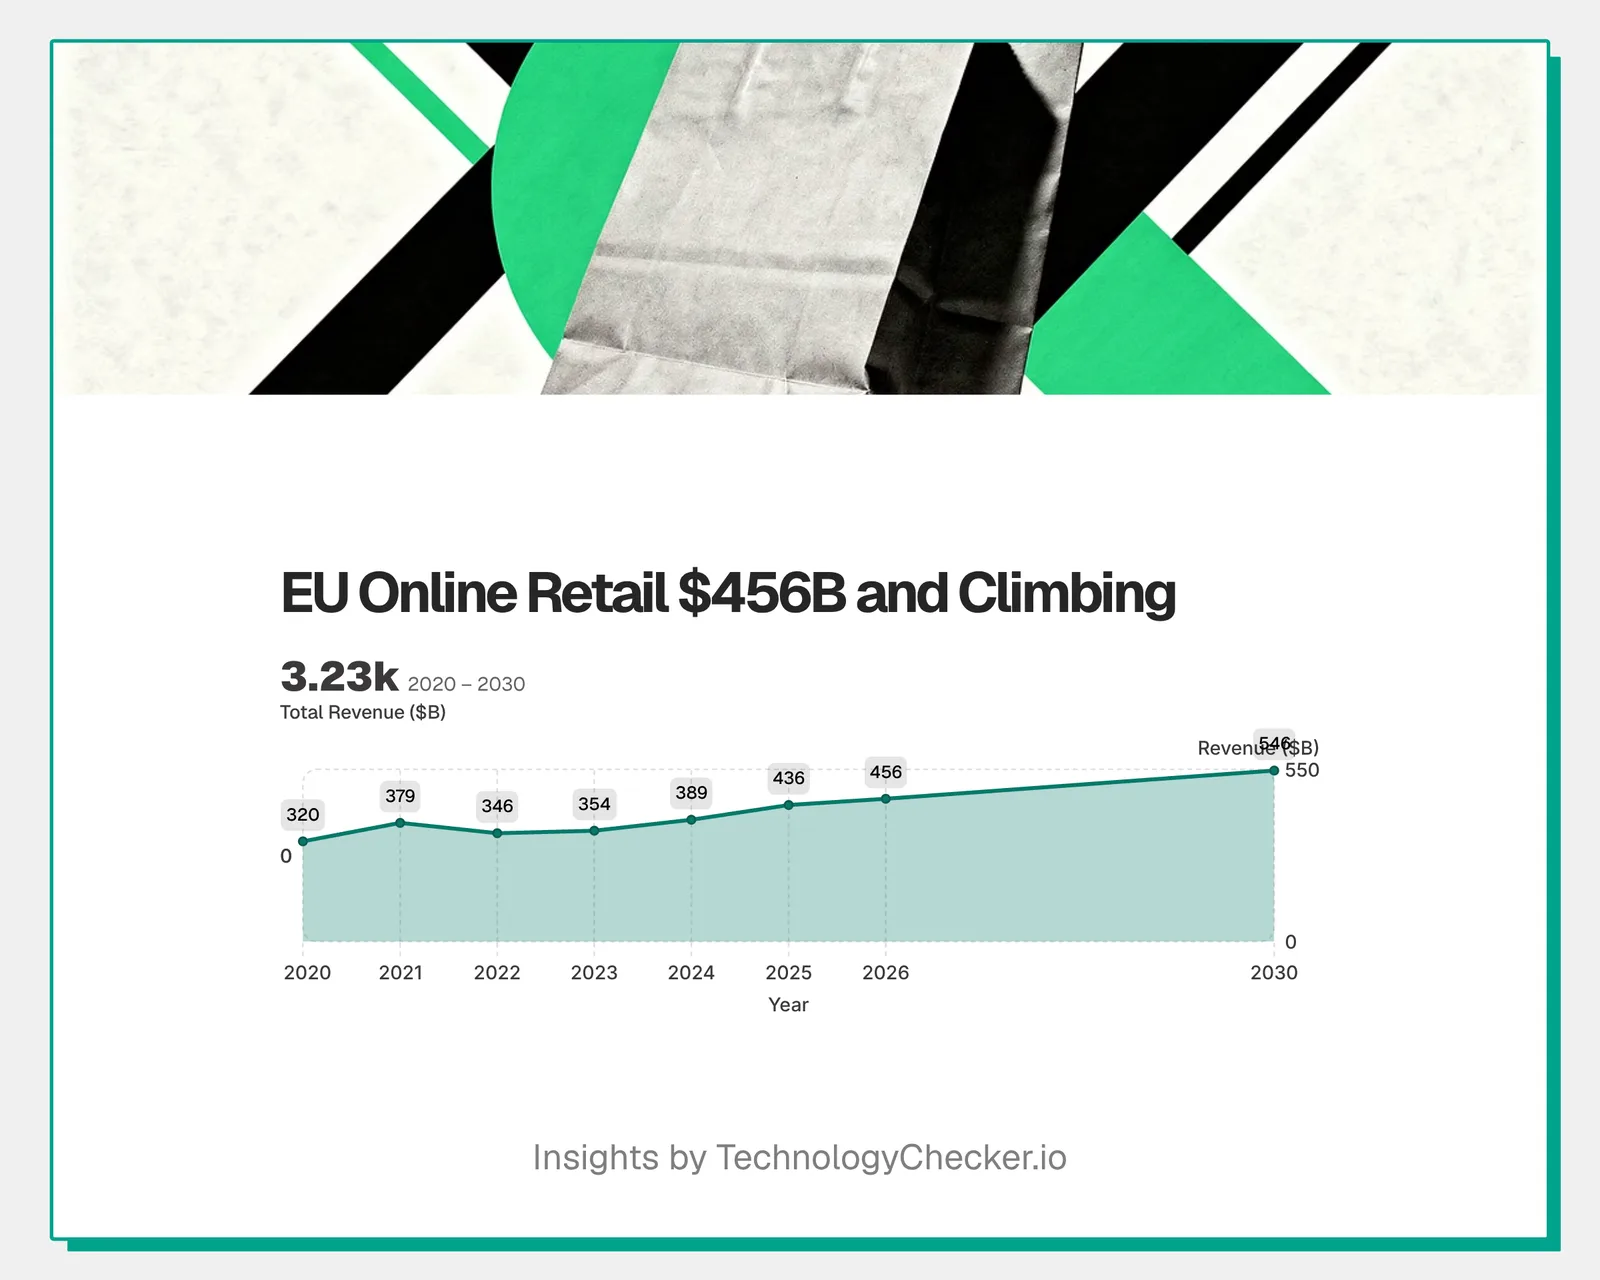
The EU online market has grown for most of the past five years, and is modeled to expand steadily through the end of the decade.
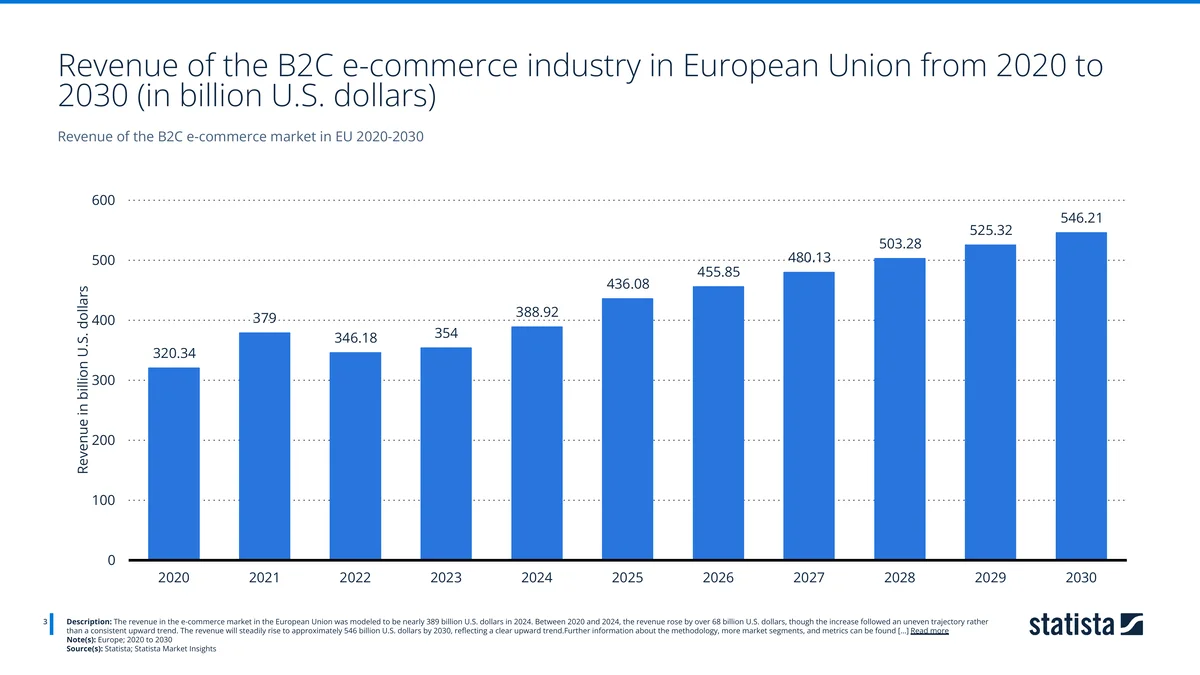
Revenue hit nearly $389 billion in 2024, up more than $68 billion since 2020. The climb wasn't smooth (2022 actually dipped to $346 billion after the 2021 pandemic peak of $379 billion), but from 2024 on it's a steady march up: $436 billion in 2025, ~$456 billion in 2026, then an eventual $546 billion by 2030. That's roughly $20-25 billion in fresh online spend every single year. (Source: Statista Market Insights.)
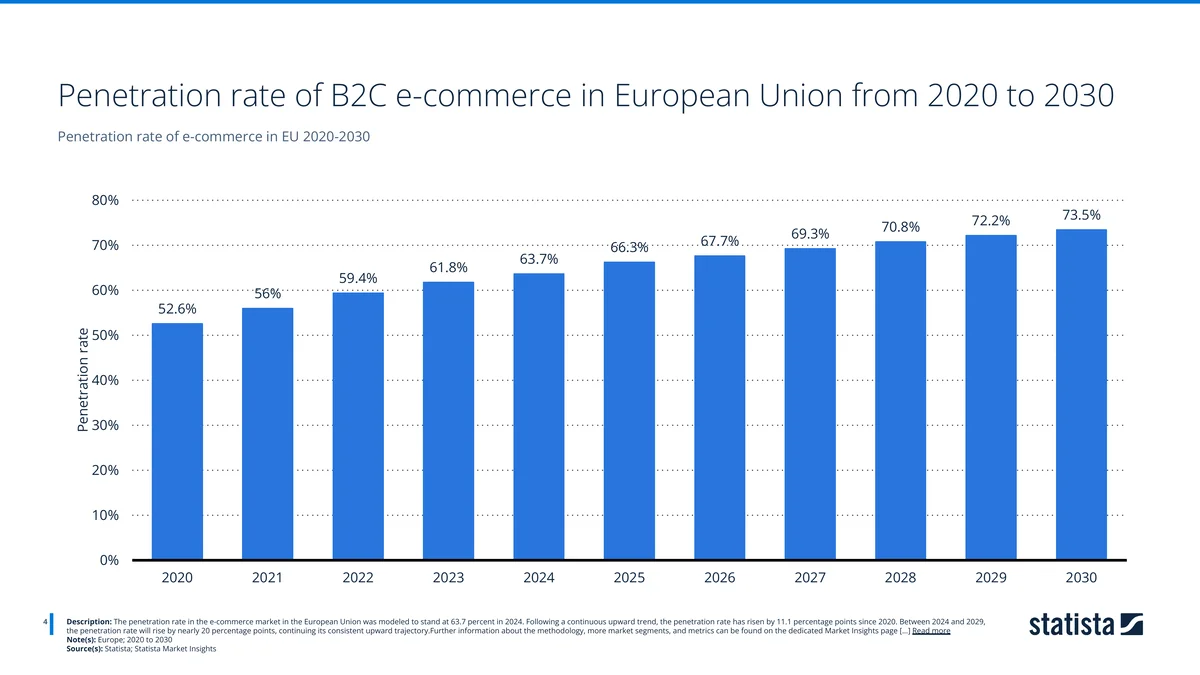
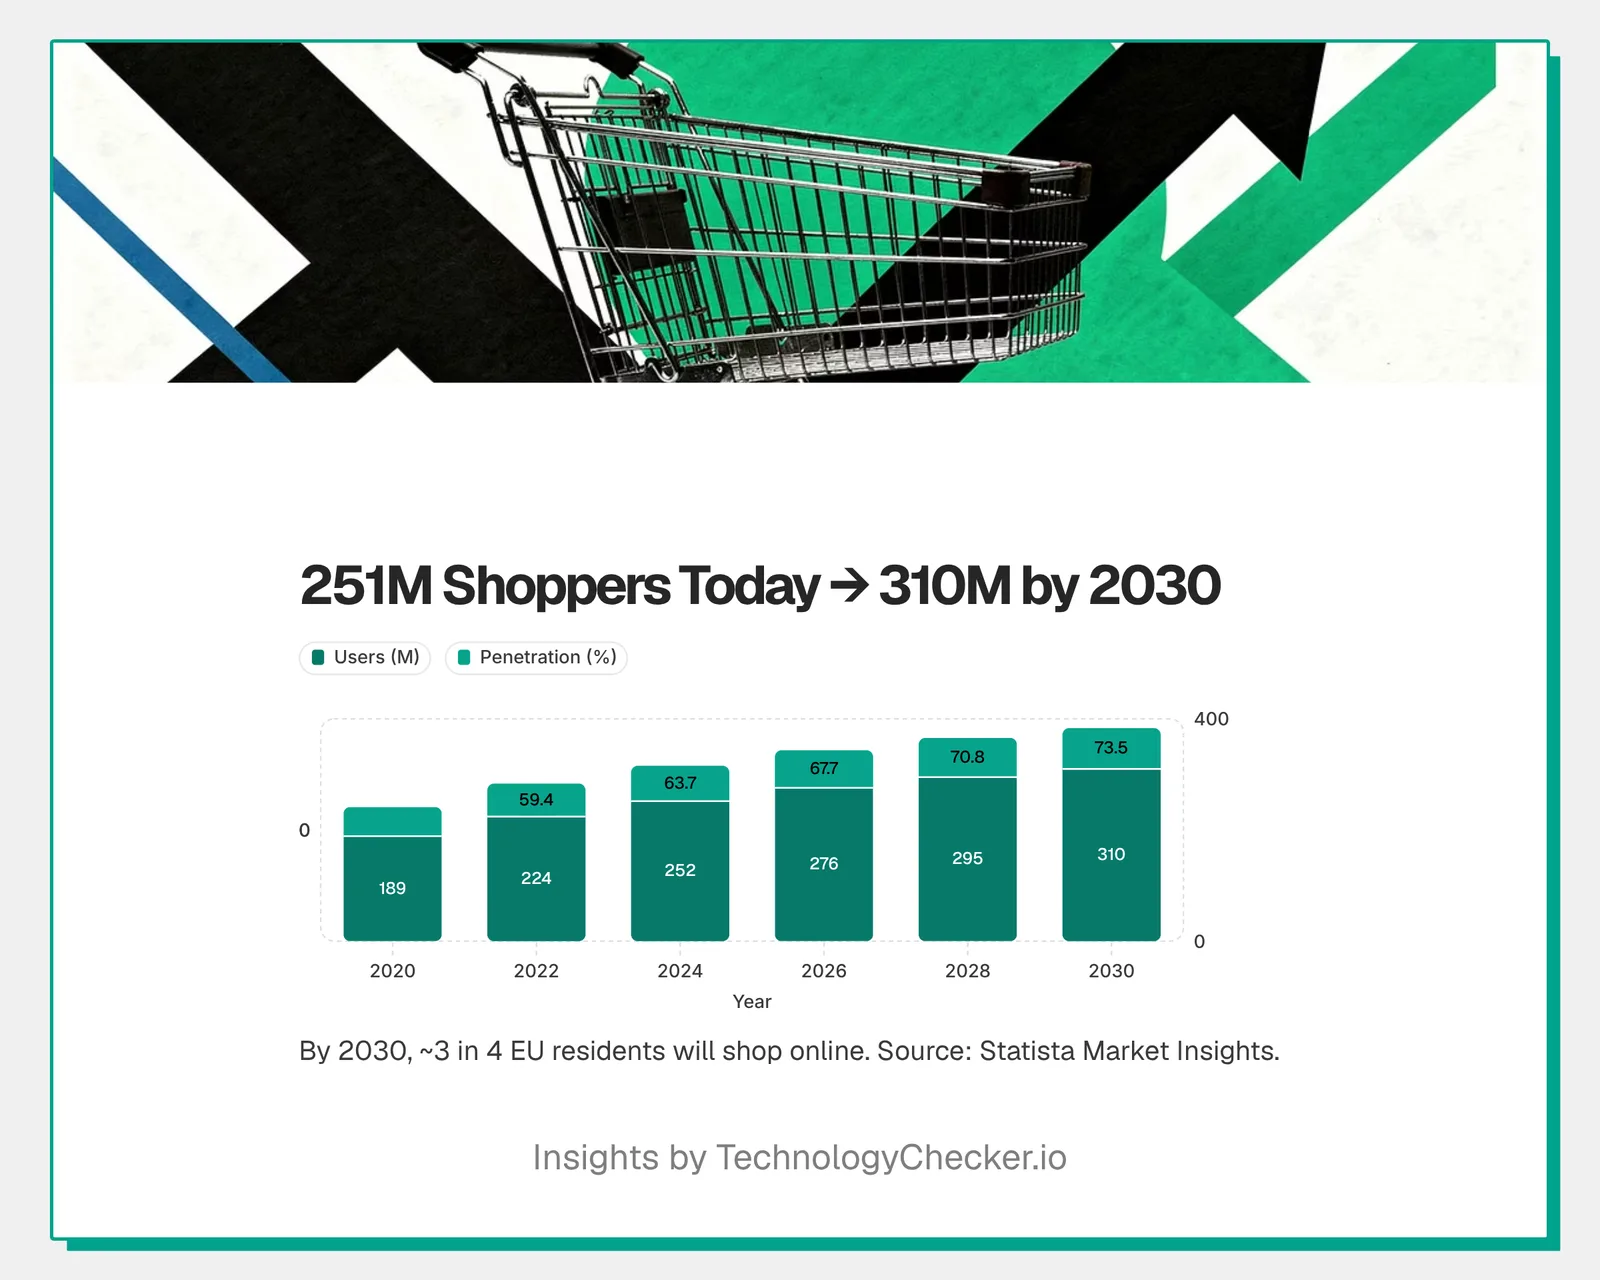
Penetration (the share of people actually buying online) stood at 63.7% in 2024, up 11.1 points since 2020. It's set to climb almost 20 more points by 2029, hitting 73.5% by 2030. Put simply: by the end of the decade, about three in four people in the EU will be active online shoppers. The headroom that's left sits mostly in southern and eastern markets, which is exactly where the fastest growth comes from.
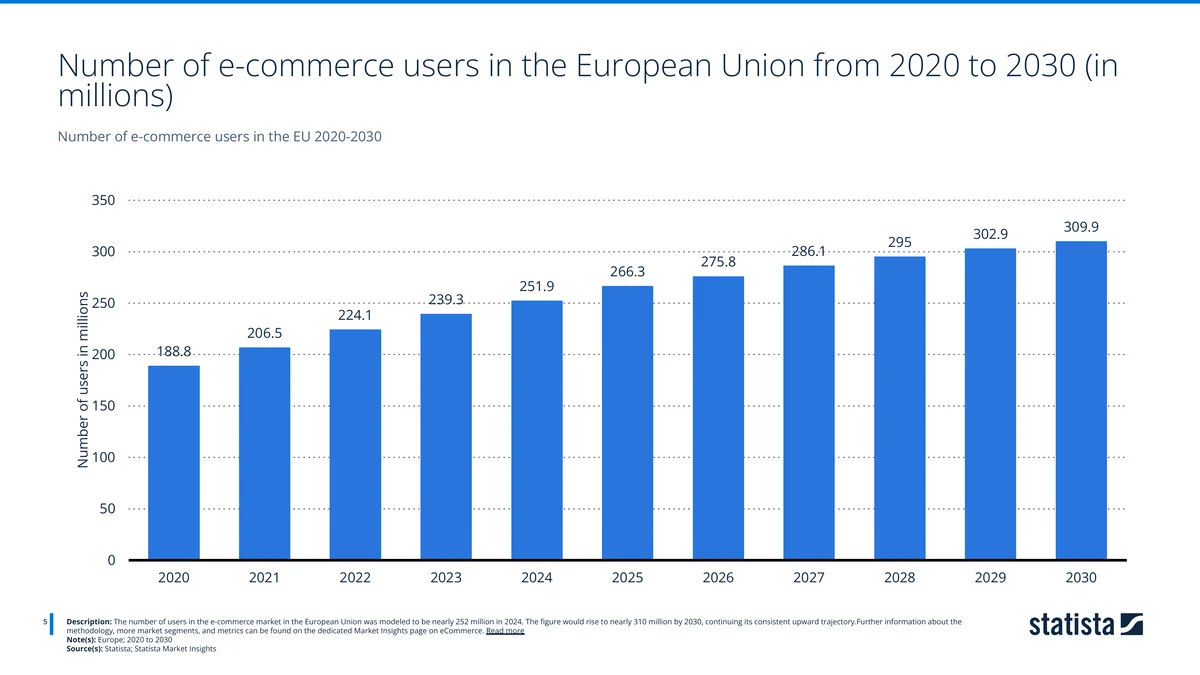
The user base tells the same story in raw numbers: 251.9 million e-commerce users in 2024, climbing toward 309.9 million by 2030. That's an extra 58 million shoppers in six years. More users, higher penetration, more spend per head. That's what compounds into the $546 billion figure.
📱 The shift to mobile: forecast vs. live traffic
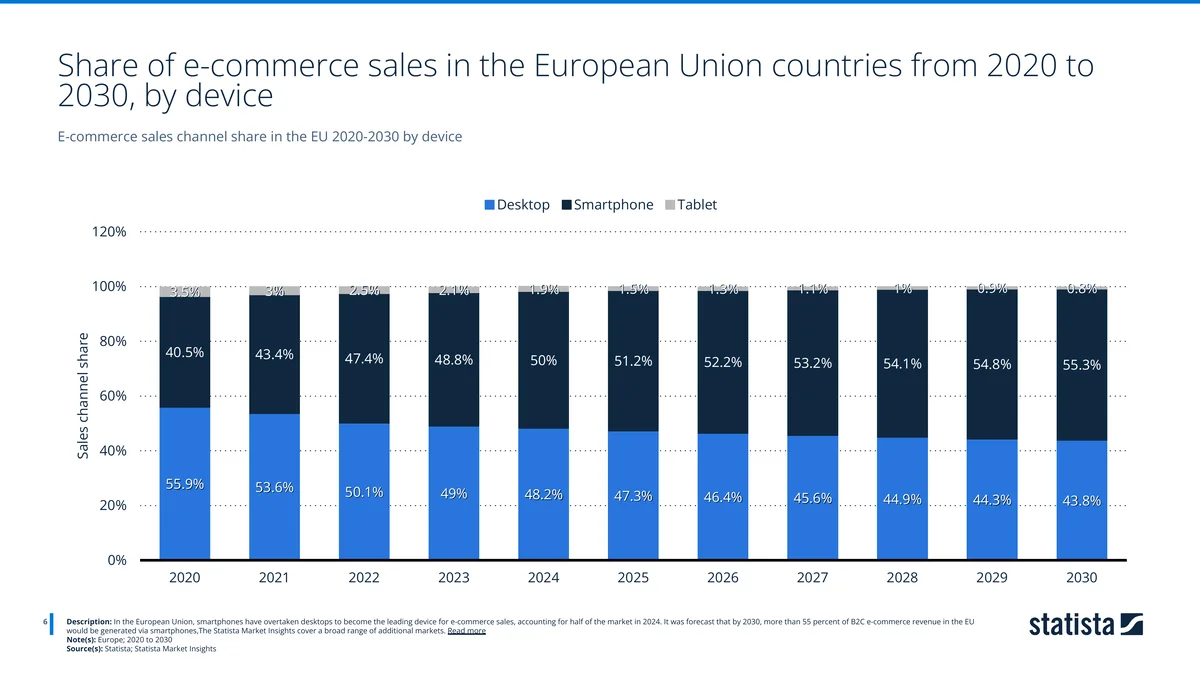
This is the chart I keep coming back to. In 2020, desktop drove 55.9% of EU e-commerce sales and smartphones 40.5%. By 2024 the lines crossed: smartphones hit 50%, desktop slipped to 48.2%, tablets faded to under 2%. By 2030 smartphones are modeled to reach 55.3%. The phone is the main shopping device in the EU now, full stop.
Here's where live data beats a forecast. I pulled Cloudflare Radar's device split for the big three over Q1 2026 (Jan–Mar), and the mobile shift is wildly uneven. Italy's already past the halfway line. Germany and France? Still desktop-led:
Mobile Share of Web Traffic: Italy, France & Germany (Q1 2026)
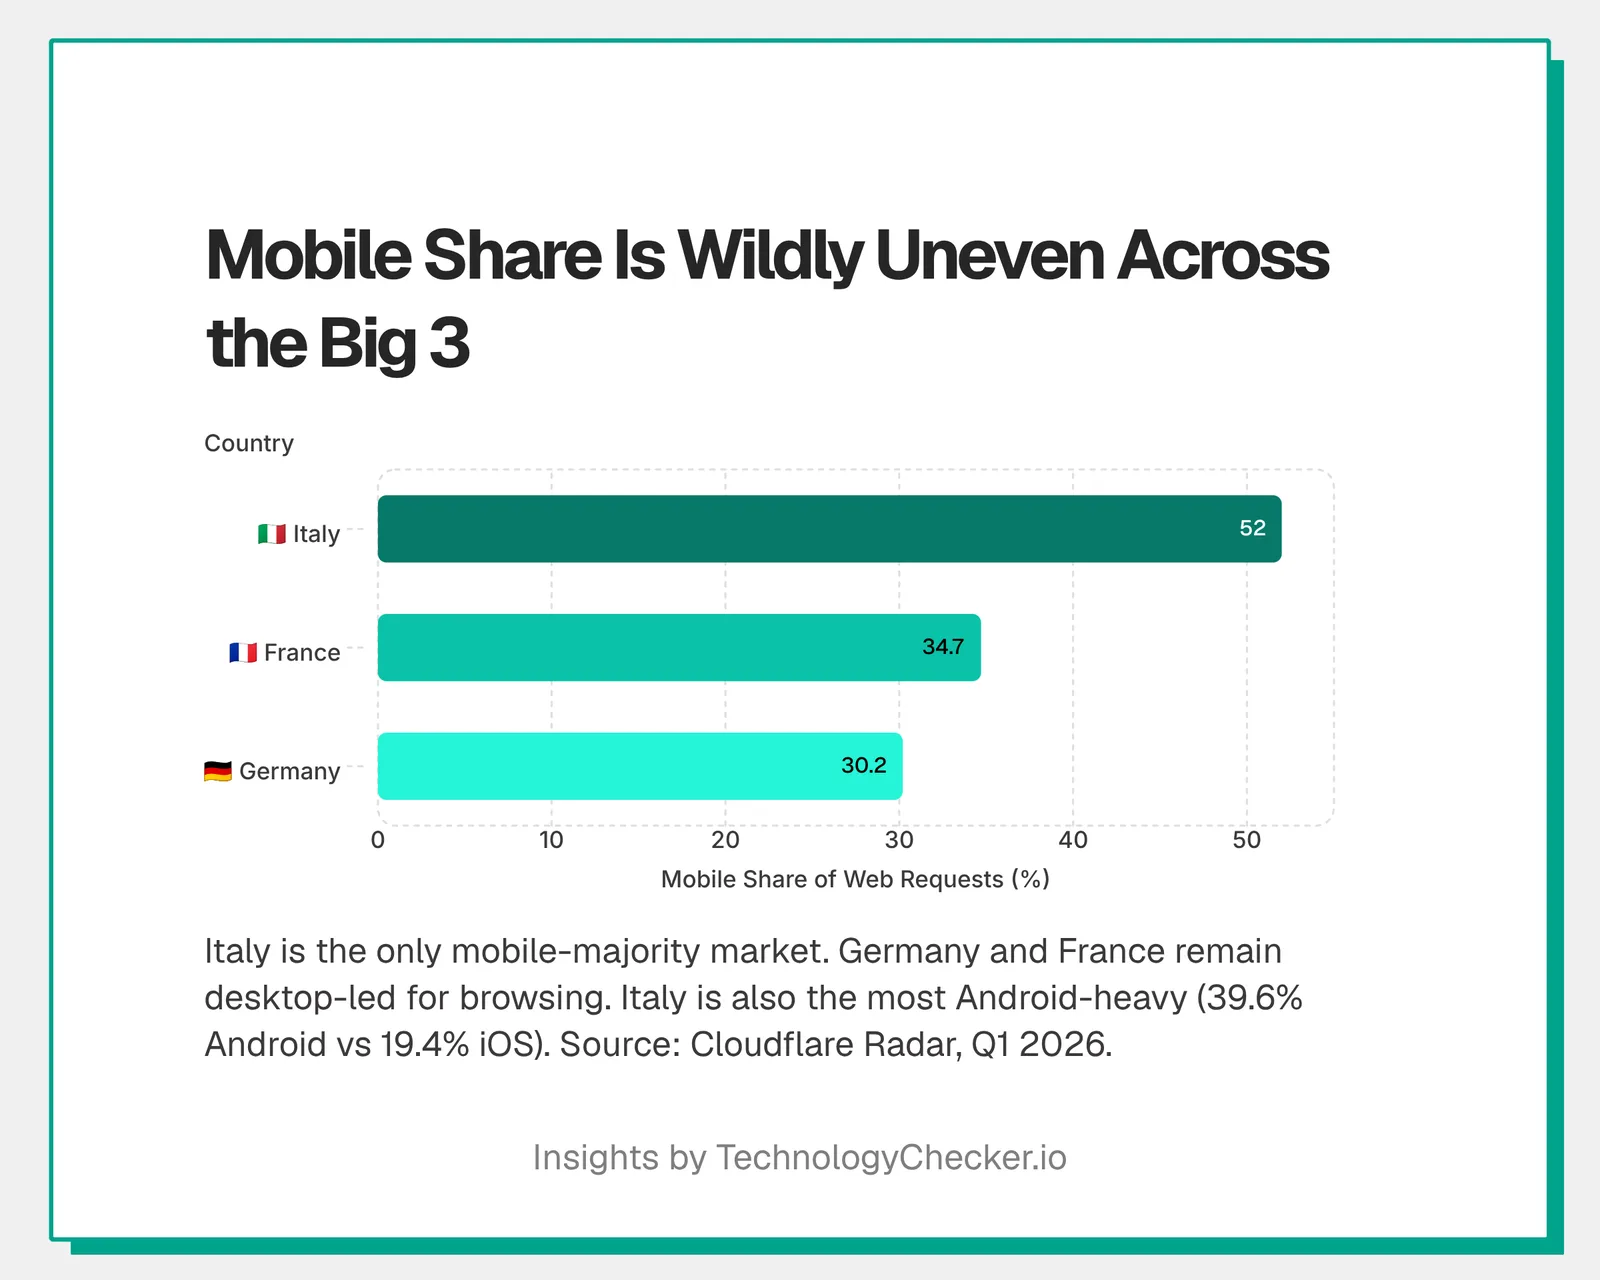
The shift to mobile is uneven across the EU's three largest e-commerce markets. In Q1 2026, Italy was the only one of the three where mobile crossed the majority line — 52.0% of web requests — while France (34.7%) and Germany (30.2%) remained desktop-led. The split is a proxy for how shoppers reach each market and a signal of where a mobile-first checkout matters most.
Source: Cloudflare Radar · Q1 2026 (Jan–Mar)
| Country | Mobile share of requests |
|---|---|
| Italy | 52% |
| France | 34.7% |
| Germany | 30.2% |
- Italy is the only one of the three where mobile leads — 52.0% of web requests
- Germany is the most desktop-led (just 30.2% mobile); France sits between at 34.7%
- Italy is also the most Android-skewed (39.6% Android vs 19.4% iOS)
One caveat, and it matters: Cloudflare measures all web requests, general browsing, not e-commerce conversions specifically. So you can't line these up one-to-one with the sales-channel figures above. The contrast still tells you plenty. Italy is already a mobile-majority web market, while Germany and France stay desktop-led for browsing even though smartphones drive half of EU e-commerce sales. My read? In Germany and France, shopping went mobile faster than everything else did. People grab the phone to buy, then go back to the desktop for the rest. Either way the lesson's the same: a checkout that isn't genuinely mobile-first leaves money on the table. Nowhere more than Italy.
Q2 2026 update (April–June). I re-pulled the same device split for the full second quarter, and the ranking holds with one honest wrinkle. Italy is still the mobile-majority market at 50.3%, France sits at 38.2%, Germany at 29.1%. Year on year, mobile's share of web requests actually eased in all three (Italy 53.4% → 50.3%, France 45.9% → 38.2%, Germany 31.7% → 29.1%). That is worth reading carefully: this is general browsing traffic, not the sales mix, and desktop keeps a firm grip on European browsing even while smartphones drive half of e-commerce sales. The part that changes how you build (Italy mobile-first, Germany and France desktop-led) hasn't budged.
Source: Cloudflare Radar — http/summary/device_type (location=DE/FR/IT), Q2 2026 vs Q2 2025. Pulled 2026-07-03.
⚠️ Cloudflare has since revised the all-requests device series. Re-pulled on 1 October 2026, Q2 2026 reads Italy 51.26%, France 39.12%, Germany 29.77%, and Q2 2025 reads 53.93%, 47.17% and 33.35%. The ranking and the year-on-year direction hold. Preserved as originally published; the Q3 2026 analysis above uses the revised series.
🏆 Germany, France and Italy: Europe's three powerhouses
When you rank the 27 EU markets, the same three names sit at the top of the revenue and user tables, which is why they anchor this report.
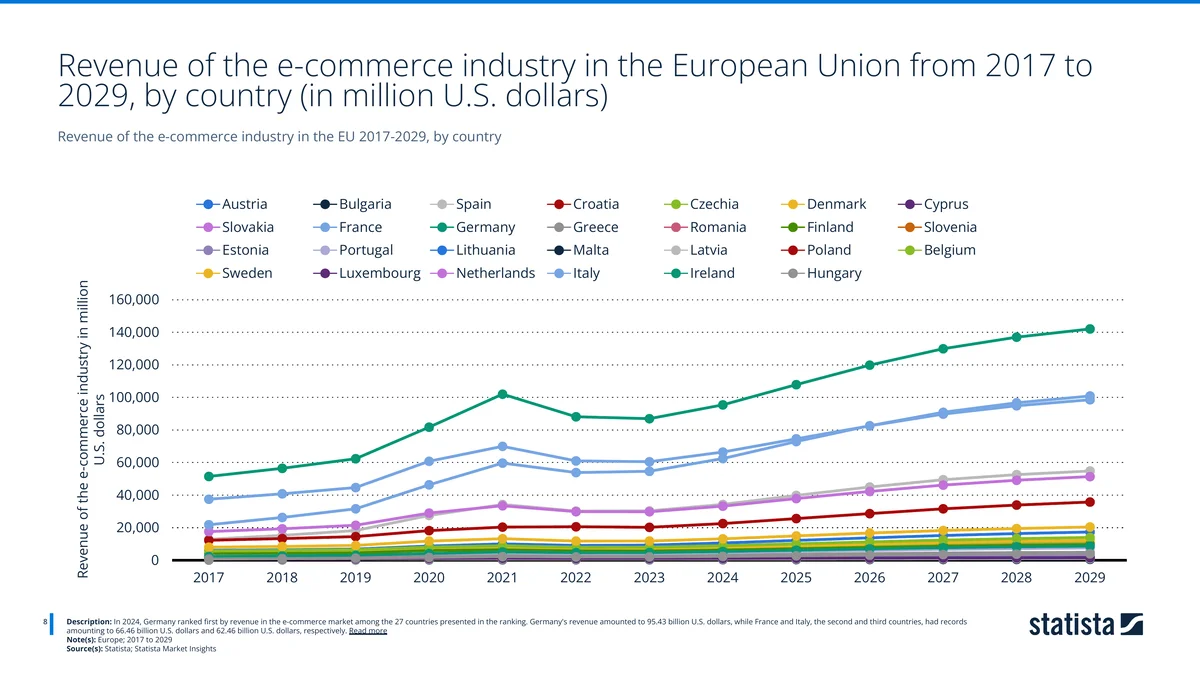
In 2024, Germany ranked first at $95.43 billion, well ahead of France ($66.46 billion) and Italy ($62.46 billion). The gap to the rest of the field is wide, Spain and Poland, the next tier, trail on much lower lines. Germany's lead also widens over the forecast period: its line pulls toward roughly $142 billion by 2029 while France approaches the $100 billion mark. These three markets alone represent the bulk of EU online retail revenue.
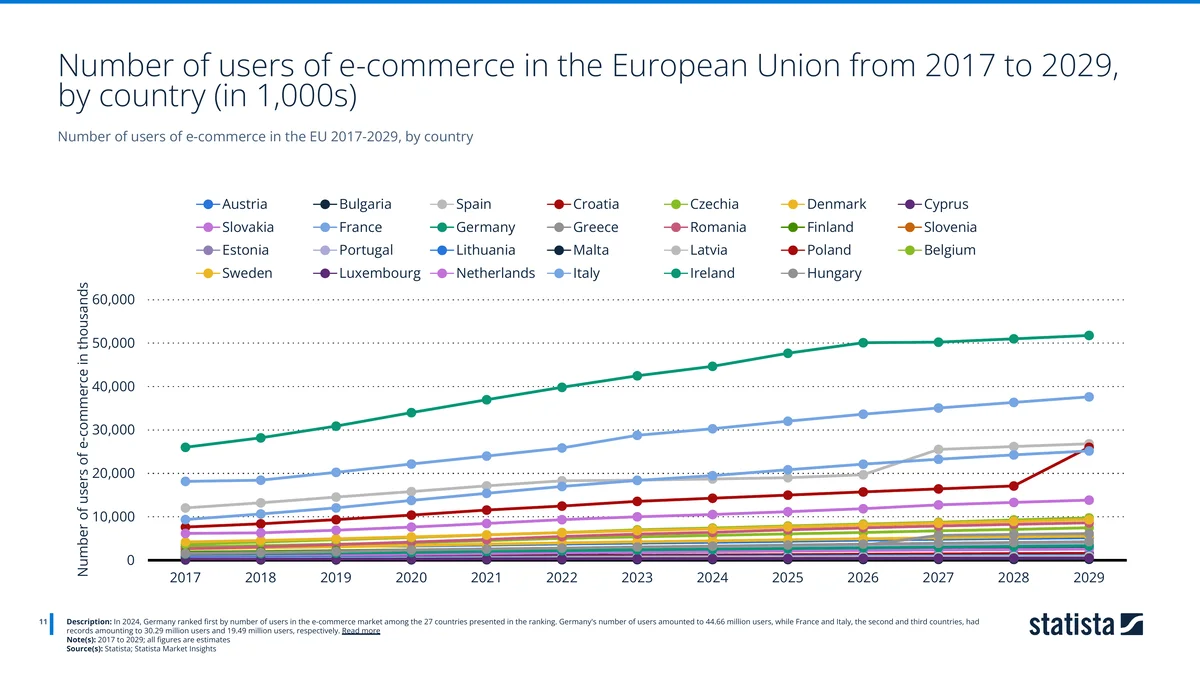
The user ranking matches the revenue ranking exactly. In 2024, Germany led with 44.66 million users, ahead of France (30.29 million) and Italy (19.49 million). The fact that the top three are identical on both measures is what makes Germany, France and Italy the natural lens for the whole European market, they are simultaneously the biggest by money and by people.
That scale rests on solid connectivity. Cloudflare Radar's Internet Quality Index puts the Q2 2026 median download speed at 30.4 Mbps in France, 24.4 Mbps in Germany, and 17.4 Mbps in Italy.
| Country | Median download (p50) | Faster connections (p75) |
|---|---|---|
| 🇫🇷 France | 30.4 Mbps | 49.5 Mbps |
| 🇩🇪 Germany | 24.4 Mbps | 37.7 Mbps |
| 🇮🇹 Italy | 17.4 Mbps | 28.8 Mbps |
Source: Cloudflare Radar — quality/iqi/summary (metric=bandwidth, p50 median and p75), FR/DE/IT, Q2 2026. Pulled 2026-07-03.
There's a neat tension in this data: Italy leads the three on mobile browsing but trails on median download speed. A market that shops on phones over slower-than-average connections is exactly the market where heavy, image-bloated storefronts hurt most. Fast, lightweight pages aren't a nice-to-have there, they're a conversion lever.
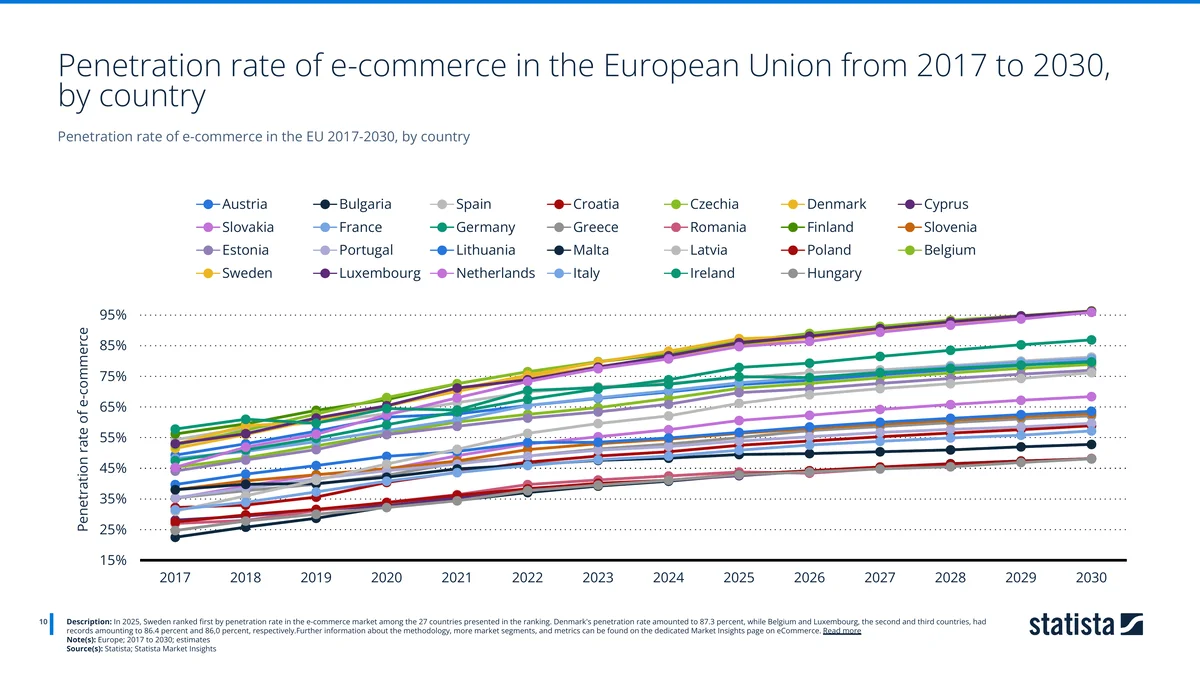
Size and saturation are different things, though. By penetration rate, the leaders are the smaller, wealthier northern markets: in 2025 Denmark reached 87.3%, with Belgium (86.4%) and Luxembourg (86.0%) close behind, and Sweden topping the ranking. Germany, France and Italy are huge in absolute terms but still have penetration headroom, which is part of why their revenue lines keep climbing.
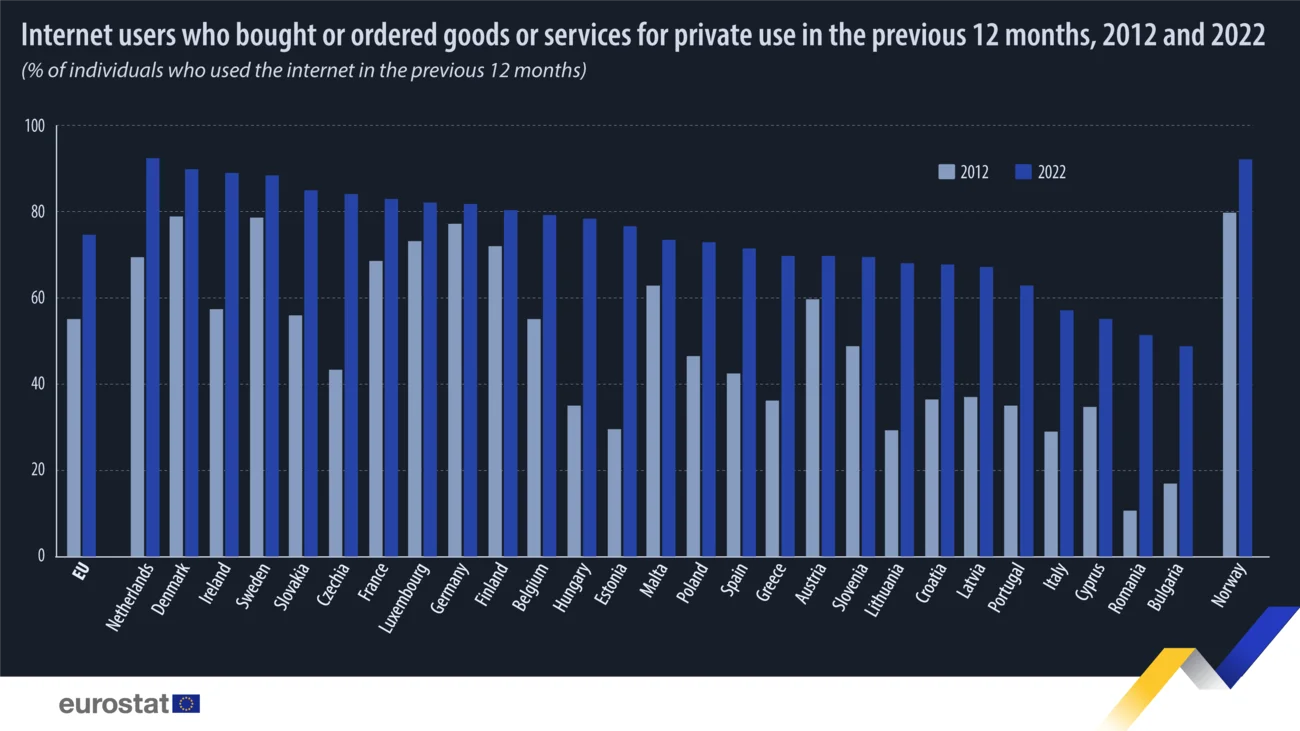
Eurostat's own survey shows the same north-south gradient over the past decade. By 2022, more than 80% of internet users in Germany, France, the Netherlands and the Nordics had bought something online in the previous year, while Italy sat closer to 57%. That gap is exactly the headroom that keeps Italy's revenue line climbing fastest. (Source: Eurostat.)
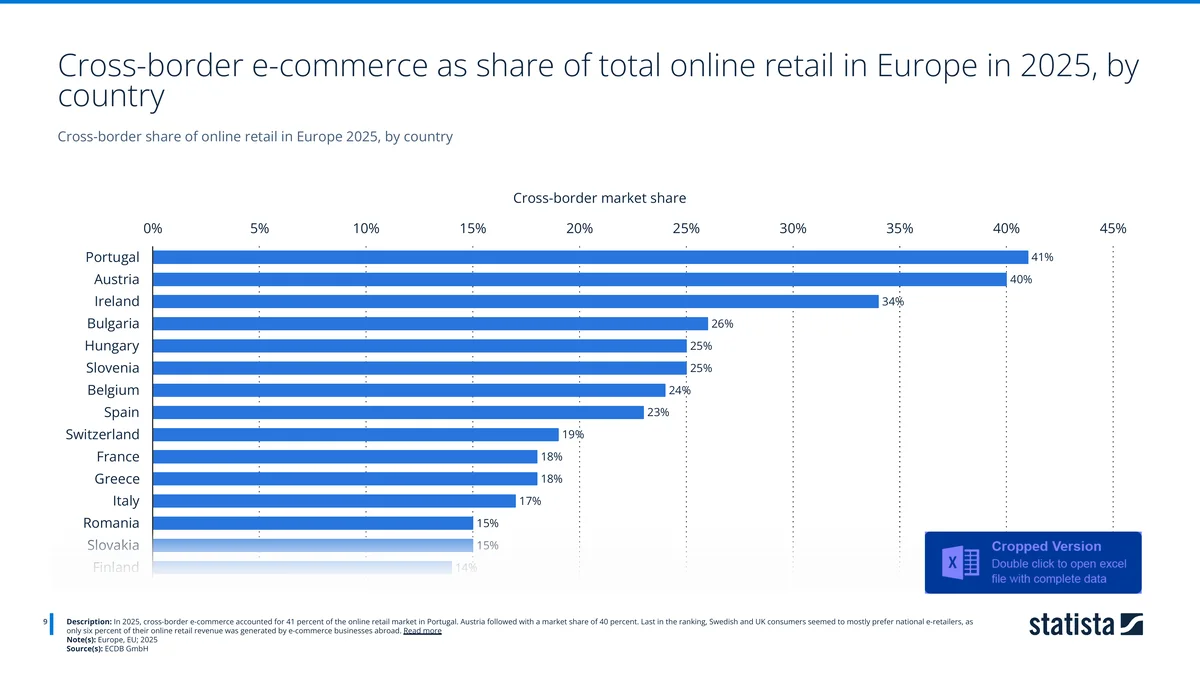
Cross-border appetite varies even more. In 2025, cross-border purchases made up 41% of online retail in Portugal and 40% in Austria, followed by Ireland (34%). The big three sit lower, France 18%, Italy 17%, because large domestic markets with strong local retailers keep more spend at home. Smaller markets, with fewer domestic options, naturally shop abroad more. (Source: ECDB GmbH.)
🔎 What we actually detect: the platforms behind each market
The market figures tell you how big each market is. Our own detection tells you what's actually running inside it, and this is where the three markets stop looking alike. We track 13 platforms in our e-commerce platforms category, fingerprinting what each site runs from its public signals across our crawl. Globally, the ranking is the one you'd expect:
| Platform | Businesses we detect (global) | Category share |
|---|---|---|
| Shopify | 2,446,083 | 46.0% |
| WooCommerce | 946,491 | 17.8% |
| Wix eCommerce | 411,241 | 7.9% |
| Ecwid | 137,062 | 2.6% |
| Magento | 23,497 | , |
| PrestaShop | 41,462 | 0.75% |
Source: TechnologyChecker detection data, May 2026 crawl. "Businesses we detect" counts distinct businesses running each platform; category share is within the e-commerce platforms category.
Now narrow the lens to the merchants we've matched to a specific country, a sample of the full detection set, enriched with company data, and the leaderboard flips. The table below ranks platforms by the number of businesses we've matched in each market. (These are sample counts, not full market totals; the value is in the ordering, which is consistent and country-specific.)
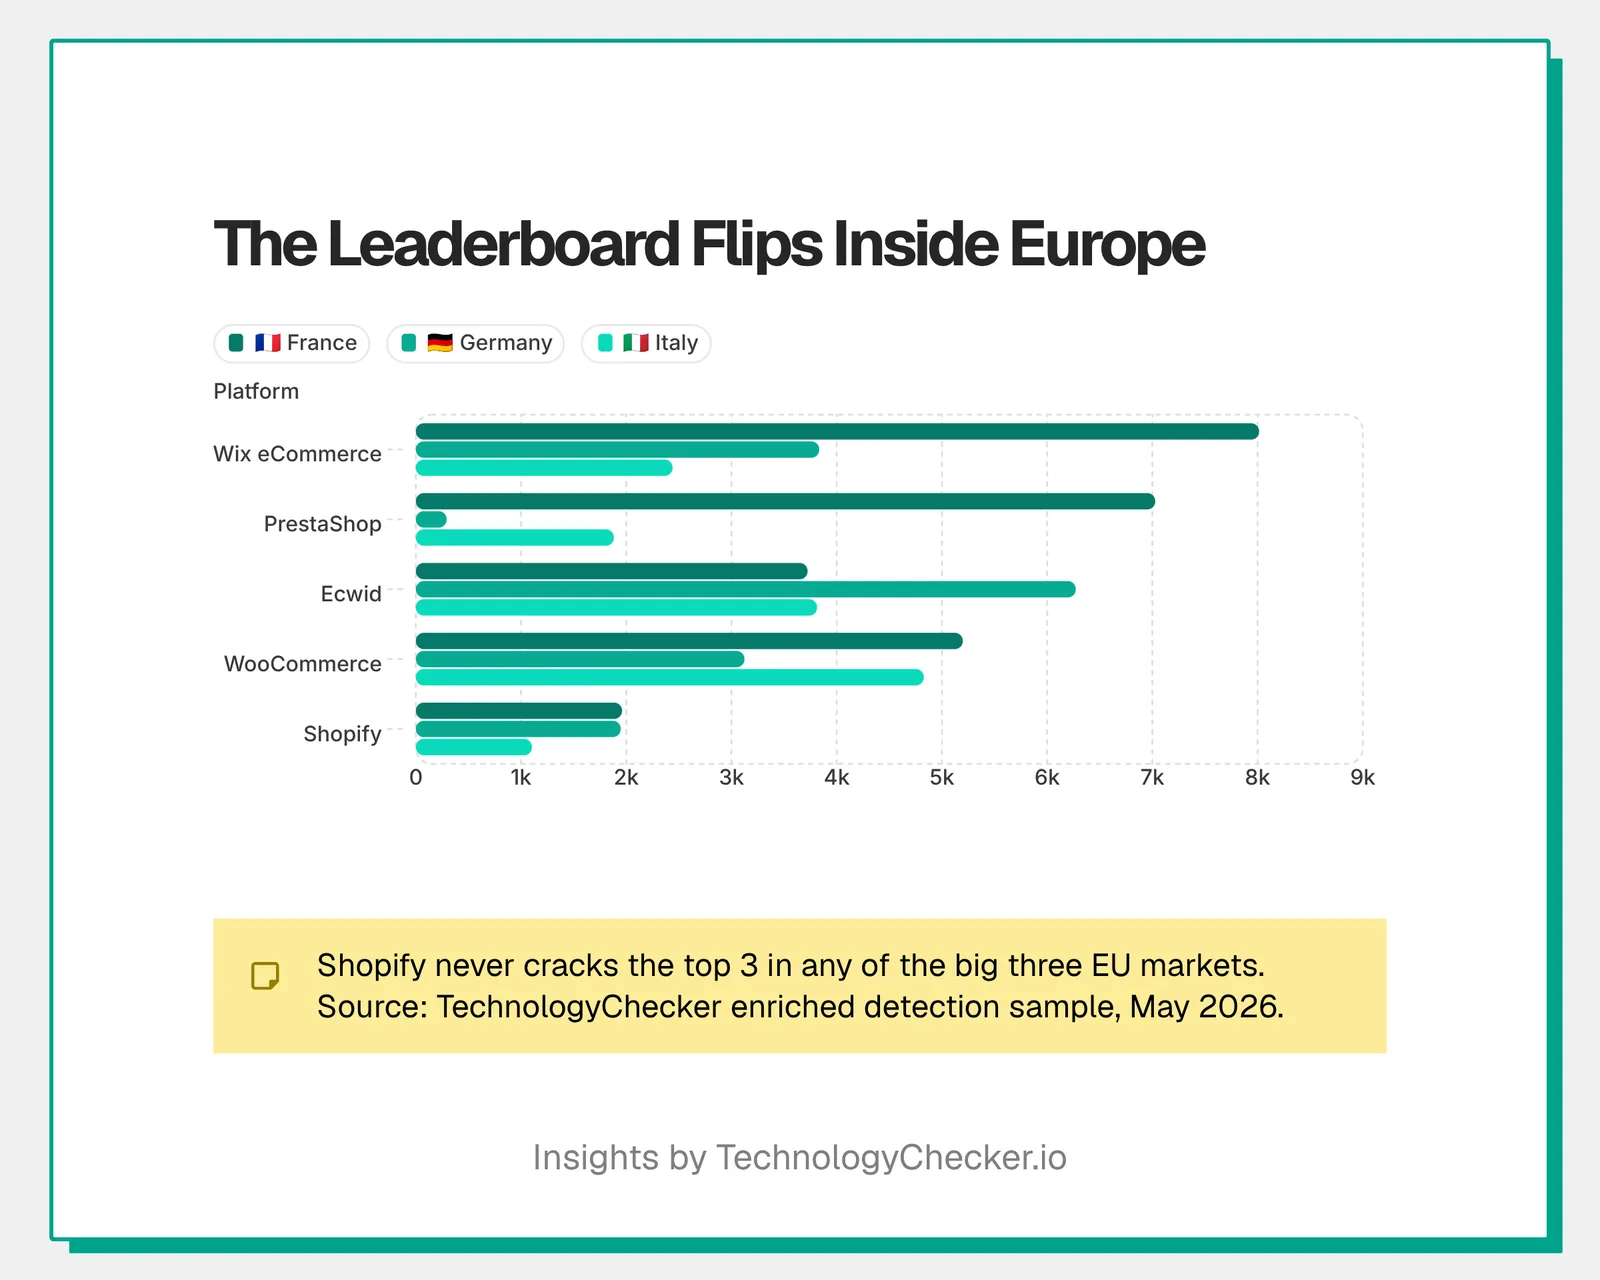
| Rank | 🇩🇪 Germany | 🇫🇷 France | 🇮🇹 Italy |
|---|---|---|---|
| 1 | Ecwid (6,272) | Wix eCommerce (8,014) | WooCommerce (4,827) |
| 2 | Wix eCommerce (3,834) | PrestaShop (7,027) | Ecwid (3,813) |
| 3 | WooCommerce (3,123) | WooCommerce (5,198) | Wix eCommerce (2,440) |
| 4 | Shopify (1,947) | Ecwid (3,723) | PrestaShop (1,882) |
| 5 | Magento (989) | Shopify (1,960) | Shopify (1,103) |
| 6 | Webflow (648) | Webflow (897) | Magento (520) |
Source: TechnologyChecker enriched detection sample (businesses matched to a country), May 2026.
Three patterns stand out, and none of them match the global ranking.
France is PrestaShop country. PrestaShop is barely a rounding error globally (0.75% category share), yet in France we match 7,027 businesses running it, second only to Wix, and roughly 3.6 times the 1,960 we match on Shopify. That's the home-field effect: PrestaShop was built in France, and French merchants have stuck with it. The contrast across borders is stark, the same platform shows 7,027 businesses in France but just 293 in Germany and 1,882 in Italy.
WooCommerce is the quiet workhorse. The open-source WordPress plugin leads Italy outright (4,827) and ranks third in both Germany (3,123) and France (5,198). Where merchants already run WordPress for content, bolting on WooCommerce is the path of least resistance, and it shows up as consistent strength across all three markets rather than dominance in one.
Shopify punches below its global weight here. Despite running 46% of the category worldwide, Shopify is 4th in Germany and 5th in both France and Italy, never cracking the top three. The lightweight SMB builders (Wix, Ecwid) and the open-source incumbents (WooCommerce, PrestaShop) hold the upper ranks. The takeaway for anyone selling tools or services into these markets: the platform you target in a US pitch is not the one most merchants run in Frankfurt, Lyon or Milan.
🌍 Country profiles: the big three at a glance
Put the three data sources together, the market-size figures, our platform detection, and Cloudflare Radar's live Q2 2026 traffic, and each market gets a distinct profile worth selling and building against. The device and speed figures in the three profiles are Q2 2026; the Q3 2026 readings are in the Q3 analysis near the top of this post.
🇩🇪 Germany: the desktop-led giant
Germany is the EU's largest online market at $95.4 billion in revenue and 44.7 million users (2024). It's also the most desktop-oriented of the three: in Q2 2026, mobile was just 29.1% of web requests, and the device base skews toward Windows (38.8%) with mobile OS at 45.3% (Android 26.7%, iOS 18.6%). Median download speed sits mid-pack at 24.4 Mbps. On platforms, Ecwid leads our matched sample (6,272), then Wix (3,834) and WooCommerce (3,123), with Shopify 4th. The enterprise end shows a home-market pull: 447 of the companies that use SAP Commerce Cloud we can match are in Germany, close to the 518 in the United States (September 2026 crawl). Shopware, built in Germany, shows the same pull further down the market: 86.7% of the Shopware customers we can place by country are in Germany, Austria or Switzerland (September 2026 crawl). Trust badges follow the same map: 6,032 of the 10,852 companies that use Trusted Shops we can place by country are German, which makes it the second review tool among German companies in our data, behind Trustindex's Google-review widget (September 2026 crawl). On payments, Germans are notably credit-card-averse, credit cards are just 11% of online value here, the lowest of the big three, while A2A bank transfers (15%) run above the European average. The practical read: a German-facing store needs strong desktop UX and local bank-transfer/invoice options far more than it needs a card-first checkout.
Top E-Commerce Platforms in Germany 2026: Ecwid and Wix Lead
In Germany, the e-commerce platform mix is led by lightweight SMB builders. Among the merchants TechnologyChecker matches to Germany, Ecwid (6,272) and Wix eCommerce (3,834) rank first and second, followed by WooCommerce (3,123). Shopify sits fourth (1,947) — outside the top three despite its 46% global category share.
Source: TechnologyChecker detection data · May 2026 crawl
| Platform | Merchants (matched sample) |
|---|---|
| Ecwid | 6272 |
| Wix eCommerce | 3834 |
| WooCommerce | 3123 |
| Shopify | 1947 |
| Magento | 989 |
| Webflow | 648 |
- Ecwid (6,272) and Wix eCommerce (3,834) lead Germany — both lightweight SMB builders
- WooCommerce ranks third (3,123); Shopify is fourth (1,947)
- No single platform dominates the German sample the way Shopify does globally
🇫🇷 France: fast connections, homegrown software
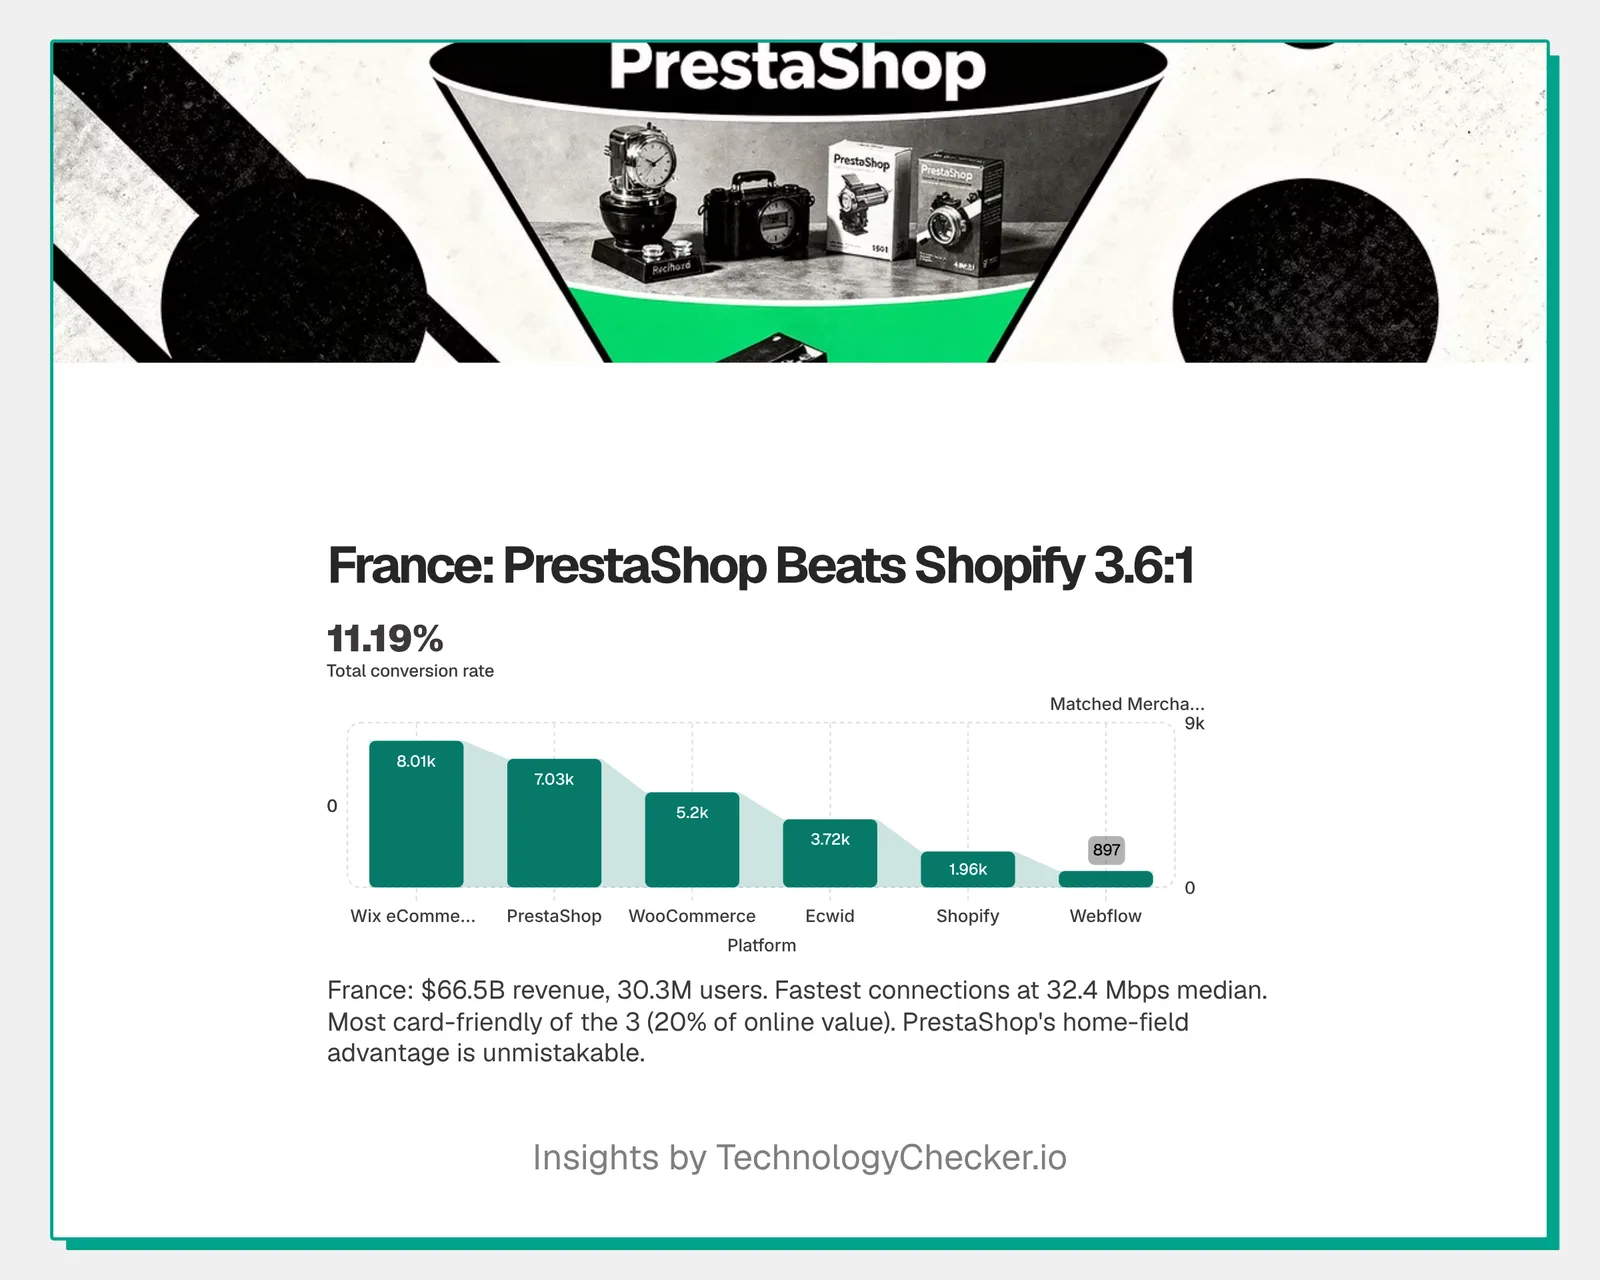
France is the EU's second market at $66.5 billion and 30.3 million users. It posts the fastest median download speed of the three at 30.4 Mbps (top-quartile connections reach 49.5 Mbps), and mobile is a moderate 38.2% of web requests. The platform story is the most distinctive in Europe: Wix leads our matched sample (8,014), but PrestaShop is right behind at 7,027, the home-built platform that French merchants favour over Shopify by ~3.6:1. France is also the most credit-card-friendly of the three (20% of online value), while A2A is marginal (8%). Selling into France means accounting for a PrestaShop-heavy installed base and a card-comfortable shopper on fast connections.
Top E-Commerce Platforms in France 2026: PrestaShop Beats Shopify
France is the most distinctive e-commerce market in Europe. Among the merchants TechnologyChecker matches to France, Wix eCommerce (8,014) leads, but the French-built PrestaShop is right behind at 7,027 — roughly 3.6 times the 1,960 we match on Shopify. WooCommerce (5,198) ranks third. Shopify, the global category leader, sits fifth.
Source: TechnologyChecker detection data · May 2026 crawl
| Platform | Merchants (matched sample) |
|---|---|
| Wix eCommerce | 8014 |
| PrestaShop | 7027 |
| WooCommerce | 5198 |
| Ecwid | 3723 |
| Shopify | 1960 |
| Webflow | 897 |
- PrestaShop (French-built) reaches 7,027 matched merchants — roughly 3.6x the 1,960 on Shopify
- Wix eCommerce leads outright (8,014); WooCommerce is third (5,198)
- Shopify ranks only fifth in France despite leading the category globally
🇮🇹 Italy: mobile-first, WooCommerce-led
Italy is the third market at $62.5 billion and 19.5 million users, and it's the clear behavioural outlier. In Q2 2026 it was the only one of the three where mobile crossed the majority line, 50.3% of web requests, and it's the most Android-skewed (37.4% Android vs. 18.8% iOS, a 2:1 ratio). It also has the lowest median download speed at 17.4 Mbps. That combination, mobile-majority shopping over slower-than-average connections, makes page weight a direct conversion cost in Italy more than anywhere else. On platforms, WooCommerce leads our matched sample (4,827), then Ecwid (3,813) and Wix (2,440), with PrestaShop 4th. Italian websites have their own consent favourite too: iubenda ranks ninth of 129 consent and privacy tools worldwide but first among Italian companies in our data, with 70,590 Italian companies that use iubenda matched, about 2.1 times CookieYes (September 2026 crawl). A mobile-first, lightweight, WooCommerce-aware build is the right default for the Italian market.
Top E-Commerce Platforms in Italy 2026: WooCommerce Leads
Italy's e-commerce platform mix is led by open-source WooCommerce. Among the merchants TechnologyChecker matches to Italy, WooCommerce (4,827) ranks first, ahead of Ecwid (3,813) and Wix eCommerce (2,440). The French-built PrestaShop is fourth (1,882) and Shopify fifth (1,103) — outside the top three despite its global lead.
Source: TechnologyChecker detection data · May 2026 crawl
| Platform | Merchants (matched sample) |
|---|---|
| WooCommerce | 4827 |
| Ecwid | 3813 |
| Wix eCommerce | 2440 |
| PrestaShop | 1882 |
| Shopify | 1103 |
| Magento | 520 |
- WooCommerce leads Italy (4,827) — the open-source WordPress plugin is the country's most-matched platform
- Ecwid (3,813) and Wix eCommerce (2,440) follow; PrestaShop is fourth (1,882)
- Shopify ranks fifth (1,103), outside the top three again
🏢 How European businesses are adopting e-commerce
Consumer demand is only half the picture. The Eurostat data shows how deeply European companies have built selling online into their revenue.
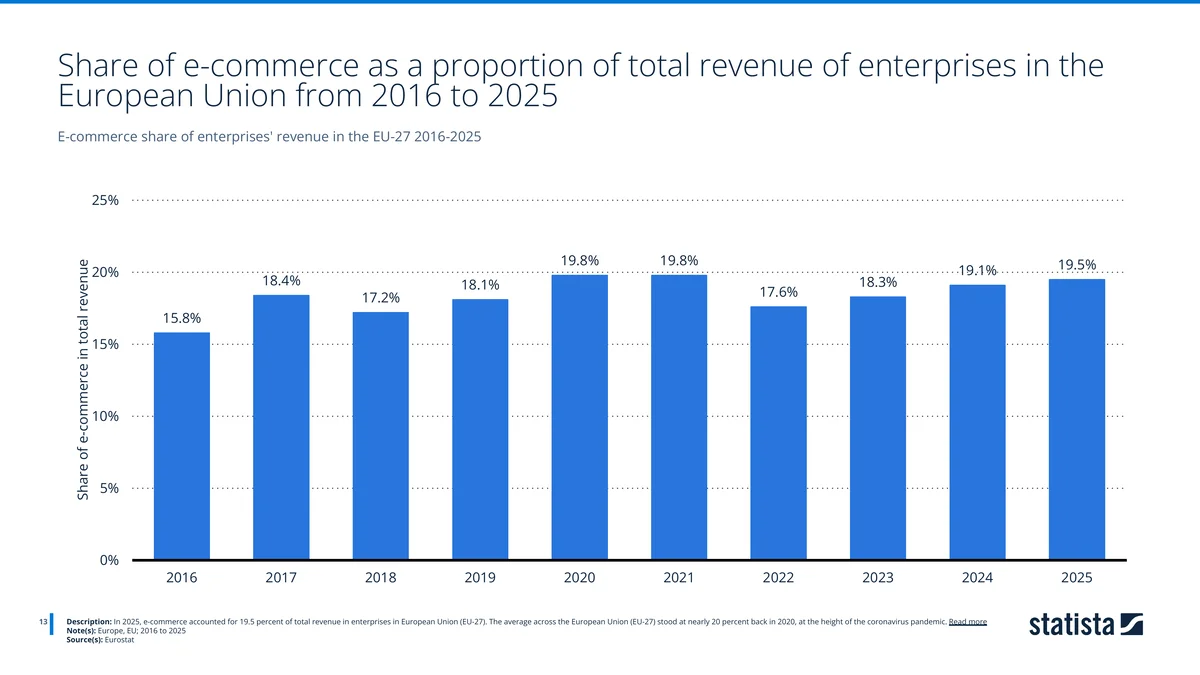
In 2025, e-commerce accounted for 19.5% of total enterprise revenue across the EU-27, roughly one euro in five. That share has been remarkably stable, hovering near 18-20% since the 2020 pandemic peak. E-commerce has, in other words, matured into a structural part of how European businesses earn, not a bolt-on channel.
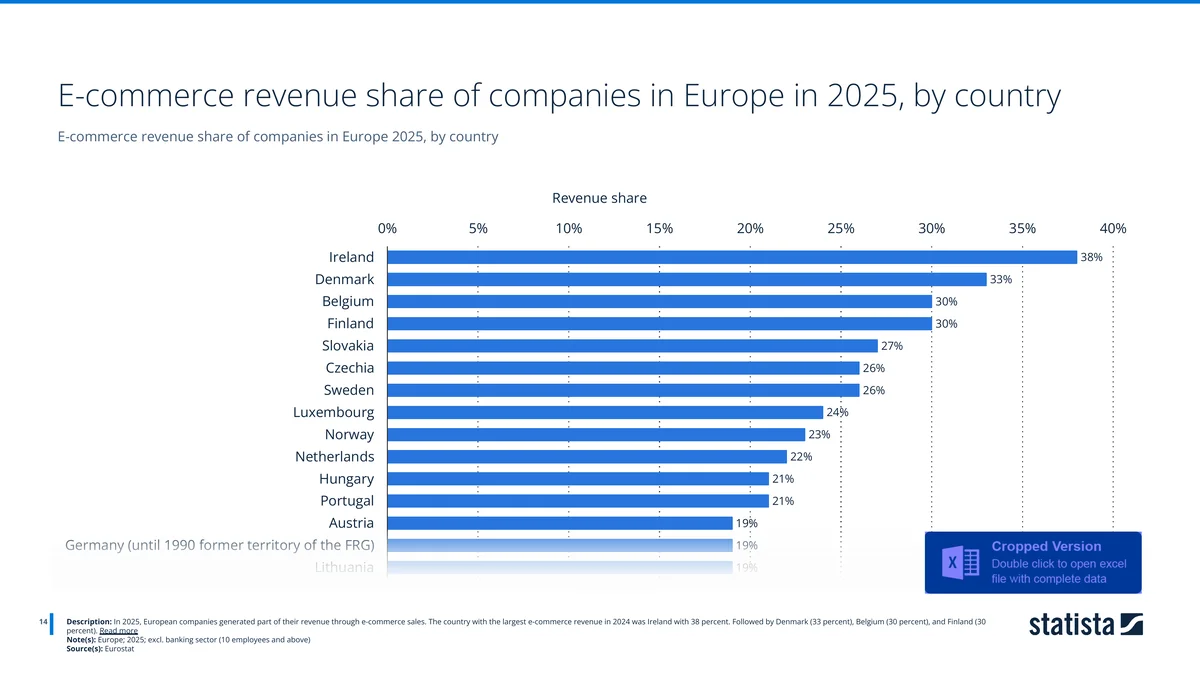
By country, Ireland leads at 38% of company revenue from e-commerce, inflated by the multinationals headquartered there, followed by Denmark (33%), Belgium (30%) and Finland (30%). Germany and Austria sit around 19%, closer to the EU average. High consumer penetration and high business revenue share don't always line up in the same countries.
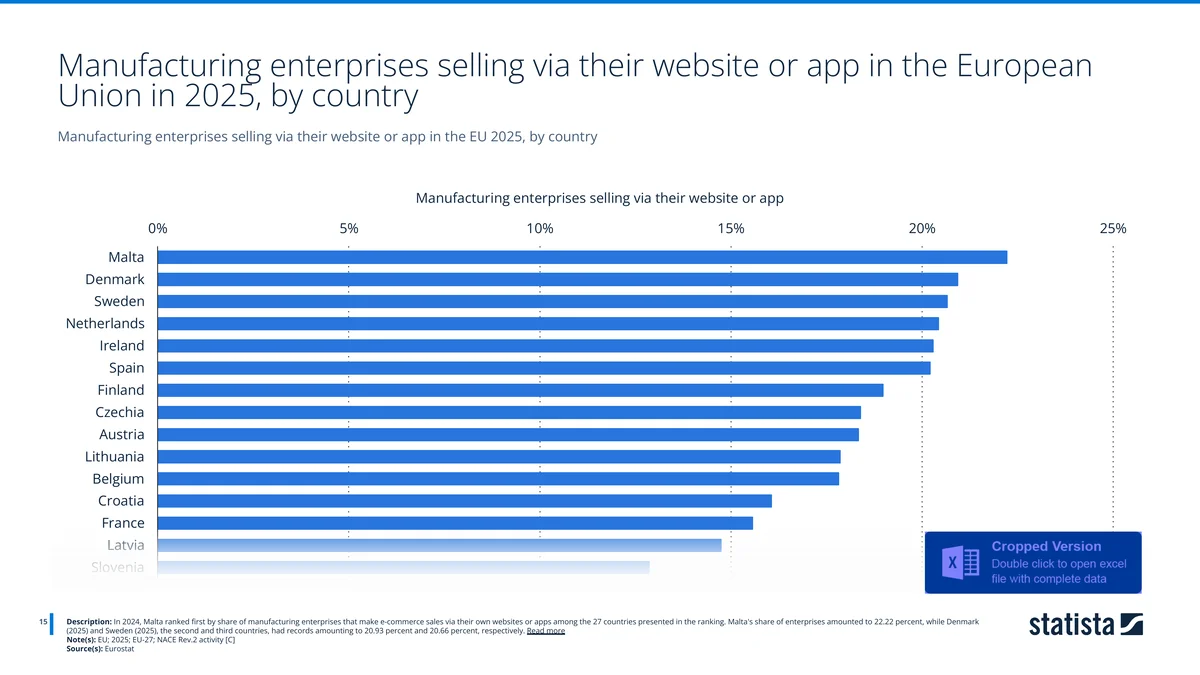
Even manufacturers are selling direct. In 2024, Malta ranked first with 22.2% of manufacturing enterprises selling via their own website or app, ahead of Denmark (20.9%) and Sweden (20.7%). The trend toward direct-to-consumer and direct-to-business selling has reached the factory floor.
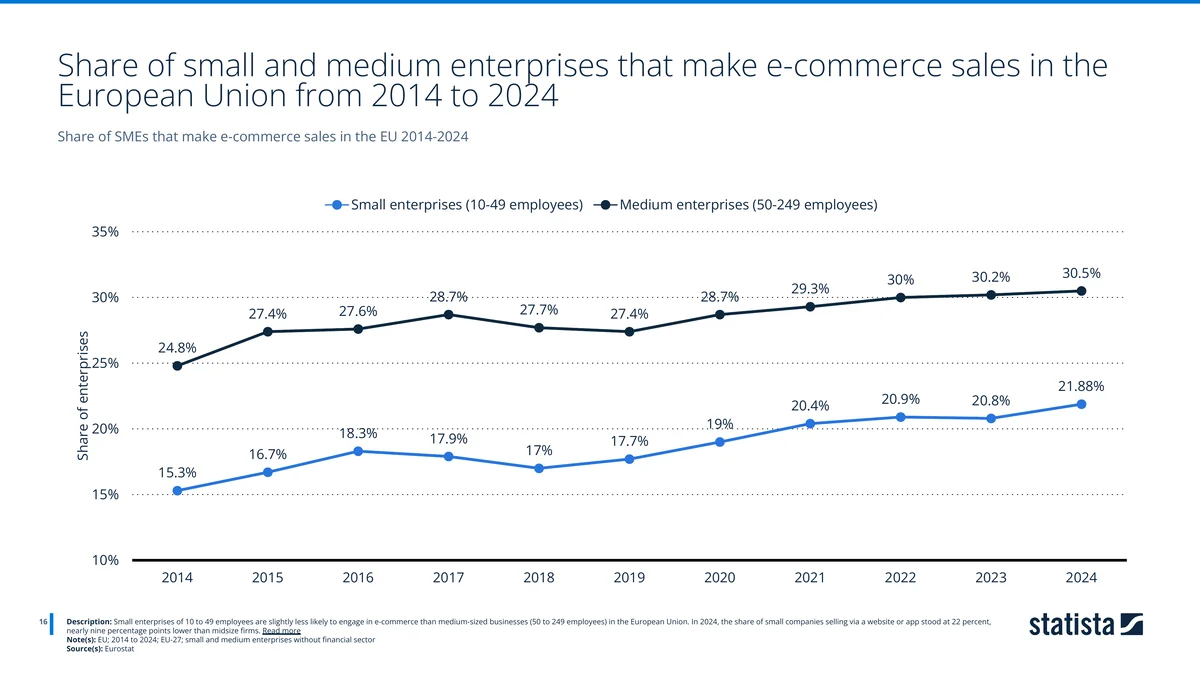
Among smaller companies, adoption is climbing but uneven by size. In 2024, 30.5% of medium-sized enterprises (50-249 employees) made e-commerce sales, versus 21.9% of small enterprises (10-49 employees), a gap of nearly nine points that has persisted for a decade. Both lines trend up, but mid-size firms have consistently led.
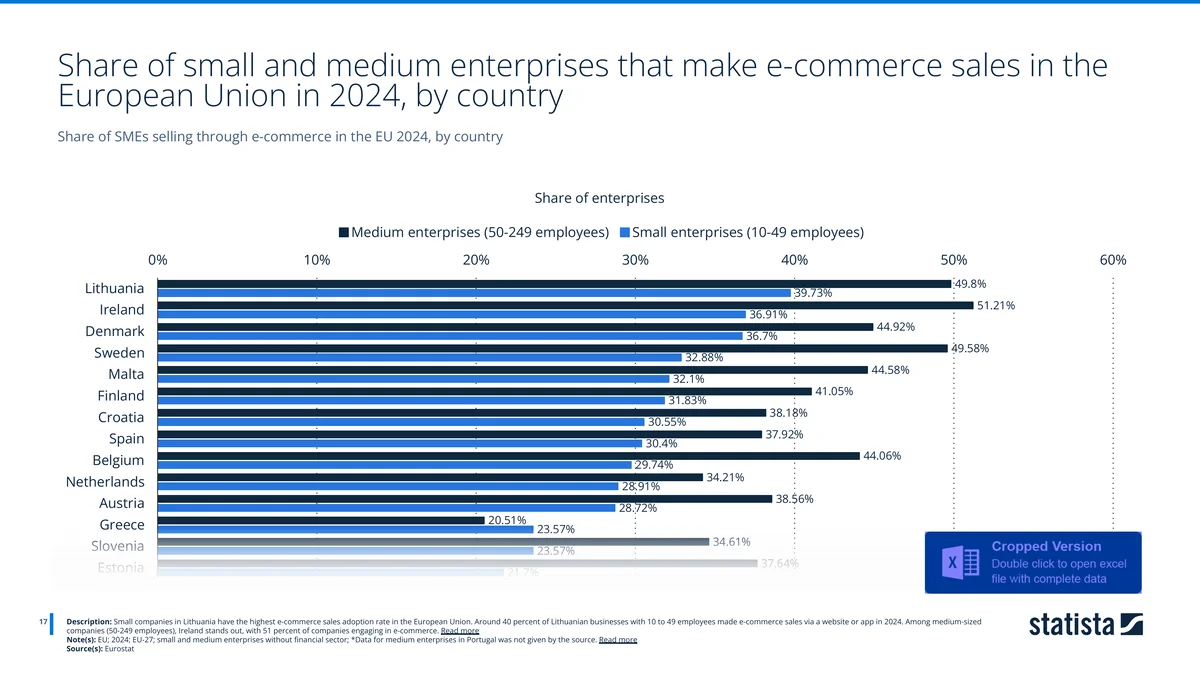
By country, the leaders aren't the largest economies. Around 40% of small Lithuanian businesses sold online via a website or app in 2024, the highest small-firm adoption in the EU, while Ireland topped medium-sized firms at 51%. Smaller, digitally-forward economies often outpace the big three on SME adoption, even when the big three dominate total revenue.
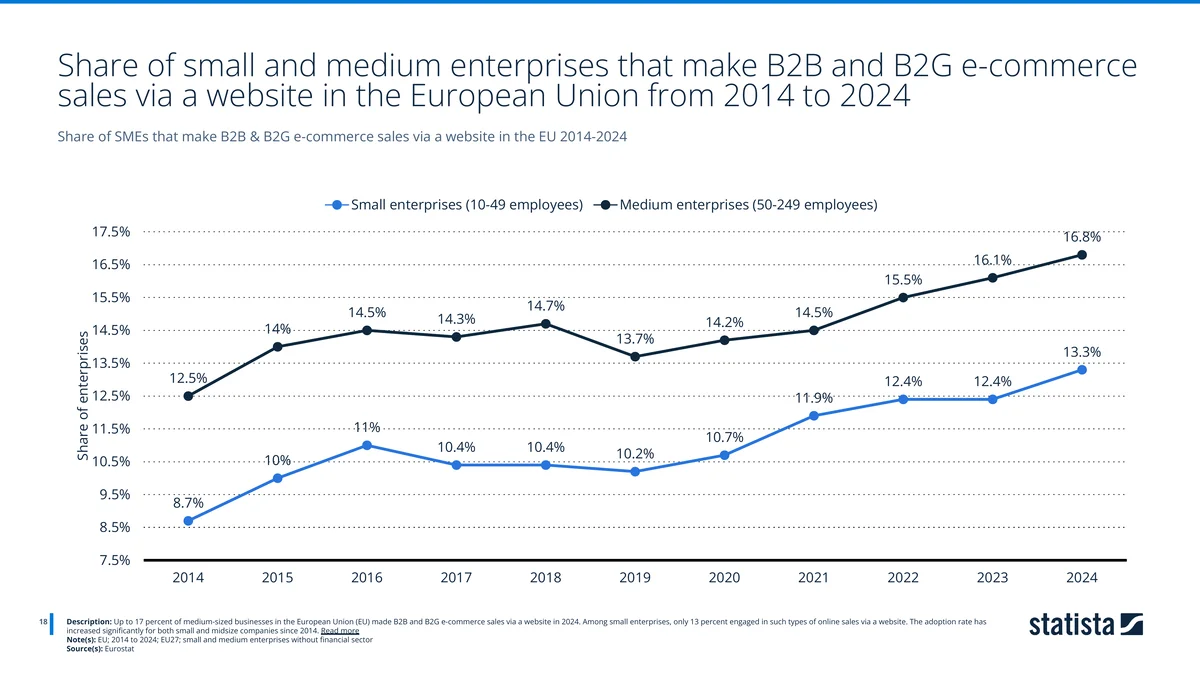
Business-to-business and business-to-government selling is smaller but rising. In 2024, 16.8% of medium-sized firms and 13.3% of small firms made B2B/B2G sales through a website, both up meaningfully since 2014, with the steepest gains coming after 2020.
💳 How Europe pays (spoiler: not with credit cards)
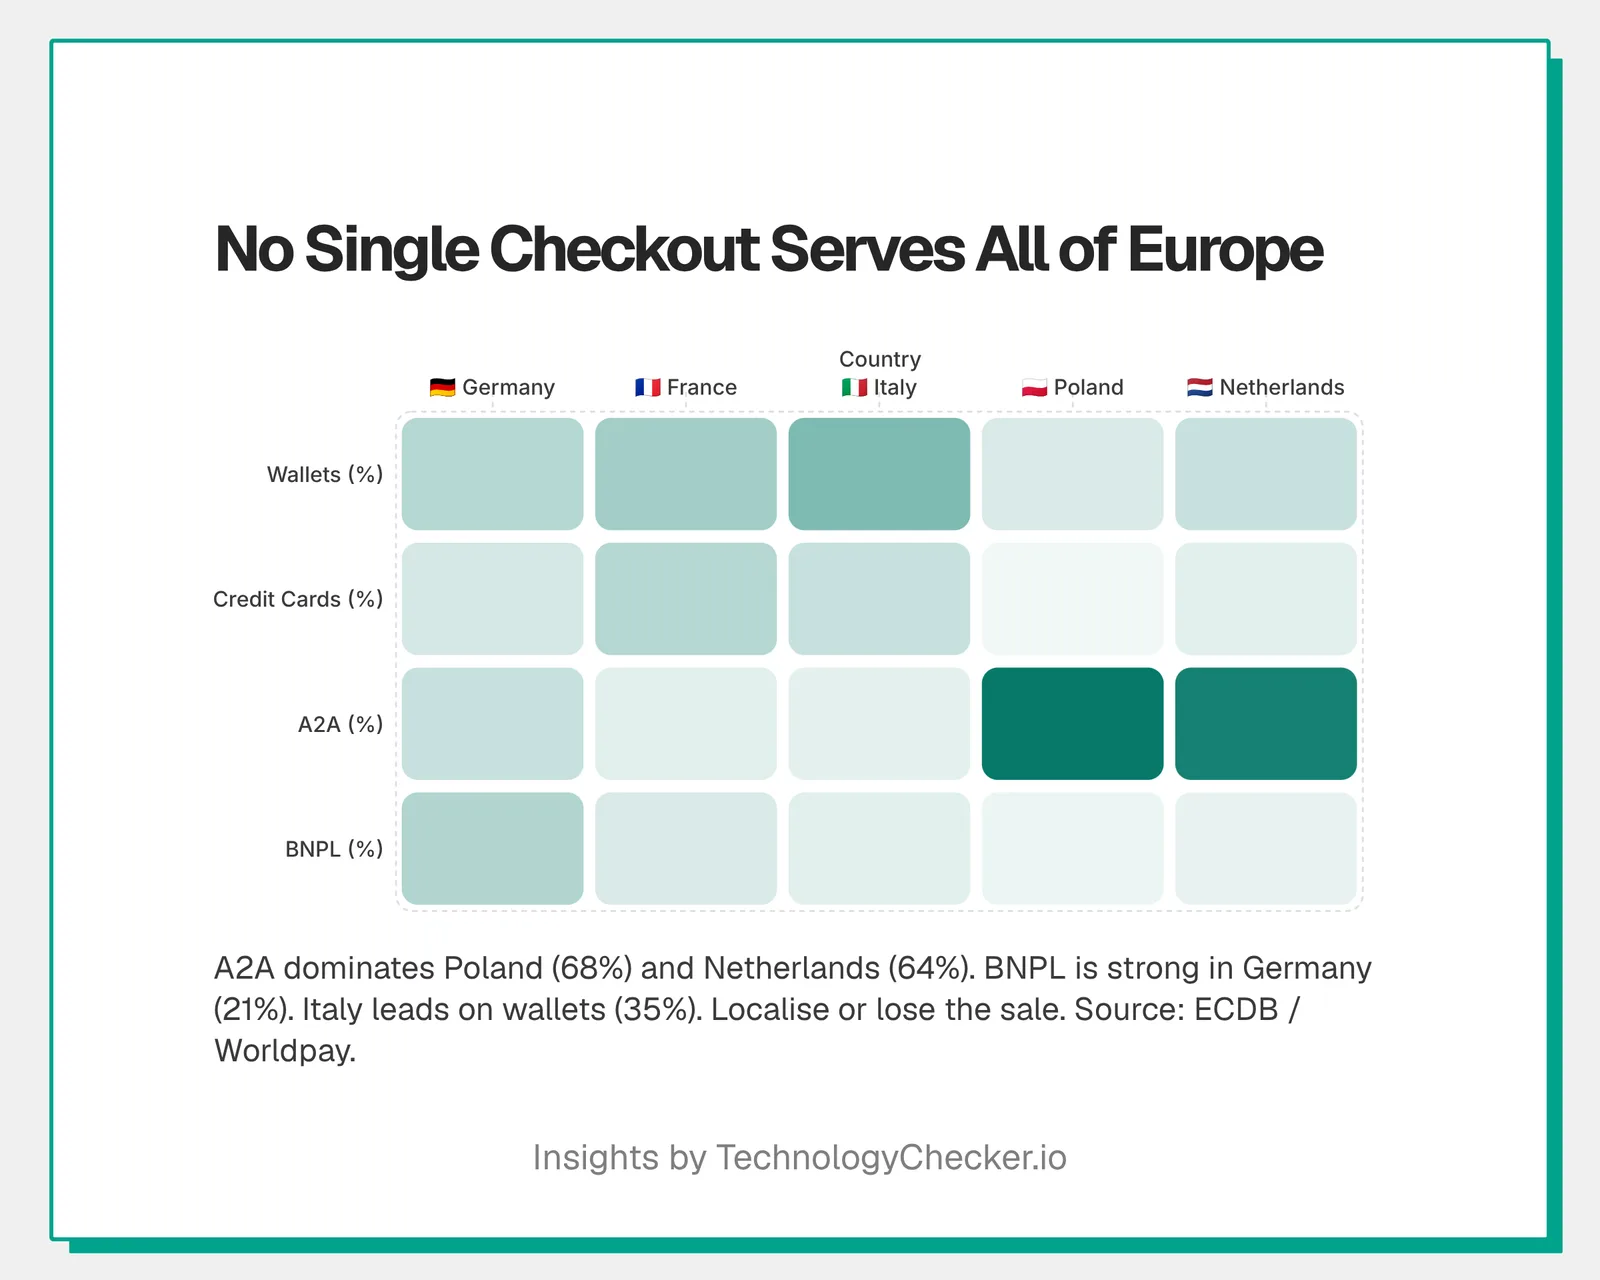
Payment mix is where Europe looks least like a single market, and where a wrong default can quietly kill conversions.
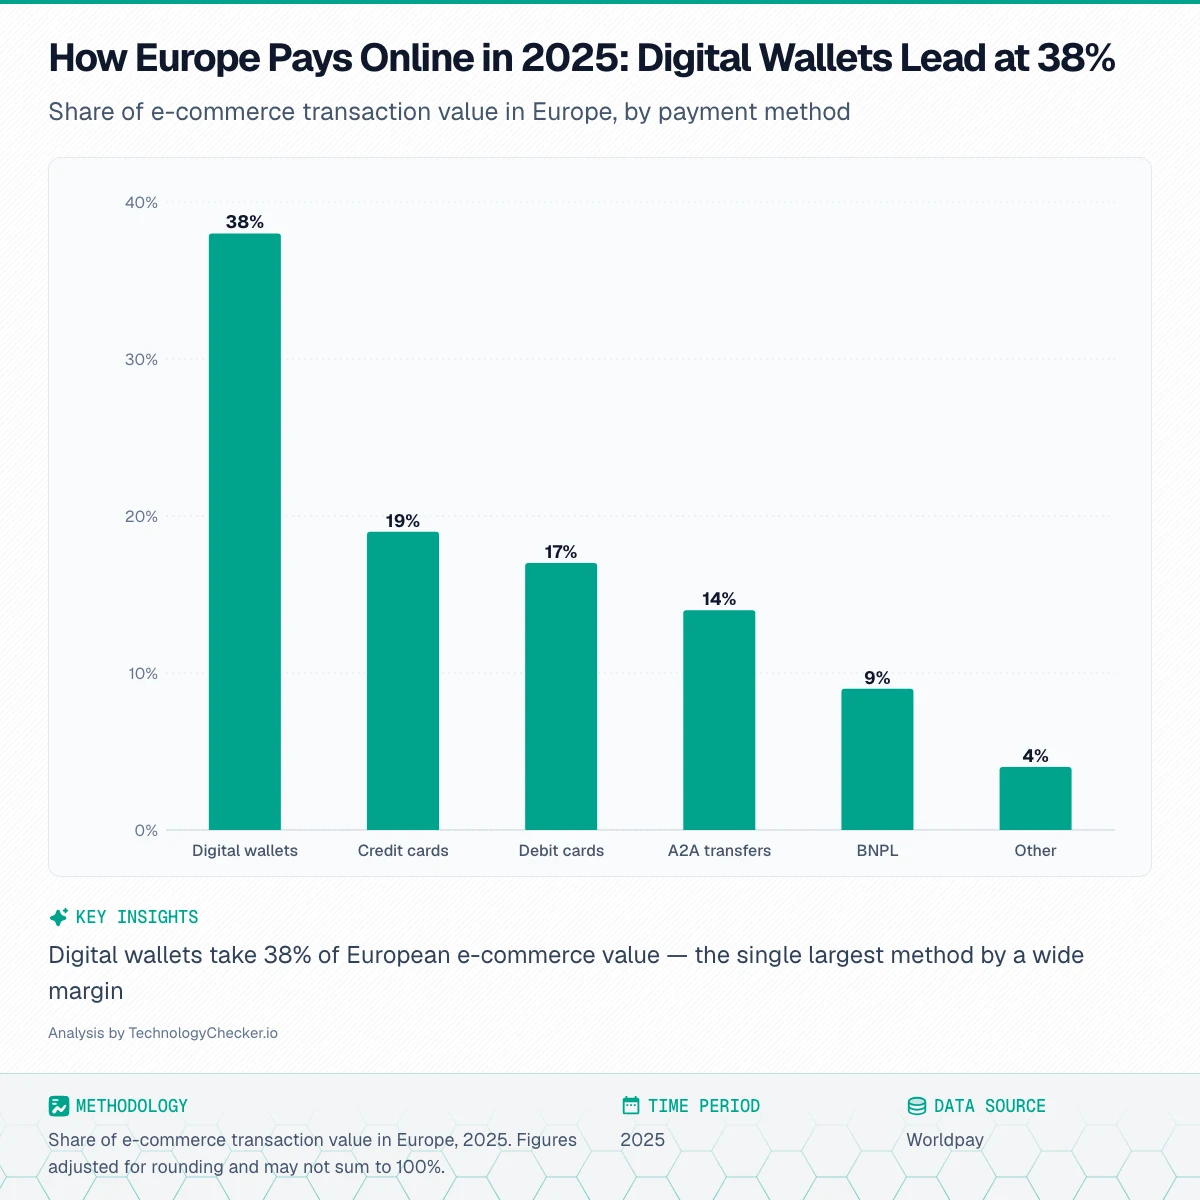
Across Europe in 2025, digital wallets led with 38% of e-commerce transaction value, more than a third of all spend, ahead of credit cards (19%), debit cards (17%) and account-to-account (A2A) payments (14%). Buy-now-pay-later accounted for 9%. The single biggest takeaway for merchants: wallet support (Apple Pay, Google Pay, PayPal and local equivalents) is now table stakes, not an add-on. Explore the tools behind this in our payment processing category. (Source: Worldpay.)
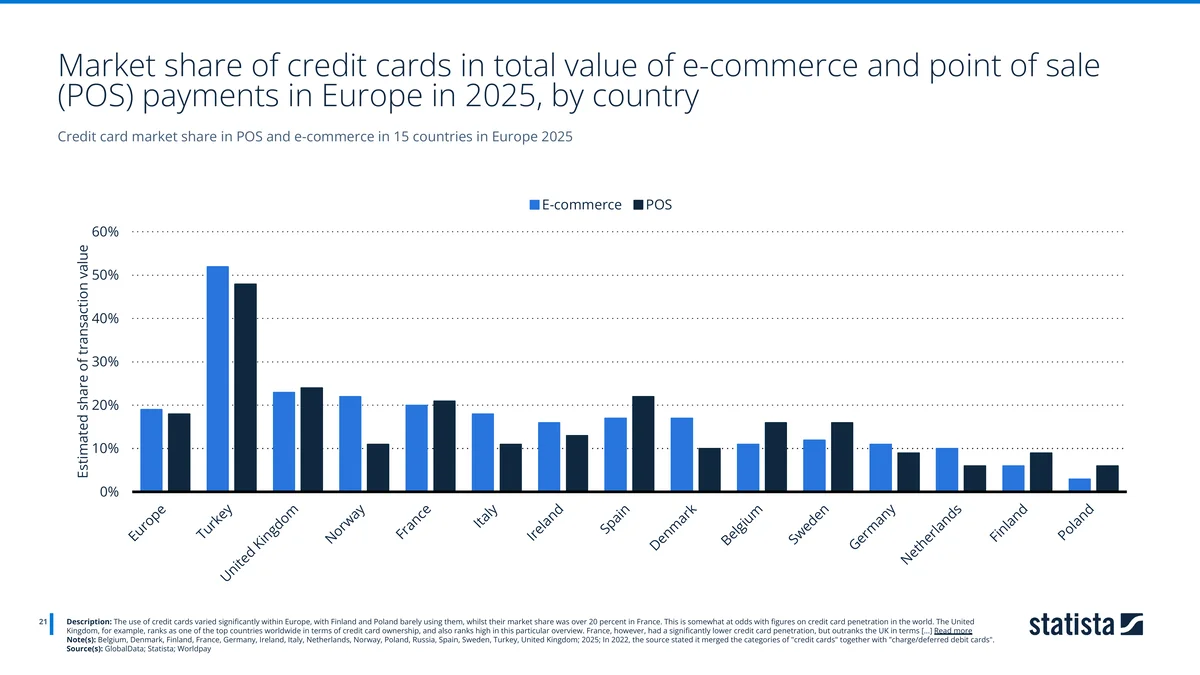
Credit-card reliance swings wildly by country. In online payments, Turkey tops the list at 52%, with the UK (23%) and France (20%) high, while Germany (11%) and especially Poland (3%) barely use them. This is the clearest evidence in the whole dataset that "Europe" is not one checkout, a German shopper expects very different options from a French or Turkish one.
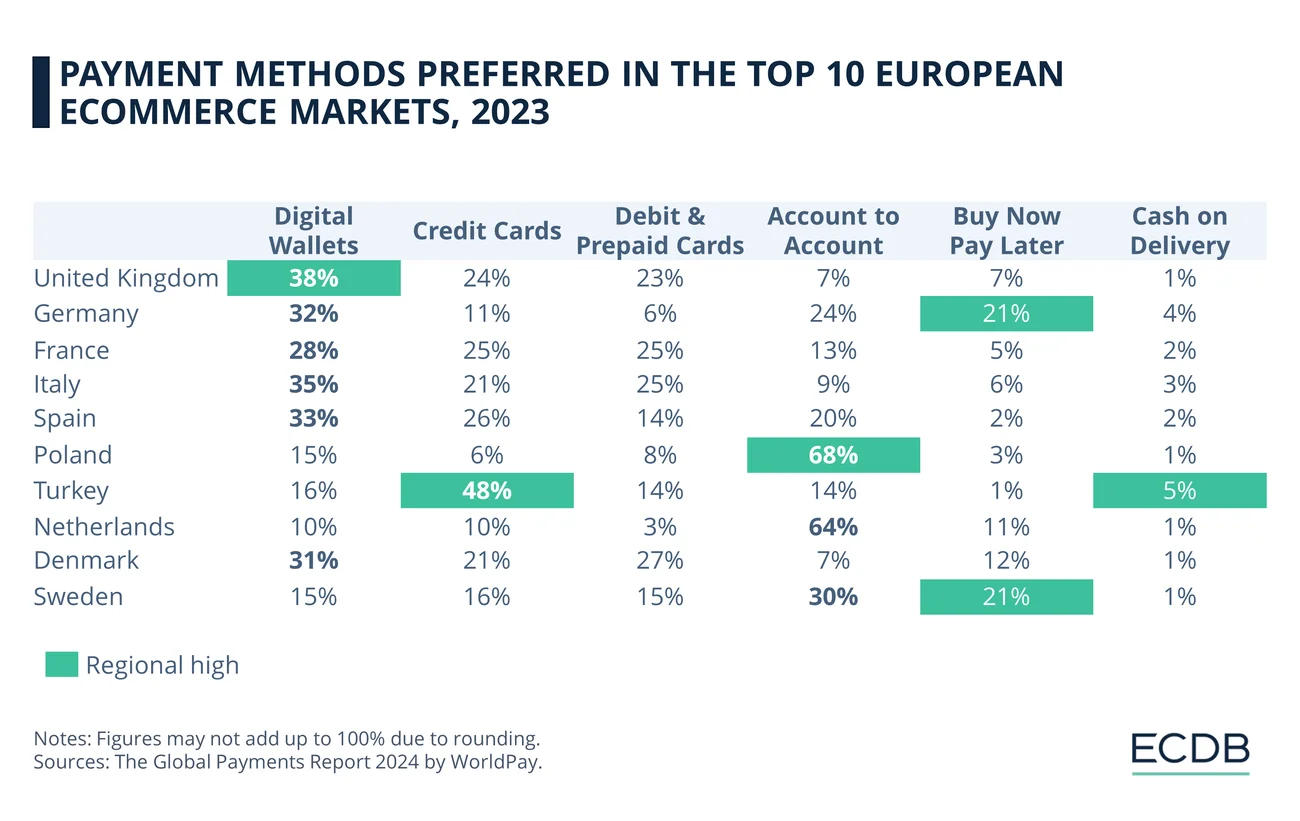
A country-by-country view makes the fragmentation concrete: account-to-account dominates Poland (68%) and the Netherlands (64%); credit cards rule Turkey (48%); buy-now-pay-later is unusually strong in Germany (21%) and Sweden (21%); and digital wallets lead the UK (38%), Italy (35%) and Spain (33%). No single checkout configuration serves all of them. (Source: ECDB, from Worldpay's Global Payments Report 2024.)
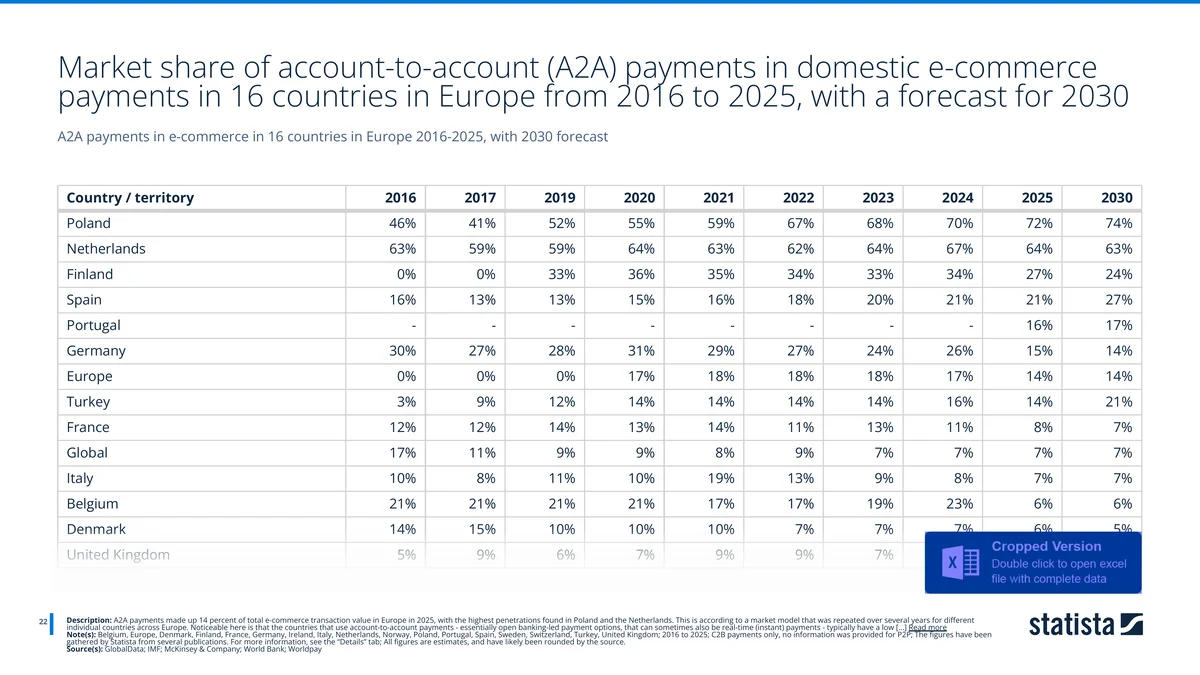
Account-to-account payments, open-banking-style bank transfers, made up 14% of European e-commerce value in 2025, but the country spread is extreme. Poland reaches 72% (forecast 74% by 2030) and the Netherlands 64%, while France (8%) and Italy (7%) barely use them. Where A2A is strong, it's because of a dominant local scheme (BLIK in Poland, iDEAL in the Netherlands). The pattern reinforces the payments lesson: localise, or lose the sale.
📦 Delivery: what European shoppers expect
Logistics is the other half of the post-checkout experience, and expectations have tightened.
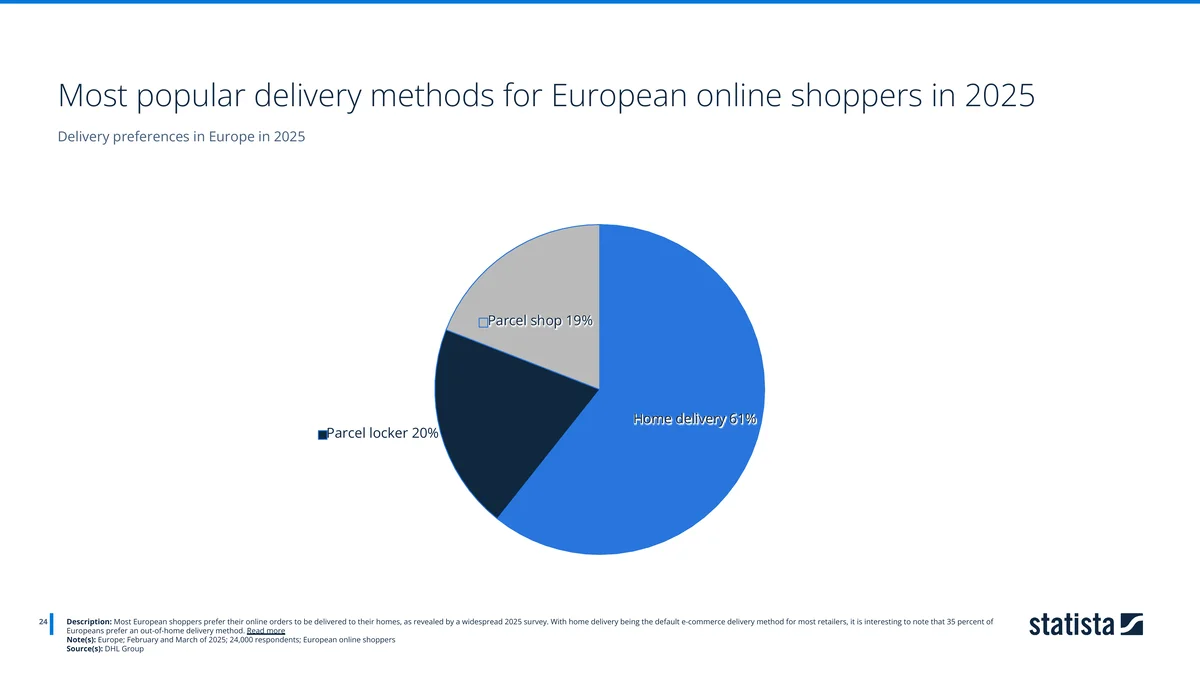
Home delivery remains the favourite at 61% of European shoppers, but 35% now prefer an out-of-home option, parcel lockers (20%) or parcel shops (19%). That's a meaningful minority, and it's why carriers across Europe are racing to build locker networks. (Source: DHL Group, 24,000 respondents.)
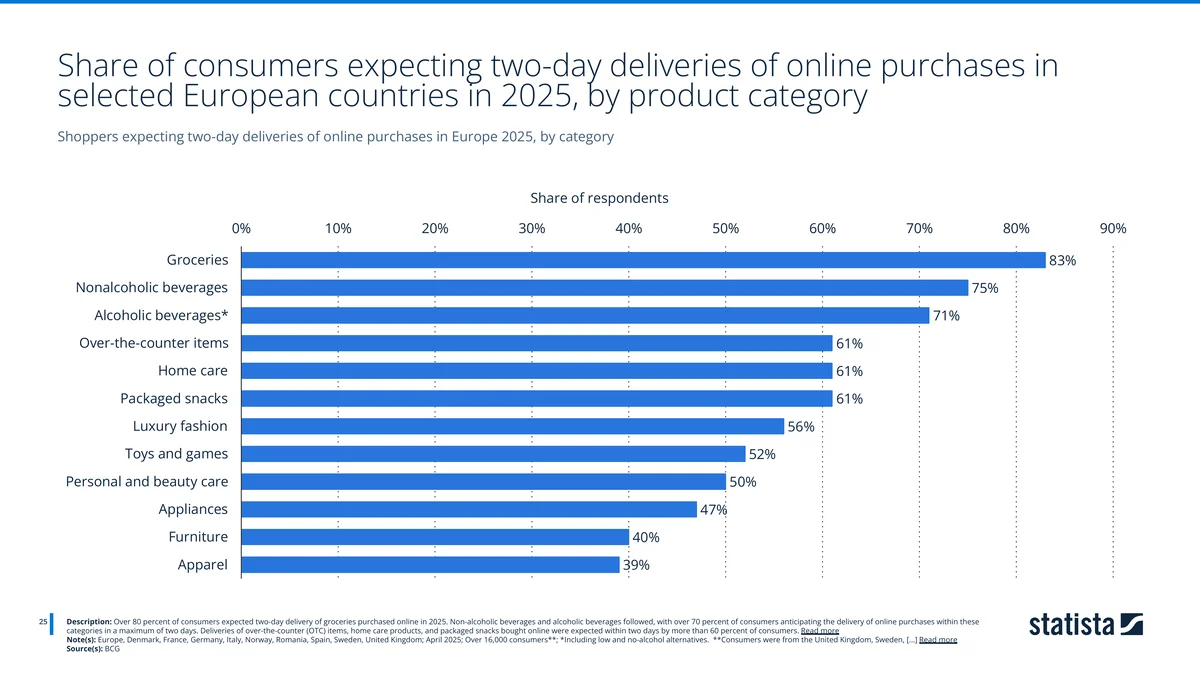
Speed expectations are now steep, especially for consumables. In 2025, 83% of consumers expected two-day delivery of groceries, followed by non-alcoholic (75%) and alcoholic beverages (71%). Even for apparel, the most patient category, 39% still expected delivery within two days. Slow shipping isn't just an inconvenience anymore; as the next chart shows, it's a deal-breaker.
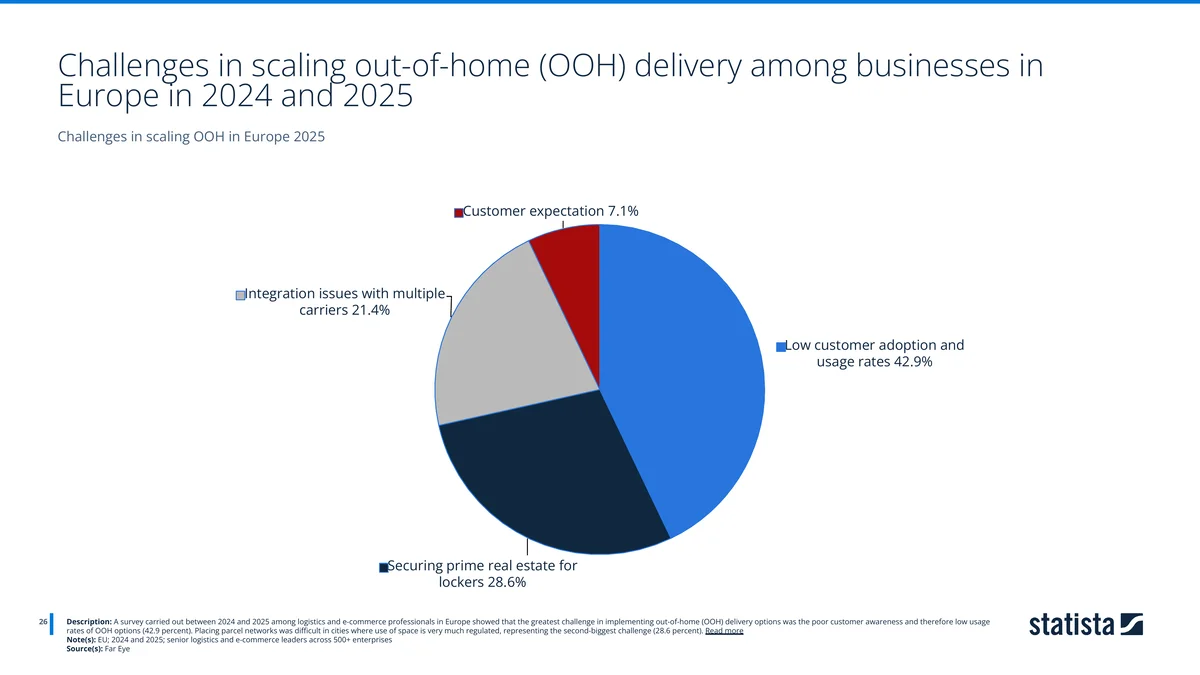
For the businesses building those locker networks, the biggest hurdle isn't technology, it's behaviour. Among 500+ logistics and e-commerce leaders, 42.9% cited low customer adoption as the top challenge in scaling out-of-home delivery, ahead of securing real estate for lockers (28.6%) and carrier integration issues (21.4%). Shoppers say they want out-of-home options, but habit still pulls them toward the doorstep.
🛍️ Consumer behaviour and shopping tech
The final chapter gets inside the shopper's head: what they buy, why they bail, and which technologies they actually use.
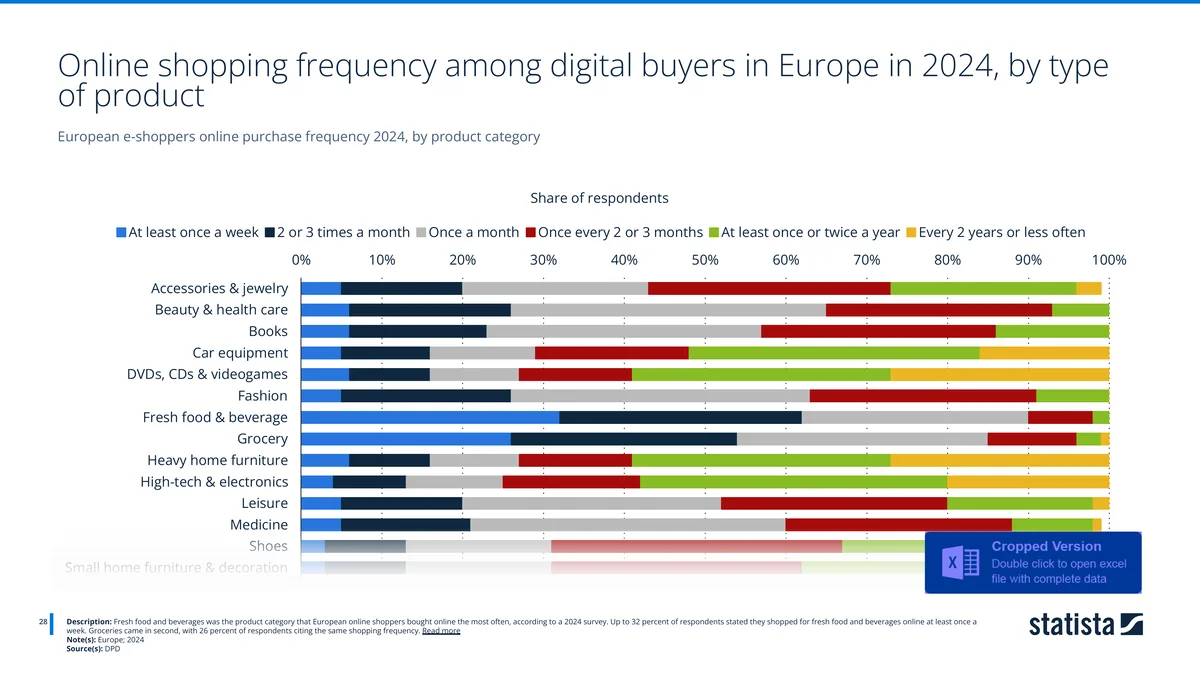
Frequency is dominated by consumables. Fresh food and beverages was bought online at least weekly by 32% of shoppers, with groceries second at 26%. High-consideration categories like furniture and electronics sit at the opposite end, bought rarely, researched heavily. The takeaway for retailers: grocery and FMCG brands are competing for a weekly habit, while big-ticket sellers compete for an occasional, high-stakes decision.
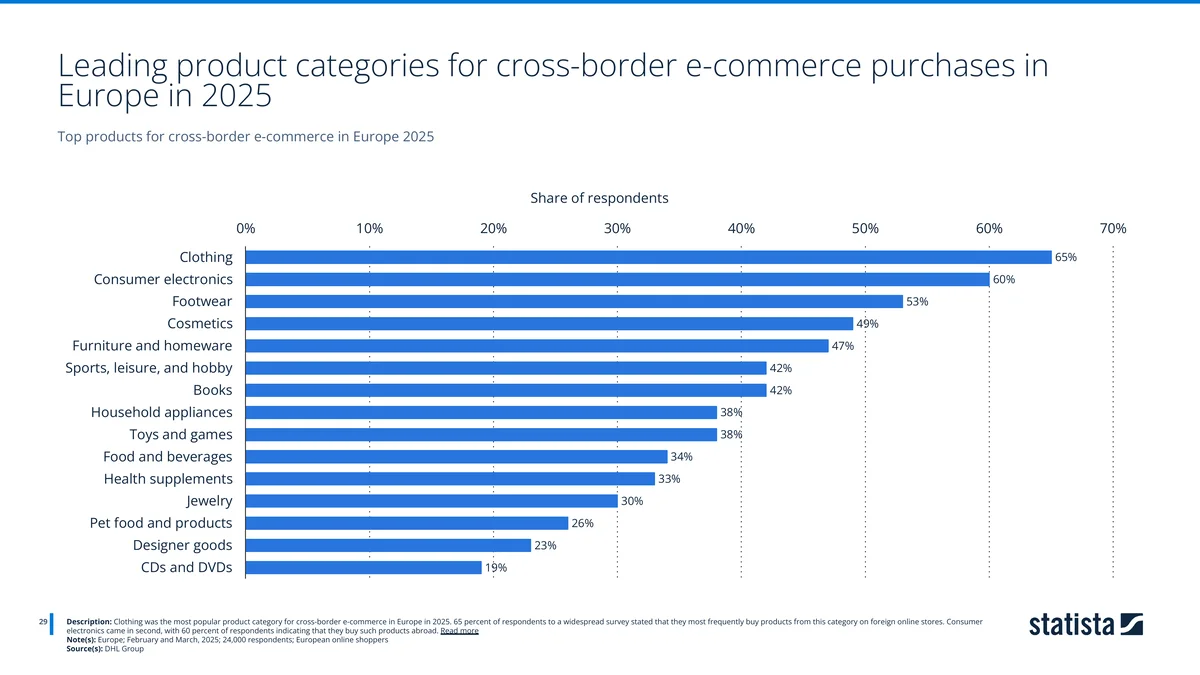
When Europeans do shop abroad, clothing leads at 65%, followed by consumer electronics (60%) and footwear (53%). Fashion and electronics travel across borders precisely because shoppers chase selection and price, categories where a foreign store can offer something local ones can't.
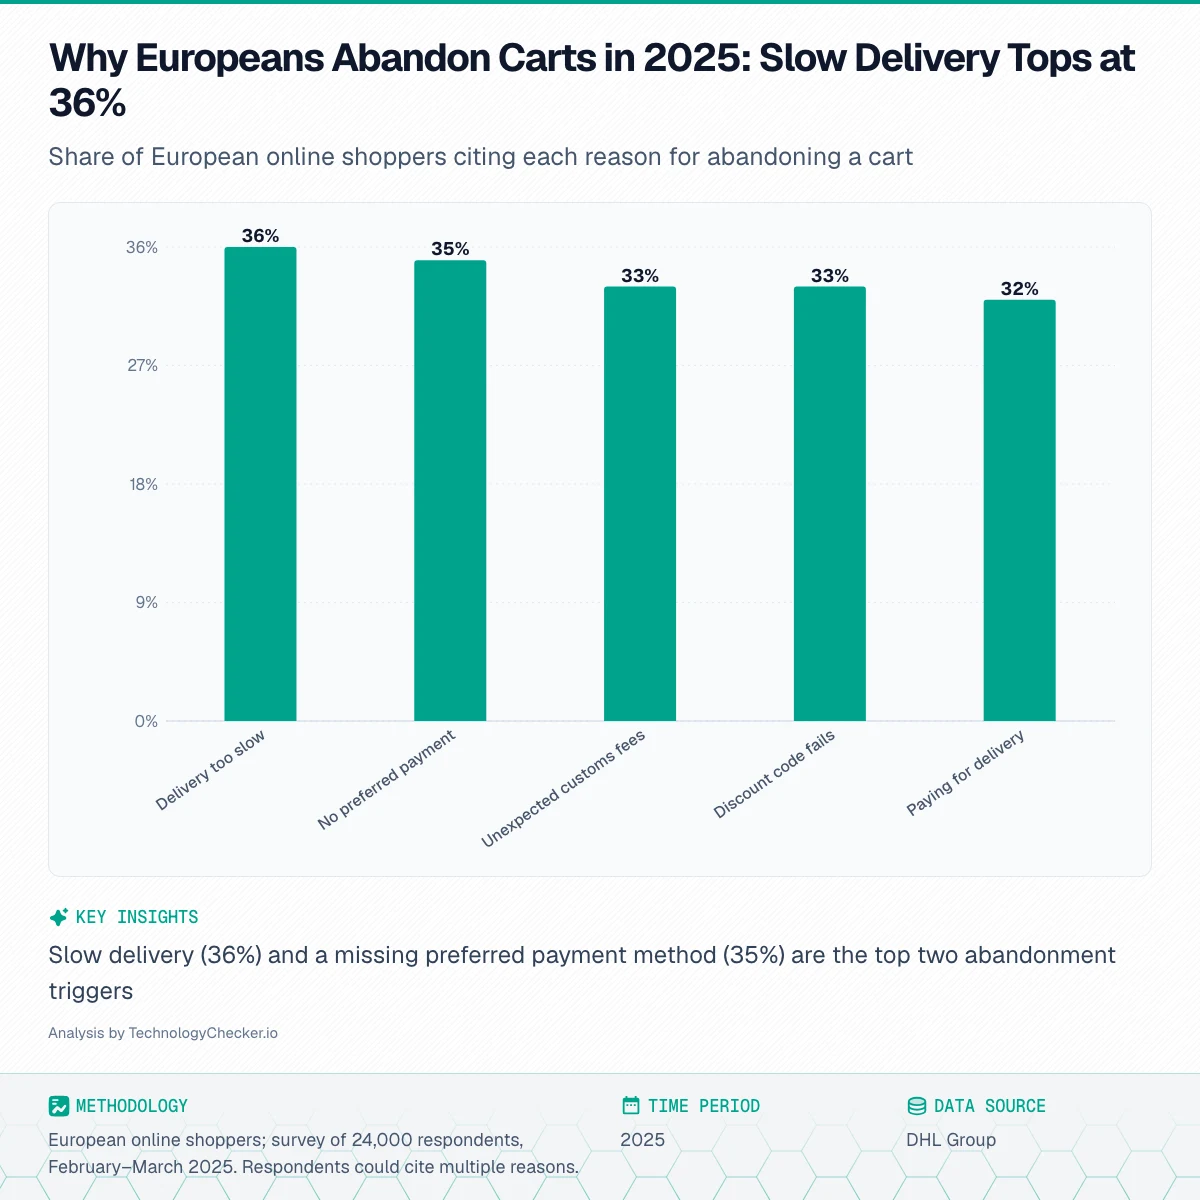
This is the chart every merchant should pin to the wall. The top reasons Europeans abandon carts in 2025 are slow delivery (36%), absence of a preferred payment method (35%), unexpected customs charges (33%), a broken discount code (33%) and paying for delivery (32%). Notice the pattern: the two biggest killers are delivery speed and payment choice, the exact two areas the delivery and payment chapters above measured. Fix those two, and you address roughly 70% of stated abandonment reasons.
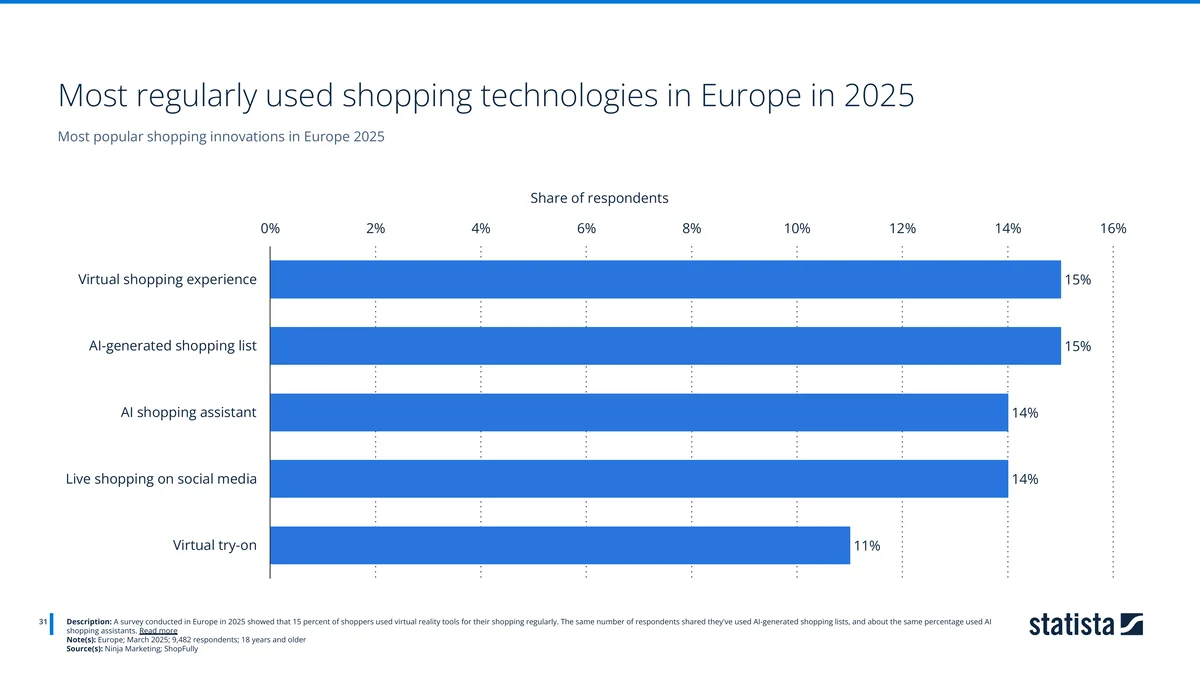
On the innovation front, adoption is still early. In 2025, the most regularly used shopping technologies were virtual shopping experiences (15%) and AI-generated shopping lists (15%), with AI shopping assistants (14%) and live social shopping (14%) close behind. AI is in the mix, but it's a feature a minority use regularly, not yet a default.
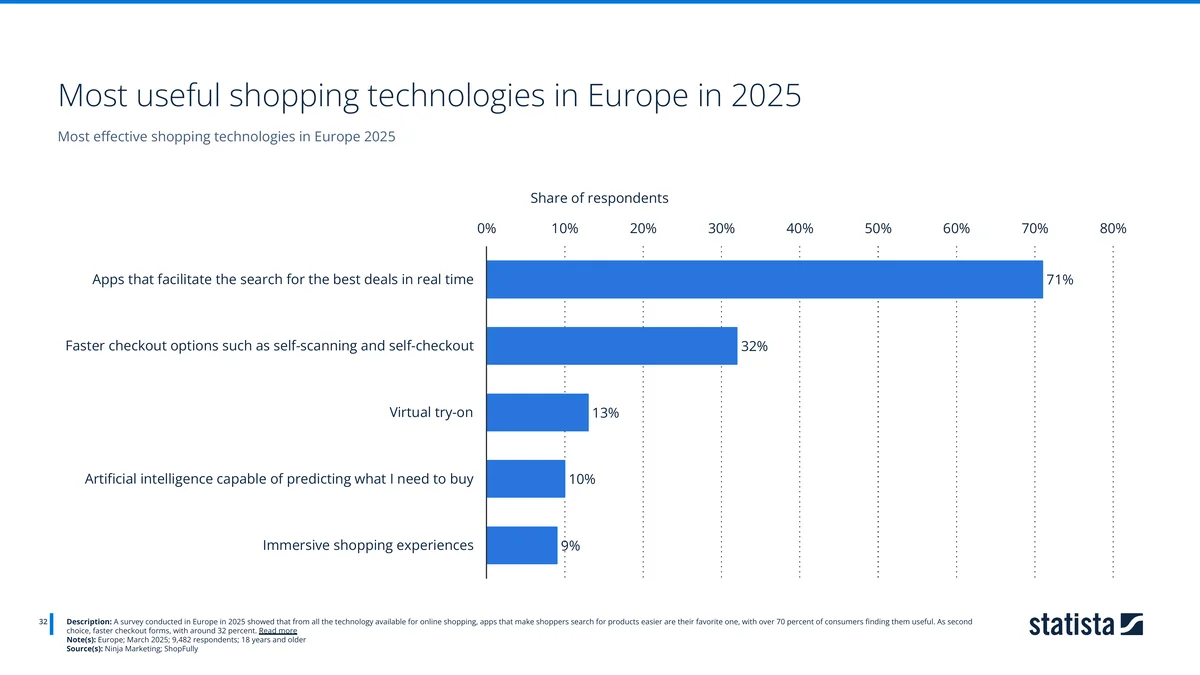
What shoppers find useful is more grounded than what's flashy. 71% rate apps that find the best deals in real time as the most useful technology, far ahead of faster checkout (32%) and AI that predicts purchases (10%). The message is clear: European shoppers value tools that save money and time over novelty. Practicality wins.
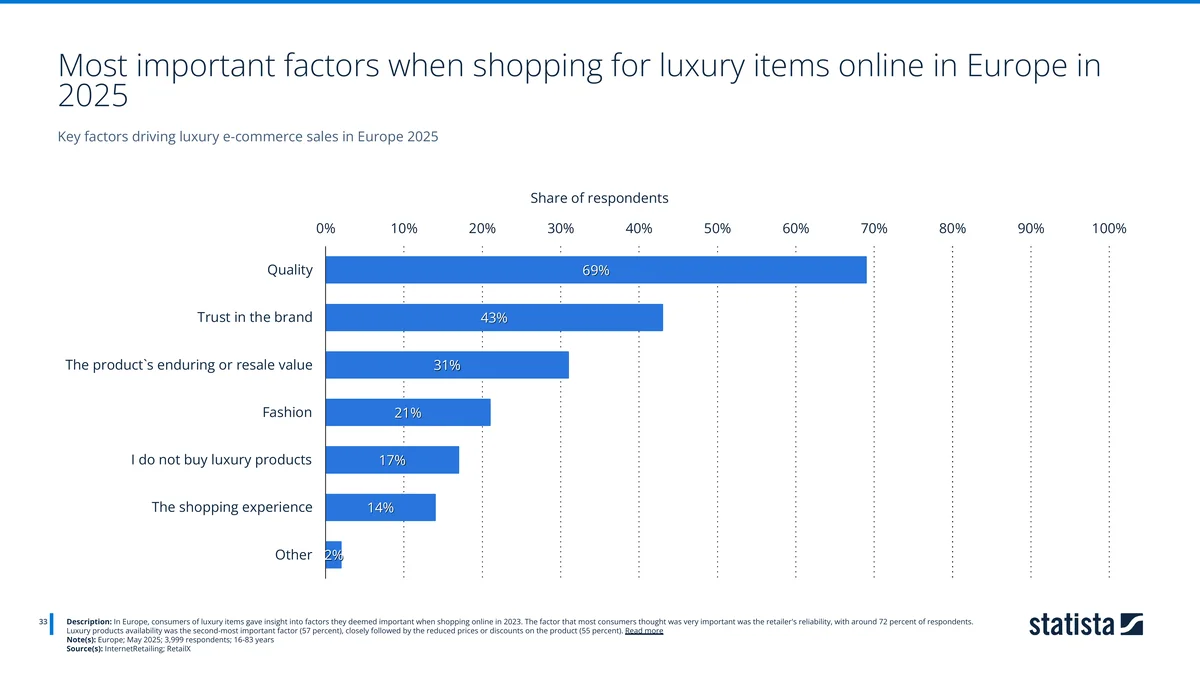
Even at the top of the market, fundamentals rule. For online luxury purchases in 2025, quality (69%) and trust in the brand (43%) were the most important factors, ahead of resale value (31%) and fashion (21%). Luxury e-commerce, it turns out, is sold on confidence and craftsmanship, not gimmicks.
🤖 Who crawls e-commerce (and which AI bots get blocked)
The flip side of AI in shopping is AI crawling the shops. E-commerce isn't just using AI assistants, it's being consumed by them at a higher rate than any other corner of the web. Cloudflare Radar's Q2 2026 data shows shopping and general merchandise sites absorb 32.3% of all AI bot traffic, nearly double the next category (internet and telecom, 17.1%). And almost none of that crawling sends a visitor back: across all AI bot traffic, 44.9% is for model training and 43.0% mixed-purpose, with just 9.1% tied to search. That global training-versus-search split, and how it has shifted year on year, is the subject of our AI crawler statistics and bot traffic statistics reports; here the point is narrower. Product catalogues are being read at scale to train models, with little referral traffic in return.
Source: Cloudflare Radar — ai/bots/summary/vertical and ai/bots/summary/crawl_purpose, Q2 2026. Pulled 2026-07-03.
⚠️ Cloudflare has since relabelled crawl purpose across its whole history, moving volume from Search into Training. Re-pulled on 1 October 2026, Q2 2026 reads 49.9% training, 43.0% mixed and 4.1% search; the shopping share (32.3%) is unchanged. Preserved as originally published.
Shopping Is the Most AI-Crawled Website Category in 2026
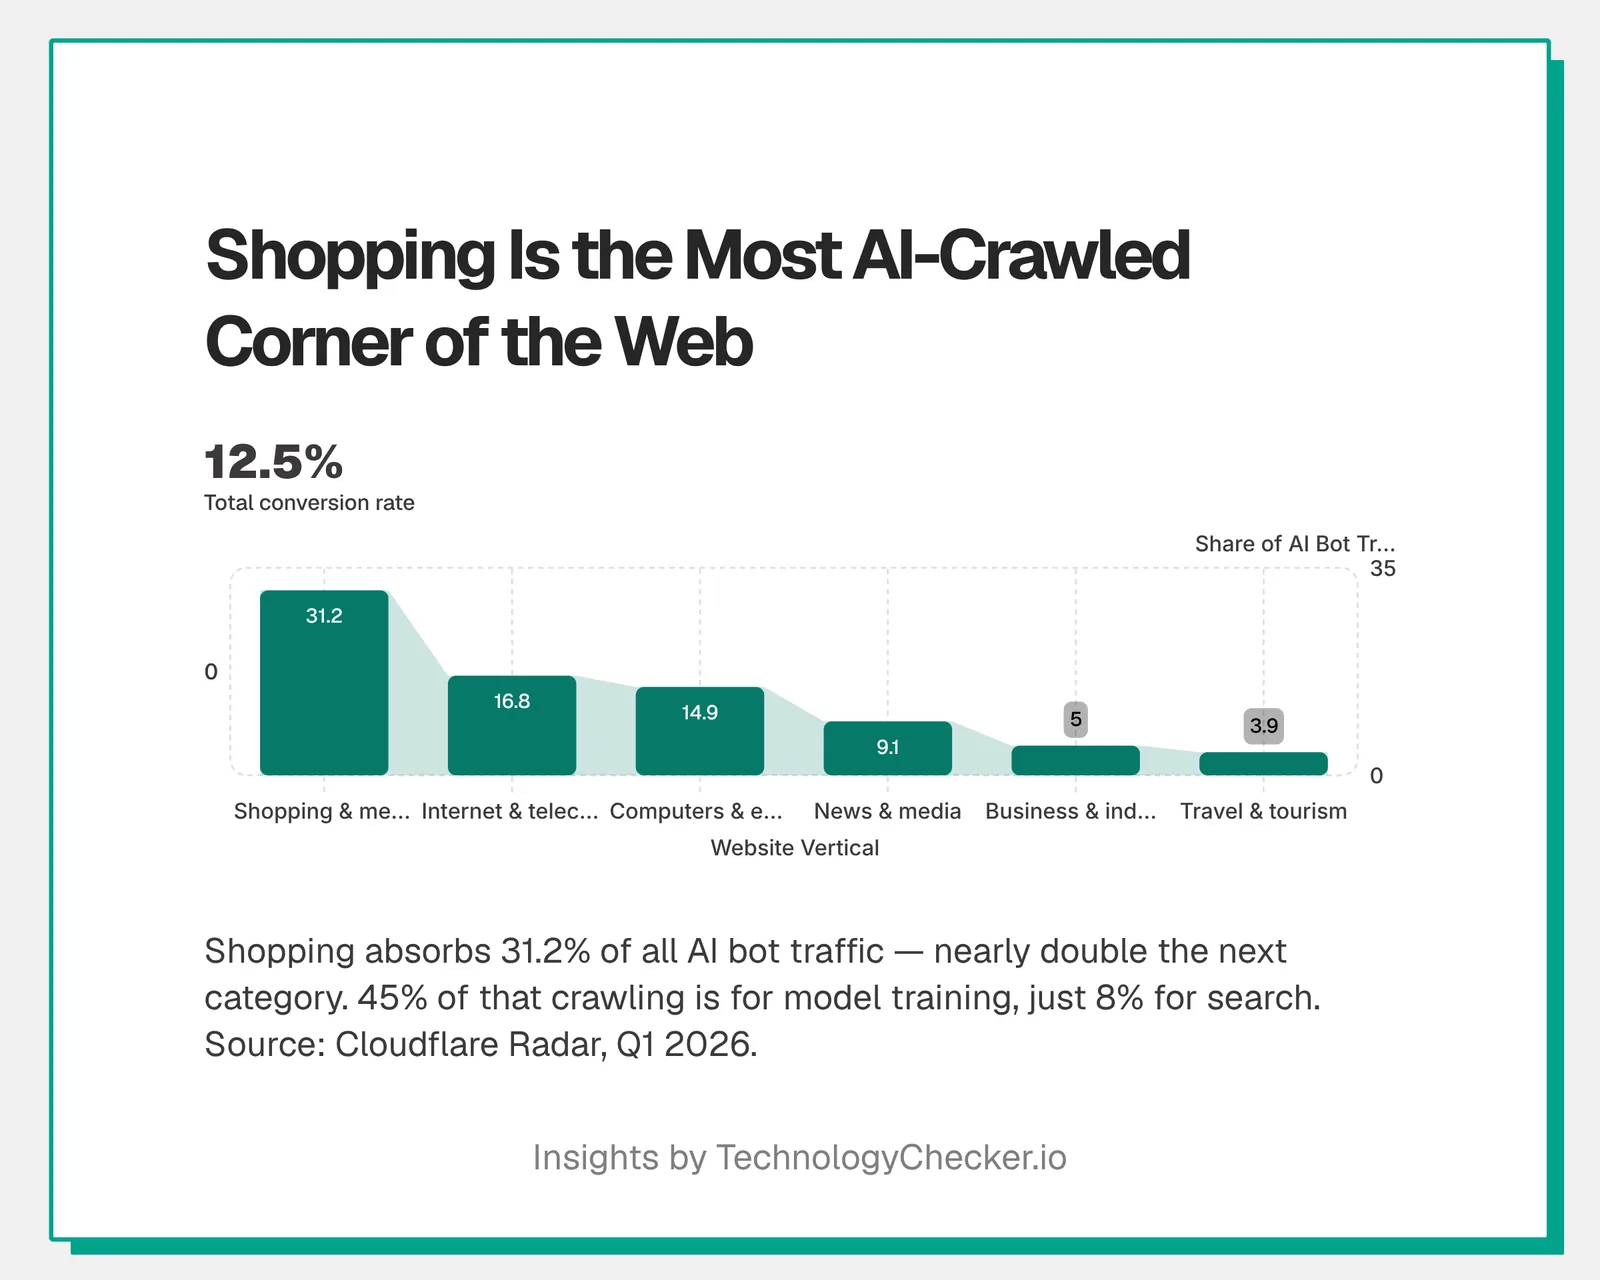
Shopping and general merchandise is the single most AI-crawled corner of the web. In Q1 2026, sites in that vertical absorbed 31.2% of all AI bot traffic measured by Cloudflare Radar — nearly double the next category, internet and telecom (16.8%). The intensity of crawling against product catalogues is a big part of why e-commerce sites are among the most likely to block AI bots in robots.txt.
Source: Cloudflare Radar · Q1 2026 (Jan–Mar)
| Website vertical | Share of AI bot traffic |
|---|---|
| Shopping & merchandise | 31.2% |
| Internet & telecom | 16.8% |
| Computers & electronics | 14.9% |
| News & media | 9.1% |
| Business & industry | 5% |
| Travel & tourism | 3.9% |
| Professional services | 3.4% |
| Gambling | 3% |
| Finance | 2.9% |
- Shopping and general merchandise is the most AI-crawled vertical at 31.2% of AI bot traffic
- That's nearly double the next category, internet and telecom (16.8%)
- Heavy crawling of product catalogues helps explain why e-commerce sites block AI bots
That imbalance, heavy crawling, little traffic back, shows up live across every AI platform, not just in shopping:
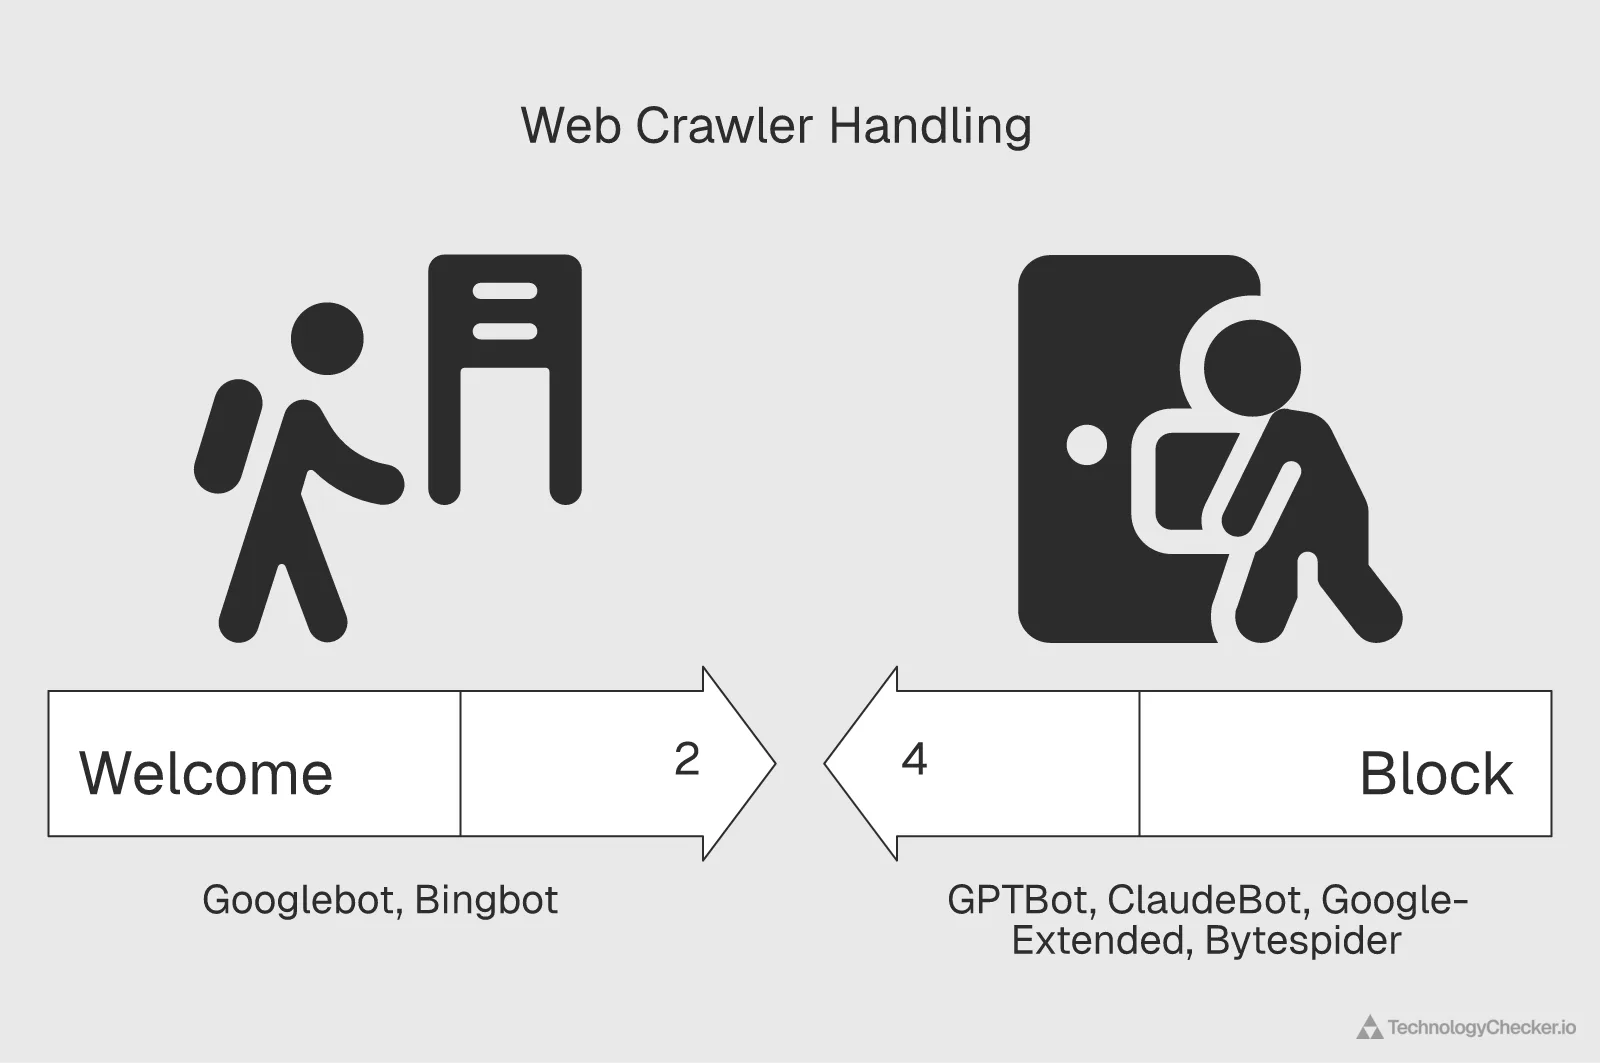
So how do e-commerce sites respond? Increasingly, by closing the door in robots.txt. In Cloudflare Radar's latest snapshot (as of 29 June 2026), e-commerce was the third most AI-restricting category of the web, behind only technology and business. The pattern of what they block is the revealing part: stores fully disallow the AI-training and scraping crawlers, Bytespider (35 domains), ClaudeBot (33), GPTBot (31), CCBot (31), Google-Extended (29) and PerplexityBot (28), while only 2 fully block Googlebot. For the all-web version of this ranking, see our robots.txt AI crawler blocking report.
Source: Cloudflare Radar — robots_txt/top/user_agents/directive (domainCategory=Ecommerce, DISALLOW, fully-blocked domain counts), latest single-day snapshot as of 2026-06-29. This is a rolling snapshot, not a quarter or a year-on-year window. Pulled 2026-07-03.
Which AI Crawlers E-Commerce Sites Block Most in 2026
E-commerce sites that restrict AI crawlers wall off the training and scraping bots while keeping search open. Among the e-commerce robots.txt files Cloudflare Radar parsed (25 May 2026), the most fully-blocked AI crawlers are PetalBot (34 domains), Bytespider (33), ClaudeBot (31), GPTBot (30) and CCBot (28) — but only 4 fully block Googlebot, which most stores still want for search. Google's AI-specific crawler, Google-Extended, is fully blocked by 27.
Source: Cloudflare Radar · May 2026
| AI crawler | E-commerce domains fully blocking |
|---|---|
| PetalBot | 34 |
| Bytespider | 33 |
| ClaudeBot | 31 |
| GPTBot | 30 |
| CCBot | 28 |
| Google-Extended | 27 |
| PerplexityBot | 26 |
| ChatGPT-User | 23 |
| OAI-SearchBot | 22 |
| Googlebot | 4 |
- E-commerce sites fully block AI-training crawlers — 30 block GPTBot, 31 ClaudeBot, 33 Bytespider — but only 4 fully block Googlebot
- Google-Extended (Google's AI crawler) is fully blocked by 27, even though Googlebot search stays open — sites want search, not AI training
- Blocks are spread across many crawlers; no single AI bot is singled out
That split is deliberate. Google-Extended, the crawler Google uses to train Gemini, is fully blocked by 29 sites, yet plain Googlebot, which powers Search, is fully blocked by just 2. Merchants want to be found in Google; they don't want their product data feeding someone's model for free. It's the clearest signal in the data of how the industry now distinguishes between search crawling (welcome, it sends buyers) and AI-training crawling (increasingly walled off).
Our snapshot above is e-commerce-specific; the live, all-web picture tells the same story. Cloudflare's rolling survey of the top 10,000 domains tracks which AI user agents appear most often in DISALLOW rules, updated daily:
What about by country? Here Cloudflare Radar has a limit worth stating plainly: its robots.txt blocking data isn't segmented by location, so there's no clean "AI bots blocked by German vs. French vs. Italian e-commerce sites." What it does break down by country is AI crawler traffic, which bots are most active in each market, and the differences are sharp.
| AI crawler (Cloudflare AI-bots view) | 🇩🇪 Germany | 🇫🇷 France | 🇮🇹 Italy |
|---|---|---|---|
| Googlebot | 42.7% | 42.7% | 27.9% |
| ChatGPT-User | 7.6% | n/a | 51.4% |
| ClaudeBot | 6.1% | 6.1% | 4.4% |
| Meta-ExternalAgent | 13.7% | 13.5% | 1.7% |
| Bingbot | 6.5% | 6.2% | 1.1% |
| GPTBot | 5.3% | 6.9% | 2.2% |
Source: Cloudflare Radar — ai/bots/summary/user_agent (location=DE/FR/IT), Q2 2026. Pulled 2026-07-03. "n/a" = below the country's top-ranked crawlers. Shares reflect AI-related crawler traffic, not blocking.
Germany and France are still led by Google's crawlers (42.7% each), with Meta's agent now the clear runner-up in both (around 13.5%) and the training bots, ClaudeBot and GPTBot, filling out the mix. Italy is the outlier: over half (51.4%) of its AI crawler traffic is ChatGPT-User, the agent OpenAI sends in real time when someone asks ChatGPT about a page. Italian shoppers appear to be asking AI assistants about products far more than their northern neighbours, and that kind of user-initiated fetch is much harder to block than a training crawler without also turning away a real, interested visitor. ⚠️ Superseded by the Q3 2026 analysis above: the ChatGPT-User share fell to 19.6% in Q3 2026 and was 91.6% a year earlier, so it reads as a share of a shifting AI-bot mix, not a measure of Italian shoppers. Preserved as originally published.
✅ What this means for you (if you sell into Europe)
So what do you actually do with all this? Five things, if you're selling into Germany, France or Italy:
- Treat the big three as one market at your peril. They share scale and not much else. Payment habits, device mix, the platforms underneath, all different. Win them one at a time.
- Go mobile-first, and keep it light. Phones already drive half of EU e-commerce sales, and the share keeps climbing. In Italy especially, where people shop on mobile over slower connections, every extra megabyte costs you conversions.
- Localise the checkout. Wallets are the European default (38%), but cards, account-to-account and BNPL swing wildly by country. A missing local method, on its own, kills 35% of carts.
- Compete on delivery, not just price. Slow shipping is the No. 1 reason Europeans bail. Fast, free, and out-of-home options aren't perks anymore. They're the baseline.
- Don't assume Shopify. The installed base is local: WooCommerce in Italy, PrestaShop in France, Ecwid in Germany, Shopify outside the top three in all three. Selling apps, themes or services? Target what merchants actually run, not the global leader.
One more, since AI is busy eating the web: decide your crawler policy on purpose. E-commerce is the most AI-crawled vertical out there, and most of that crawling trains models instead of sending you buyers. Keep Googlebot, block GPTBot and friends if you want. Just don't leave it to chance.
Want to see what's running in a specific market? Our ecommerce platforms category ranks Shopify, WooCommerce, Magento, BigCommerce and PrestaShop by live adoption. And for more regional digging, there's the e-commerce marketplace market share and e-commerce statistics in Turkey.
Frequently asked questions
Which country uses e-commerce the most in Europe?
By size, Germany: $95.43 billion in e-commerce revenue and 44.66 million online shoppers in 2024, ahead of France and Italy (Statista Market Insights). By the share of people who shop online, the smaller northern markets lead, with Denmark at 87.3% in 2025.
What are the big 5 countries for ecommerce in Europe?
Within the EU-27, Statista's 2024 revenue series ranks Germany ($95.43 billion), France ($66.46 billion) and Italy ($62.46 billion) first to third, with Spain and Poland forming the next tier. Outside the EU, the UK is Europe's other large online market, which the EU figures in this post don't cover.
Is ecommerce increasing or decreasing in Europe?
Increasing. EU online retail revenue rose from $389 billion in 2024 to $436 billion in 2025 and is forecast at about $456 billion in 2026 and $546 billion by 2030, while the share of people buying online climbs toward 73.5% (Statista Market Insights).
Is Italy still mobile-first in 2026?
Yes, on human traffic. In Q3 2026, 55.4% of human web requests in Italy came from mobile devices, against 50.4% in France and 46.6% in Germany (Cloudflare Radar). Counting bots too, Italy dipped to 48.2%, because automated traffic, mostly classified as desktop, grew as a share of the total.
📋 Methodology and data sources
This post combines three data sources.
1. TechnologyChecker detection data (our own, May 2026 crawl). The platform figures come from our technology detection, which fingerprints what each site runs from its public signals. Two counts appear: the global "businesses we detect" per platform (the full detection set, e.g., 2,446,083 for Shopify) and category share within the e-commerce platforms category; and the per-country figures, which are an enriched sample of businesses we've matched to a country (not full market totals). The per-country numbers count businesses running each platform, classified by the business's own country, not the platforms' shoppers. We present the country data as rankings because the ordering is the reliable signal at sample scale.
2. Published European e-commerce market data. The market-size, adoption, payment, delivery and consumer-behaviour figures are credited to the original research organisations behind them, Eurostat, Worldpay, GlobalData, DHL Group, BCG, DPD, ECDB GmbH, Far Eye, McKinsey & Company, the World Bank, the IMF, InternetRetailing, RetailX, Ninja Marketing and ShopFully, with the EU market-size, penetration and user forecasts modeled by Statista Market Insights. Revenue is in U.S. dollars; survey scopes and dates are on each chart's source line. Headline figures cover the EU-27; some country and survey charts include wider Europe.
3. Cloudflare Radar API, for the live device-mix and connectivity figures, refreshed to Q2 2026 (1 April – 30 June 2026) and, in the sections marked Q3 2026, to Q3 2026 (1 July to 30 September 2026), with human-only (botClass=LIKELY_HUMAN) device shares alongside all-request shares:
- Device and OS split via the
get_http_dataendpoint (summary/device_type and summary/os), share of all HTTP requests, a proxy for general browsing behaviour rather than e-commerce conversions specifically. - Median download bandwidth via the
get_internet_quality_dataendpoint (BANDWIDTH summary), Internet Quality Index download-speed percentiles. - AI crawler traffic via the
get_ai_dataendpoint, AI bot traffic by destination vertical and by country, plus crawl purpose (training/search), Q2 2026. - AI crawler blocking via the
get_robots_txt_dataendpoint, the AI user agents most disallowed byEcommerce-category sites (Cloudflare's robots.txt sample, latest single-day snapshot as of 29 June 2026, not a windowed metric). This dataset is not segmented by location, so AI-bot blocking cannot be broken down by country; the country figures above are crawler traffic, not blocking.
Data sources: TechnologyChecker detection data (technologychecker.io, May 2026); published European market data (Eurostat, Worldpay, DHL Group, BCG and others, with EU forecasts modeled by Statista Market Insights); and Cloudflare Radar (radar.cloudflare.com), get_http_data, get_internet_quality_data, get_ai_data and get_robots_txt_data endpoints, Q2 2026 and June 2026.
Update history
Added a Q3 2026 analysis (against Q2 2026 and Q3 2025), a 2026 month-by-month table of human mobile share, an answer to which country uses e-commerce the most, and a FAQ. Corrected two July reads: Cloudflare revised the all-requests device series and relabelled AI crawl purpose (both annotated in place), and Italy's ChatGPT-User share turned out to be a moving share, not a measure of shoppers. Added the September 2026 Shopify and WooCommerce counts.
Refreshed the Cloudflare Radar device, speed and AI-crawler figures to Q2 2026 (April to June), with Q2 2025 comparisons. The Q2 paragraphs remain in place in the body, annotated where newer data supersedes them.

Data Analyst
5+ years of experience
Emma is a Data Analyst at TechnologyChecker, where she analyses technology adoption data to build better prospect lists and uncover actionable patterns for sales teams.
- BSc Data Science, Cardiff University
- Google Data Analytics Professional Certificate
- Tableau Desktop Certified Associate
Never miss our research