Influencer Marketing Statistics Q3 2026: 40+ Key Data Points
How big is influencer marketing? $32.55B in 2025 (Influencer Marketing Hub), up to $40.5B forecast for 2026. 40+ sourced stats, Q3 2026 edition.
Published •Updated •Data through September 2026•31 min read
The global influencer marketing market reached an estimated $32.55 billion in 2025, more than triple its 2020 size, and is served by nearly 6,939 specialist companies worldwide. Heading into 2026, marketers name AI creator matching their single biggest priority (26.89%), TikTok's brand value has climbed to $153.54 billion, and more than half of B2B teams already run influencer programs. The numbers below show an industry that has shifted from a social-media experiment into core marketing infrastructure.
Key findings:
- $32.55 billion estimated global influencer marketing market size in 2025, up from $9.7B in 2020 (Influencer Marketing Hub)
- 6,939 influencer marketing companies worldwide in 2025, a 36x rise since 2015 (Influencer Marketing Hub)
- AI creator matching is the top 2026 focus area for 26.89% of marketers (Influencer Marketing Hub)
- 54% of consumers in the Philippines bought a product because of an influencer or celebrity ad, the highest of 32 countries (Statista Consumer Insights)
- 67.3% of marketers select TikTok influencers mainly by follower count (Influencer Marketing Hub)
- MrBeast was the highest-earning creator in 2025 at an estimated $85 million (Forbes)
- $153.54 billion TikTok/Douyin brand value in 2026, an 8x increase since 2021 (Brand Finance)
- 55% of B2B marketers already use influencer marketing, with another 29% planning to adopt it (Ipsos)
- 402,515 websites run TikTok's conversion-tracking pixel in TechnologyChecker's September 2026 crawl, the second-largest creator-commerce footprint on the open web after Meta's Facebook Pixel (3,602,180)
- 87.49% of brands expect their influencer budget to rise in 2026 and only 5.55% expect a cut (Influencer Marketing Hub, Benchmark Report 2026, May 2026)
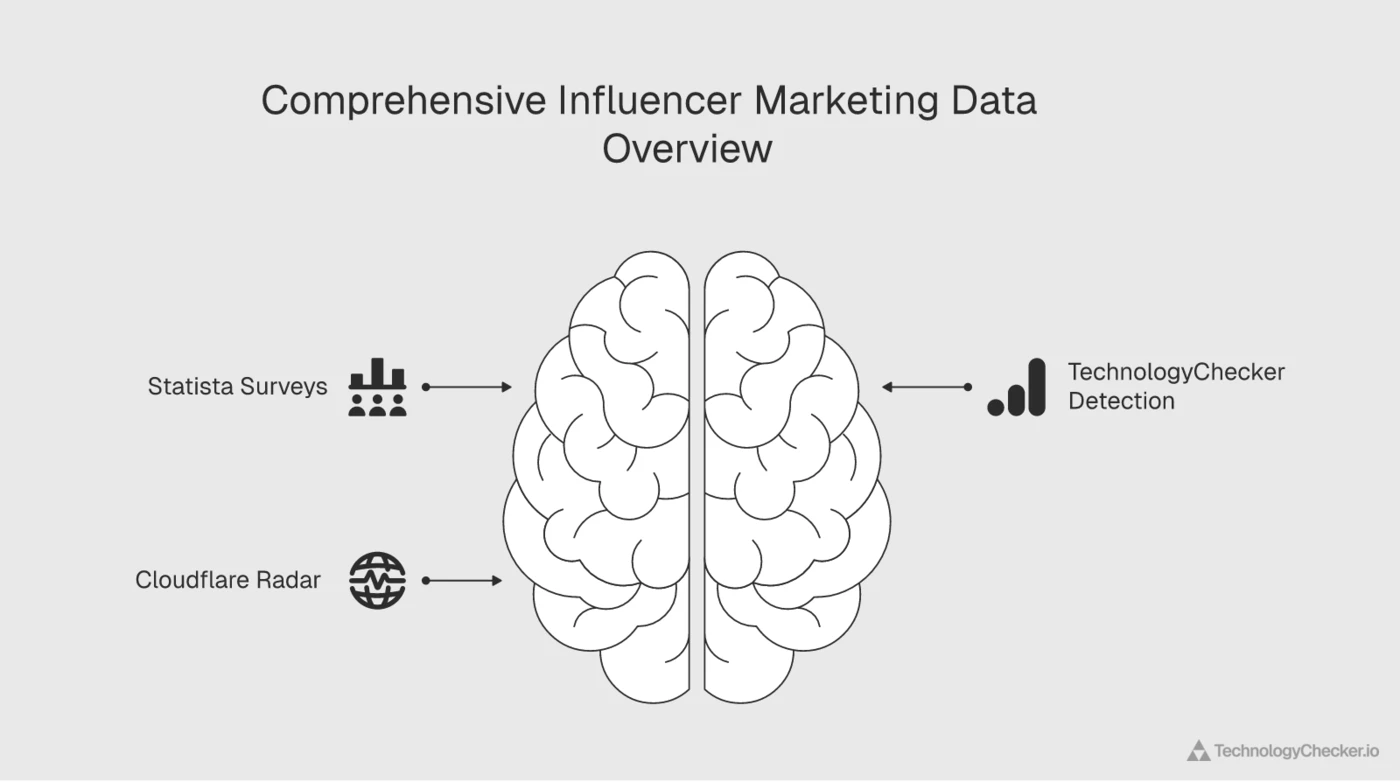
Most figures below come from a Statista Influencer marketing worldwide dossier, which aggregates research from primary providers including Influencer Marketing Hub, Brand Finance, Forbes, eMarketer, Ipsos, HypeAuditor, Reuters Institute, and Statista's own Consumer Insights and Market Insights divisions. We rebuilt the data as first-party interactive charts and reference tables, each citing its original source. Two sections go further and add live, first-party data we hold ourselves: our detection crawl of which tracking pixels run on the open web, and Cloudflare Radar's real-time platform traffic ranking. You can browse every visual in our interactive charts library.
How big is the influencer marketing industry in 2026?
The influencer marketing industry was worth an estimated $32.55 billion in 2025, according to Influencer Marketing Hub, and the highest 2026 forecast reaches $40.51 billion (Mordor Intelligence, January 2026). Both count brand spending on influencer marketing. The wider creator economy is a different, larger measure that Goldman Sachs Research sized at $250 billion in 2023.
| Estimate | What it counts | Value | Source, date |
|---|---|---|---|
| Influencer marketing market, 2025 | Brand spending on influencer marketing | $32.55B | Influencer Marketing Hub, via Statista, 2025 |
| Influencer marketing market, 2025 and 2026 | Same scope, different model | $31.07B, then $40.51B | Mordor Intelligence, updated 27 Jan 2026 |
| Influencer marketing platforms, 2026 | Software and tooling only | $26.5B | HypeAuditor, via Statista |
| Creator economy, 2023 and 2027 | Influencer marketing plus platform payouts and other creator income | $250B, then $480B | Goldman Sachs Research, 19 Apr 2023 |
The spread is a scope question, not a disagreement. The two influencer-marketing models land within $1.5 billion of each other for 2025, and they part ways on 2026 only because Mordor Intelligence models a steeper year. Anyone quoting a figure above $100 billion for "influencer marketing" is quoting the creator economy.
The influencer marketing market reached an estimated $32.55 billion in 2025 and has more than tripled since 2020. Growth has been continuous every year since 2015, when the market was worth just $1.7 billion, and the steepest acceleration arrived after the pandemic pushed brands toward creator-led content.
Influencer Marketing Market Size 2015-2025: $1.7B to $32.55B
The global influencer marketing market grew from $1.7 billion in 2015 to an estimated $32.55 billion in 2025, more than tripling since 2020. The market has expanded almost 20-fold over the decade, with the steepest acceleration coming after 2020.
Source: Influencer Marketing Hub · 2015-2025
| Year | Market size (USD billions) |
|---|---|
| 2015 | $1.7B |
| 2016 | $2.3B |
| 2017 | $3B |
| 2018 | $4.6B |
| 2019 | $6.5B |
| 2020 | $9.7B |
| 2021 | $13.8B |
| 2022 | $16.4B |
| 2023 | $21.1B |
| 2024 | $24B |
| 2025 | $32.55B |
- $32.55 billion estimated market size in 2025, a record high
- More than 3x growth since 2020 ($9.7B)
- Nearly 20x larger than the 2015 market of $1.7B
What stands out is the pace. The market roughly doubled between 2020 and 2022, then added another $16 billion in the three years that followed. A separate forecast of the influencer marketing platform segment, the software and tooling layer beneath the campaigns, put that slice at $26.5 billion in 2026 and on track to pass $31 billion by 2027, an annual growth rate near 20% (HypeAuditor).
As the money grew, so did the number of businesses chasing it. The count of influencer marketing agencies and platforms worldwide rose from about 190 in 2015 to a forecast 6,939 in 2025.
Influencer Marketing Companies Worldwide: 190 to 6,939 (2015-2025)
The number of influencer marketing companies worldwide rose from roughly 190 in 2015 to a forecast 6,939 in 2025, a 19 percent increase over 2024 alone. The count of specialist agencies and platforms has grown more than 36-fold in a decade, reflecting how the discipline matured into its own industry.
Source: Influencer Marketing Hub · 2015-2025
| Year | Number of companies |
|---|---|
| 2015 | 190 |
| 2016 | 335 |
| 2017 | 420 |
| 2018 | 740 |
| 2019 | 1120 |
| 2020 | 1120 |
| 2021 | 1691 |
| 2022 | 2553 |
| 2023 | 3854 |
| 2024 | 5818 |
| 2025 | 6939 |
- 6,939 influencer marketing companies forecast for 2025
- Up 19% on 2024's 5,818 companies
- 36x more agencies and platforms than in 2015 (190)
That is a 36-fold increase in a decade, and a 19% jump over 2024 alone. When a category supports nearly 7,000 specialist vendors, it has stopped being a tactic and become its own industry, with its own tooling, talent, and consolidation pressure, part of the wider marketing technology stack brands now assemble.
What will marketers focus on in 2026?
Asked to name their single biggest influencer marketing focus for 2026, marketers put AI creator matching first at 26.89%, ahead of social commerce (19.33%) and AI content generation (12.04%). Two of the top three priorities are AI-driven, which tells you where budgets and product roadmaps are heading.
| 2026 influencer marketing focus | Share of marketers |
|---|---|
| AI creator matching | 26.89% |
| Social commerce | 19.33% |
| AI content generation | 12.04% |
| Creator licensing / spark ads | 7.56% |
| Long-term creator partnerships | 6.44% |
| Live shopping | 5.6% |
| New platform growth or shifts | 5.6% |
| Improved measurement & attribution | 4.76% |
| UGC for performance ads | 4.76% |
| Other | 7% |
Source: Influencer Marketing Hub, 2026 marketer survey.
The pattern here matters more than any single number. Discovery and content, the two most time-consuming parts of running a campaign, are exactly where marketers want AI to help. Social commerce ranking second confirms that brands increasingly treat creator content as a direct sales channel, not just an awareness play.
Q3 2026 analysis: what changed from July to September
Three things moved this quarter, and one did not. Brands kept planning bigger budgets: in Influencer Marketing Hub's 2026 benchmark (600+ respondents, published 4 May 2026), 87.49% expect their influencer budget to increase and 72.22% expect it to rise by 50% or more. Meta's second-quarter results on 29 July showed the demand behind that intent, with ad impressions up 14% and the average price per ad up 12% year over year. And the creator-commerce plumbing kept spreading on the open web.
| Signal | Q3 2025 | Q2 2026 | Q3 2026 |
|---|---|---|---|
| Social platform traffic, top three (Cloudflare Radar, quarter-end) | Facebook, Instagram, TikTok | Facebook, Instagram, TikTok | Facebook, Instagram, TikTok to 21 Sep; Facebook, TikTok, Instagram from 25 Sep (provisional) |
| TikTok Pixel, live websites (TechnologyChecker crawl) | not tracked on this basis | 390,736 (August) | 402,515 (September) |
| Upfluence, live websites | not tracked on this basis | 25,397 (August) | 25,520 (September) |
| Brands expecting a bigger influencer budget | n/a | 87.49% (IMH, May 2026) | 87.49% (no newer edition) |
I don't read TikTok's late-September jump past Instagram as a shift in where audiences went. It arrived in a single day, on the same dates as a sitewide step in Cloudflare's bot classification, and every earlier sample date this year put Instagram second. If it holds through October, it is the headline of the next edition. What I do read as real is the commerce layer: TikTok's pixel added about 3% of sites from August to September, roughly in line with our crawl's own growth, and it now sits on 402,515 websites. Specialist influencer software, by contrast, is flat: Upfluence moved from 25,397 to 25,520 sites. Brands keep paying creators through the platforms, not through the tools around them.
Where creator commerce concentrates
Matching the websites that run these tags to company records shows the same skew every month: creator-driven commerce is a fashion and retail habit. The share of TikTok Pixel sites in retail apparel and fashion is 7.2 times that industry's share of the web we crawl, and for Klaviyo, the email platform most Shopify-style stores pair with creator campaigns, it is 12.6 times.
| Tag | Matched company sites | Most over-indexed industries (share vs the web we crawl) |
|---|---|---|
| TikTok Pixel | 128,573 | Retail Apparel and Fashion 5.66% (7.2x) · Retail 11.55% (2.9x) · Food and Beverage Services 2.27% (2.6x) |
| Klaviyo | 145,656 | Retail Apparel and Fashion 9.89% (12.6x) · Food and Beverage Services 4.09% (4.7x) · Retail 14.94% (3.8x) |
| Facebook Pixel | 1,485,126 | Retail Apparel and Fashion 2.33% (3.0x) · Retail 7.04% (1.8x) · Wellness and Fitness 2.76% (1.7x) |
2026 month by month: the social traffic top three
| Month-end (Cloudflare Radar, Social Media) | #1 | #2 | #3 | Snapchat |
|---|---|---|---|---|
| September 2025 | TikTok | #4 | ||
| January 2026 | TikTok | #4 | ||
| February 2026 | TikTok | #4 | ||
| March 2026 | TikTok | #4 | ||
| April 2026 | TikTok | #4 | ||
| May 2026 | TikTok | #4 | ||
| June 2026 | TikTok | #4 | ||
| July 2026 | TikTok | #4 | ||
| August 2026 | TikTok | #4 | ||
| 21 September 2026 | TikTok | #4 | ||
| 30 September 2026 (provisional) | TikTok | #7 |
Source: Cloudflare Radar, ranking/internet_services/top?serviceCategory=Social Media, month-end dates, re-queried 1 October 2026. The full ten-platform ranking by month is in our social media advertising report.
Does influencer marketing actually change buying behavior?
Yes, though the effect varies sharply by market. In a 2025 survey across 32 countries, 54% of consumers in the Philippines said they had bought a product because of a celebrity or influencer ad, the highest share measured. Emerging economies in Asia and Latin America led the ranking, while mature Western markets sat well below.
Who Buys From Influencer Ads? Top Countries 2025 (Philippines 54%)
When asked whether they had purchased a product because of a celebrity or influencer advertisement, 54 percent of consumers in the Philippines said yes, the highest of 32 countries surveyed. Indonesia (52 percent) and Brazil (49 percent) followed, while mature Western markets sat far lower, underscoring how emerging economies in Asia and Latin America lead influencer-driven commerce.
Source: Statista Consumer Insights · 2025
| Country | Share of respondents |
|---|---|
| Philippines | 54% |
| Indonesia | 52% |
| Brazil | 49% |
| United Arab Emirates | 46% |
| Vietnam | 46% |
| South Africa | 45% |
| Malaysia | 43% |
| India | 42% |
| Saudi Arabia | 38% |
| China (Mainland) | 37% |
| Colombia | 34% |
| Mexico | 34% |
| South Korea | 34% |
- 54% of consumers in the Philippines buy because of influencer or celebrity ads
- Asian and Latin American markets dominate the top of the ranking
- Indonesia (52%) and Brazil (49%) round out the top three
Indonesia (52%) and Brazil (49%) followed the Philippines, and every market in the top ten was in Asia, Latin America, the Middle East, or Africa. For brands, the takeaway is geographic: influencer-driven commerce delivers its strongest direct response where mobile-first social shopping is the norm.
In the United States, the influence is real but narrower. A February 2026 survey found 31% of U.S. adults had tried a new restaurant or food because of an online creator, and 29% had bought a product.
| Action taken because of an online creator (U.S., 2026) | Share of adults |
|---|---|
| Tried a new restaurant or food | 31% |
| Purchased a product | 29% |
| Tried a new routine | 19% |
| Booked a travel experience | 15% |
| Attended an event | 14% |
| None of the above | 45% |
Source: Statista Consumer Insights, February 2026 survey of U.S. adults (multiple responses allowed).
The honest counterpoint sits in the same data: 45% of U.S. adults said they had taken none of the listed actions. Creator influence moves a meaningful minority to act, especially on food and product trials, but it is not yet a universal force in American consumer behavior. Younger audiences skew higher, as our Gen Z social media statistics show.
Which regions are growing fastest?
Influencer marketing is global, but the growth curves differ by region. Audience engagement is highest across Asia-Pacific, where 42.9% of social media users in the Philippines follow influencers or experts, against just 14.4% in Japan.
Who Follows Influencers in Asia-Pacific 2025: Philippines Tops at 42.9%
In the second quarter of 2025, 42.9 percent of social media users in the Philippines said they follow influencers or experts, the highest in Asia-Pacific. Thailand (32.9 percent) and Malaysia (32.3 percent) followed, while Japan ranked lowest at 14.4 percent, a roughly threefold gap between the most and least influencer-engaged markets in the region.
Source: DataReportal & We Are Social · 2025
| Country / territory | Share of social media users |
|---|---|
| Philippines | 42.9% |
| Thailand | 32.9% |
| Malaysia | 32.3% |
| Indonesia | 31.7% |
| New Zealand | 28.4% |
| Australia | 25% |
| India | 24.3% |
| Singapore | 22.8% |
| South Korea | 22.1% |
| Vietnam | 21.5% |
| Hong Kong | 21.2% |
| Taiwan | 16.3% |
| China | 15.8% |
| Japan | 14.4% |
- 42.9% of social media users in the Philippines follow influencers
- Japan ranks lowest at 14.4%, a ~3x gap across the region
- Southeast Asian markets cluster at the top of the ranking
The roughly threefold gap between the most and least influencer-engaged APAC markets is a useful planning signal. The United States, meanwhile, remains the largest single spending market, with creator sponsored-content revenue projected to reach $12.17 billion in 2026.
U.S. Influencer Marketing Spend 2021-2027: $5.1B to $13.7B
U.S. creators' revenues from sponsored content were projected to climb from $5.12 billion in 2021 to $13.74 billion by 2027. Spending reached an estimated $12.17 billion in 2026, more than double the 2022 figure, a steady doubling of the U.S. influencer economy across the period.
Source: eMarketer · 2021-2027
| Year | Spending (USD billions) |
|---|---|
| 2021 | $5.12B |
| 2022 | $5.97B |
| 2023 | $7.39B |
| 2024 | $9.15B |
| 2025 | $10.52B |
| 2026 | $12.17B |
| 2027 | $13.74B |
- $12.17 billion projected U.S. influencer spend in 2026
- More than double the 2022 level of $5.97B
- On track for $13.74B by 2027
U.S. spending has roughly doubled since 2022 and is forecast to hit $13.74 billion by 2027. Other regional markets are smaller but climbing steadily, as the modeled advertising forecasts below show.
| Market | 2024 ad spend | 2030 forecast | Trend |
|---|---|---|---|
| United States (sponsored content) | $9.15B | $13.74B (2027) | Doubling since 2022 (eMarketer) |
| Latin America & Caribbean | ~$1.25B | $2.8B+ | +17.4% in 2026 alone (Statista Market Insights) |
| Brazil | $458M | $806M | Continuous annual rise (Statista Market Insights) |
| Canada | $579M | $1.05B | Up $474M from 2024 (Statista Market Insights) |
Europe shows a different signal: spending intent rather than raw size. In an October 2025 survey across Western Europe, 74% of decision-makers said their company or biggest client planned to increase influencer budgets over the following 12 months, and in the UK, 17% planned to raise spend by 50% or more (Kolsquare). European brands also apply stricter partnering conditions than most regions, as the table below shows.
| Ethical condition applied to influencers (Western Europe, 2025) | France | Germany | UK |
|---|---|---|---|
| Must follow all advertising regulations | 76% | 60% | 70% |
| Clear disclosure of sponsored posts | 65% | 57% | 64% |
| Does not promote sensitive products (alcohol, tobacco) | 72% | 61% | 57% |
| Does not display minors for commercial purposes | 43% | 54% | 32% |
Source: Kolsquare, survey of 613 decision-makers across Western Europe, September to October 2025.
How do marketers run and measure campaigns?
Marketers are split on what success even means. In 2025, engagement or clicks was the leading way to measure influencer campaign success (25.8%), barely ahead of content type or category (25.1%), with hard sales ranking last among the four main metrics.
| How marketers measure campaign success (2025) | Share of marketers |
|---|---|
| Engagement or clicks | 25.8% |
| Content type / category | 25.1% |
| Views / reach | 21.8% |
| Sales | 20.7% |
Source: Influencer Marketing Hub, 2025 marketer survey.
The fact that sales (20.7%) sits below three engagement-style measures explains the industry's persistent attribution problem: most teams still measure what is easy to see rather than what drives revenue. That gap is exactly why "improved measurement and attribution" appears as a named 2026 priority in the focus-area data above.
When it comes to choosing creators, reach still wins. On TikTok, 67.3% of marketers named follower count as their main selection criterion, dwarfing engagement rates (14.1%) and brand alignment (8.1%).
How Marketers Pick TikTok Influencers 2025: 67% Choose by Follower Count
Roughly 67.3 percent of marketers worldwide named follower count as the main criterion for selecting TikTok influencers in 2025, dwarfing engagement rates (14.1 percent), content style (11.1 percent), and brand alignment (8.1 percent). Reach still trumps quality signals when brands choose TikTok partners, despite ongoing industry warnings about vanity metrics.
Source: Influencer Marketing Hub · 2025
| Selection criterion | Share of respondents |
|---|---|
| Follower count | 67.3% |
| Engagement rates | 14.1% |
| Content style | 11.1% |
| Brand alignment | 8.1% |
- 67.3% of marketers pick TikTok creators mainly by follower count
- Engagement rate is a distant second at 14.1%
- Brand alignment ranks last at just 8.1%
This is the vanity-metric trap in one chart. Despite years of guidance that engagement quality beats raw audience size, most marketers still pick TikTok partners by the biggest number on the profile. Other marketer-side data points fill in the operational picture:
- Budget allocation: 14.4% of marketers put 10-15% of their total marketing budget into influencer marketing in 2025, and nearly 12% devoted more than half (Influencer Marketing Hub).
- TikTok monetization: 58.2% of marketers said the biggest challenge to monetizing TikTok content was difficulty driving traffic to TikTok Shop (Influencer Marketing Hub).
- Holiday goals: among fashion, lifestyle, and beauty professionals, 75% said increasing sales was their main objective for influencer collaborations, ahead of growing brand awareness (67%) (Launchmetrics).
- Publisher response: 76% of news publishers plan to make their journalists act more like creators, and 70% are concerned that creators take audience time and attention away from traditional media (Reuters Institute). Some publishers already run newsletters on creator platforms: in our September 2026 crawl the Manila Bulletin's The Morning Bulletin is one of the 2,374 newsletters beehiiv hosts on an owner's domain, per our list of who uses beehiiv, and i-D and Boing Boing publish premium or members' editions from two of the 5,541 custom domains behind our list of companies that use Substack.
What is the ROI of influencer marketing?
There is no single agreed ROI figure for influencer marketing, and any source that hands you one precise number is smoothing over a messy reality. Widely cited industry benchmarks put the return somewhere between $5.20 and $6.50 for every $1 spent (Influencer Marketing Hub), but these come from vendor surveys with different methods, samples, and definitions of "return," so treat them as directional rather than exact.
What the data agrees on is that trust drives the result. Around 69 to 70% of consumers say they trust influencer recommendations (LCCA), and the country-level purchase behavior above backs that up. The harder 2026 question is not whether influencer marketing works, but how to measure it, which is why "improved measurement and attribution" keeps surfacing as a marketer priority.
Influencer tier shapes returns more than raw reach does. Smaller creators consistently post higher engagement at lower cost:
| Influencer tier | Typical engagement rate | Reach vs cost trade-off |
|---|---|---|
| Nano (1K-10K followers) | 4-8% | Highest engagement, smallest reach |
| Micro (10K-100K) | 2-4% | ~3.2x the engagement of macro tiers at lower cost |
| Macro / celebrity (1M+) | Under 1% | Widest reach, lowest engagement per follower |
Sources: Influee, Digital Applied. That gap explains why a reported 80% of creator budgets now flow to micro and nano creators rather than a handful of celebrities, and why the follower-count-first habit shown earlier leaves ROI on the table. For how creator budgets sit alongside paid social, see our social media advertising trends for 2026.
What do creators earn and how do they work?
The top tier of creators now earns like traditional celebrities. MrBeast led all creators in 2025 with an estimated $85 million, ahead of Dhar Mann ($56 million) and a tie between Jake Paul and Matt Rife at $50 million each.
| Creator | 2025 estimated earnings |
|---|---|
| MrBeast | $85M |
| Dhar Mann | $56M |
| Jake Paul | $50M |
| Matt Rife | $50M |
| Rhett & Link | $36M |
| Ryan Kaji | $35M |
| Alex Cooper | $32M |
| Markiplier | $32M |
| Steven Bartlett | $29M |
| Mark Rober | $25M |
| Charli D'Amelio | $23.5M |
| Ms. Rachel | $23M |
Source: Forbes, 2025 estimated annual creator earnings.
Every creator in the top twelve cleared $23 million, a concentration of earnings at the very top that mirrors music and film. Below that headline tier, the economics look very different. Most creators publish modest volumes of sponsored content and work long hours to do it, as the survey data below shows.
| Creator economics (worldwide, 2025) | Finding |
|---|---|
| Time on content | 26.8% spend 10-20 hours a week creating; 21.3% spend more than 40 hours (NeoReach) |
| Sponsored posts | 53.1% published 0-10 sponsored pieces; only 6.4% published more than 50 (NeoReach) |
| Success measure | 31.4% judge a post by likes, 27.4% by comments, 20% by shares (NeoReach) |
Platform revenue splits also shape where creators choose to publish. Live-streaming platform Kick offered the highest creator revenue share at 95%, while YouTube's Partner Program short-feed ads sat at the bottom at 45% (Rumble, Twitch, TikTok, Google, DLive). For full-time creators, that spread is the difference between a viable business and a side project. Creators who sell their own courses and coaching publish on a different kind of platform: our September 2026 crawl finds 15,670 sites hosted on Kajabi, and 88.76% of the matched Kajabi customers employ 1 to 10 people. Photographers and coaches who build an email list show up on Flodesk: the same crawl finds a Flodesk sign-up form or pop-up on 24,299 websites, and Photography and Professional Training and Coaching tie as the top industries among Flodesk customers, at 6.31% each. An older list tool has the same lead industry: the same crawl finds an AWeber form or tracking tag on 7,494 websites, and Professional Training and Coaching tops the industries of companies that use AWeber, at 8.26%.
Which platforms lead influencer marketing?
TikTok has become the center of gravity. Its brand value reached $153.54 billion in 2026, an eightfold increase since 2021 and enough to rank ByteDance's app as the second most valuable unicorn worldwide.
TikTok/Douyin Brand Value 2021-2026: $18.75B to $153.54B
TikTok/Douyin's brand value rose from $18.75 billion in 2021 to $153.54 billion in 2026, an eightfold increase in five years. ByteDance's short-video app surpassed Instagram and WhatsApp as the most downloaded mobile app and ranked as the second most valuable unicorn worldwide as of late 2025, with a market cap near $490 billion.
Source: Brand Finance · 2021-2026
| Year | Brand value (USD billions) |
|---|---|
| 2021 | $18.75B |
| 2022 | $58.98B |
| 2023 | $65.7B |
| 2024 | $84.2B |
| 2025 | $105.79B |
| 2026 | $153.54B |
- $153.54 billion brand value in 2026, an 8x rise since 2021
- Crossed $100B for the first time in 2025 ($105.79B)
- Second most valuable unicorn worldwide as of late 2025
The platform's pull shows up in audience size too. As of March 2026, Khaby Lame was the most-followed TikTok creator at 160.4 million, just ahead of Charli D'Amelio (155.8 million).
Most-Followed TikTok Creators 2026: Khaby Lame Leads at 160.4M
As of March 2026, Italy-based comedian Khabane (Khaby) Lame was the most-followed creator on TikTok with 160.4 million followers, narrowly ahead of Charli D'Amelio (155.8 million). MrBeast ranked third among individual creators with 124.6 million, showing how the platform's biggest names now rival the audiences of major broadcasters.
Source: Social Blade · 2026
| Creator | Followers (millions) |
|---|---|
| Khaby Lame | 160.4M |
| Charli D'Amelio | 155.8M |
| MrBeast | 124.6M |
| TikTok | 92.8M |
| Bella Poarch | 92.7M |
| Addison Rae | 88.3M |
| Zach King | 84.3M |
| Willie Salim | 83.9M |
| Kimberly Loaiza | 83.7M |
| The Rock | 79.8M |
- Khaby Lame leads TikTok with 160.4 million followers
- Charli D'Amelio is a close second at 155.8 million
- MrBeast tops individual creators behind them with 124.6 million
TikTok is also where brands earn the most organic creator mentions. Shein led all brands in 2025 with 20,600 influencers talking about it, and beauty names filled seven of the top ten spots. Shein's pull here echoes its rise across online marketplaces.
| Brand | Influencers mentioning it on TikTok (2025) |
|---|---|
| Shein | 20,600 |
| Sephora | 13,400 |
| Rare Beauty | 11,800 |
| e.l.f. Cosmetics | 11,000 |
| Maybelline | 11,000 |
| L'Oréal Paris | 11,000 |
| Fenty Beauty | 10,600 |
| MAC Cosmetics | 9,400 |
| YSL Beauty | 9,200 |
| Walmart | 9,100 |
Source: HypeAuditor, 2025 (number of influencers mentioning each brand on TikTok).
TikTok is not the only platform that matters, though. Instagram and YouTube remain enormous, and their brand values and reach are climbing in parallel.
| Platform metric (2025-2026) | Value |
|---|---|
| Instagram brand value (2026) | $80.8B (Brand Finance) |
| Largest Instagram audience (India, 2025) | 480.55M users (DataReportal) |
| Top Instagram brand by influencer mentions | Zara, 49,900 influencers (HypeAuditor) |
| YouTube brand value (2026) | $38.39B (Brand Finance) |
| YouTube global ad revenue (2025) | $40.37B (Alphabet) |
How is AI changing influencer marketing?
AI has moved from novelty to default tooling. In a March 2026 study, creator discovery was the leading AI use case at 36.67%, followed by content generation (21.11%), and only 10.56% of marketers said they used no AI at all.
| AI use case in influencer marketing (2026) | Share of marketers |
|---|---|
| Creator discovery | 36.67% |
| Content generation | 21.11% |
| Brief development | 13.89% |
| Reporting | 10.56% |
| Not using AI | 10.56% |
| Fraud detection | 7.22% |
Source: Influencer Marketing Hub, March 2026 study.
The results, by marketers' own accounts, are positive but not dramatic. Across a 2025 study, 36.6% said AI somewhat improved their influencer marketing outcomes and 29.8% said it significantly improved them, against just over 6% who reported any worsening (Influencer Marketing Hub). The underlying tooling and creator sentiment break down as follows:
- Top AI purpose: 49% of marketers use AI tools for natural language processing, ahead of machine learning (28.7%) and deepfake technology (24.3%) (Influencer Marketing Hub).
- Most-wanted improvement: 41.3% of marketers want better predictive analytics from their AI tools (Influencer Marketing Hub).
- Creator view: 43% of creators say AI helps streamline their workflow, but 33% worry it will replace human creativity (URLgenius).
That last tension, a tool that helps day to day while raising longer-term anxiety, is the honest state of AI in the creator economy right now. It mirrors the broader pattern we tracked in AI adoption across marketing.

Is B2B influencer marketing a real channel?
It is, and it is bigger than most people assume. As of April 2025, 55% of B2B marketers already used influencer marketing, and another 29% planned to adopt it within a year. Much of that activity runs on LinkedIn, where thought-leader content has become a core B2B format.
The selection logic, though, is the opposite of the consumer playbook. Where B2C marketers pick TikTok creators by follower count, B2B teams lead with authenticity and credibility (58%), then industry relevance (49%) and subject-matter expertise (47%).
| B2B creator selection criterion | Share of B2B marketers |
|---|---|
| Authenticity & credibility | 58% |
| Industry relevance | 49% |
| Brand alignment | 47% |
| Subject-matter expertise | 47% |
| Audience engagement | 45% |
Source: Ipsos, 2025 B2B marketer survey.
The most effective B2B creator types reinforce this: 28% of B2B marketers named thought leaders and industry analysts as their most effective influencer type, ahead of company customers (23%) and independent creators (20%) (Ipsos). In B2B, trust and expertise outrank reach, because the buying decision is slower, higher-stakes, and made by committee. For software brands tracking which tools their market actually runs, that credibility signal is the whole game, and it is why technographic data and creator credibility increasingly travel together.
How widely is creator-commerce infrastructure deployed?
Most influencer marketing statistics come from surveys. This one comes from the open web itself. In our September 2026 crawl, TechnologyChecker detects TikTok's conversion-tracking pixel on 402,515 websites and Meta's Facebook Pixel on 3,602,180, against 29.9M live business domains we crawl. The first edition of this section, kept below as published, used our June 2026 crawl.
⚠️ The June figures in the next paragraph, chart and callout are preserved as originally published. Counts are not a like-for-like series over time: the set of domains we crawl turns over every month, with dead sites dropping out and newly discovered ones added, and our detection signals widen over time. The Instagram content figure (31,886) also used an earlier detection rule than our current Instagram account-link count (36,805 in September), so the two are not comparable.
TechnologyChecker's June 2026 detection crawl finds TikTok's conversion-tracking pixel live on 240,694 websites and its video embed on another 211,605, the second-largest creator-commerce footprint online after Meta's Facebook Pixel, which sits on 2.06 million sites (see the full social ad pixel breakdown).
Creator Commerce Infrastructure on Live Websites (June 2026)
TechnologyChecker's detection crawl of the open web finds TikTok's conversion-tracking pixel installed on 240,694 active websites in June 2026, with its video embed on a further 211,605 sites - the second-largest creator-commerce footprint after Meta's Facebook Pixel (2.06 million sites, tracked separately). Pinterest's conversion tag reaches 131,470 sites, while Snap Pixel and Instagram's embed each sit near 32,000-34,000. The pattern shows that the real plumbing of influencer marketing is the platforms' own pixels and embeds, not third-party influencer-marketing software, which we detect on fewer than 300 sites apiece.
Source: TechnologyChecker detection data · 2026
| Platform tracking pixel or embed | Live websites detected |
|---|---|
| TikTok Conversion Pixel | 240694 |
| TikTok Embed | 211605 |
| Pinterest Conversion Tag | 131470 |
| Snap Pixel | 34277 |
| Instagram Embed | 31886 |
- TikTok's conversion pixel (240,694 sites) and embed (211,605 sites) form the second-largest creator-commerce footprint after Meta
- Brands embed TikTok video on 6.6x more sites than Instagram content (211,605 vs 31,886)
- Dedicated influencer-marketing platforms (CreatorIQ, TapInfluence, Find Your Influence) each sit on under 100 live sites
Two findings stand out. Brands embed TikTok video on 6.6 times more sites than Instagram content (211,605 versus 31,886), a concrete signal of where creator media travels once it leaves the platform. And the dedicated influencer-marketing software the industry talks about most, CreatorIQ, TapInfluence, Find Your Influence, and Gatsby, is barely deployed: we detect each on fewer than 100 live websites, with link-in-bio tool Linktree on just 3,240. The real plumbing of influencer marketing is the platforms' own pixels and embeds, not the third-party tools sold around them.
That reframes the spend data above. TikTok's brand value reached $153.54 billion and its pixel now sits on a quarter-million sites, while specialist platforms stay in the low hundreds. The value is accruing to the platforms, not the tooling layer. These counts come from our detection of live websites running each tag in June 2026, and they measure conversion and embed infrastructure rather than organic platform reach.
Which social platforms command the most real-world traffic?
Survey data tells you what marketers say. Network data tells you where audiences actually are. Facebook, Instagram and TikTok held the top three slots on every month-end of 2026 through August and on every September sample date to the 21st (see the Q3 2026 analysis above for the late-September change). The quarter-end table below is the first edition's, preserved as published.
As of 30 June 2026, the most-visited social platforms by real internet traffic were Facebook, Instagram, and TikTok, in that order, according to Cloudflare Radar, which ranks internet services by share of global traffic across its network. That top three held through the end of Q2 2026.
| Rank | Social platform | Owner |
|---|---|---|
| 1 | Meta | |
| 2 | Meta | |
| 3 | TikTok | ByteDance |
| 4 | Snapchat | Snap |
| 5 | Microsoft | |
| 6 | X / Twitter | X Corp |
| 7 | ||
| 8 | ||
| 9 | Kwai | Kuaishou |
| 10 | Douyin | ByteDance |
Source: Cloudflare Radar internet services ranking, Social Media category, 30 June 2026.
This independent traffic ranking lines up with our own detection data. Meta owns the top two slots, which matches the Facebook Pixel's 2.06-million-site dominance, and TikTok sits third by traffic while ranking second by creator-commerce infrastructure and first by organic brand mentions (Shein's 20,600 influencers). ByteDance appears twice once you count Douyin, its China-only app, at rank ten. For a planner, the signal is simple: audience attention and creator-commerce plumbing both concentrate in the same three companies, so diversifying beyond them is a deliberate reach play, not a default.
How to apply these statistics
Numbers only matter if they change a decision. Here is how to turn the 2026 data above into action:
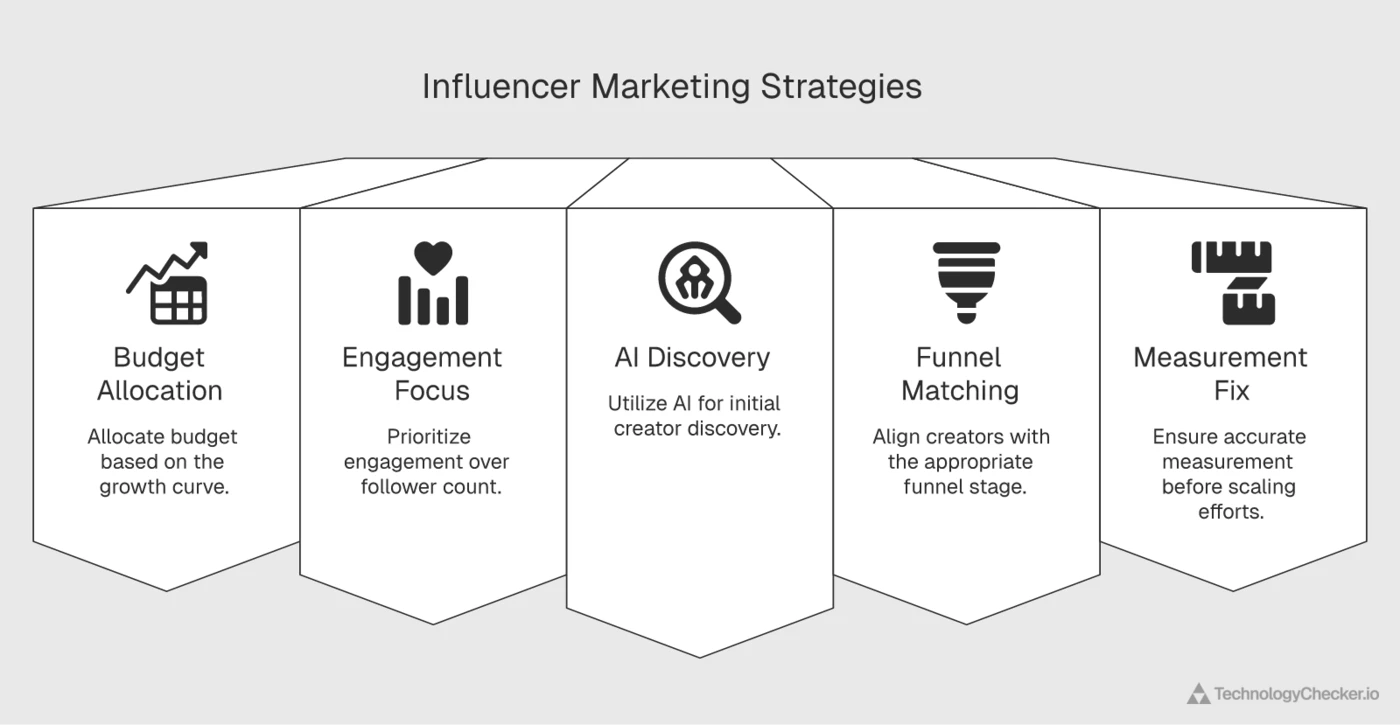
- Budget against the growth curve, not last year. With the market at $32.55 billion and U.S. spend on track for $12.17 billion, a flat influencer budget is a real-terms cut. Benchmark your allocation against the 10-15% of total marketing spend that the largest marketer group now commits.
- Stop selecting on follower count. Since 67.3% of marketers still pick TikTok creators by reach while nano and micro tiers deliver 4-8% engagement, an engagement-weighted shortlist is an easy, underused edge.
- Put AI on discovery first. Creator discovery is the No.1 AI use case (36.67%) because it removes the most manual hours. Start there before content generation, where brand-voice risk is higher.
- Match the playbook to the funnel. Use macro creators and TikTok for reach, micro and nano creators for conversion, and for B2B, lead with authenticity and subject-matter expertise (58%) over audience size.
- Fix measurement before you scale. Sales rank last (20.7%) among the metrics marketers track. Define a revenue-linked KPI now so the next budget conversation rests on outcomes, not impressions.
Frequently asked questions
How big is the influencer marketing industry in 2026? The global influencer marketing market reached an estimated $32.55 billion in 2025 (Influencer Marketing Hub), and the highest 2026 forecast is $40.51 billion (Mordor Intelligence, January 2026). The software and tooling layer alone was forecast at $26.5 billion in 2026. The far larger creator economy, which Goldman Sachs Research put on course for $480 billion by 2027, is a different measure.
Is influencer marketing still growing in 2026? Yes, on brands' own plans. In Influencer Marketing Hub's 2026 benchmark (600+ respondents, May 2026), 87.49% expect their influencer budget to increase and only 5.55% expect a decrease. On the open web, TikTok's conversion pixel added about 3% of sites between our August and September 2026 crawls, in line with the crawl itself.
How many brands use influencer marketing? No census counts them directly. The closest observable proxy is the conversion tags brands install: TechnologyChecker detects TikTok's pixel on 402,515 websites and Meta's on 3,602,180 in its September 2026 crawl. Survey data puts B2B adoption at 55%, with 29% more planning to start (Ipsos).
What is the ROI of influencer marketing? Widely cited benchmarks range from about $5.20 to $6.50 returned per $1 spent, but methodologies differ, so treat these as directional. Returns track trust (roughly 70% of consumers trust influencer recommendations) and tier, with nano and micro creators delivering higher engagement per dollar than celebrities.
Which platform is best for influencer marketing in 2026? TikTok is the center of gravity, with a $153.54 billion brand value and the most organic brand mentions, but Instagram ($80.8B brand value, 480M+ users in India alone) and YouTube ($40.37B in 2025 ad revenue) remain essential. The right mix depends on whether your goal is reach or conversion.
Is influencer marketing effective for B2B? Yes. As of 2025, 55% of B2B marketers already use it and 29% more plan to start. B2B teams select creators on authenticity and credibility (58%) and rate thought leaders and industry analysts (28%) their most effective influencer type.
How is AI changing influencer marketing? AI is now the default tooling layer: 36.67% of marketers use it for creator discovery, 21.11% for content generation, and only 10.56% use no AI at all. Most report it has improved their outcomes, though a third of creators worry it will replace human creativity.
Which social platform has the widest tracking-pixel footprint? Meta's Facebook Pixel leads by a wide margin, detected on 3,602,180 live websites in TechnologyChecker's September 2026 crawl. TikTok is second, with its conversion pixel on 402,515 sites. In our June 2026 crawl, dedicated influencer-marketing platforms such as CreatorIQ each sat on fewer than 100 sites; Upfluence, the largest we track, is on 25,520 in September.
Methodology and sources
The statistics in this article are drawn from a Statista Influencer marketing worldwide dossier (study ID 28362), which compiles 50-plus charts across market sizing, regional breakdowns, marketer and creator surveys, platform metrics, AI adoption, and B2B usage. Statista aggregates this data from primary providers; we have credited the original source for every figure rather than the aggregator.
Primary sources referenced include Influencer Marketing Hub, Brand Finance, Forbes, eMarketer, Ipsos, HypeAuditor, NeoReach, Launchmetrics, Kolsquare, the Reuters Institute for the Study of Journalism, Social Blade, Alphabet, DataReportal/We Are Social, and Statista's own Consumer Insights and Market Insights divisions. Survey-based figures carry the scope and sample sizes noted in each chart's source page. Forecast years (2026 and beyond) are modeled estimates, not actuals, and are labeled as such throughout.
Two sections add live, first-party data that does not come from the Statista dossier. The creator-commerce infrastructure figures come from TechnologyChecker's detection crawl of 29.9M live business domains (September 2026 for current figures, June 2026 for the first edition's), which fingerprints the conversion pixels and content embeds running on live websites; these counts measure deployed tracking infrastructure, not organic platform reach. The platform traffic ranking comes from Cloudflare Radar, which ranks internet services by their share of global network traffic; the Q3 2026 edition re-queried every 2026 month-end plus September 2025 on 1 October 2026. Industry comparisons use the subset of crawled sites we can match to a company record. Market-size figures come from Influencer Marketing Hub, Mordor Intelligence and Goldman Sachs Research, each with its own scope (see the table at the top). All are independently dated and sit alongside, not inside, the survey data above.
Every chart on this page is an original, interactive visual built from the underlying data points. Hover any chart to see exact values, or open our full interactive charts library to explore and embed them.
Conclusion
The 2026 picture is of an industry past its experimental phase. A $32.55 billion market served by nearly 7,000 companies, with creators earning eight-figure sums and brand values like TikTok's $153 billion, is not a channel brands are testing. It is infrastructure they are building on.
Three shifts will define the next phase. AI has become the default layer for discovery and content, so the competitive edge moves to measurement and judgment rather than manual sourcing. Influence on actual purchases remains strongest in emerging Asian and Latin American markets, which should reshape where global brands concentrate creator budgets. And B2B's quiet adoption, with 55% already in and credibility outranking reach, shows the model now works far beyond beauty and fashion. The brands that win in 2026 will be the ones that measure creator impact as rigorously as any other line on the marketing budget.
Update history
Added a direct answer to "How big is the influencer marketing industry?" with a table separating influencer marketing ($32.55B in 2025; $40.51B forecast for 2026) from the creator economy ($480B by 2027). Added a Q3 2026 analysis: Influencer Marketing Hub's 2026 budget intent, Meta's Q2 2026 ad pricing, September 2026 crawl figures for TikTok's pixel (402,515) and Upfluence (25,520), an industry over-index table, and a month-by-month 2026 social traffic ranking from Cloudflare Radar. The June 2026 creator-commerce figures (TikTok pixel 240,694, Facebook Pixel 2.06 million) and the 30 June traffic ranking are kept as published, with a note.
Published with Statista dossier figures, June 2026 creator-commerce detection counts and the Cloudflare Radar social traffic ranking for 30 June 2026.
About the author
Elif Arslan is CMO and co-founder of TechnologyChecker, where she leads marketing strategy and brand positioning with a decade of experience in B2B growth, content marketing, and competitive analysis. She works daily with technographic data, mapping which tools companies actually run across the 29.9M live business domains we crawl, and writes about how that intelligence connects to marketing and revenue outcomes. Read more from her on the author page.

CMO & Co-founder
10+ years of experience
Elif is the CMO and co-founder of TechnologyChecker.
- MBA, London Business School
- Google Analytics Certified Professional
- HubSpot Inbound Marketing Certified
Never miss our research