> ## Documentation Index
> Fetch the complete documentation index at: https://technologychecker.io/docs/llms.txt
> Use this file to discover all available pages before exploring further.
# Technologies We Track
> Browse 40,000+ tracked technologies across 50M+ domains. Explore market share charts, adoption trends, growth rates, and category breakdowns with interactive visualizations.
The technologies section lets you explore adoption data across 40,000+ tracked technologies on 50M+ domains. Browse by category, analyze market share, and track historical trends with interactive charts and filtering. TechnologyChecker detects frontend, backend, and standalone platforms using multi-signal fingerprinting for full-stack visibility.
 ## Browse technologies
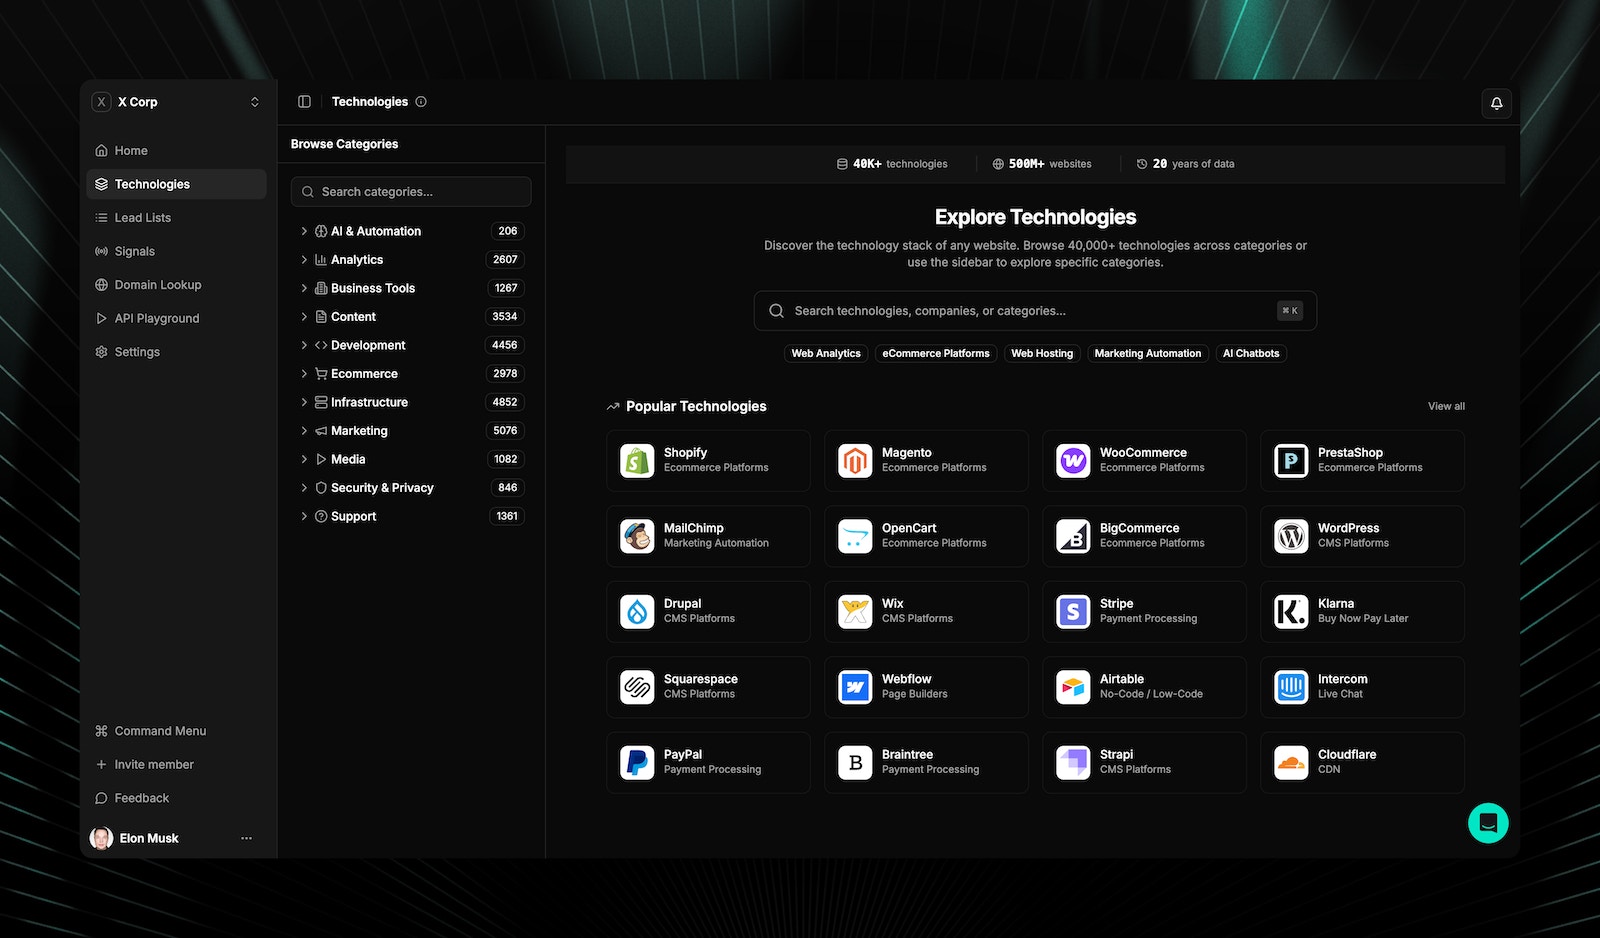
A tree sidebar organizes all technologies into expandable category groups with real-time search.
Expandable and collapsible groups with instant search across all categories.
Grid of popular technologies with logos and trend badges (up, stable, down).
Directional arrows with percentage change showing adoption momentum.
Number of websites using each technology, formatted as 1.2M, 546K.
## Category market share
Drill into any category to see market share distribution among technologies.
The donut chart shows the top 8 technologies with the rest grouped as "Other." The center label displays total website count (e.g., "1.1M websites"), and the side legend shows technology names with color indicators and percentages.
A ranked table showing:
| Column | Description |
| ------------ | ------------------------------------- |
| Rank | Position (#1, #2, etc.) |
| Technology | Name (clickable link to detail page) |
| Websites | Tracked count (formatted: 1.1M, 546K) |
| Market share | Visual progress bar with percentage |
Progress bars are scaled relative to the maximum market share in the category.
A horizontal bar chart shows the top 5 biggest movers by absolute change between quarters. Green bars indicate positive growth and red bars indicate negative growth.
A stacked area chart tracks the top 5 technologies by adoption over time with monthly data points.
| Time range | Description |
| ---------- | ------------------------------------- |
| 3 years | Default view with monthly data points |
| 5 years | Medium-term trend analysis |
| 7 years | Long-term adoption patterns |
| 10 years | Full historical perspective |
## Technology detail page
Each technology has a complete profile page.
### Header and stats
* **Header:** Technology logo (80px), name, description, official website link, and category/group badges
* **Active domains:** Count of websites currently using the technology
* **Total domains:** Count of all websites that have ever used it
* **History chart:** Stacked area chart (Active vs Total domains) with time ranges: 1y, 2y, 5y, 10y, All
### Top companies using a technology
The companies table shows all websites using a given technology with filtering:
| Filter | Type | Description |
| -------------- | --------------- | -------------------------------- |
| Search | Text | Search by domain or company name |
| Country | Select | Filter by country |
| City | Select | Filter by city |
| State | Select | Filter by state/province |
| Industry | Select | Filter by LinkedIn industry |
| Employee count | Select | Filter by employee range |
| Company type | Select | Filter by company type |
| Founded year | Range (min/max) | Filter by year range |
Results are paginated at 100 per page. Each domain shows a favicon with a fallback to colored letter initials.
Use the technology detail page to find potential customers — for example, browse [companies using Shopify](https://technologychecker.io/technology/shopify) or [companies and stores using WooCommerce](https://technologychecker.io/technology/woocommerce). Filter by industry, size, and geography to build a targeted list. For larger lists with export capabilities, see [lead lists](/features/lead-lists).
## Related pages
Analyze market share, quarterly growth, and adoption trends.
Scan any website to see its full technology stack.
Search and look up technologies programmatically.
Get stats, trends, and market share data via API.
## Frequently asked questions
TechnologyChecker tracks 40,000+ technologies across 50M+ domains, spanning frontend frameworks, backend infrastructure, standalone SaaS platforms, marketing and sales tools, analytics, payments, HR and operations, project management, customer support, and more. New technologies are added continuously as the detection system identifies them.
Navigate to the technology detail page and use the companies table with filtering by country, industry, employee count, and more. Programmatically, use `GET /v1/technology/name/{name}` to get the technology ID, then `GET /v1/technology/{id}/companies` with your desired filters. See [company data API](/api-reference/introduction#company-data).
Historical adoption trends span up to 20+ years with monthly granularity. You can view 3-year, 5-year, 7-year, and 10-year time ranges on the [market research](/features/market-research) charts or query the full history via `GET /v1/technology/{id}/history`.
## Browse technologies
A tree sidebar organizes all technologies into expandable category groups with real-time search.
Expandable and collapsible groups with instant search across all categories.
Grid of popular technologies with logos and trend badges (up, stable, down).
Directional arrows with percentage change showing adoption momentum.
Number of websites using each technology, formatted as 1.2M, 546K.
## Category market share
Drill into any category to see market share distribution among technologies.
The donut chart shows the top 8 technologies with the rest grouped as "Other." The center label displays total website count (e.g., "1.1M websites"), and the side legend shows technology names with color indicators and percentages.
A ranked table showing:
| Column | Description |
| ------------ | ------------------------------------- |
| Rank | Position (#1, #2, etc.) |
| Technology | Name (clickable link to detail page) |
| Websites | Tracked count (formatted: 1.1M, 546K) |
| Market share | Visual progress bar with percentage |
Progress bars are scaled relative to the maximum market share in the category.
A horizontal bar chart shows the top 5 biggest movers by absolute change between quarters. Green bars indicate positive growth and red bars indicate negative growth.
A stacked area chart tracks the top 5 technologies by adoption over time with monthly data points.
| Time range | Description |
| ---------- | ------------------------------------- |
| 3 years | Default view with monthly data points |
| 5 years | Medium-term trend analysis |
| 7 years | Long-term adoption patterns |
| 10 years | Full historical perspective |
## Technology detail page
Each technology has a complete profile page.
### Header and stats
* **Header:** Technology logo (80px), name, description, official website link, and category/group badges
* **Active domains:** Count of websites currently using the technology
* **Total domains:** Count of all websites that have ever used it
* **History chart:** Stacked area chart (Active vs Total domains) with time ranges: 1y, 2y, 5y, 10y, All
### Top companies using a technology
The companies table shows all websites using a given technology with filtering:
| Filter | Type | Description |
| -------------- | --------------- | -------------------------------- |
| Search | Text | Search by domain or company name |
| Country | Select | Filter by country |
| City | Select | Filter by city |
| State | Select | Filter by state/province |
| Industry | Select | Filter by LinkedIn industry |
| Employee count | Select | Filter by employee range |
| Company type | Select | Filter by company type |
| Founded year | Range (min/max) | Filter by year range |
Results are paginated at 100 per page. Each domain shows a favicon with a fallback to colored letter initials.
Use the technology detail page to find potential customers — for example, browse [companies using Shopify](https://technologychecker.io/technology/shopify) or [companies and stores using WooCommerce](https://technologychecker.io/technology/woocommerce). Filter by industry, size, and geography to build a targeted list. For larger lists with export capabilities, see [lead lists](/features/lead-lists).
## Related pages
Analyze market share, quarterly growth, and adoption trends.
Scan any website to see its full technology stack.
Search and look up technologies programmatically.
Get stats, trends, and market share data via API.
## Frequently asked questions
TechnologyChecker tracks 40,000+ technologies across 50M+ domains, spanning frontend frameworks, backend infrastructure, standalone SaaS platforms, marketing and sales tools, analytics, payments, HR and operations, project management, customer support, and more. New technologies are added continuously as the detection system identifies them.
Navigate to the technology detail page and use the companies table with filtering by country, industry, employee count, and more. Programmatically, use `GET /v1/technology/name/{name}` to get the technology ID, then `GET /v1/technology/{id}/companies` with your desired filters. See [company data API](/api-reference/introduction#company-data).
Historical adoption trends span up to 20+ years with monthly granularity. You can view 3-year, 5-year, 7-year, and 10-year time ranges on the [market research](/features/market-research) charts or query the full history via `GET /v1/technology/{id}/history`.